polish construction companies 2017 – major players, key ... · polish construction companies 2017...
TRANSCRIPT

Polish Construction Companies 2017 – Major Players, Key Growth Drivers and Development Prospects


Introduction 5
Section 1. Analysis of the largest construction companies 7
1.1. Ranking of the largest Polish construction companies by revenue earned in 2016 8
1.2. Ranking of the largest Polish construction companies by operating income achieved in 2016 10
1.3. RankingofthelargestPolishconstructioncompaniesbynetprofitachievedin2016 12
1.4. Debt analysis of the largest construction companies in 2016 15
1.5. Relation of capital expenditure to sales ratio of the largest construction companies in 2016 16
1.6. Geographical and generic structure of revenue earned by the largest construction companies in 2016 18
1.7. Market cap of the largest construction companies listed on the Warsaw Stock Exchange 26
Section 2. Prospects for development of construction companies in Poland 33
2.1. Introduction 34
2.2. Macroeconomic factors: economic growth, public debt 39
2.3. EU funds 41
2.4. Bankruptcies in the construction sector 42
2.5. Employment and remuneration in the construction sector 43
2.6. Development prospects for construction market segments in Poland 45
2.7. Summary 67
Section 3. Profiles of largest construction companies in Poland 69
Bibliography 115
Contact 117
Contents
Polish Construction Companies 2017 | Major Players, Key Growth Drivers and Development Prospects
5
Introduction
Ladies and Gentlemen,
We have the pleasure to present to you thefiftheditionofourannualreport:"Polish Construction Companies 2017 - Key Players, Key Growth Factors and Perspectives for Industry Growth", in which we present the analysis of the condition ofthefifteenlargestPolishconstructioncompanies in terms of revenues and describe the prospects of market development broken down into its key sectors.
As projected, after a period of growth over the years 2014-2015, 2016 saw a decrease in construction and assembly contracts, whichwasreflectedinourranking.Thetotalrevenueofthefifteenlargestconstruction companies exceeded PLN 28.6 billion, but was 3% lower than a year before, although still higher than in 2014 (PLN 27.9 billion).
The slowdown seen on the construction market resulted mostly from a deferral in new tender procedures regarding large infrastructural projects, co-funded under 2014-2020 EU perspective.
At the end of 2016, there was a revival and improvement in the construction industry. Growth rate and further development of the construction market will depend will dependmostlyoneffectiveuseofEUfundsunder2014-2020perspectivetofinancelarge projects, especially regarding roads and railways. Despite a material increase in the number of new projects announced at the end of 2016 and in 2017, sector representatives remain concerned that deferred public procurement procedures regarding large projects may result in accumulation of work, construction material price increases and problems with accesstoqualifiedstaff.
2017willnotseeintensifiedconstructionworks as most projects follow the “design and construct” approach. In the upcoming years, construction companies will on the one hand focus on taking most advantage of the increased volume of projects and look for opportunities ensuring long-term growth in value after 2020 on the other. At present, expansion on foreign markets can be observed, accompanied with business diversificationandinvestinginnewcompetencies, such as modernization of buildings or maintenance of infrastructure.
Asinpreviouseditions,thefirstpartofthereportincludesafinancialanalysisoffifteenentitiesthathaveachievedthestrongest market standing in 2016. It examinestheirrevenues,salesprofits,netprofits,debt,geographicalandrevenuestructure.
The second part of the report presents growth projections for the industry, both in short and medium term, including expenditure planned in each market segment and statistics regarding bankruptcies and employment trends in the construction sector. At the end of this section, a summary of the industry’s current condition and the key growth drivers are presented from the perspective of the largest Polish construction companies and key public investors, such as PKP Polskie Linie Kolejowe S.A.
Inthefinalpartofthereport,webrieflyexamine the characteristics of the business activityofthefifteenmostimportantmarket players in 2016. We include the most crucial information concerning the scope of their activities, ownership structuresanddetailedfinancialdataderivedfromtheirannualfinancialstatements.
The report has been based on publicly availablefinancialdataorinformationprovided to us directly by the entities presented herein.
WehopethatyouwillfindthereportPolish Construction Companies 2017 – Major Players, Key Growth Drivers and Development Prospects informative and that it will give you a better understanding of the current situation on the Polish construction market, including the opportunities and challenges that lie ahead of sector investors and construction companies.

Polish Construction Companies 2017 | Major Players, Key Growth Drivers and Development Prospects
6
Polish Construction Companies 2017 | Major Players, Key Growth Drivers and Development Prospects
7
Section 1. Analysis of largest
construction companies
Polish Construction Companies 2017 | Major Players, Key Growth Drivers and Development Prospects
8
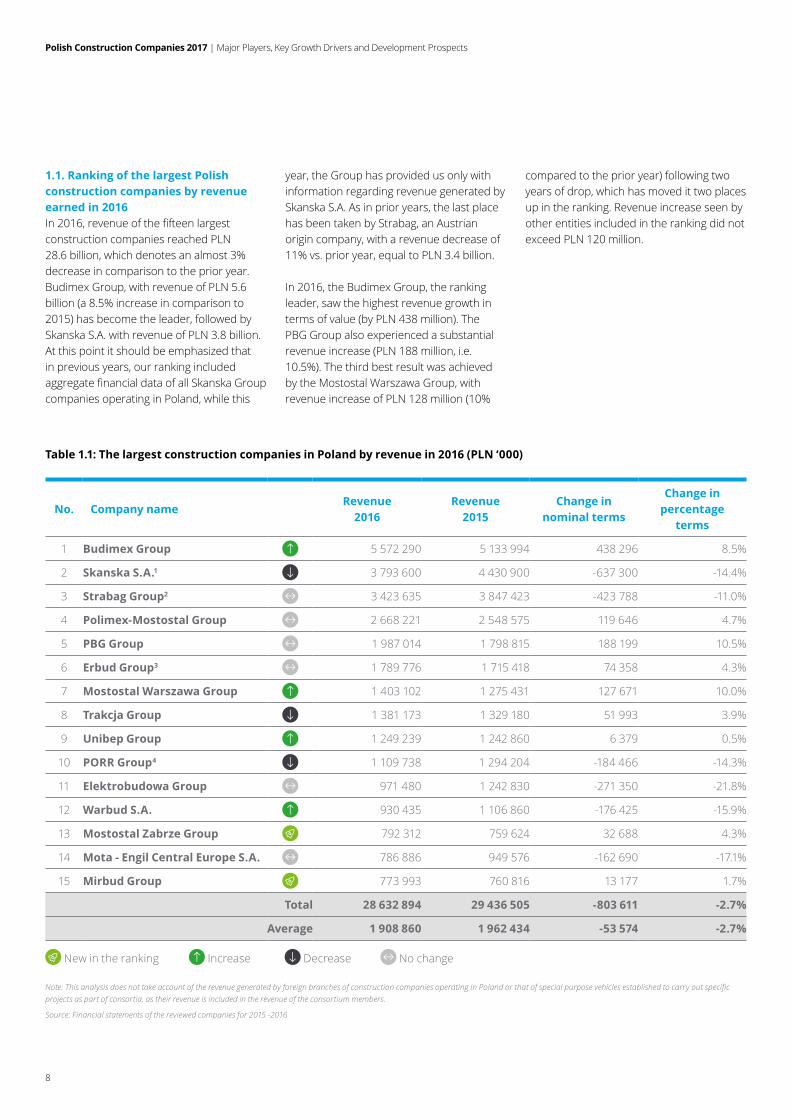
1.1. Ranking of the largest Polish construction companies by revenue earned in 2016In2016,revenueofthefifteenlargestconstruction companies reached PLN 28.6 billion, which denotes an almost 3% decrease in comparison to the prior year. Budimex Group, with revenue of PLN 5.6 billion (a 8.5% increase in comparison to 2015) has become the leader, followed by Skanska S.A. with revenue of PLN 3.8 billion. At this point it should be emphasized that in previous years, our ranking included aggregatefinancialdataofallSkanskaGroupcompanies operating in Poland, while this
year, the Group has provided us only with information regarding revenue generated by Skanska S.A. As in prior years, the last place has been taken by Strabag, an Austrian origin company, with a revenue decrease of 11% vs. prior year, equal to PLN 3.4 billion.
In 2016, the Budimex Group, the ranking leader, saw the highest revenue growth in terms of value (by PLN 438 million). The PBG Group also experienced a substantial revenue increase (PLN 188 million, i.e. 10.5%). The third best result was achieved by the Mostostal Warszawa Group, with revenue increase of PLN 128 million (10%
compared to the prior year) following two years of drop, which has moved it two places up in the ranking. Revenue increase seen by other entities included in the ranking did not exceed PLN 120 million.
Table 1.1: The largest construction companies in Poland by revenue in 2016 (PLN ‘000)
No. Company nameRevenue
2016Revenue
2015Change in
nominal terms
Change in percentage
terms
1 Budimex Group 5 572 290 5 133 994 438 296 8.5%
2 Skanska S.A.1 3 793 600 4 430 900 -637 300 -14.4%
3 Strabag Group2 3 423 635 3 847 423 -423 788 -11.0%
4 Polimex-Mostostal Group 2 668 221 2 548 575 119 646 4.7%
5 PBG Group 1 987 014 1 798 815 188 199 10.5%
6 Erbud Group3 1 789 776 1 715 418 74 358 4.3%
7 Mostostal Warszawa Group 1 403 102 1 275 431 127 671 10.0%
8 Trakcja Group 1 381 173 1 329 180 51 993 3.9%
9 Unibep Group 1 249 239 1 242 860 6 379 0.5%
10 PORR Group4 1 109 738 1 294 204 -184 466 -14.3%
11 Elektrobudowa Group 971 480 1 242 830 -271 350 -21.8%
12 Warbud S.A. 930 435 1 106 860 -176 425 -15.9%
13 Mostostal Zabrze Group 792 312 759 624 32 688 4.3%
14 Mota - Engil Central Europe S.A. 786 886 949 576 -162 690 -17.1%
15 Mirbud Group 773 993 760 816 13 177 1.7%
Total 28 632 894 29 436 505 -803 611 -2.7%
Average 1 908 860 1 962 434 -53 574 -2.7%
Note: This analysis does not take account of the revenue generated by foreign branches of construction companies operating in Poland or that of special purpose vehicles established to carry out specific projects as part of consortia, as their revenue is included in the revenue of the consortium members.
Source: Financial statements of the reviewed companies for 2015 -2016
New in the ranking Increase Decrease No change
Polish Construction Companies 2017 | Major Players, Key Growth Drivers and Development Prospects
9
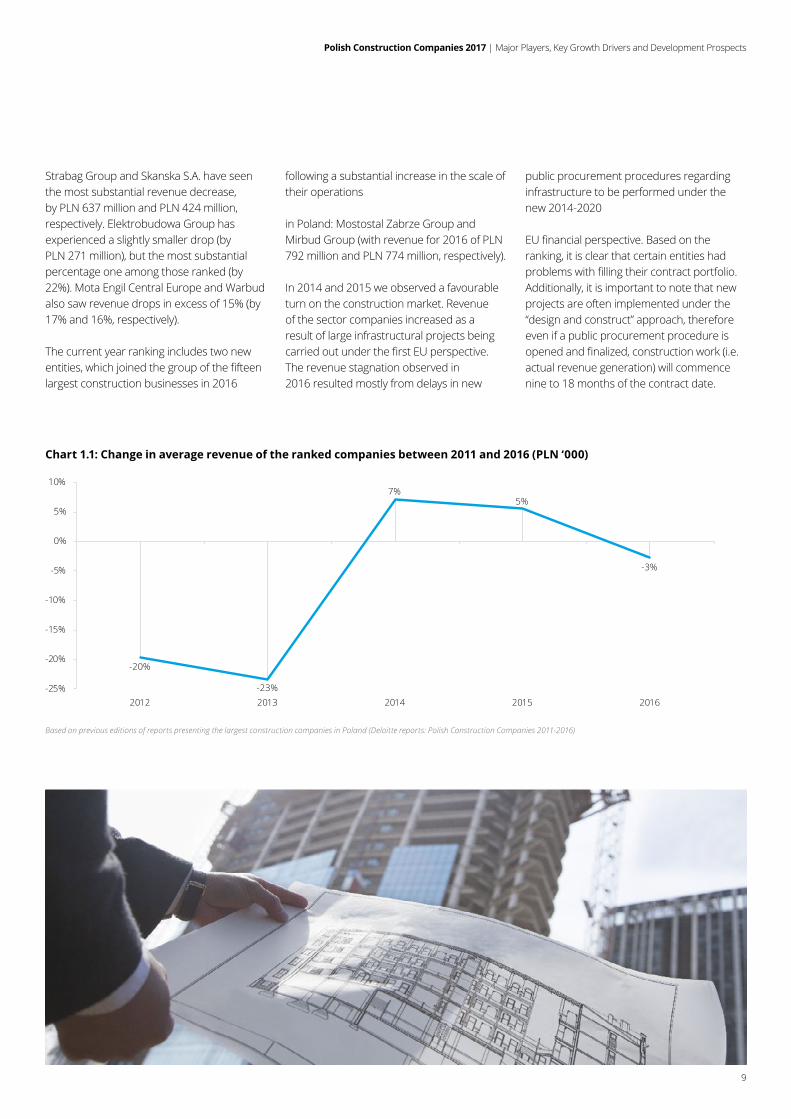
Strabag Group and Skanska S.A. have seen the most substantial revenue decrease, by PLN 637 million and PLN 424 million, respectively. Elektrobudowa Group has experienced a slightly smaller drop (by PLN 271 million), but the most substantial percentage one among those ranked (by 22%). Mota Engil Central Europe and Warbud also saw revenue drops in excess of 15% (by 17% and 16%, respectively).
The current year ranking includes two new entities,whichjoinedthegroupofthefifteenlargest construction businesses in 2016
following a substantial increase in the scale of their operations
in Poland: Mostostal Zabrze Group and Mirbud Group (with revenue for 2016 of PLN 792 million and PLN 774 million, respectively).
In 2014 and 2015 we observed a favourable turn on the construction market. Revenue of the sector companies increased as a result of large infrastructural projects being carriedoutunderthefirstEUperspective.The revenue stagnation observed in 2016 resulted mostly from delays in new
public procurement procedures regarding infrastructure to be performed under the new 2014-2020
EUfinancialperspective.Basedontheranking, it is clear that certain entities had problemswithfillingtheircontractportfolio.Additionally, it is important to note that new projects are often implemented under the “design and construct” approach, therefore even if a public procurement procedure is openedandfinalized,constructionwork(i.e.actual revenue generation) will commence nine to 18 months of the contract date.
Chart 1.1: Change in average revenue of the ranked companies between 2011 and 2016 (PLN ‘000)
Based on previous editions of reports presenting the largest construction companies in Poland (Deloitte reports: Polish Construction Companies 2011-2016)
-20%
-23%
7%5%
-3%
-25%
-20%
-15%
-10%
-5%
0%
5%
10%
2012 2013 2014 2015 2016
Polish Construction Companies 2017 | Major Players, Key Growth Drivers and Development Prospects
10
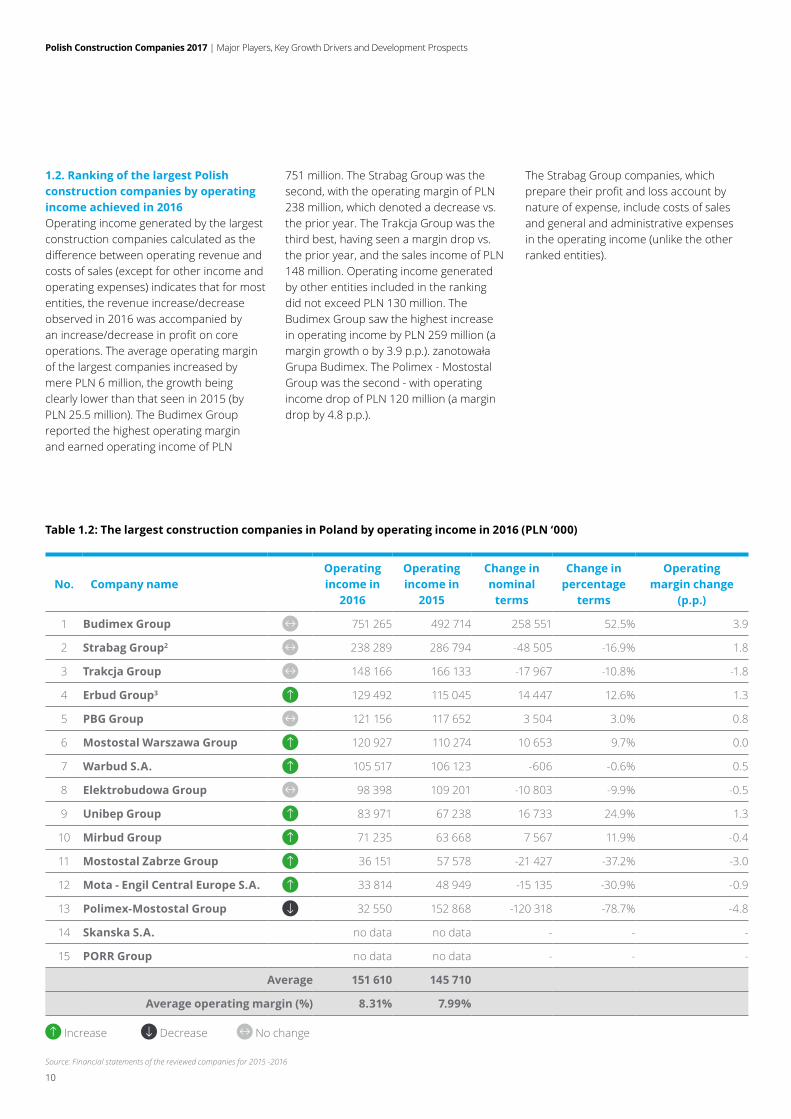
1.2. Ranking of the largest Polish construction companies by operating income achieved in 2016Operating income generated by the largest construction companies calculated as the differencebetweenoperatingrevenueandcosts of sales (except for other income and operating expenses) indicates that for most entities, the revenue increase/decrease observed in 2016 was accompanied by anincrease/decreaseinprofitoncoreoperations. The average operating margin of the largest companies increased by mere PLN 6 million, the growth being clearly lower than that seen in 2015 (by PLN 25.5 million). The Budimex Group reported the highest operating margin and earned operating income of PLN
751 million. The Strabag Group was the second, with the operating margin of PLN 238 million, which denoted a decrease vs. the prior year. The Trakcja Group was the third best, having seen a margin drop vs. the prior year, and the sales income of PLN 148 million. Operating income generated by other entities included in the ranking did not exceed PLN 130 million. The Budimex Group saw the highest increase in operating income by PLN 259 million (a margingrowthoby3.9p.p.).zanotowałaGrupa Budimex. The Polimex - Mostostal Group was the second - with operating income drop of PLN 120 million (a margin drop by 4.8 p.p.).
The Strabag Group companies, which preparetheirprofitandlossaccountbynature of expense, include costs of sales and general and administrative expenses in the operating income (unlike the other ranked entities).
Table 1.2: The largest construction companies in Poland by operating income in 2016 (PLN ‘000)
No. Company nameOperating income in
2016
Operating income in
2015
Change in nominal
terms
Change in percentage
terms
Operating margin change
(p.p.)
1 Budimex Group 751 265 492 714 258 551 52.5% 3.9
2 Strabag Group2 238 289 286 794 -48 505 -16.9% 1.8
3 Trakcja Group 148 166 166 133 -17 967 -10.8% -1.8
4 Erbud Group3 129 492 115 045 14 447 12.6% 1.3
5 PBG Group 121 156 117 652 3 504 3.0% 0.8
6 Mostostal Warszawa Group 120 927 110 274 10 653 9.7% 0.0
7 Warbud S.A. 105 517 106 123 -606 -0.6% 0.5
8 Elektrobudowa Group 98 398 109 201 -10 803 -9.9% -0.5
9 Unibep Group 83 971 67 238 16 733 24.9% 1.3
10 Mirbud Group 71 235 63 668 7 567 11.9% -0.4
11 Mostostal Zabrze Group 36 151 57 578 -21 427 -37.2% -3.0
12 Mota - Engil Central Europe S.A. 33 814 48 949 -15 135 -30.9% -0.9
13 Polimex-Mostostal Group 32 550 152 868 -120 318 -78.7% -4.8
14 Skanska S.A. no data no data - - -
15 PORR Group no data no data - - -
Average 151 610 145 710
Average operating margin (%) 8.31% 7.99%
Increase Decrease No change
Source: Financial statements of the reviewed companies for 2015 -2016
Polish Construction Companies 2017 | Major Players, Key Growth Drivers and Development Prospects
11
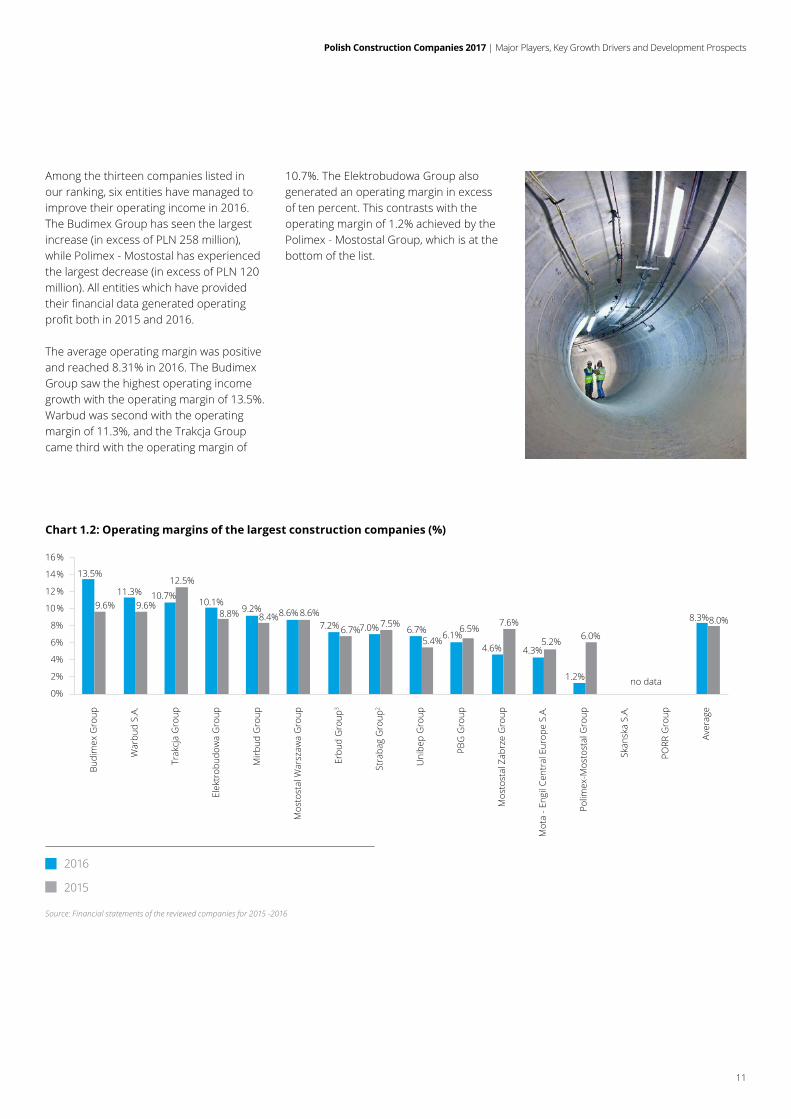
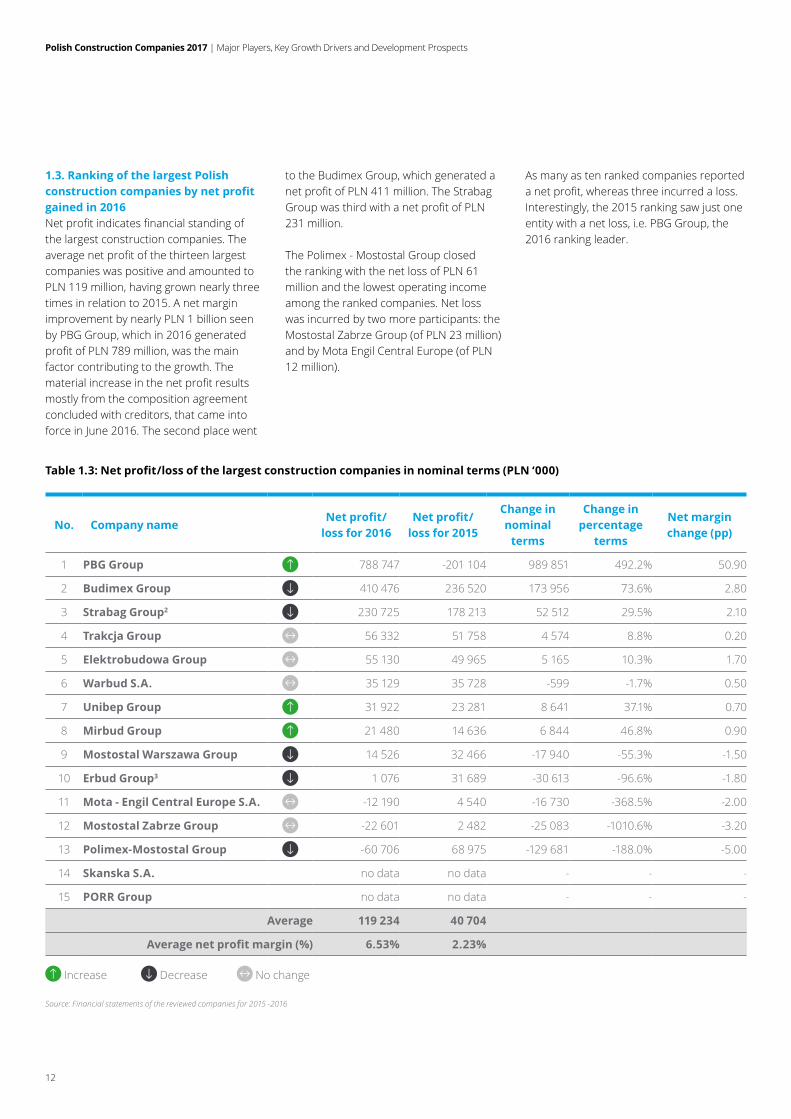
Among the thirteen companies listed in our ranking, six entities have managed to improve their operating income in 2016. The Budimex Group has seen the largest increase (in excess of PLN 258 million), while Polimex - Mostostal has experienced the largest decrease (in excess of PLN 120 million). All entities which have provided theirfinancialdatageneratedoperatingprofitbothin2015and2016.
The average operating margin was positive and reached 8.31% in 2016. The Budimex Group saw the highest operating income growth with the operating margin of 13.5%. Warbud was second with the operating margin of 11.3%, and the Trakcja Group came third with the operating margin of
10.7%. The Elektrobudowa Group also generated an operating margin in excess of ten percent. This contrasts with the operating margin of 1.2% achieved by the Polimex - Mostostal Group, which is at the bottom of the list.
Chart 1.2: Operating margins of the largest construction companies (%)
Source: Financial statements of the reviewed companies for 2015 -2016
2016
2015
13.5%
11.3% 10.7%10.1%
9.2% 8.6%7.2% 7.0% 6.7% 6.1%
4.6% 4.3%
1.2%
8.3%9.6% 9.6%
12.5%
8.8% 8.4% 8.6%
6.7%7.5%
5.4%6.5%
7.6%
5.2% 6.0%
8.0%
0%
2%
4%
6%
8%
10%
12%
14%
16%
Budi
mex
Gro
up
War
bud
S.A.
Trak
cja
Gro
up
Elek
trob
udow
a G
roup
Mirb
ud G
roup
Mos
tost
al W
arsz
awa
Gro
up
Erbu
d G
roup
3
Stra
bag
Gro
up2
Uni
bep
Gro
up
PBG
Gro
up
Mos
tost
al Z
abrz
e G
roup
Mot
a - E
ngil
Cent
ral E
urop
e S.
A.
Polim
ex-M
osto
stal
Gro
up
Skan
ska
S.A.
PORR
Gro
up
Aver
age
no data
Polish Construction Companies 2017 | Major Players, Key Growth Drivers and Development Prospects
12
1.3. Ranking of the largest Polish construction companies by net profit gained in 2016 Netprofitindicatesfinancialstandingofthe largest construction companies. The averagenetprofitofthethirteenlargestcompanies was positive and amounted to PLN 119 million, having grown nearly three times in relation to 2015. A net margin improvement by nearly PLN 1 billion seen by PBG Group, which in 2016 generated profitofPLN789million,wasthemainfactor contributing to the growth. The materialincreaseinthenetprofitresultsmostly from the composition agreement concluded with creditors, that came into force in June 2016. The second place went
to the Budimex Group, which generated a netprofitofPLN411million.TheStrabagGroupwasthirdwithanetprofitofPLN231 million.
The Polimex - Mostostal Group closed the ranking with the net loss of PLN 61 million and the lowest operating income among the ranked companies. Net loss was incurred by two more participants: the Mostostal Zabrze Group (of PLN 23 million) and by Mota Engil Central Europe (of PLN 12 million).
As many as ten ranked companies reported anetprofit,whereasthreeincurredaloss.Interestingly, the 2015 ranking saw just one entity with a net loss, i.e. PBG Group, the 2016 ranking leader.
Table 1.3: Net profit/loss of the largest construction companies in nominal terms (PLN ‘000)
No. Company nameNet profit/
loss for 2016Net profit/
loss for 2015
Change in nominal
terms
Change in percentage
terms
Net margin change (pp)
1 PBG Group 788 747 -201 104 989 851 492.2% 50.90
2 Budimex Group 410 476 236 520 173 956 73.6% 2.80
3 Strabag Group2 230 725 178 213 52 512 29.5% 2.10
4 Trakcja Group 56 332 51 758 4 574 8.8% 0.20
5 Elektrobudowa Group 55 130 49 965 5 165 10.3% 1.70
6 Warbud S.A. 35 129 35 728 -599 -1.7% 0.50
7 Unibep Group 31 922 23 281 8 641 37.1% 0.70
8 Mirbud Group 21 480 14 636 6 844 46.8% 0.90
9 Mostostal Warszawa Group 14 526 32 466 -17 940 -55.3% -1.50
10 Erbud Group3 1 076 31 689 -30 613 -96.6% -1.80
11 Mota - Engil Central Europe S.A. -12 190 4 540 -16 730 -368.5% -2.00
12 Mostostal Zabrze Group -22 601 2 482 -25 083 -1010.6% -3.20
13 Polimex-Mostostal Group -60 706 68 975 -129 681 -188.0% -5.00
14 Skanska S.A. no data no data - - -
15 PORR Group no data no data - - -
Average 119 234 40 704
Average net profit margin (%) 6.53% 2.23%
Increase Decrease No change
Source: Financial statements of the reviewed companies for 2015 -2016
Polish Construction Companies 2017 | Major Players, Key Growth Drivers and Development Prospects
13
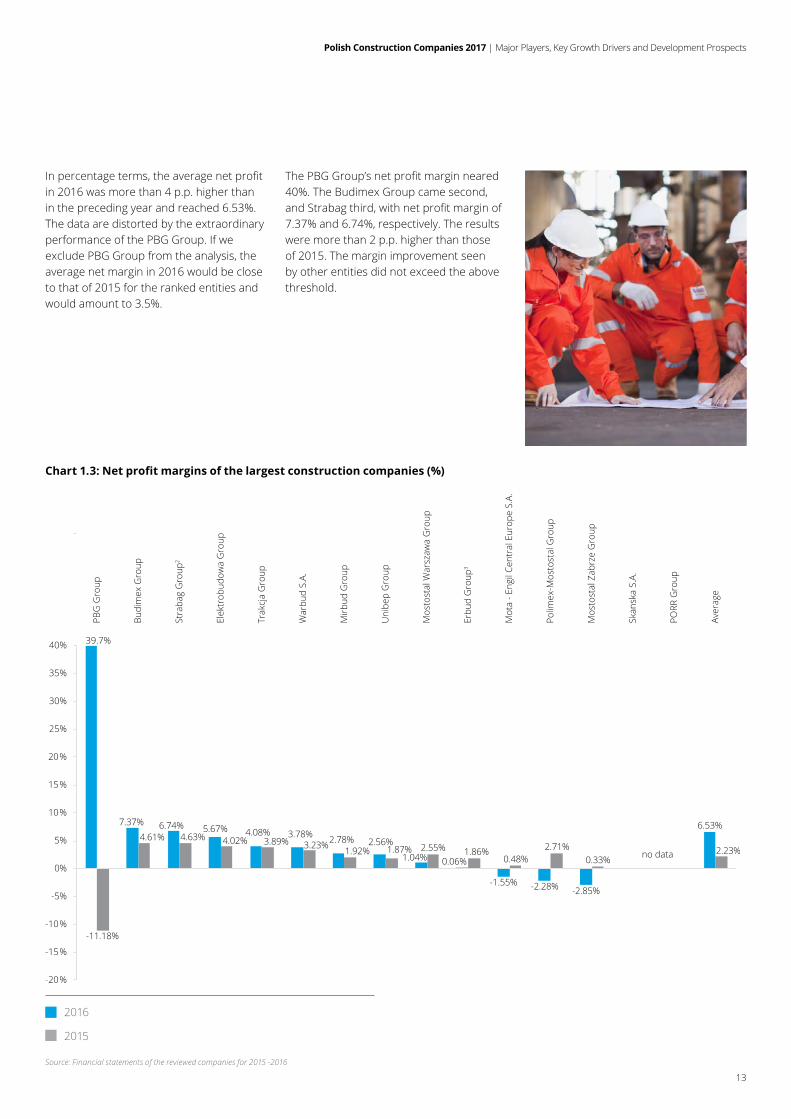
Inpercentageterms,theaveragenetprofitin 2016 was more than 4 p.p. higher than in the preceding year and reached 6.53%. The data are distorted by the extraordinary performance of the PBG Group. If we exclude PBG Group from the analysis, the average net margin in 2016 would be close to that of 2015 for the ranked entities and would amount to 3.5%.
ThePBGGroup’snetprofitmarginneared40%. The Budimex Group came second, andStrabagthird,withnetprofitmarginof7.37% and 6.74%, respectively. The results were more than 2 p.p. higher than those of 2015. The margin improvement seen by other entities did not exceed the above threshold.
Chart 1.3: Net profit margins of the largest construction companies (%)
2016
2015
Source: Financial statements of the reviewed companies for 2015 -2016
7.37% 6.74% 5.67% 4.08% 3.78% 2.78% 2.56%
1.04% 0.06%
-1.55% -2.28% -2.85%
6.53%
-11.18%
4.61% 4.63% 4.02% 3.89% 3.23% 1.92% 1.87% 2.55% 1.86%0.48%
2.71%0.33%
2.23%
-20%
-15%
-10%
-5%
0%
5%
10%
15%
20%
PBG
Gro
up
Budi
mex
Gro
up
Stra
bag
Gro
up2
Elek
trob
udow
a G
roup
Trak
cja
Gro
up
War
bud
S.A.
Mirb
ud G
roup
Uni
bep
Gro
up
Mos
tost
al W
arsz
awa
Gro
up
Erbu
d G
roup
3
Mot
a - E
ngil
Cent
ral E
urop
e S.
A.
Polim
ex-M
osto
stal
Gro
up
Mos
tost
al Z
abrz
e G
roup
Skan
ska
S.A.
PORR
Gro
up
Aver
age
no data
25%
30%
35%
40% 39.7%
Polish Construction Companies 2017 | Major Players, Key Growth Drivers and Development Prospects
14
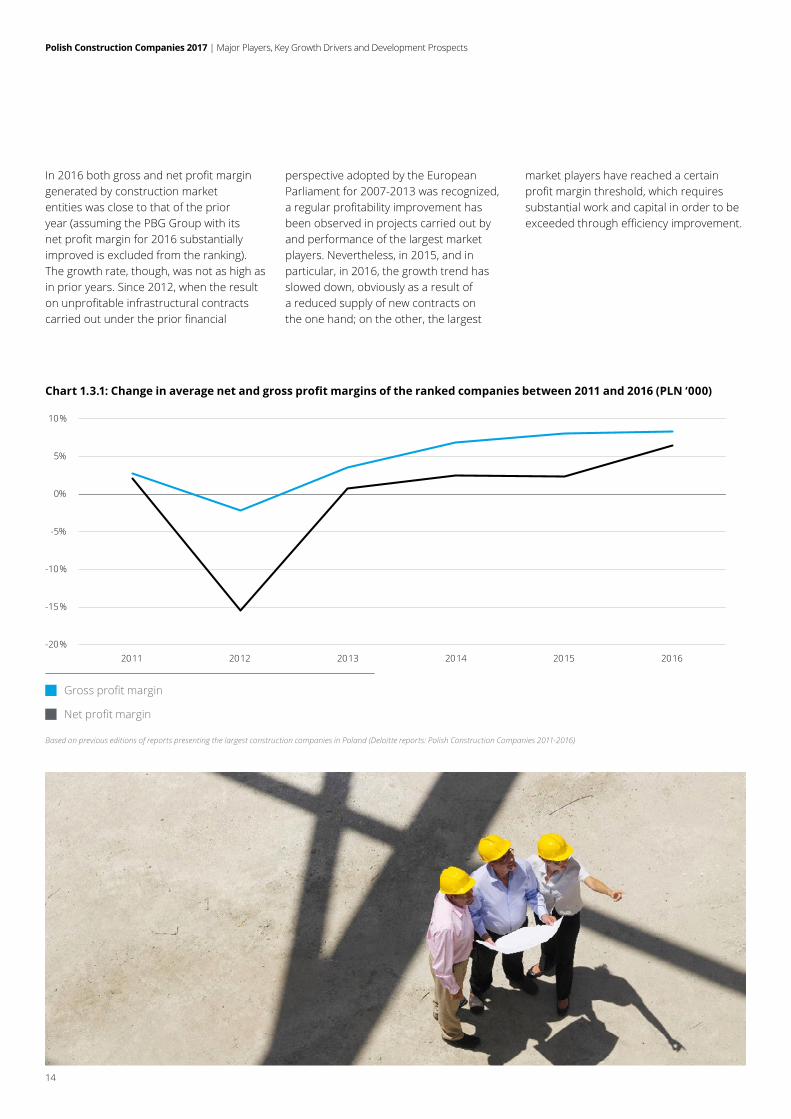
In2016bothgrossandnetprofitmargingenerated by construction market entities was close to that of the prior year (assuming the PBG Group with its netprofitmarginfor2016substantiallyimproved is excluded from the ranking). The growth rate, though, was not as high as in prior years. Since 2012, when the result onunprofitableinfrastructuralcontractscarriedoutunderthepriorfinancial
perspective adopted by the European Parliament for 2007-2013 was recognized, aregularprofitabilityimprovementhasbeen observed in projects carried out by and performance of the largest market players. Nevertheless, in 2015, and in particular, in 2016, the growth trend has slowed down, obviously as a result of a reduced supply of new contracts on the one hand; on the other, the largest
market players have reached a certain profitmarginthreshold,whichrequiressubstantial work and capital in order to be exceededthroughefficiencyimprovement.
Based on previous editions of reports presenting the largest construction companies in Poland (Deloitte reports: Polish Construction Companies 2011-2016)
Chart 1.3.1: Change in average net and gross profit margins of the ranked companies between 2011 and 2016 (PLN ‘000)
Grossprofitmargin
Netprofitmargin
-20%
-15%
-10%
-5%
0%
5%
10%
2011 2012 2013 2014 2015 2016
Polish Construction Companies 2017 | Major Players, Key Growth Drivers and Development Prospects
15
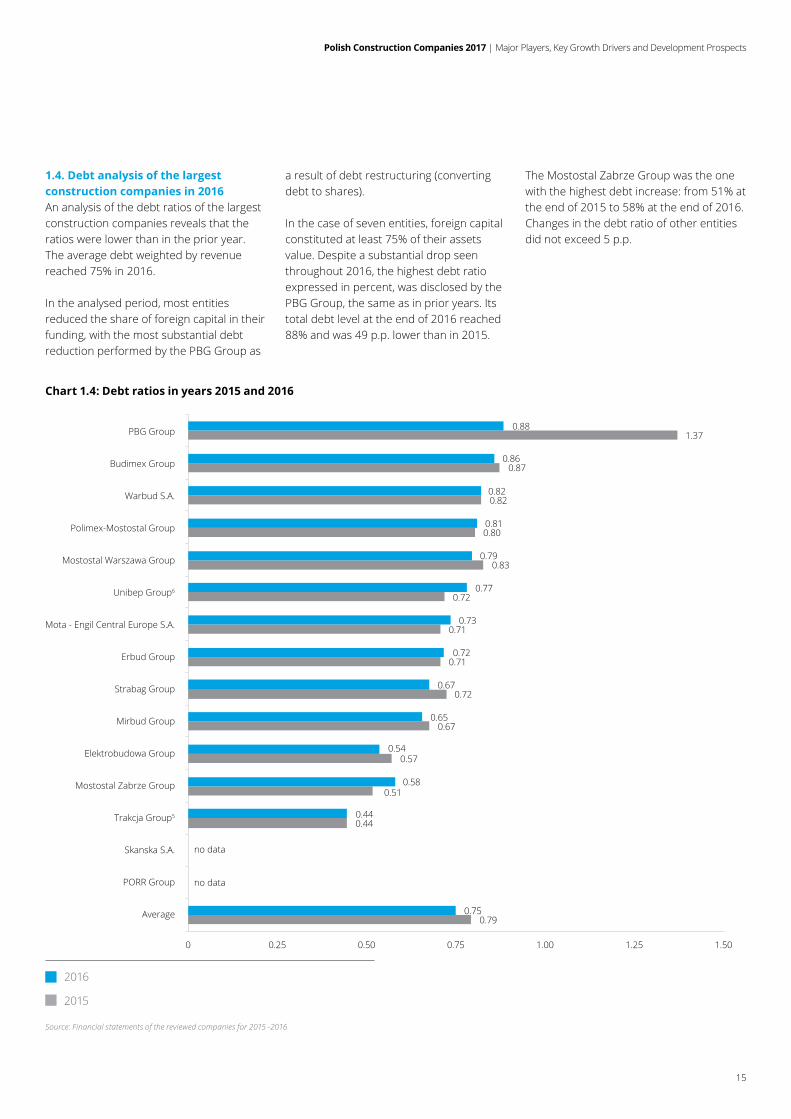
1.4. Debt analysis of the largest construction companies in 2016 An analysis of the debt ratios of the largest construction companies reveals that the ratios were lower than in the prior year. The average debt weighted by revenue reached 75% in 2016.
In the analysed period, most entities reduced the share of foreign capital in their funding, with the most substantial debt reduction performed by the PBG Group as
a result of debt restructuring (converting debt to shares).
In the case of seven entities, foreign capital constituted at least 75% of their assets value. Despite a substantial drop seen throughout 2016, the highest debt ratio expressed in percent, was disclosed by the PBG Group, the same as in prior years. Its total debt level at the end of 2016 reached 88% and was 49 p.p. lower than in 2015.
The Mostostal Zabrze Group was the one with the highest debt increase: from 51% at the end of 2015 to 58% at the end of 2016. Changes in the debt ratio of other entities did not exceed 5 p.p.
Chart 1.4: Debt ratios in years 2015 and 2016
2016
2015
Source: Financial statements of the reviewed companies for 2015 -2016
0.79
0.44
0.51
0.57
0.67
0.72
0.71
0.71
0.72
0.83
0.80
0.82
0.87
1.37
0.75
no data
0.44
0.58
0.54
0.65
0.67
0.72
0.73
0.77
0.79
0.81
0.82
0.86
0.88
0 0.25 0.50 0.75 1.00 1.25 1.50
PBG Group
Budimex Group
Warbud S.A.
Polimex-Mostostal Group
Mostostal Warszawa Group
Unibep Group6
Mota - Engil Central Europe S.A.
Erbud Group
Strabag Group
Mirbud Group
Elektrobudowa Group
Mostostal Zabrze Group
Trakcja Group5
Skanska S.A.
PORR Group
Average
no data
Polish Construction Companies 2017 | Major Players, Key Growth Drivers and Development Prospects
16
As in the prior year, the debt ratio of the Trakcja Group was the lowest among the ranked companies and reached the level of 44%. At the end of 2016, in the largest construction companies, the average debt ratio weighed with revenue dropped by 4 p.p. vs. the prior year.
1.5. Relation of capital expenditure to sales ratio of the largest construction companies in 2016Companies operating in the construction sector usually demonstrate a low capital expenditure to sales ratio due to high sales volumes and relatively low capital expenditure necessary to provide construction services. In 2016 the total capital expenditure of the largest market players exceeded PLN 320 million and were 5% higher than in 2015.
Table 1.5: Capital expenditure of the fifteen largest construction companies in nominal terms (PLN ‘000)
No. Company nameCapital
expenditure in 2016
Capital expenditure in
2015
Change in nominal terms
Change in percentage
terms
1 Strabag Group 75 956 65 830 10 126 15%
2 Budimex Group 70 898 67 915 2 983 4%
3 Trakcja Group 57 153 44 309 12 844 29%
4 Mota - Engil Central Europe S.A. 29 829 17 182 12 647 74%
5 Mirbud Group 17 821 4 353 13 468 309%
6 Mostostal Zabrze Group 14 300 9 418 4 882 52%
7 Elektrobudowa Group 13 694 13 838 -144 -1%
8 Mostostal Warszawa Group 10 898 18 757 -7 859 -42%
9 Warbud S.A. 8 876 17 220 -8 344 -48%
10 PBG Group 8 834 29 214 -20 380 -70%
11 Unibep Group 6 971 2 825 4 146 147%
12 Polimex-Mostostal Group 4 484 2 480 2 004 81%
13 Erbud Group 3 800 13 318 -9 518 -71%
14 Skanska S.A. no data no data - -
15 PORR Group no data no data - -
Total 323 514 306 659 16 855 5%
Average 24 886 23 589 1 297 5%
Source: Financial statements of the reviewed companies for 2015 -2016
Increase Decrease No change
Polish Construction Companies 2017 | Major Players, Key Growth Drivers and Development Prospects
17
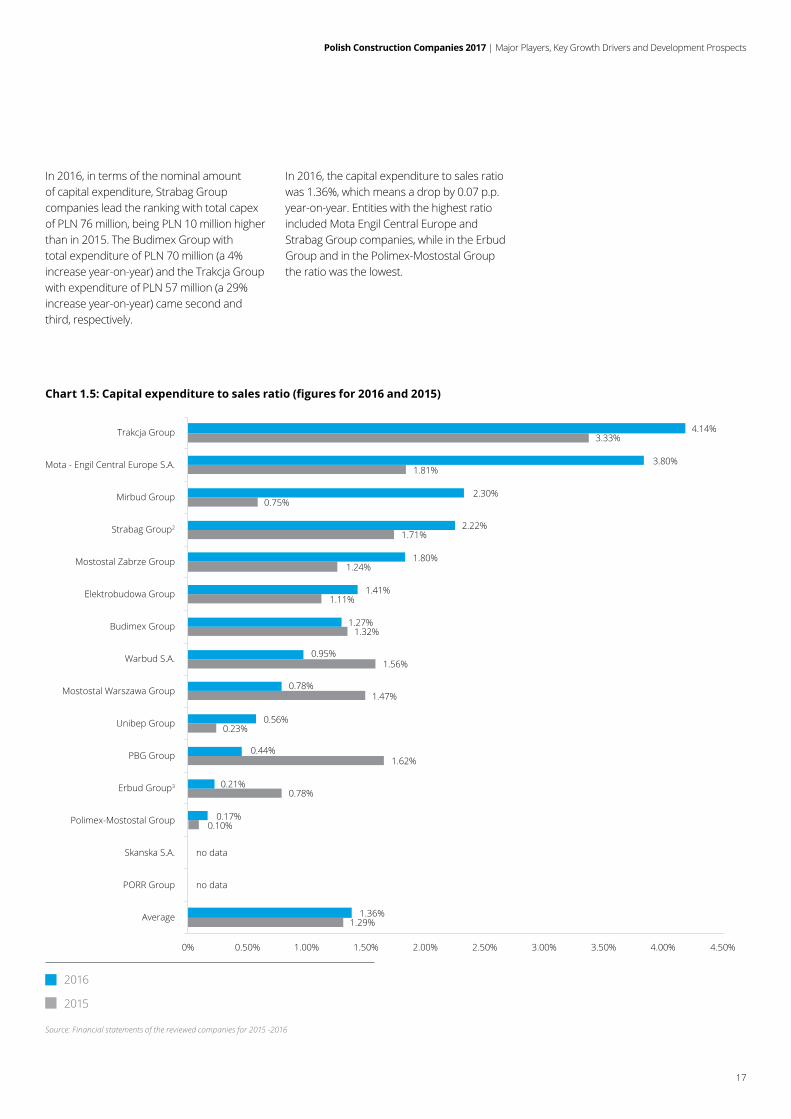
In 2016, in terms of the nominal amount of capital expenditure, Strabag Group companies lead the ranking with total capex of PLN 76 million, being PLN 10 million higherthan in 2015. The Budimex Group with total expenditure of PLN 70 million (a 4% increase year-on-year) and the Trakcja Group with expenditure of PLN 57 million (a 29% increase year-on-year) came second and third, respectively.
In 2016, the capital expenditure to sales ratio was 1.36%, which means a drop by 0.07 p.p. year-on-year. Entities with the highest ratio included Mota Engil Central Europe and Strabag Group companies, while in the Erbud Group and in the Polimex-Mostostal Group the ratio was the lowest.
Chart 1.5: Capital expenditure to sales ratio (figures for 2016 and 2015)
2016
2015
Source: Financial statements of the reviewed companies for 2015 -2016
0.23%
1.47%
1.56%
1.32%
1.11%
1.29%
no data
no data
0.10%
0.78%
1.62%
1.24%
1.71%
0.75%
1.81%
3.33%
1.36%
0.17%
0.21%
0.44%
0.56%
0.78%
0.95%
1.27%
1.41%
1.80%
2.22%
2.30%
3.80%
4.14%
0% 0.50% 1.00% 1.50% 2.00% 2.50% 3.00% 3.50% 4.00%
Trakcja Group
Mota - Engil Central Europe S.A.
Mirbud Group
Strabag Group2
Mostostal Zabrze Group
Elektrobudowa Group
Budimex Group
Warbud S.A.
Mostostal Warszawa Group
Unibep Group
PBG Group
Erbud Group3
Polimex-Mostostal Group
Skanska S.A.
PORR Group
Average
4.50%
Polish Construction Companies 2017 | Major Players, Key Growth Drivers and Development Prospects
18
1.6. Geographical and generic structure of revenue earned by the largest construction companies
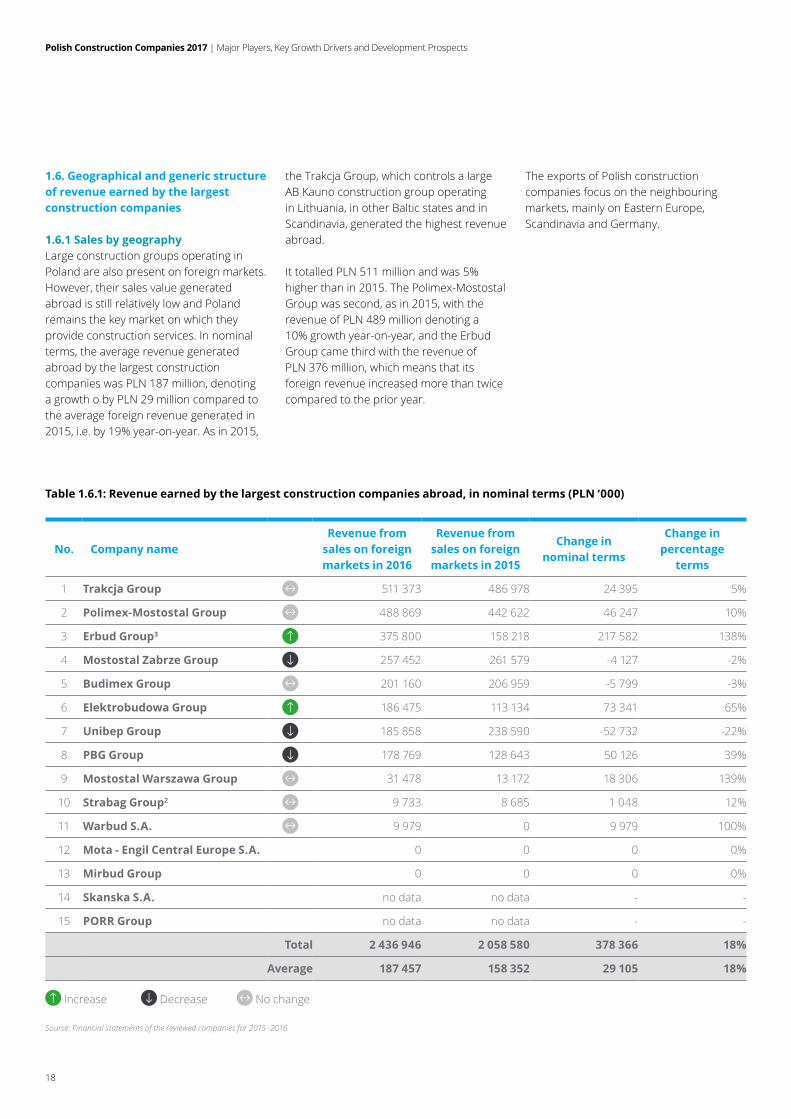
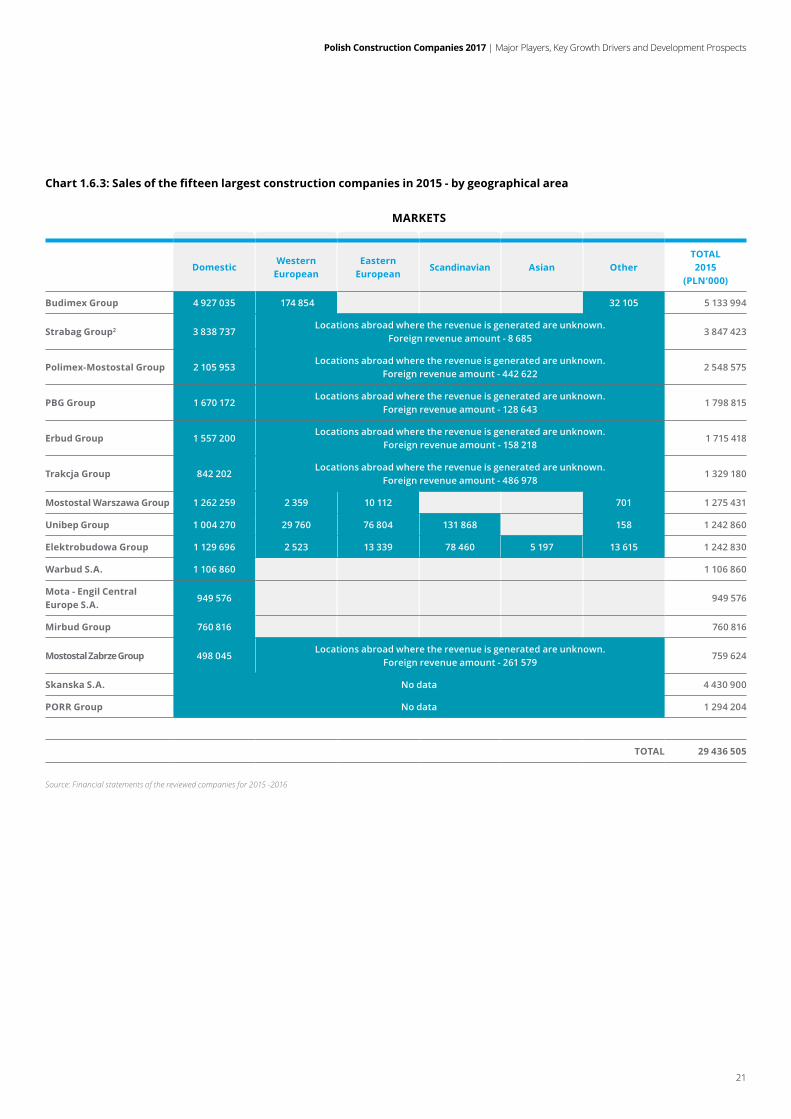
1.6.1 Sales by geography Large construction groups operating in Poland are also present on foreign markets. However, their sales value generated abroad is still relatively low and Poland remains the key market on which they provide construction services. In nominal terms, the average revenue generated abroad by the largest construction companies was PLN 187 million, denoting a growth o by PLN 29 million compared to the average foreign revenue generated in 2015, i.e. by 19% year-on-year. As in 2015,
the Trakcja Group, which controls a large AB Kauno construction group operating in Lithuania, in other Baltic states and in Scandinavia, generated the highest revenue abroad.
It totalled PLN 511 million and was 5% higher than in 2015. The Polimex-Mostostal Group was second, as in 2015, with the revenue of PLN 489 million denoting a 10% growth year-on-year, and the Erbud Group came third with the revenue of PLN 376 million, which means that its foreign revenue increased more than twice compared to the prior year.
The exports of Polish construction companies focus on the neighbouring markets, mainly on Eastern Europe, Scandinavia and Germany.
Table 1.6.1: Revenue earned by the largest construction companies abroad, in nominal terms (PLN ‘000)
No. Company nameRevenue from
sales on foreign markets in 2016
Revenue from sales on foreign markets in 2015
Change in nominal terms
Change in percentage
terms
1 Trakcja Group 511 373 486 978 24 395 5%
2 Polimex-Mostostal Group 488 869 442 622 46 247 10%
3 Erbud Group3 375 800 158 218 217 582 138%
4 Mostostal Zabrze Group 257 452 261 579 -4 127 -2%
5 Budimex Group 201 160 206 959 -5 799 -3%
6 Elektrobudowa Group 186 475 113 134 73 341 65%
7 Unibep Group 185 858 238 590 -52 732 -22%
8 PBG Group 178 769 128 643 50 126 39%
9 Mostostal Warszawa Group 31 478 13 172 18 306 139%
10 Strabag Group2 9 733 8 685 1 048 12%
11 Warbud S.A. 9 979 0 9 979 100%
12 Mota - Engil Central Europe S.A. 0 0 0 0%
13 Mirbud Group 0 0 0 0%
14 Skanska S.A. no data no data - -
15 PORR Group no data no data - -
Total 2 436 946 2 058 580 378 366 18%
Average 187 457 158 352 29 105 18%
Source: Financial statements of the reviewed companies for 2015 -2016
Increase Decrease No change
Polish Construction Companies 2017 | Major Players, Key Growth Drivers and Development Prospects
19
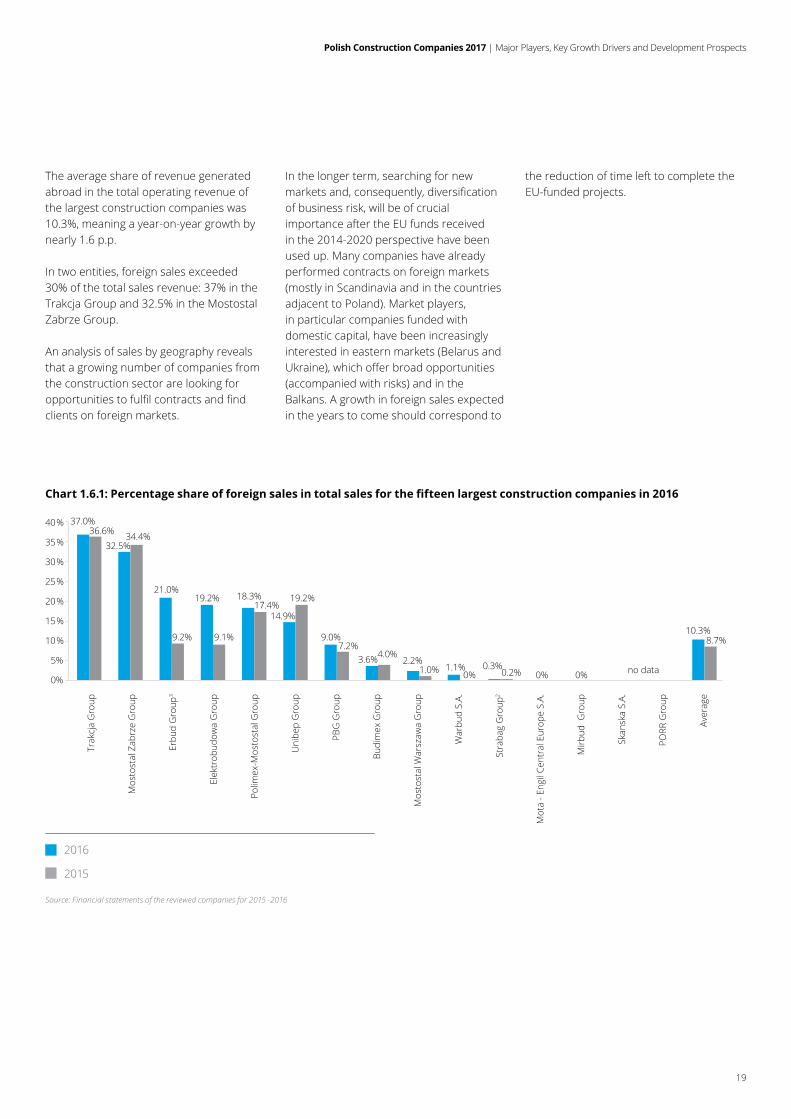
The average share of revenue generated abroad in the total operating revenue of the largest construction companies was 10.3%, meaning a year-on-year growth by nearly 1.6 p.p.
In two entities, foreign sales exceeded 30% of the total sales revenue: 37% in the Trakcja Group and 32.5% in the Mostostal Zabrze Group.
An analysis of sales by geography reveals that a growing number of companies from the construction sector are looking for opportunitiestofulfilcontractsandfindclients on foreign markets.
In the longer term, searching for new marketsand,consequently,diversificationof business risk, will be of crucial importance after the EU funds received in the 2014-2020 perspective have been used up. Many companies have already performed contracts on foreign markets (mostly in Scandinavia and in the countries adjacent to Poland). Market players, in particular companies funded with domestic capital, have been increasingly interested in eastern markets (Belarus and Ukraine),whichofferbroadopportunities(accompanied with risks) and in the Balkans. A growth in foreign sales expected in the years to come should correspond to
the reduction of time left to complete the EU-funded projects.
Chart 1.6.1: Percentage share of foreign sales in total sales for the fifteen largest construction companies in 2016
2016
2015
Source: Financial statements of the reviewed companies for 2015 -2016
37.0%
32.5%
21.0%19.2% 18.3%
14.9%
9.0%
3.6% 2.2% 0.3%0% 0%
10.3%
36.6% 34.4%
9.2% 9.1%
17.4%19.2%
7.2%4.0%
1.0% 1.1% 0.2% no data0%
5%
10%
15%
20%
25%
30%
35%
40%
Trak
cja
Gro
up
Mos
tost
al Z
abrz
e G
roup
Erbu
d G
roup
3
Elek
trob
udow
a G
roup
Polim
ex-M
osto
stal
Gro
up
Uni
bep
Gro
up
PBG
Gro
up
Budi
mex
Gro
up
Mos
tost
al W
arsz
awa
Gro
up
War
bud
S.A.
Stra
bag
Gro
up2
Mot
a - E
ngil
Cent
ral E
urop
e S.
A.
Mirb
ud G
roup
Skan
ska
S.A.
PORR
Gro
up
Aver
age
8.7%
0%
Polish Construction Companies 2017 | Major Players, Key Growth Drivers and Development Prospects
20
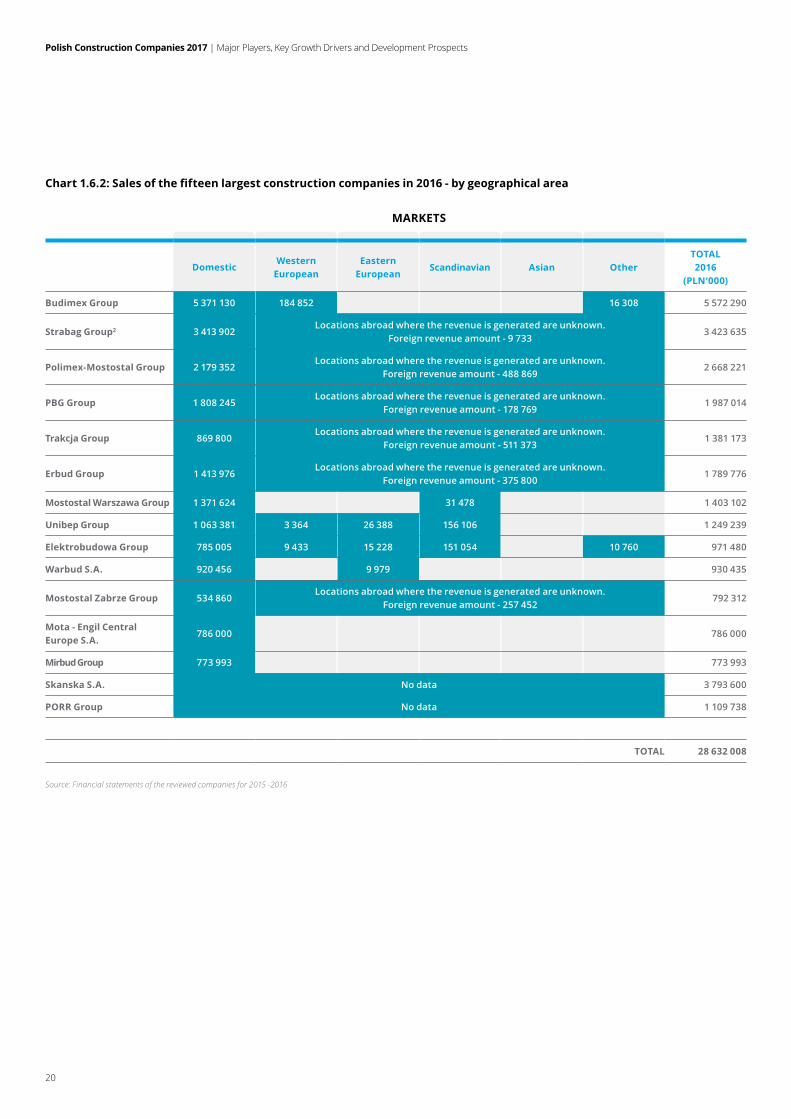
Chart 1.6.2: Sales of the fifteen largest construction companies in 2016 - by geographical area
Source: Financial statements of the reviewed companies for 2015 -2016
DomesticWestern
EuropeanEastern
EuropeanScandinavian Asian Other
TOTAL2016
(PLN‘000)
Budimex Group 5 371 130 184 852 16 308 5 572 290
Strabag Group2 3 413 902Locations abroad where the revenue is generated are unknown.
Foreign revenue amount - 9 7333 423 635
Polimex-Mostostal Group 2 179 352Locations abroad where the revenue is generated are unknown.
Foreign revenue amount - 488 8692 668 221
PBG Group 1 808 245Locations abroad where the revenue is generated are unknown.
Foreign revenue amount - 178 7691 987 014
Trakcja Group 869 800Locations abroad where the revenue is generated are unknown.
Foreign revenue amount - 511 3731 381 173
Erbud Group 1 413 976Locations abroad where the revenue is generated are unknown.
Foreign revenue amount - 375 8001 789 776
Mostostal Warszawa Group 1 371 624 31 478 1 403 102
Unibep Group 1 063 381 3 364 26 388 156 106 1 249 239
Elektrobudowa Group 785 005 9 433 15 228 151 054 10 760 971 480
Warbud S.A. 920 456 9 979 930 435
Mostostal Zabrze Group 534 860Locations abroad where the revenue is generated are unknown.
Foreign revenue amount - 257 452792 312
Mota - Engil Central Europe S.A.
786 000 786 000
Mirbud Group 773 993 773 993
Skanska S.A. No data 3 793 600
PORR Group No data 1 109 738
TOTAL 28 632 008
MARKETS
Polish Construction Companies 2017 | Major Players, Key Growth Drivers and Development Prospects
21
Chart 1.6.3: Sales of the fifteen largest construction companies in 2015 - by geographical area
Source: Financial statements of the reviewed companies for 2015 -2016
DomesticWestern
EuropeanEastern
EuropeanScandinavian Asian Other
TOTAL2015
(PLN‘000)
Budimex Group 4 927 035 174 854 32 105 5 133 994
Strabag Group2 3 838 737Locations abroad where the revenue is generated are unknown.
Foreign revenue amount - 8 6853 847 423
Polimex-Mostostal Group 2 105 953Locations abroad where the revenue is generated are unknown.
Foreign revenue amount - 442 6222 548 575
PBG Group 1 670 172Locations abroad where the revenue is generated are unknown.
Foreign revenue amount - 128 6431 798 815
Erbud Group 1 557 200Locations abroad where the revenue is generated are unknown.
Foreign revenue amount - 158 2181 715 418
Trakcja Group 842 202Locations abroad where the revenue is generated are unknown.
Foreign revenue amount - 486 9781 329 180
Mostostal Warszawa Group 1 262 259 2 359 10 112 701 1 275 431
Unibep Group 1 004 270 29 760 76 804 131 868 158 1 242 860
Elektrobudowa Group 1 129 696 2 523 13 339 78 460 5 197 13 615 1 242 830
Warbud S.A. 1 106 860 1 106 860
Mota - Engil Central Europe S.A.
949 576 949 576
Mirbud Group 760 816 760 816
Mostostal Zabrze Group 498 045Locations abroad where the revenue is generated are unknown.
Foreign revenue amount - 261 579759 624
Skanska S.A. No data 4 430 900
PORR Group No data 1 294 204
TOTAL 29 436 505
MARKETS
Polish Construction Companies 2017 | Major Players, Key Growth Drivers and Development Prospects
22
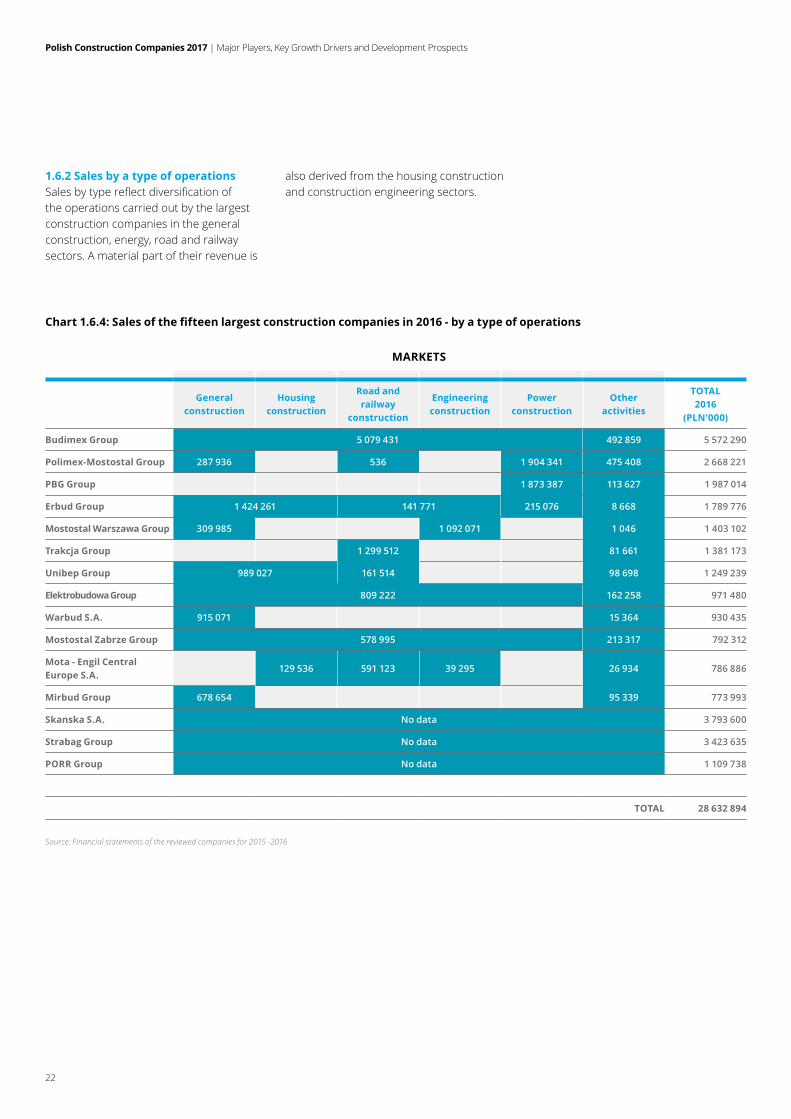
1.6.2 Sales by a type of operationsSalesbytypereflectdiversificationofthe operations carried out by the largest construction companies in the general construction, energy, road and railway sectors. A material part of their revenue is
also derived from the housing construction and construction engineering sectors.
Chart 1.6.4: Sales of the fifteen largest construction companies in 2016 - by a type of operations
Source: Financial statements of the reviewed companies for 2015 -2016
General construction
Housingconstruction
Road and railway
construction
Engineering construction
Power construction
Other activities
TOTAL2016
(PLN‘000)
Budimex Group 5 079 431 492 859 5 572 290
Polimex-Mostostal Group 287 936 536 1 904 341 475 408 2 668 221
PBG Group 1 873 387 113 627 1 987 014
Erbud Group 1 424 261 141 771 215 076 8 668 1 789 776
Mostostal Warszawa Group 309 985 1 092 071 1 046 1 403 102
Trakcja Group 1 299 512 81 661 1 381 173
Unibep Group 989 027 161 514 98 698 1 249 239
Elektrobudowa Group 809 222 162 258 971 480
Warbud S.A. 915 071 15 364 930 435
Mostostal Zabrze Group 578 995 213 317 792 312
Mota - Engil Central Europe S.A.
129 536 591 123 39 295 26 934 786 886
Mirbud Group 678 654 95 339 773 993
Skanska S.A. No data 3 793 600
Strabag Group No data 3 423 635
PORR Group No data 1 109 738
TOTAL 28 632 894
MARKETS
Polish Construction Companies 2017 | Major Players, Key Growth Drivers and Development Prospects
23
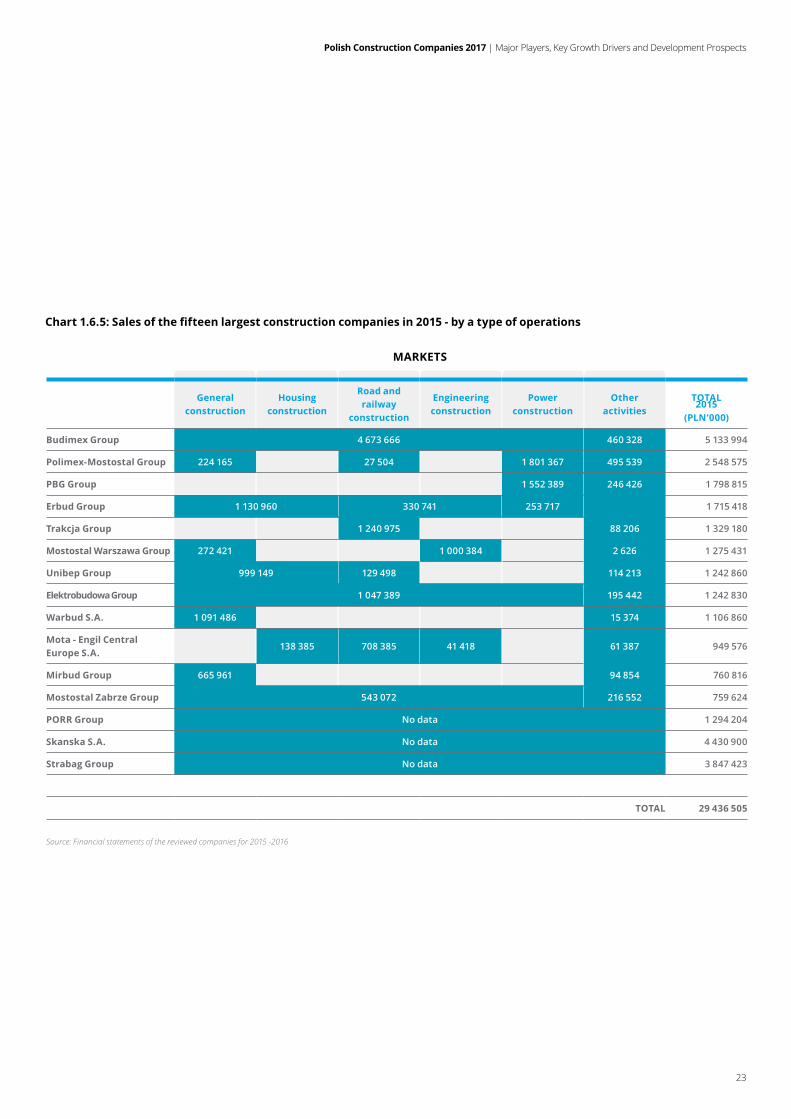
Chart 1.6.5: Sales of the fifteen largest construction companies in 2015 - by a type of operations
Source: Financial statements of the reviewed companies for 2015 -2016
General construction
Housingconstruction
Road and railway
construction
Engineering construction
Power construction
Other activities
TOTAL2015
(PLN‘000)
Budimex Group 4 673 666 460 328 5 133 994
Polimex-Mostostal Group 224 165 27 504 1 801 367 495 539 2 548 575
PBG Group 1 552 389 246 426 1 798 815
Erbud Group 1 130 960 330 741 253 717 1 715 418
Trakcja Group 1 240 975 88 206 1 329 180
Mostostal Warszawa Group 272 421 1 000 384 2 626 1 275 431
Unibep Group 999 149 129 498 114 213 1 242 860
Elektrobudowa Group 1 047 389 195 442 1 242 830
Warbud S.A. 1 091 486 15 374 1 106 860
Mota - Engil Central Europe S.A.
138 385 708 385 41 418 61 387 949 576
Mirbud Group 665 961 94 854 760 816
Mostostal Zabrze Group 543 072 216 552 759 624
PORR Group No data 1 294 204
Skanska S.A. No data 4 430 900
Strabag Group No data 3 847 423
TOTAL 29 436 505
MARKETS
Polish Construction Companies 2017 | Major Players, Key Growth Drivers and Development Prospects
24
No. Company nameOther
operations 2016Other activities
2015Change in
nominal terms
Change in percentage
terms
1 Budimex Group 492 859 460 328 32 531 7.1%
2 Polimex-Mostostal Group 475 408 495 539 -20 131 -4.1%
3 Mostostal Zabrze Group 213 317 216 552 -3 235 -1.5%
4 Elektrobudowa Group 162 258 195 442 -33 184 -17.0%
5 PBG Group 113 627 246 426 -132 799 -53.9%
6 Unibep Group 98 698 114 213 -15 515 -13.6%
7 Mirbud Group 95 339 94 854 485 0.51%
8 Trakcja Group 81 661 88 206 -6 545 -7.4%
9 Mota - Engil Central Europe S.A. 26 934 61 387 -34 453 -56.1%
10 Warbud S.A. 15 364 15 374 -10 -0.1%
11 Erbud Group3 8 668 0 8 668 0.0%
12 Mostostal Warszawa Group 1 046 2 626 -1 580 -60.2%
13 Skanska S.A. no data no data - -
14 Strabag Group no data no data - -
15 PORR Group no data no data - -
Total 1 785 179 1 990 947 -205 768
Source: Financial statements of the reviewed companies for 2015 -2016
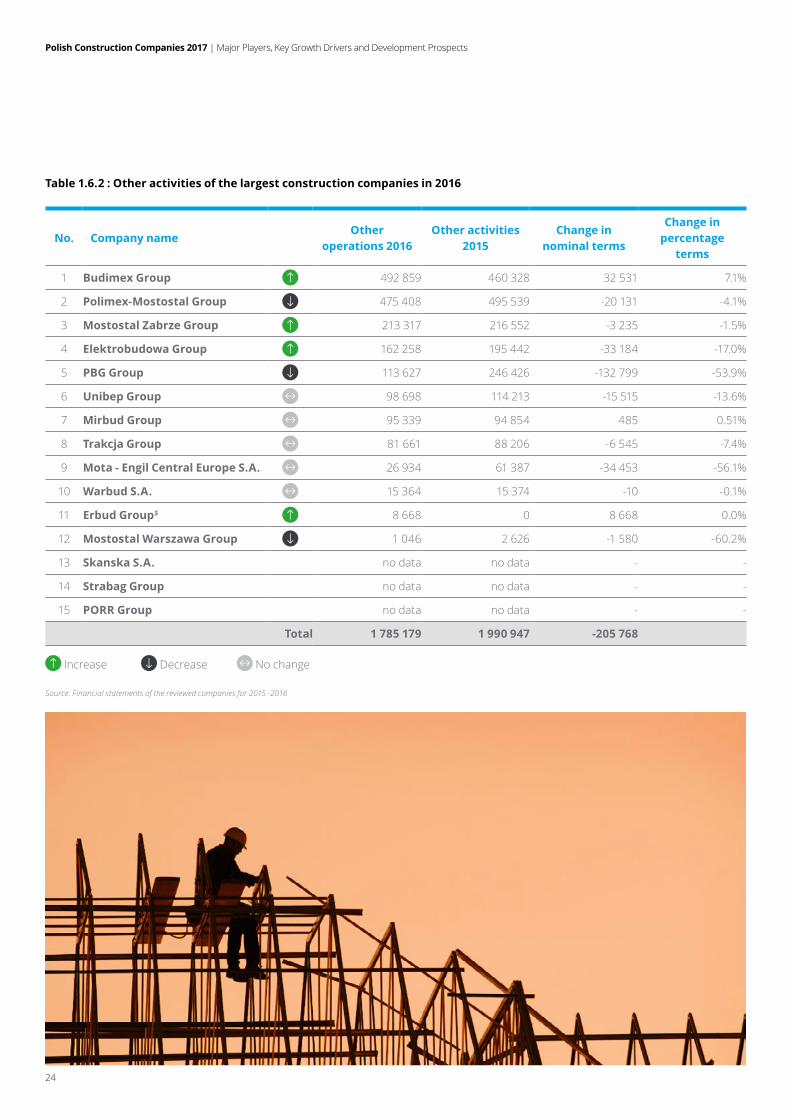
Table 1.6.2 : Other activities of the largest construction companies in 2016
Increase Decrease No change
Polish Construction Companies 2017 | Major Players, Key Growth Drivers and Development Prospects
25
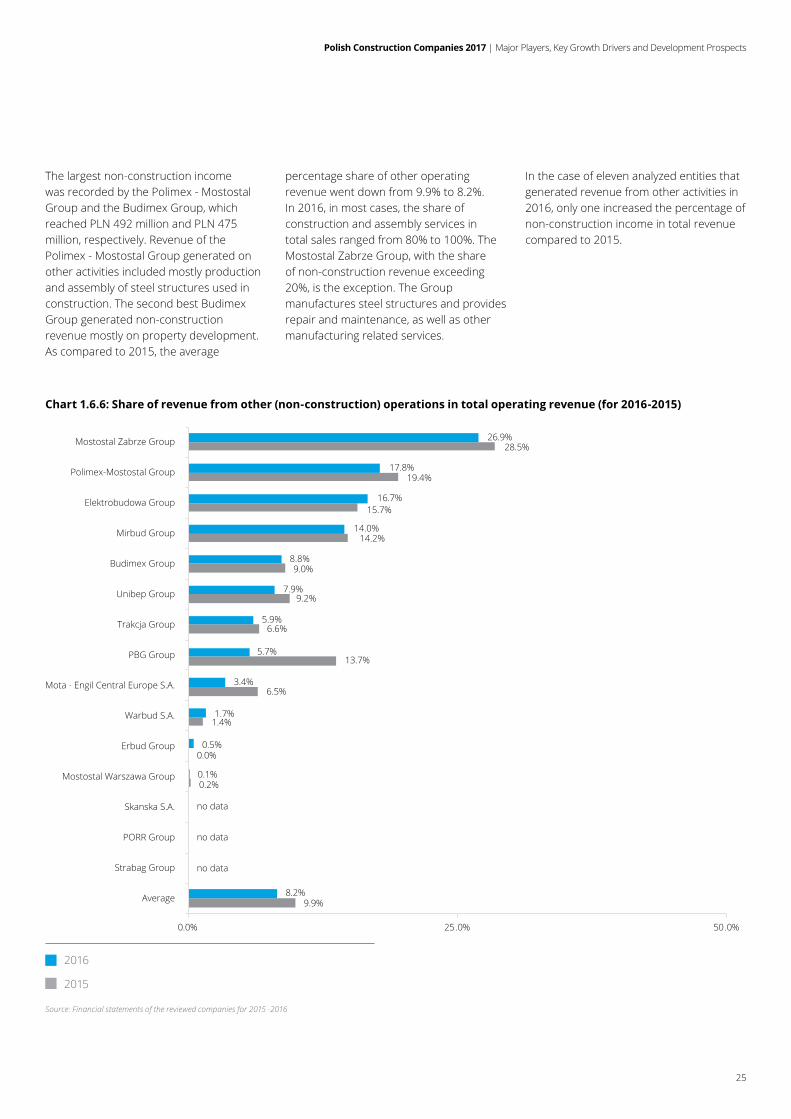
The largest non-construction income was recorded by the Polimex - Mostostal Group and the Budimex Group, which reached PLN 492 million and PLN 475 million, respectively. Revenue of the Polimex - Mostostal Group generated on other activities included mostly production and assembly of steel structures used in construction. The second best Budimex Group generated non-construction revenue mostly on property development. As compared to 2015, the average
percentage share of other operating revenue went down from 9.9% to 8.2%. In 2016, in most cases, the share of construction and assembly services in total sales ranged from 80% to 100%. The Mostostal Zabrze Group, with the share of non-construction revenue exceeding 20%, is the exception. The Group manufactures steel structures and provides repair and maintenance, as well as other manufacturing related services.
In the case of eleven analyzed entities that generated revenue from other activities in 2016, only one increased the percentage of non-construction income in total revenue compared to 2015.
Chart 1.6.6: Share of revenue from other (non-construction) operations in total operating revenue (for 2016-2015)
2016
2015
Source: Financial statements of the reviewed companies for 2015 -2016
9.9%
no data
0.2%
0.0%
1.4%
6.5%
13.7%
9.2%
9.0%
14.2%
15.7%
19.4%
28.5%
8.2%
no data
no data
0.1%
0.5%
1.7%
3.4%
5.7%
7.9%
8.8%
14.0%
16.7%
17.8%
26.9%
0.0% 25.0% 50.0%
Mostostal Zabrze Group
Polimex-Mostostal Group
Elektrobudowa Group
Mirbud Group
Budimex Group
Unibep Group
Trakcja Group
PBG Group
Mota - Engil Central Europe S.A.
Warbud S.A.
Erbud Group
Mostostal Warszawa Group
Skanska S.A.
PORR Group
Strabag Group
Average
6.6%5.9%
Polish Construction Companies 2017 | Major Players, Key Growth Drivers and Development Prospects
26
An analysis of the aforesaid data shows clearly that still a relatively low share of revenue is earned on operations other than those directly related to the implementation of construction projects. This trend should reverse once projects receiving EU support in the second financialperspectivehavebeenfinalized.Itshould be emphasised, though, that large construction groups have already begun to diversify their business and invest in areas which are not directly related to construction or property development operations, such as property management, supply and installation of specialist industrial equipment or construction advisory and consulting services.
1.7. Market cap of the largest construction companies listed on the Warsaw Stock ExchangeFollowingasignificantincreaseinWIG Budownictwo is a subindex of Warsaw Stock Exchange Index (WIG) which submits only construction companies listed on WIG. index in 2015, the subsequent year saw a slowdown related to an overall decrease in construction and assembly related production, resulting mostly from delays in public procurement procedures regarding large infrastructural projects. In 2016, WIG BUD dropped by 1.5%. At the same time, WIG increased by more than 10%.
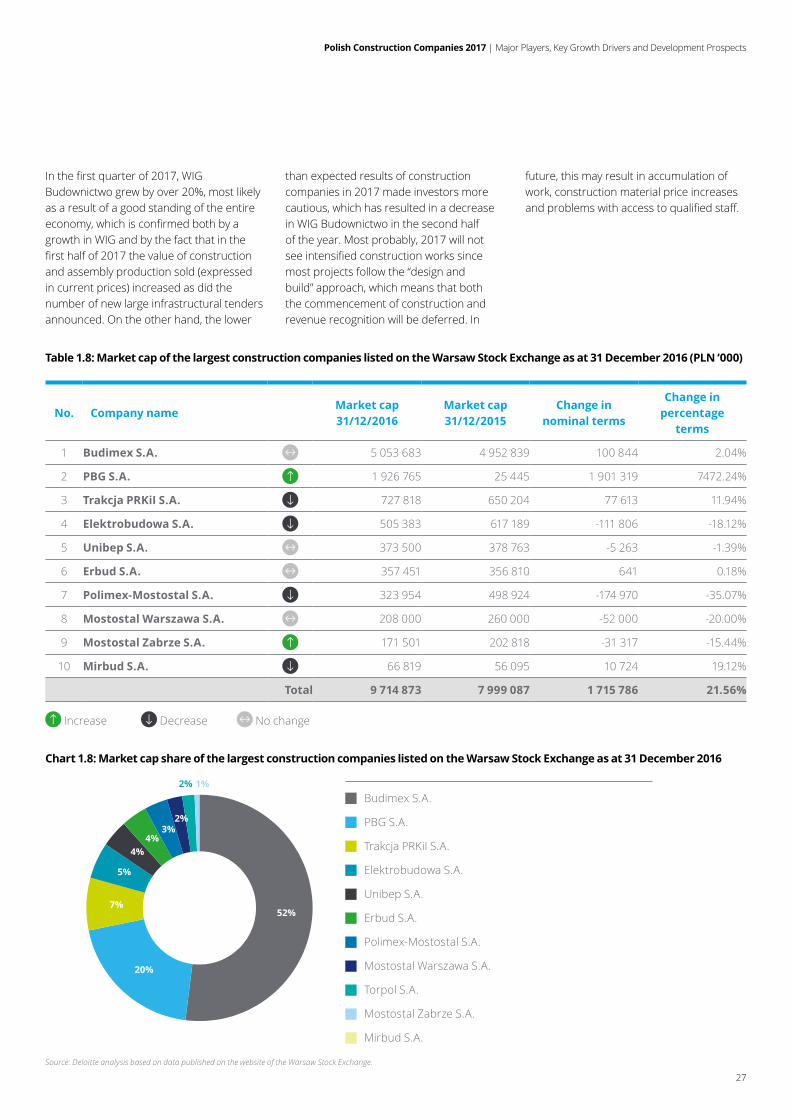
Tenoutofthefifteenlargestconstructioncompanies were listed on the Warsaw Stock Exchange. At the end of 2016, the combined market cap of the ten construction companies listed on the Warsaw Stock Exchange was PLN 9.7 billion and was PLN 1.7 billion higher than their combined market cap at the end of 2015. In percentage terms, the combined market cap rose by 21%. The substantial increase
resulted from an increase in the PBG Group market cap, which in turn had resulted from a composition agreement signed with creditors and completion of the bankruptcy procedure. With PBG excluded from the analysis, the total market cap of the listed companies included in the ranking would decreased by 2%.
Budimex, whose market cap was PLN 5,054 million (up by 2% as compared to 2015), whose share in the total cap of all companies presented in the table exceeds 50%, has been an unquestionable leader since 2011. The PBG Group has come second, and Trakcja PRKiL third, with market capitalisation of PLN 1,927 million and PLN 728 million, respectively.
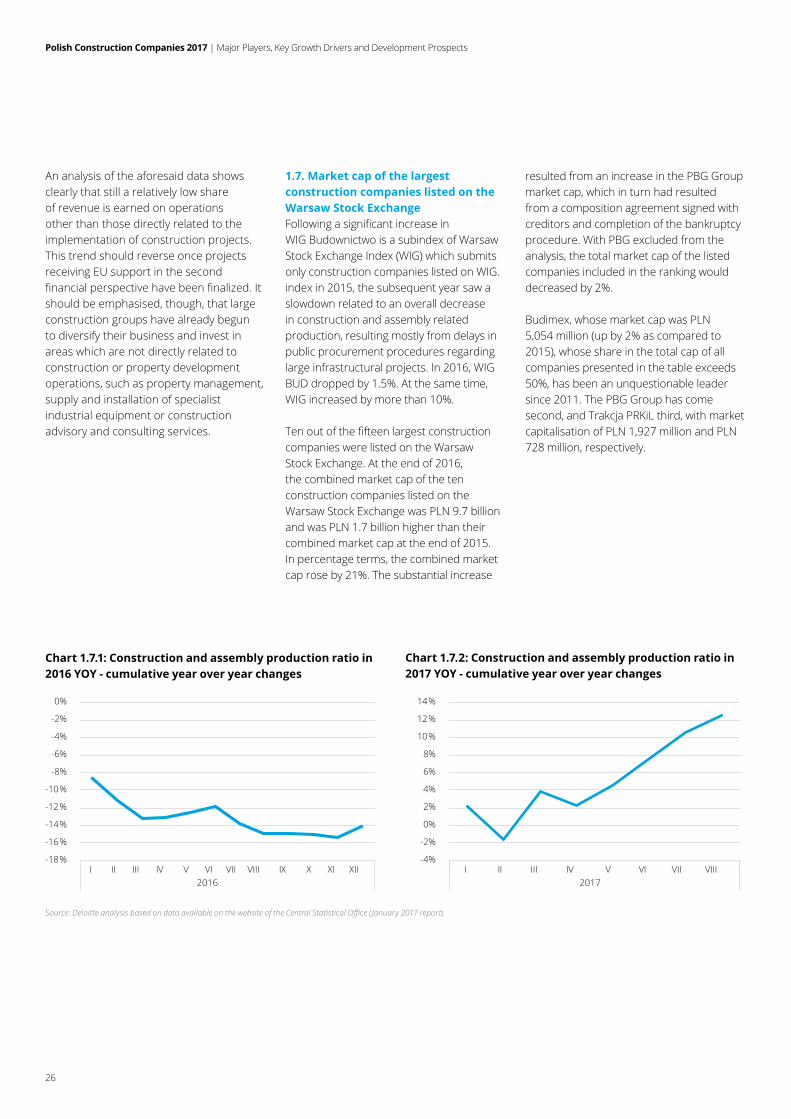
Chart 1.7.1: Construction and assembly production ratio in 2016 YOY - cumulative year over year changes
Source: Deloitte analysis based on data available on the website of the Central Statistical Office ( January 2017 report).
-18%
-16%
-14%
-12%
-10%
-8%
-6%
-4%
-2%
0%
I II III IV V VI VII VIII IX X XI XII-4%
-2%
0%
2%
4%
6%
8%
10%
12%
14%
I II III IV V VI VII VIII2016 2017
Chart 1.7.2: Construction and assembly production ratio in 2017 YOY - cumulative year over year changes
Polish Construction Companies 2017 | Major Players, Key Growth Drivers and Development Prospects
27
Inthefirstquarterof2017,WIGBudownictwo grew by over 20%, most likely as a result of a good standing of the entire economy,whichisconfirmedbothbyagrowth in WIG and by the fact that in the firsthalfof2017thevalueofconstructionand assembly production sold (expressed in current prices) increased as did the number of new large infrastructural tenders announced. On the other hand, the lower
than expected results of construction companies in 2017 made investors more cautious, which has resulted in a decrease in WIG Budownictwo in the second half of the year. Most probably, 2017 will not seeintensifiedconstructionworkssincemost projects follow the “design and build” approach, which means that both the commencement of construction and revenue recognition will be deferred. In
future, this may result in accumulation of work, construction material price increases andproblemswithaccesstoqualifiedstaff.
Table 1.8: Market cap of the largest construction companies listed on the Warsaw Stock Exchange as at 31 December 2016 (PLN ‘000)
No. Company nameMarket cap 31/12/2016
Market cap 31/12/2015
Change in nominal terms
Change in percentage
terms
1 Budimex S.A. 5 053 683 4 952 839 100 844 2.04%
2 PBG S.A. 1 926 765 25 445 1 901 319 7472.24%
3 Trakcja PRKiI S.A. 727 818 650 204 77 613 11.94%
4 Elektrobudowa S.A. 505 383 617 189 -111 806 -18.12%
5 Unibep S.A. 373 500 378 763 -5 263 -1.39%
6 Erbud S.A. 357 451 356 810 641 0.18%
7 Polimex-Mostostal S.A. 323 954 498 924 -174 970 -35.07%
8 Mostostal Warszawa S.A. 208 000 260 000 -52 000 -20.00%
9 Mostostal Zabrze S.A. 171 501 202 818 -31 317 -15.44%
10 Mirbud S.A. 66 819 56 095 10 724 19.12%
Total 9 714 873 7 999 087 1 715 786 21.56%
Increase Decrease No change
Chart 1.8: Market cap share of the largest construction companies listed on the Warsaw Stock Exchange as at 31 December 2016
Budimex S.A.
PBG S.A.
Trakcja PRKiI S.A.
Elektrobudowa S.A.
Unibep S.A.
Erbud S.A.
Polimex-Mostostal S.A.
Mostostal Warszawa S.A.
Torpol S.A.
Mostostal Zabrze S.A.
Mirbud S.A.
Source: Deloitte analysis based on data published on the website of the Warsaw Stock Exchange.
52%
20%
7%
5%
4%4%
3%2%
2% 1%
Polish Construction Companies 2017 | Major Players, Key Growth Drivers and Development Prospects
28
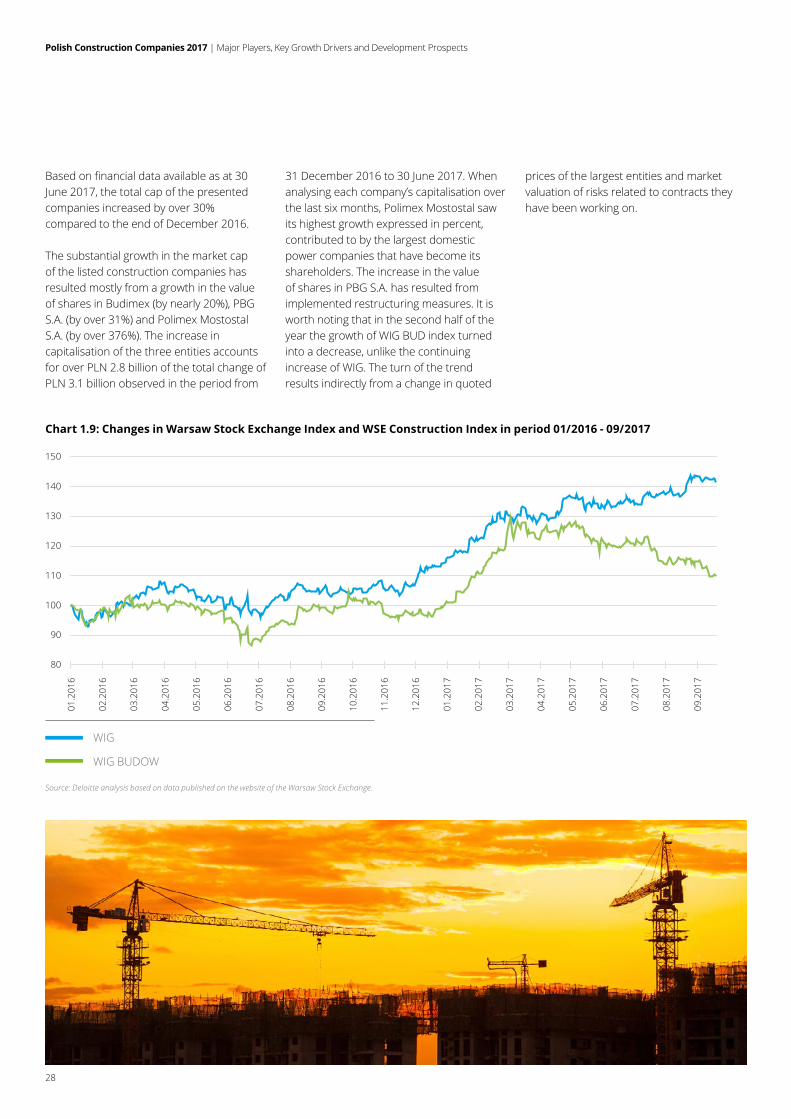
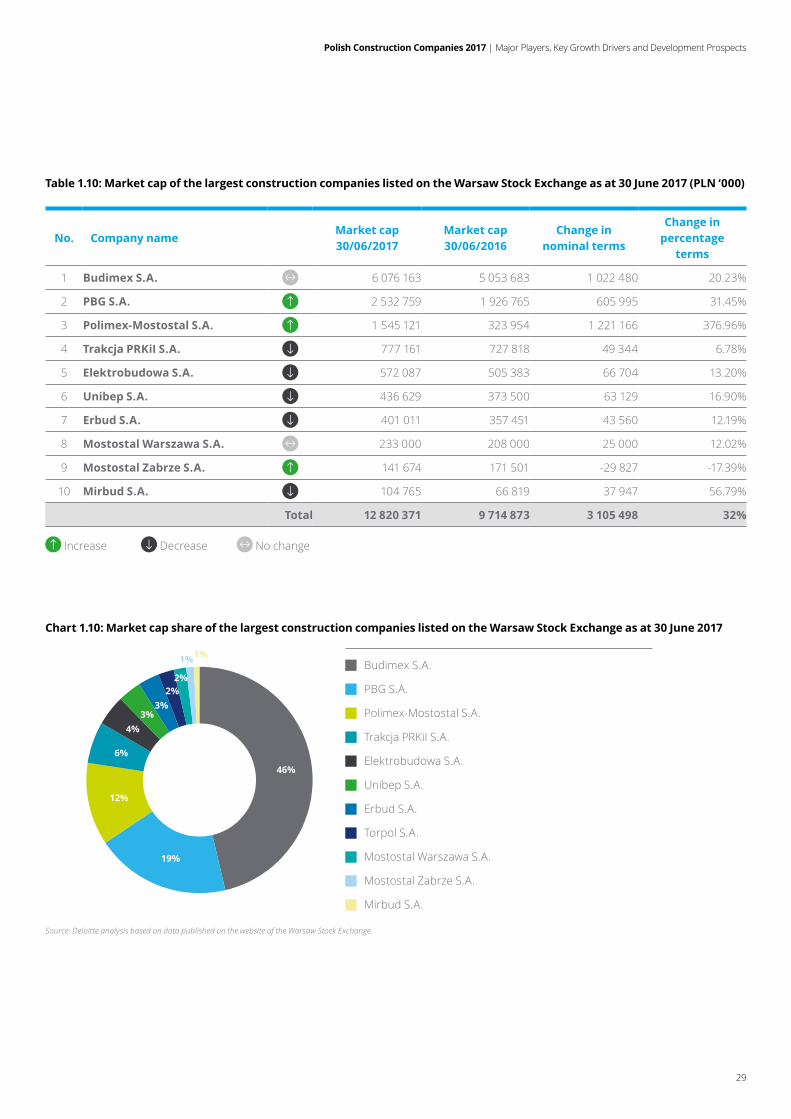
Basedonfinancialdataavailableasat30June 2017, the total cap of the presented companies increased by over 30% compared to the end of December 2016.
The substantial growth in the market cap of the listed construction companies has resulted mostly from a growth in the value of shares in Budimex (by nearly 20%), PBG S.A. (by over 31%) and Polimex Mostostal S.A. (by over 376%). The increase in capitalisation of the three entities accounts for over PLN 2.8 billion of the total change of PLN 3.1 billion observed in the period from
31 December 2016 to 30 June 2017. When analysing each company’s capitalisation over the last six months, Polimex Mostostal saw its highest growth expressed in percent, contributed to by the largest domestic power companies that have become its shareholders. The increase in the value of shares in PBG S.A. has resulted from implemented restructuring measures. It is worth noting that in the second half of the year the growth of WIG BUD index turned into a decrease, unlike the continuing increase of WIG. The turn of the trend results indirectly from a change in quoted
prices of the largest entities and market valuation of risks related to contracts they have been working on.
Chart 1.9: Changes in Warsaw Stock Exchange Index and WSE Construction Index in period 01/2016 - 09/2017
WIG
WIG BUDOW
Source: Deloitte analysis based on data published on the website of the Warsaw Stock Exchange.
80
90
100
110
120
130
140
150
01.2
016
02.2
016
03.2
016
04.2
016
05.2
016
06.2
016
07.2
016
08.2
016
09.2
016
10.2
016
11.2
016
12.2
016
01.2
017
02.2
017
03.2
017
04.2
017
05.2
017
06.2
017
07.2
017
08.2
017
09.2
017
Polish Construction Companies 2017 | Major Players, Key Growth Drivers and Development Prospects
29
Table 1.10: Market cap of the largest construction companies listed on the Warsaw Stock Exchange as at 30 June 2017 (PLN ‘000)
No. Company nameMarket cap 30/06/2017
Market cap 30/06/2016
Change in nominal terms
Change in percentage
terms
1 Budimex S.A. 6 076 163 5 053 683 1 022 480 20.23%
2 PBG S.A. 2 532 759 1 926 765 605 995 31.45%
3 Polimex-Mostostal S.A. 1 545 121 323 954 1 221 166 376.96%
4 Trakcja PRKiI S.A. 777 161 727 818 49 344 6.78%
5 Elektrobudowa S.A. 572 087 505 383 66 704 13.20%
6 Unibep S.A. 436 629 373 500 63 129 16.90%
7 Erbud S.A. 401 011 357 451 43 560 12.19%
8 Mostostal Warszawa S.A. 233 000 208 000 25 000 12.02%
9 Mostostal Zabrze S.A. 141 674 171 501 -29 827 -17.39%
10 Mirbud S.A. 104 765 66 819 37 947 56.79%
Total 12 820 371 9 714 873 3 105 498 32%
Increase Decrease No change
Chart 1.10: Market cap share of the largest construction companies listed on the Warsaw Stock Exchange as at 30 June 2017
Source: Deloitte analysis based on data published on the website of the Warsaw Stock Exchange.
Budimex S.A.
PBG S.A.
Polimex-Mostostal S.A.
Trakcja PRKiI S.A.
Elektrobudowa S.A.
Unibep S.A.
Erbud S.A.
Torpol S.A.
Mostostal Warszawa S.A.
Mostostal Zabrze S.A.
Mirbud S.A.
46%
19%
12%
6%
4%3%
3%2%
2%
1%1%
Polish Construction Companies 2017 | Major Players, Key Growth Drivers and Development Prospects
30
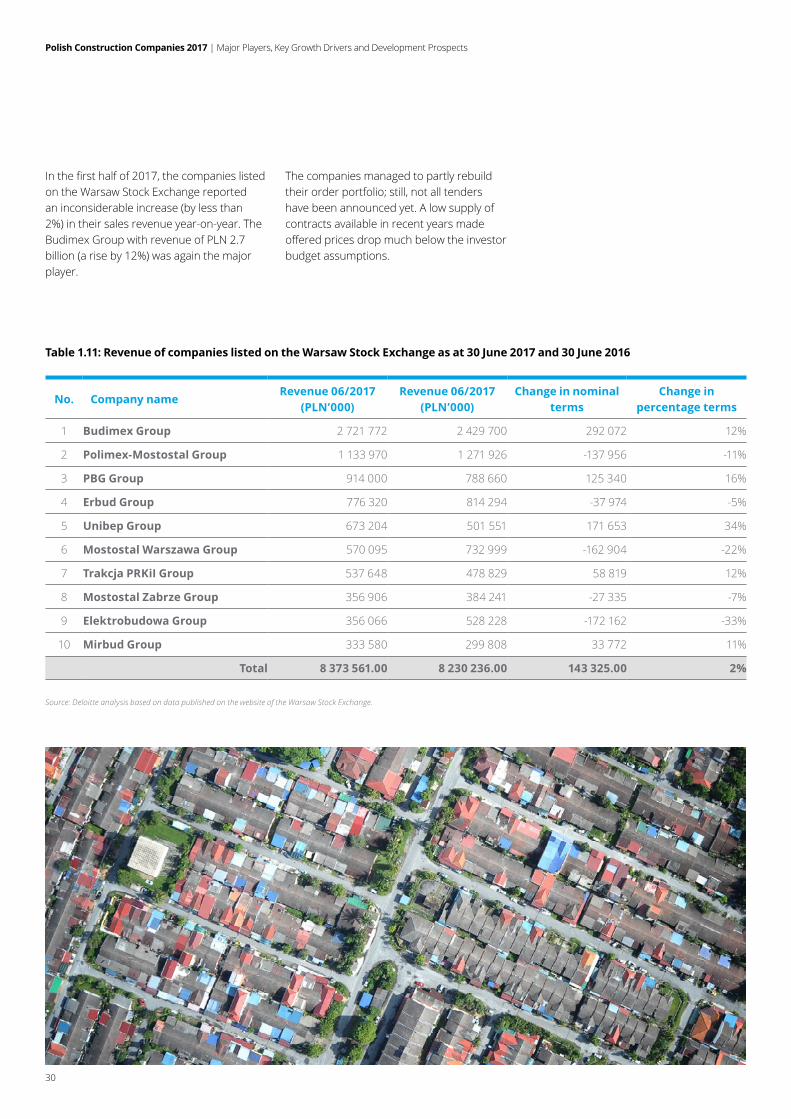
Inthefirsthalfof2017,thecompanieslistedon the Warsaw Stock Exchange reported an inconsiderable increase (by less than 2%) in their sales revenue year-on-year. The Budimex Group with revenue of PLN 2.7 billion (a rise by 12%) was again the major player.
The companies managed to partly rebuild their order portfolio; still, not all tenders have been announced yet. A low supply of contracts available in recent years made offeredpricesdropmuchbelowtheinvestorbudget assumptions.
Table 1.11: Revenue of companies listed on the Warsaw Stock Exchange as at 30 June 2017 and 30 June 2016
No. Company nameRevenue 06/2017
(PLN’000)Revenue 06/2017
(PLN’000)Change in nominal
terms Change in
percentage terms
1 Budimex Group 2 721 772 2 429 700 292 072 12%
2 Polimex-Mostostal Group 1 133 970 1 271 926 -137 956 -11%
3 PBG Group 914 000 788 660 125 340 16%
4 Erbud Group 776 320 814 294 -37 974 -5%
5 Unibep Group 673 204 501 551 171 653 34%
6 Mostostal Warszawa Group 570 095 732 999 -162 904 -22%
7 Trakcja PRKiI Group 537 648 478 829 58 819 12%
8 Mostostal Zabrze Group 356 906 384 241 -27 335 -7%
9 Elektrobudowa Group 356 066 528 228 -172 162 -33%
10 Mirbud Group 333 580 299 808 33 772 11%
Total 8 373 561.00 8 230 236.00 143 325.00 2%
Source: Deloitte analysis based on data published on the website of the Warsaw Stock Exchange.
Polish Construction Companies 2017 | Major Players, Key Growth Drivers and Development Prospects
31
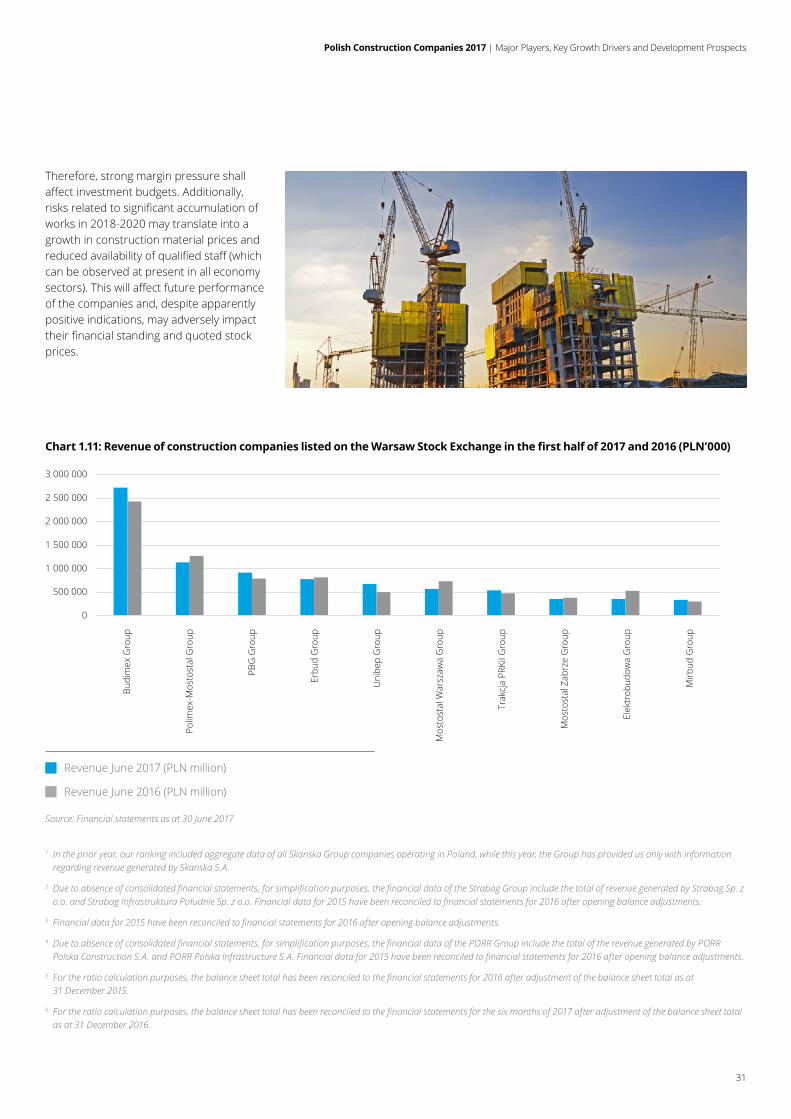
Chart 1.11: Revenue of construction companies listed on the Warsaw Stock Exchange in the first half of 2017 and 2016 (PLN’000)
Source: Financial statements as at 30 June 2017
Revenue June 2017 (PLN million)
Revenue June 2016 (PLN million)
0
500�000
1�000�000
1�500�000
2�000�000
2�500�000
3�000�000
Budi
mex
Gro
up
Polim
ex-M
osto
stal
Gro
up
PBG
Gro
up
Erbu
d G
roup
Uni
bep
Gro
up
Mos
tost
al W
arsz
awa
Gro
up
Trak
cja
PRKi
I Gro
up
Mos
tost
al Z
abrz
e G
roup
Elek
trob
udow
a G
roup
Mirb
ud G
roup
Therefore, strong margin pressure shall affectinvestmentbudgets.Additionally,risksrelatedtosignificantaccumulationofworks in 2018-2020 may translate into a growth in construction material prices and reducedavailabilityofqualifiedstaff(whichcan be observed at present in all economy sectors).Thiswillaffectfutureperformanceof the companies and, despite apparently positive indications, may adversely impact theirfinancialstandingandquotedstockprices.
1 In the prior year, our ranking included aggregate data of all Skanska Group companies operating in Poland, while this year, the Group has provided us only with information regarding revenue generated by Skanska S.A.
2 Due to absence of consolidated financial statements, for simplification purposes, the financial data of the Strabag Group include the total of revenue generated by Strabag Sp. z o.o. and Strabag Infrastruktura Południe Sp. z o.o. Financial data for 2015 have been reconciled to financial statements for 2016 after opening balance adjustments.
3 Financial data for 2015 have been reconciled to financial statements for 2016 after opening balance adjustments.
4 Due to absence of consolidated financial statements, for simplification purposes, the financial data of the PORR Group include the total of the revenue generated by PORR Polska Construction S.A. and PORR Polska Infrastructure S.A. Financial data for 2015 have been reconciled to financial statements for 2016 after opening balance adjustments.
5 For the ratio calculation purposes, the balance sheet total has been reconciled to the financial statements for 2016 after adjustment of the balance sheet total as at 31 December 2015.
6 For the ratio calculation purposes, the balance sheet total has been reconciled to the financial statements for the six months of 2017 after adjustment of the balance sheet total as at 31 December 2016.

Polish Construction Companies 2017 | Major Players, Key Growth Drivers and Development Prospects
32
Polish Construction Companies 2017 | Major Players, Key Growth Drivers and Development Prospects
33
Section 2. Prospects
for development of construction
companies in Poland
Polish Construction Companies 2017 | Major Players, Key Growth Drivers and Development Prospects
34
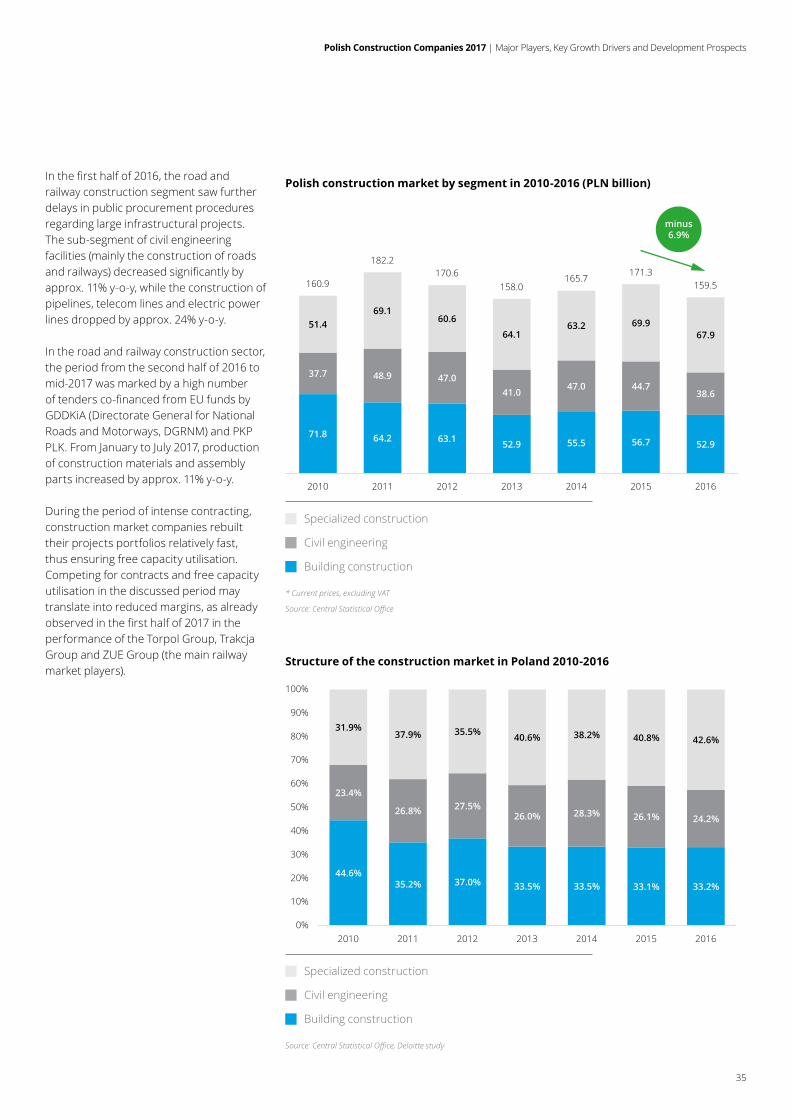
2.1. IntroductionIn 2016, the construction market value decreased by 6.9% to PLN 159.5 billion in relation to PLN 171.3 billion in 2015. Nevertheless, the market standing was differentindifferentmarketsegments.Thus, evaluation of the observed trends requires an individual approach to each segment. The building construction segment saw record-high apartment sales levels; at the same time, the railway and road construction segment rebounded only in the second half of 2016 due to deferred public procurement procedures co-financedwithEUfunds.
In 2016, a record-high number of apartmentswasofferedandsold.About62,000 apartments were sold in the six largest agglomerations (Warsaw, Kraków,Wrocław,Tricity,PoznańandŁódź)comparedtoapprox.52,000in20151. The demand was contributed to by continuing low interest rates, high availability of mortgage loans, growth in salaries and wages, as well as by decreasing unemployment. Apartment purchases for investment purposes contributed to the demand increase, in particular in districts of large cities with well-developed transportation systems. The percentage of apartments purchased for cash in large cities (mostly for investment purposes) has approximated 40%.
According to REAS projections, in 2017 the number of apartments sold in key agglomerations shall approximate 72,000, denoting a 16% increase year-on-year. An 18% increase in WIG Deweloperzy duringthefirstninemonthsof2017hasconfirmedthegoodstandingofthissector.The projected growth of the residential construction market
seems to be well-founded taking into account the following factors:
• prices per square meter being relatively stablewith a slight tendency to grow;
• land banks built by property developers to secure future investments;
• about 75% of apartments to be completed in 2017 being sold already;
• apartment sizes being better adjusted to financialcapabilityofclients;
• own contribution required by mortgage loan providers.
2016 was another year of record high supplyofofficespaceinPoland.Atpresent,officespaceavailableinPolandapproximates 9 million sq. m, out of which nearly 5 million sq. m located in Warsaw. In 2016,800,000sq.mofofficespacewerecommissioned, half of which in Warsaw. According to statistics, though, compared toWesternEurope,thePolishofficespacemarketisnotsaturatedyet(e.g.officespaceavailable in Munich equals 22 million sq. m). In the coming years, demand for new officespaceshouldbesupportedbysuchfactors as being the largest economy in the region, infrastructure development owing to access to EU funds, well educated labour, and universities in large cities supplying labourmarketwitheducatedstaff.
The standing of the retail and service space market was good. In 2016, it increased by o 470,000 sq. m. A supply growth projected for 2017 is 400,000 sq. m, out of which 360,000 sq. m being already in progress. A tax on retail sales or Sunday trade ban/limitation, if introduced, may adversely impact the market growth. On the other hand, growth in salaries and reduced unemployment may counteract the negative trend.
1 REAS, 2016
Polish Construction Companies 2017 | Major Players, Key Growth Drivers and Development Prospects
35
Inthefirsthalfof2016,theroadandrailway construction segment saw further delays in public procurement procedures regarding large infrastructural projects. The sub-segment of civil engineering facilities (mainly the construction of roads andrailways)decreasedsignificantlybyapprox. 11% y-o-y, while the construction of pipelines, telecom lines and electric power lines dropped by approx. 24% y-o-y.
In the road and railway construction sector, the period from the second half of 2016 to mid-2017 was marked by a high number oftendersco-financedfromEUfundsbyGDDKiA (Directorate General for National Roads and Motorways, DGRNM) and PKP PLK. From January to July 2017, production of construction materials and assembly parts increased by approx. 11% y-o-y.
During the period of intense contracting, construction market companies rebuilt their projects portfolios relatively fast, thus ensuring free capacity utilisation. Competing for contracts and free capacity utilisation in the discussed period may translate into reduced margins, as already observedinthefirsthalfof2017intheperformance of the Torpol Group, Trakcja Group and ZUE Group (the main railway market players).
71.8 64.2 63.1 52.9 55.5 56.7 52.9
37.7 48.9 47.041.0 47.0 44.7
38.6
51.469.1
60.6
64.163.2 69.9
67.9
160.9
182.2170.6
158.0165.7
171.3159.5
2010 2011 2012 2013 2014 2015 2016
minus6.9%
Specialized construction
Civil engineering
Building construction
* Current prices, excluding VAT
Source: Central Statistical Office
Polish construction market by segment in 2010-2016 (PLN billion)
44.6%35.2% 37.0% 33.5% 33.5% 33.1% 33.2%
23.4%
26.8% 27.5%26.0% 28.3% 26.1% 24.2%
31.9%37.9% 35.5% 40.6% 38.2% 40.8% 42.6%
0%
10%
20%
30%
40%
50%
60%
70%
80%
90%
100%
2010 2011 2012 2013 2014 2015 2016
Structure of the construction market in Poland 2010-2016
Specialized construction
Civil engineering
Building construction
Source: Central Statistical Office, Deloitte study
Polish Construction Companies 2017 | Major Players, Key Growth Drivers and Development Prospects
36
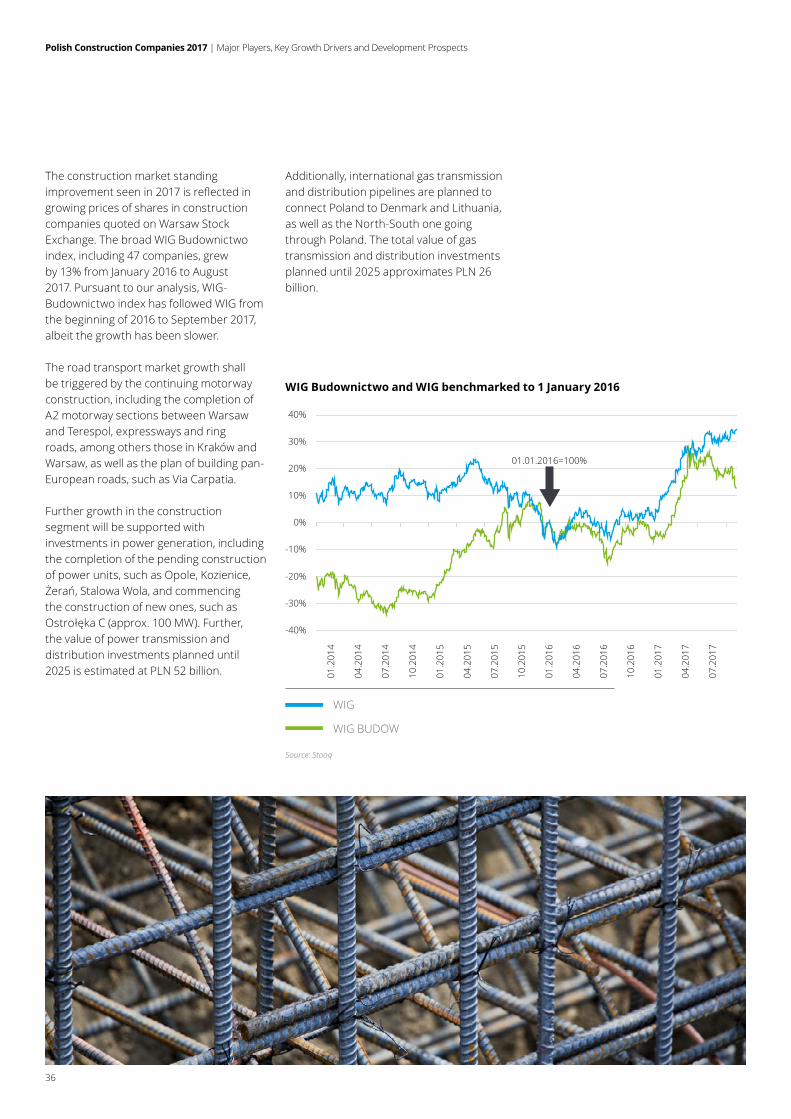
The construction market standing improvementseenin2017isreflectedingrowing prices of shares in construction companies quoted on Warsaw Stock Exchange. The broad WIG Budownictwo index, including 47 companies, grew by 13% from January 2016 to August 2017. Pursuant to our analysis, WIG-Budownictwo index has followed WIG from the beginning of 2016 to September 2017, albeit the growth has been slower.
The road transport market growth shall be triggered by the continuing motorway construction, including the completion of A2 motorway sections between Warsaw and Terespol, expressways and ring roads, among others those in Kraków and Warsaw, as well as the plan of building pan-European roads, such as Via Carpatia.
Further growth in the construction segment will be supported with investments in power generation, including the completion of the pending construction of power units, such as Opole, Kozienice, Żerań,StalowaWola,andcommencingthe construction of new ones, such as OstrołękaC(approx.100MW).Further,the value of power transmission and distribution investments planned until 2025 is estimated at PLN 52 billion.
-40%
-30%
-20%
-10%
0%
10%
20%
30%
40%
01.2
014
04.2
014
07.2
014
10.2
014
01.2
015
04.2
015
07.2
015
10.2
015
01.2
016
04.2
016
07.2
016
10.2
016
01.2
017
04.2
017
07.2
017
01.01.2016=100%
WIG Budownictwo and WIG benchmarked to 1 January 2016
Source: Stooq
Additionally, international gas transmission and distribution pipelines are planned to connect Poland to Denmark and Lithuania, as well as the North-South one going through Poland. The total value of gas transmission and distribution investments planned until 2025 approximates PLN 26 billion.
WIG
WIG BUDOW
Polish Construction Companies 2017 | Major Players, Key Growth Drivers and Development Prospects
37
Long-term plans include the Central Airport with initial estimated costs of PLN 20-30 billion and a nuclear power plant. The above investments have not been confirmedasatthereportdate.Accordingto press reports, the future planned capacity of the nuclear power plant shall range from 3,000 MW to 6,000 MW. The estimated cost of the power unit with 1,000 MW capacity is PLN 16 billion (including both technological and construction aspects).
Bearing in mind the good standing of the construction market in 2017-2020 with the perspective until 2022, the industry seems to face the following challenges:
• Limited access to labour and increased pressure on salaries/wages. The number of construction sector employees is much lower than in 2009-2012, when the EURO 2012 related peak, and the average employment in the sector approximated 450 000 - 480 000 in 2009-2012 compared to approx. 390 000 in the period from 2016 to Q1 2017. At the same time, BAEL2 unemploymentratedroppedinthefirstquarter of 2017 by 0.4 p.p. y-o-y and reached the level of 5.2%.2Inthefirstquarter 2017, the average annual pay in the construction sector increased 2017 faster than the national average, i.e. by 5.5% vs. 4.3%. Hiring foreign construction workers, mostly Ukrainians, is a common practice. The opening of Western countries for Ukrainians may adversely affectavailabilityoflow-qualifiedworkers, among others in the building construction segment, where the share of technologically advanced work is lower.
Construction sector
Estimated expenditure (PLN billion)
Comment Years
1 Roads (1)
approx. 196National
Road Building Programme
2014-2023 (with perspective until
2025)
11Local
government roads
2 Railways (2) approx. 65 2017-2022
3Power generation (3)
approx. 41Includes
technological aspects
2017-2020
4Power transmission and distribution (4)
approx. 52Includes
technological aspects
2016-2025
5Gas transmission and distribution (5)
ok. 31-32Includes
technological aspects
2016-2025
(1) National Road Building Programme for 2014-2023 (with projections by 2025)
(2) National Railway Programme by 2023
(3) Strategies of Energa, Enea, PGE, Tauron
(4) PSE, key distribution companies
(5) Gaz System, PGNiG, PSG, Lotos Group
Since the expenditure planned in the road and railway segment for 2017-2020 is higher than before EURO 2012 and the other segments are in a good standing, the limited access toqualifiedlabourmayincreasethepressure on pays, or even cause delays inconstructionworksduetodeficitofemployees.
• Re-opening tender procedures as a result of exceeding investor budgets. The peaking number of tenders in the road and railway construction segment may result in cancelling some of them when submitted bids include exceeded investor budgets (the trend has been already observed). Construction companies, having replenished their order portfolios, have been including
the substantial increase in the volume of construction works expected in the coming years in their contract prices, which may result in an increase in the costs of subcontracting and materials. Market players believe that investor budgetsshouldbetterreflectmarketexpectations to avoid possible delays in completion of future public procurement procedures as a result of exceeding the limits.
2 Employment according to Economic Activity Survey (BAEL)
Polish Construction Companies 2017 | Major Players, Key Growth Drivers and Development Prospects
38
• Limiting bid evaluation criteria to price. In mid-2016 the 60/40 tender criterion was introduced, according to which the maximum price weight for a bid is 60%, while quality criteria account for the other 40%. The most frequent practice adopted by public bodies is to consider the guarantee terms and delivery date as the key quality criteria. Consequently, the lowest price remains the key condition, since all tender participants usually adopt the maximum permitted guarantee period and the shortest possible contract delivery deadline.
Making the price the only bid assessment criterion may result in difficultiesincontractdelivery,inparticular in light of growing prices of materials and labour. Black scenarios may include a replay of that preceding EURO 2012, i.e. bankruptcies of selected construction market players.
• Limited supply of construction materials, in particular in the railway construction segment. Construction market players are concerned about a potential bottleneck in the form of limited supply of special construction materials, such as ties. The time-consuming construction material attestation procedure and capacity increase processes may result in a shortage of certain construction materials, and delays in completion of planned infrastructural investments.
Limited supply of construction materials may result in delays in construction contract completion and price increases, which in turn will translate in reduced contractor margins.
• Adverse traffic changes.Intensifiedconstruction works necessitating railway trafficchangesmayresultinnegativepublicity, in particular if causing adverse effectsincargotransport(amongothersof aggregates), which may increase their transport costs.
Costs of railway transport of selected materials, including aggregates, may increaseasaresultofdifficultiescausedby ongoing modernisation works.
• Organising construction sites in accordance with “design and build” formula. The Designing Period may take from a few months to over a year and is usually long due to questions regarding the tender documentation, asked by potential contractors.
On the one hand, “design and build” approachallowcontractorsefficienciesowing to their participation in the designing procedure; on the other hand, though, they often involve an extended tender procedure.
Developing and accepting a template agreementthatreflectsbothclient’sandcontractor’s interests and guidelines regarding tender description and procedures is an important factor that may facilitate the completion of road and railway investments. In February 2017, the Ministry of Infrastructure and Construction adopted “New Road Construction Standards” that provide a general framework for road construction projects. The ongoing work includes a draft agreement with contractors to comprise:
• risk sharing;
• independence of third-party engineers;
• protection of sub-contractors;
• reduced number of disputes and faster settlement procedures;
• rationalised system of liquidated damages;
• obligation to conclude employment contracts.
An Expert Council has been established to facilitate the completion of railway investments, with the objective to optimise the investment process. The Council wants tointroduceaunifiedtemplateagreementfor all railway investments. Although certain ideas have been implemented, certain issues, such as the payment model fortheengineer,unifiedinterpretationofcurrentlegalregulations,certificationoftender participants or bid selection criteria applicable to railway accessibility, remain unsolved.
Positive projections for the period until 2020 regarding selected macroeconomic indicators, such as economic growth and national debt, support the good standing of the construction segment, which in medium term may translate into improved access to funding from the State budget, also for infrastructural investments.
In a long term, after 2020, with reduced EU funds, development of infrastructure maintenance services and use of alternative funding sources such as PPP, provide the opportunities to be looked for to sustain the road and railway investments in Poland. The Ministry of Infrastructure and Construction plans to update the transport strategy, extending its perspective, indicating strategic projects and aiming at stabilisation of the road construction market with the annual investment value approximating PLN 15 billion to PLN 17 billion over a long term, following the completion of projects included in the current EU perspective.
Polish Construction Companies 2017 | Major Players, Key Growth Drivers and Development Prospects
39
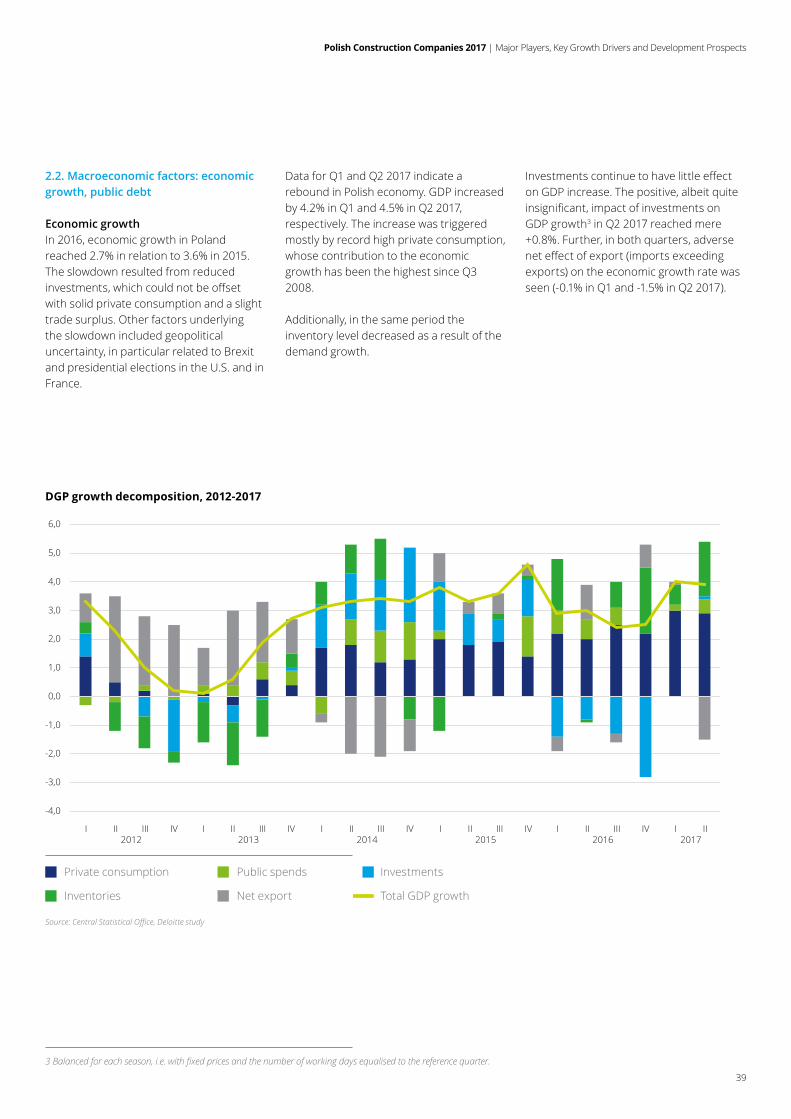
DGP growth decomposition, 2012-2017
2.2. Macroeconomic factors: economic growth, public debt
Economic growthIn 2016, economic growth in Poland reached 2.7% in relation to 3.6% in 2015. The slowdown resulted from reduced investments,whichcouldnotbeoffsetwith solid private consumption and a slight trade surplus. Other factors underlying the slowdown included geopolitical uncertainty, in particular related to Brexit and presidential elections in the U.S. and in France.
Data for Q1 and Q2 2017 indicate a rebound in Polish economy. GDP increased by 4.2% in Q1 and 4.5% in Q2 2017, respectively. The increase was triggered mostly by record high private consumption, whose contribution to the economic growth has been the highest since Q3 2008.
Additionally, in the same period the inventory level decreased as a result of the demand growth.
Investmentscontinuetohavelittleeffecton GDP increase. The positive, albeit quite insignificant,impactofinvestmentsonGDP growth3 in Q2 2017 reached mere +0.8%. Further, in both quarters, adverse neteffectofexport(importsexceedingexports) on the economic growth rate was seen (-0.1% in Q1 and -1.5% in Q2 2017).
-4,0
-3,0
-2,0
-1,0
0,0
1,0
2,0
3,0
4,0
5,0
6,0
I II III IV2012
I II III IV2013
I II III IV2014
I II III IV2015
I II III IV2016
I II2017
Private consumption Public spends Investments
Inventories Net export Total GDP growth
3 Balanced for each season, i.e. with fixed prices and the number of working days equalised to the reference quarter.
Source: Central Statistical Office, Deloitte study
Polish Construction Companies 2017 | Major Players, Key Growth Drivers and Development Prospects
40
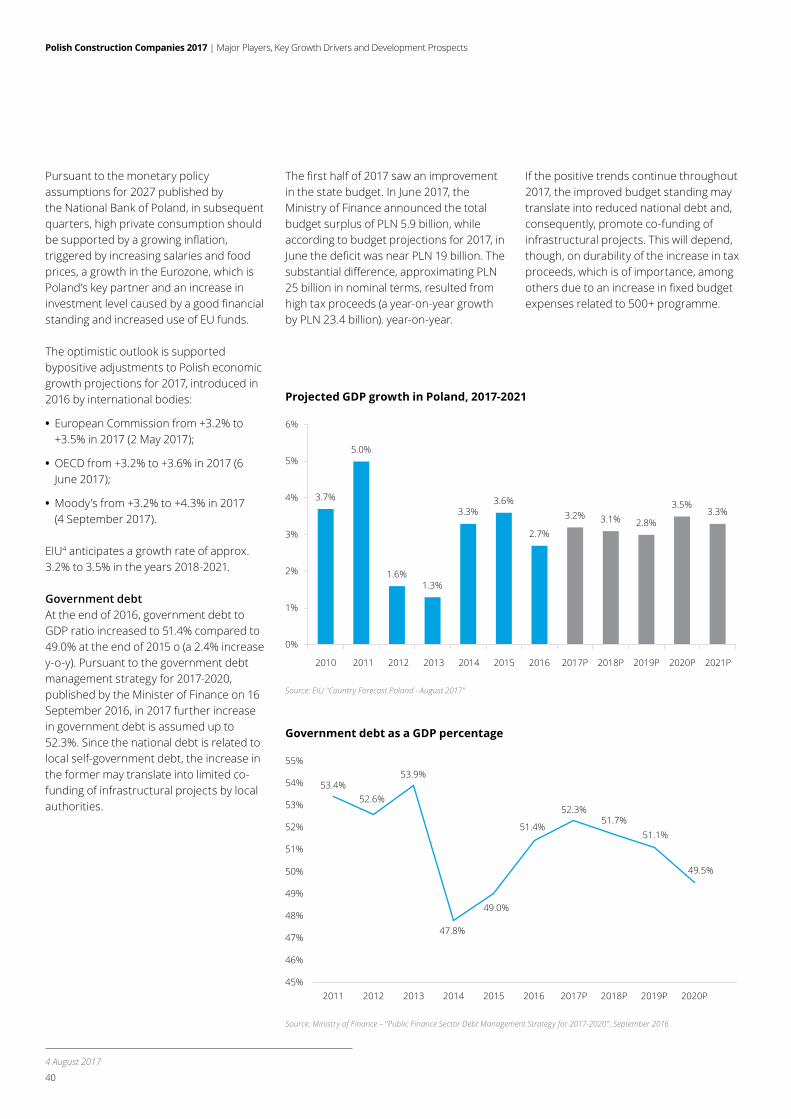
Projected GDP growth in Poland, 2017-2021
Pursuant to the monetary policy assumptions for 2027 published by the National Bank of Poland, in subsequent quarters, high private consumption should besupportedbyagrowinginflation,triggered by increasing salaries and food prices, a growth in the Eurozone, which is Poland’s key partner and an increase in investmentlevelcausedbyagoodfinancialstanding and increased use of EU funds.
The optimistic outlook is supported bypositive adjustments to Polish economic growth projections for 2017, introduced in 2016 by international bodies:
• European Commission from +3.2% to +3.5% in 2017 (2 May 2017);
• OECD from +3.2% to +3.6% in 2017 (6 June 2017);
• Moody’s from +3.2% to +4.3% in 2017 (4 September 2017).
EIU4 anticipates a growth rate of approx. 3.2% to 3.5% in the years 2018-2021.
Government debtAt the end of 2016, government debt to GDP ratio increased to 51.4% compared to 49.0% at the end of 2015 o (a 2.4% increase y-o-y). Pursuant to the government debt management strategy for 2017-2020, published by the Minister of Finance on 16 September 2016, in 2017 further increase in government debt is assumed up to 52.3%. Since the national debt is related to local self-government debt, the increase in the former may translate into limited co-funding of infrastructural projects by local authorities.
Thefirsthalfof2017sawanimprovementin the state budget. In June 2017, the Ministry of Finance announced the total budget surplus of PLN 5.9 billion, while according to budget projections for 2017, in JunethedeficitwasnearPLN19billion.Thesubstantialdifference,approximatingPLN25 billion in nominal terms, resulted from high tax proceeds (a year-on-year growth by PLN 23.4 billion). year-on-year.
If the positive trends continue throughout 2017, the improved budget standing may translate into reduced national debt and, consequently, promote co-funding of infrastructural projects. This will depend, though, on durability of the increase in tax proceeds, which is of importance, among othersduetoanincreaseinfixedbudgetexpenses related to 500+ programme.
3.7%
5.0%
1.6%1.3%
3.3%3.6%
2.7%
3.2% 3.1% 2.8%
3.5%3.3%
0%
1%
2%
3%
4%
5%
6%
2010 2011 2012 2013 2014 2015 2016 2017P 2018P 2019P 2020P 2021P
53.4%52.6%
53.9%
47.8%
49.0%
51.4%
52.3%51.7%
51.1%
49.5%
45%
46%
47%
48%
49%
50%
51%
52%
53%
54%
55%
2011 2012 2013 2014 2015 2016 2017P 2018P 2019P 2020P
Source: EIU "Country Forecast Poland - August 2017"
Government debt as a GDP percentage
Source: Ministry of Finance – “Public Finance Sector Debt Management Strategy for 2017-2020”, September 2016
4 August 2017
Polish Construction Companies 2017 | Major Players, Key Growth Drivers and Development Prospects
41
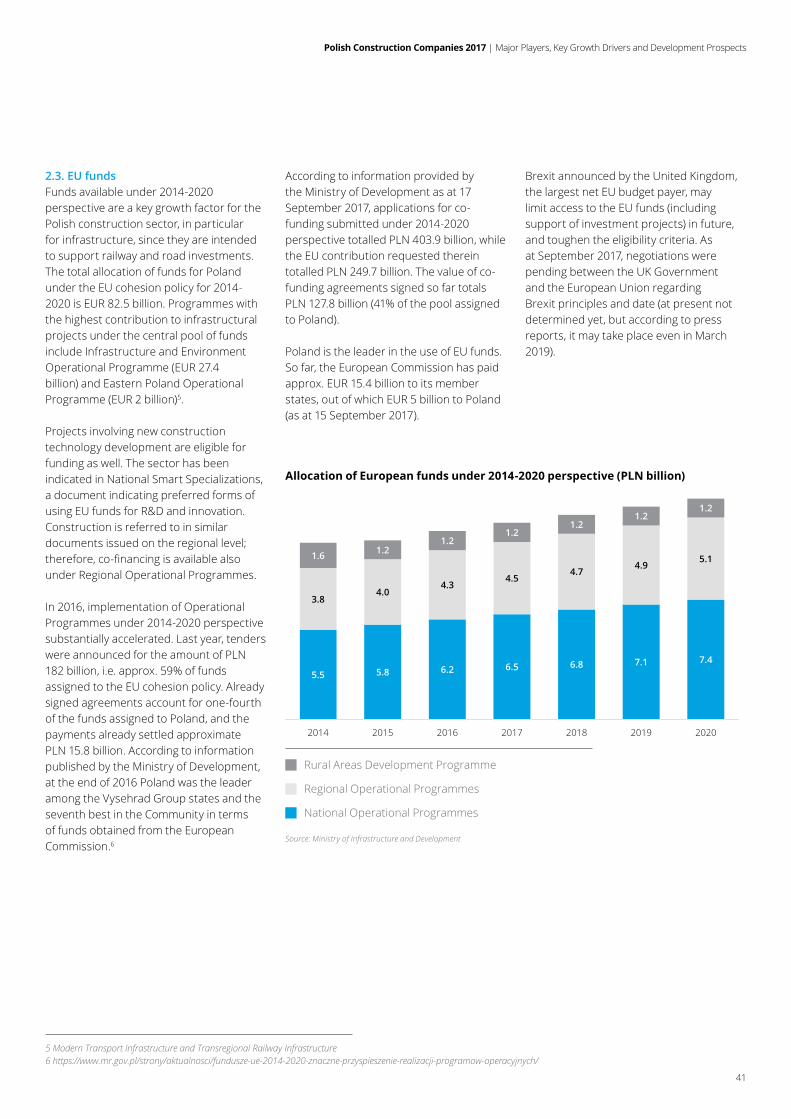
Allocation of European funds under 2014-2020 perspective (PLN billion)
Source: Ministry of Infrastructure and Development
2.3. EU fundsFunds available under 2014-2020 perspective are a key growth factor for the Polish construction sector, in particular for infrastructure, since they are intended to support railway and road investments. The total allocation of funds for Poland under the EU cohesion policy for 2014-2020 is EUR 82.5 billion. Programmes with the highest contribution to infrastructural projects under the central pool of funds include Infrastructure and Environment Operational Programme (EUR 27.4 billion) and Eastern Poland Operational Programme (EUR 2 billion)5.
Projects involving new construction technology development are eligible for funding as well. The sector has been indicated in National Smart Specializations, a document indicating preferred forms of using EU funds for R&D and innovation. Construction is referred to in similar documents issued on the regional level; therefore,co-financingisavailablealsounder Regional Operational Programmes.
In 2016, implementation of Operational Programmes under 2014-2020 perspective substantially accelerated. Last year, tenders were announced for the amount of PLN 182 billion, i.e. approx. 59% of funds assigned to the EU cohesion policy. Already signed agreements account for one-fourth of the funds assigned to Poland, and the payments already settled approximate PLN 15.8 billion. According to information published by the Ministry of Development, at the end of 2016 Poland was the leader among the Vysehrad Group states and the seventh best in the Community in terms of funds obtained from the European Commission.6
5.5 5.8 6.2 6.5 6.8 7.1 7.4
3.84.0
4.34.5
4.74.9
5.11.6 1.21.2
1.21.2
1.21.2
2014 2015 2016 2017 2018 2019 2020
Rural Areas Development Programme
Regional Operational Programmes
National Operational Programmes
According to information provided by the Ministry of Development as at 17 September 2017, applications for co-funding submitted under 2014-2020 perspective totalled PLN 403.9 billion, while the EU contribution requested therein totalled PLN 249.7 billion. The value of co-funding agreements signed so far totals PLN 127.8 billion (41% of the pool assigned to Poland).
Poland is the leader in the use of EU funds. So far, the European Commission has paid approx. EUR 15.4 billion to its member states, out of which EUR 5 billion to Poland (as at 15 September 2017).
Brexit announced by the United Kingdom, the largest net EU budget payer, may limit access to the EU funds (including support of investment projects) in future, and toughen the eligibility criteria. As at September 2017, negotiations were pending between the UK Government and the European Union regarding Brexit principles and date (at present not determined yet, but according to press reports, it may take place even in March 2019).
5 Modern Transport Infrastructure and Transregional Railway Infrastructure6 https://www.mr.gov.pl/strony/aktualnosci/fundusze-ue-2014-2020-znaczne-przyspieszenie-realizacji-programow-operacyjnych/
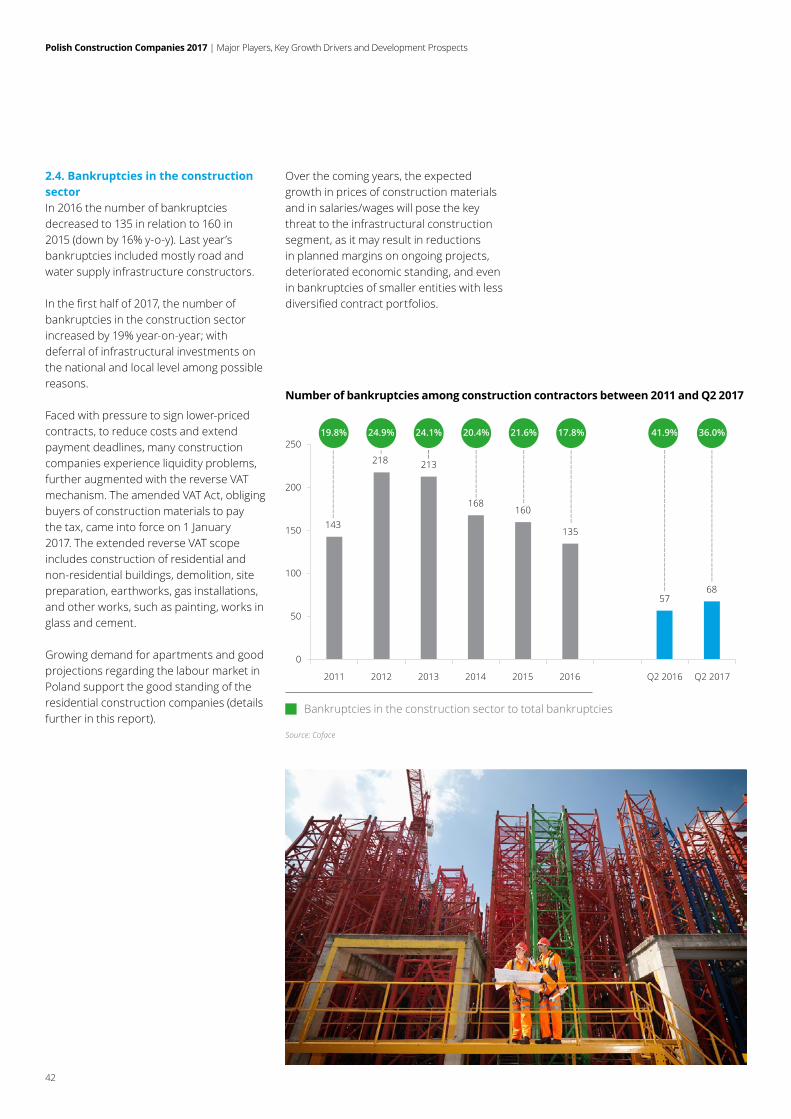
Polish Construction Companies 2017 | Major Players, Key Growth Drivers and Development Prospects
42
Number of bankruptcies among construction contractors between 2011 and Q2 2017
2.4. Bankruptcies in the construction sector In 2016 the number of bankruptcies decreased to 135 in relation to 160 in 2015 (down by 16% y-o-y). Last year’s bankruptcies included mostly road and water supply infrastructure constructors.
Inthefirsthalfof2017,thenumberofbankruptcies in the construction sector increased by 19% year-on-year; with deferral of infrastructural investments on the national and local level among possible reasons.
Faced with pressure to sign lower-priced contracts, to reduce costs and extend payment deadlines, many construction companies experience liquidity problems, further augmented with the reverse VAT mechanism. The amended VAT Act, obliging buyers of construction materials to pay the tax, came into force on 1 January 2017. The extended reverse VAT scope includes construction of residential and non-residential buildings, demolition, site preparation, earthworks, gas installations, and other works, such as painting, works in glass and cement.
Growing demand for apartments and good projections regarding the labour market in Poland support the good standing of the residential construction companies (details further in this report).
Over the coming years, the expected growth in prices of construction materials and in salaries/wages will pose the key threat to the infrastructural construction segment, as it may result in reductions in planned margins on ongoing projects, deteriorated economic standing, and even in bankruptcies of smaller entities with less diversifiedcontractportfolios.
143
218 213
168160
135
5768
0
50
100
150
200
250
2011 2012 2013 2014 2015 2016 Q2 2016 Q2 2017
19.8% 24.9% 24.1% 20.4% 21.6% 17.8% 41.9% 36.0%
Source: Coface
Bankruptcies in the construction sector to total bankruptcies
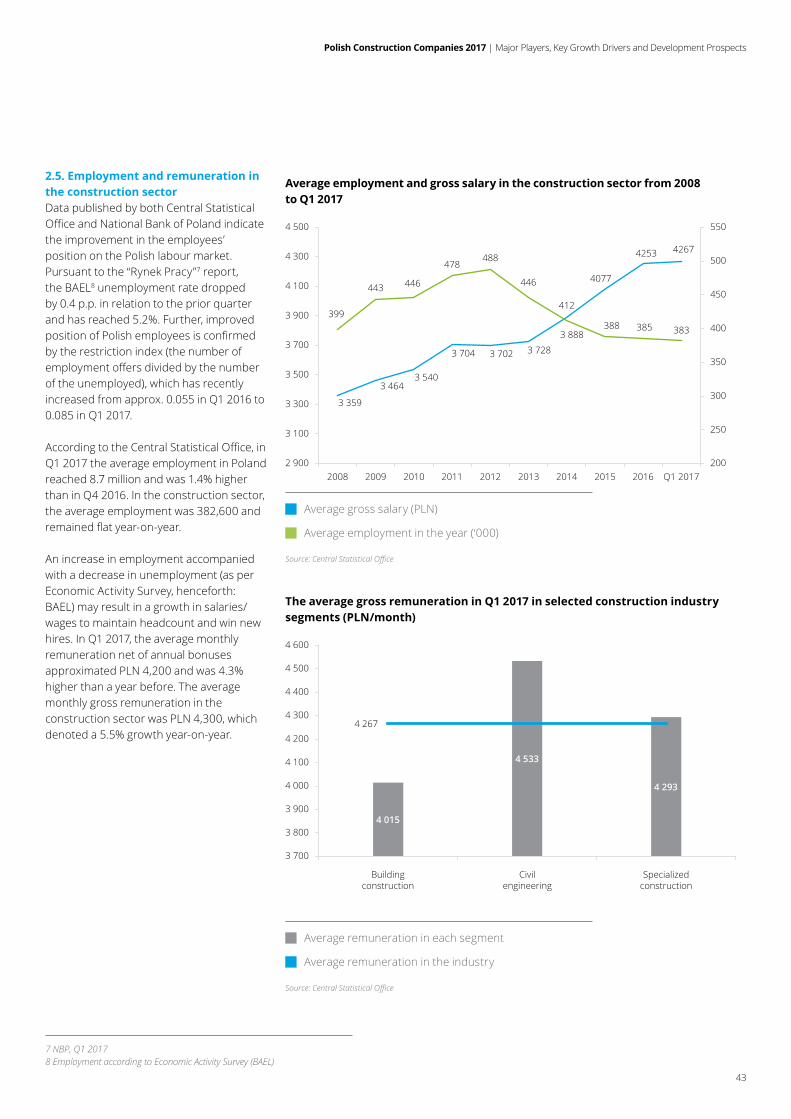
Polish Construction Companies 2017 | Major Players, Key Growth Drivers and Development Prospects
43
2.5. Employment and remuneration in the construction sectorData published by both Central Statistical OfficeandNationalBankofPolandindicatethe improvement in the employees’ position on the Polish labour market. Pursuant to the “Rynek Pracy”7 report, the BAEL8 unemployment rate dropped by 0.4 p.p. in relation to the prior quarter and has reached 5.2%. Further, improved positionofPolishemployeesisconfirmedby the restriction index (the number of employmentoffersdividedbythenumberof the unemployed), which has recently increased from approx. 0.055 in Q1 2016 to 0.085 in Q1 2017.
AccordingtotheCentralStatisticalOffice,inQ1 2017 the average employment in Poland reached 8.7 million and was 1.4% higher than in Q4 2016. In the construction sector, the average employment was 382,600 and remainedflatyear-on-year.
An increase in employment accompanied with a decrease in unemployment (as per Economic Activity Survey, henceforth: BAEL) may result in a growth in salaries/wages to maintain headcount and win new hires. In Q1 2017, the average monthly remuneration net of annual bonuses approximated PLN 4,200 and was 4.3% higher than a year before. The average monthly gross remuneration in the construction sector was PLN 4,300, which denoted a 5.5% growth year-on-year.
3 359
3 4643 540
3 704 3 702 3 728
3 888
4077
4253 4267
399
443 446
478488
446
412
388 385 383
200
250
300
350
400
450
500
550
2 900
3 100
3 300
3 500
3 700
3 900
4 100
4 300
4 500
2008 2009 2010 2011 2012 2013 2014 2015 2016 Q1 2017
4 015
4 533
4 293
4 267
3 700
3 800
3 900
4 000
4 100
4 200
4 300
4 400
4 500
4 600
Buildingconstruction
Civilengineering
Specializedconstruction
Average employment and gross salary in the construction sector from 2008 to Q1 2017
Average gross salary (PLN)
Average employment in the year (‘000)
Average remuneration in each segment
Average remuneration in the industry
The average gross remuneration in Q1 2017 in selected construction industry segments (PLN/month)
7 NBP, Q1 20178 Employment according to Economic Activity Survey (BAEL)
Source: Central Statistical Office
Source: Central Statistical Office
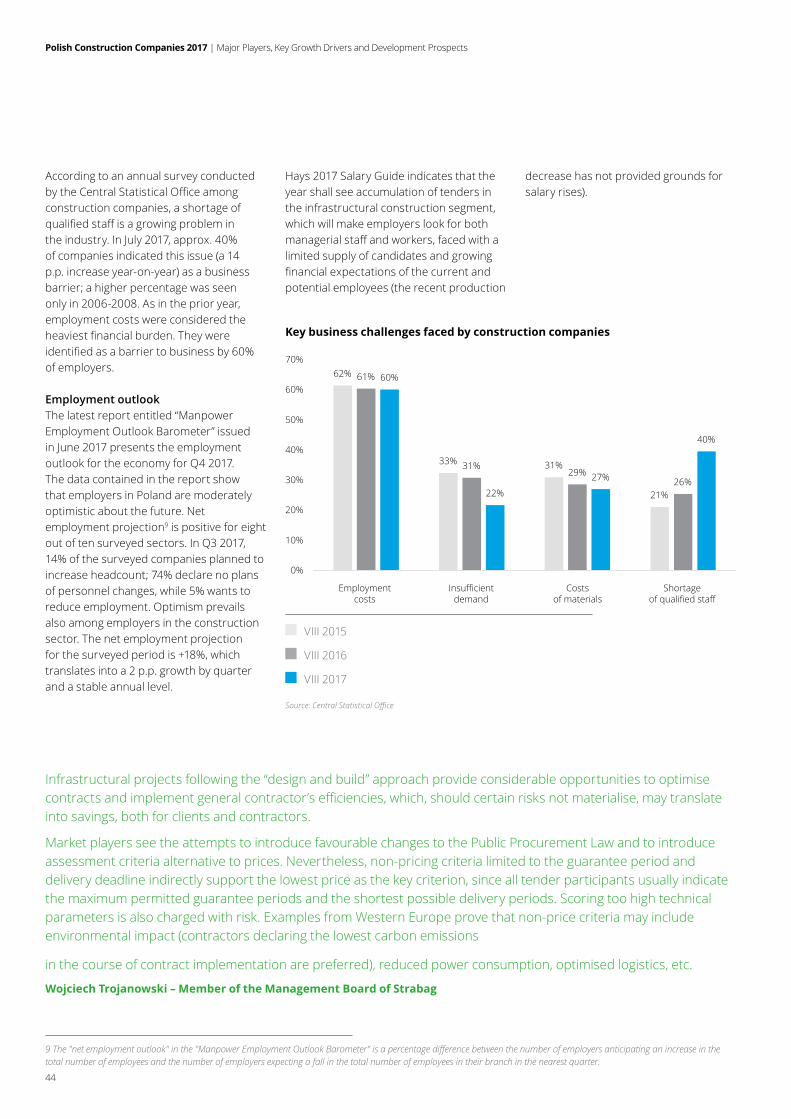
Polish Construction Companies 2017 | Major Players, Key Growth Drivers and Development Prospects
44
VIII 2015
VIII 2016
VIII 2017
Key business challenges faced by construction companies
Source: Central Statistical Office
According to an annual survey conducted bytheCentralStatisticalOfficeamongconstruction companies, a shortage of qualifiedstaffisagrowingprobleminthe industry. In July 2017, approx. 40% of companies indicated this issue (a 14 p.p. increase year-on-year) as a business barrier; a higher percentage was seen only in 2006-2008. As in the prior year, employment costs were considered the heaviestfinancialburden.Theywereidentifiedasabarriertobusinessby60%of employers.
Employment outlookThe latest report entitled “Manpower Employment Outlook Barometer” issued in June 2017 presents the employment outlook for the economy for Q4 2017. The data contained in the report show that employers in Poland are moderately optimistic about the future. Net employment projection9 is positive for eight out of ten surveyed sectors. In Q3 2017, 14% of the surveyed companies planned to increase headcount; 74% declare no plans of personnel changes, while 5% wants to reduce employment. Optimism prevails also among employers in the construction sector. The net employment projection for the surveyed period is +18%, which translates into a 2 p.p. growth by quarter and a stable annual level.
Hays 2017 Salary Guide indicates that the year shall see accumulation of tenders in the infrastructural construction segment, which will make employers look for both managerialstaffandworkers,facedwithalimited supply of candidates and growing financialexpectationsofthecurrentandpotential employees (the recent production
62%
33% 31%
21%
61%
31%29%
26%
60%
22%
27%
40%
0%
10%
20%
30%
40%
50%
60%
70%
Employmentcosts
Insufficientdemand
Costsof materials
Shortageof qualified staff
9 The "net employment outlook" in the "Manpower Employment Outlook Barometer" is a percentage difference between the number of employers anticipating an increase in the total number of employees and the number of employers expecting a fall in the total number of employees in their branch in the nearest quarter.
Infrastructural projects following the “design and build” approach provide considerable opportunities to optimise contractsandimplementgeneralcontractor’sefficiencies,which,shouldcertainrisksnotmaterialise,maytranslateinto savings, both for clients and contractors.
Market players see the attempts to introduce favourable changes to the Public Procurement Law and to introduce assessment criteria alternative to prices. Nevertheless, non-pricing criteria limited to the guarantee period and delivery deadline indirectly support the lowest price as the key criterion, since all tender participants usually indicate the maximum permitted guarantee periods and the shortest possible delivery periods. Scoring too high technical parameters is also charged with risk. Examples from Western Europe prove that non-price criteria may include environmental impact (contractors declaring the lowest carbon emissions
in the course of contract implementation are preferred), reduced power consumption, optimised logistics, etc.
Wojciech Trojanowski – Member of the Management Board of Strabag
decrease has not provided grounds for salary rises).
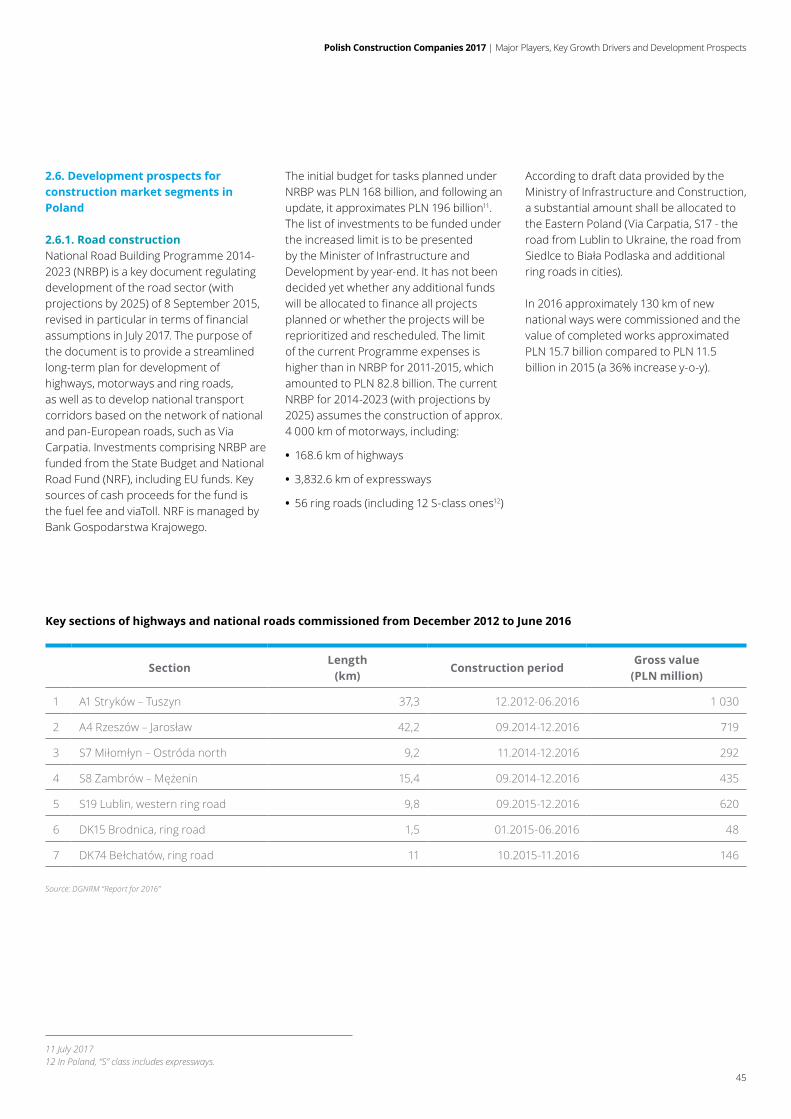
Polish Construction Companies 2017 | Major Players, Key Growth Drivers and Development Prospects
45
2.6. Development prospects for construction market segments in Poland
2.6.1. Road construction National Road Building Programme 2014-2023 (NRBP) is a key document regulating development of the road sector (with projections by 2025) of 8 September 2015, revised in particular in terms of financial assumptions in July 2017. The purpose of the document is to provide a streamlined long-term plan for development of highways, motorways and ring roads, as well as to develop national transport corridors based on the network of national and pan-European roads, such as Via Carpatia. Investments comprising NRBP are funded from the State Budget and National Road Fund (NRF), including EU funds. Key sources of cash proceeds for the fund is the fuel fee and viaToll. NRF is managed by Bank Gospodarstwa Krajowego.
The initial budget for tasks planned under NRBP was PLN 168 billion, and following an update, it approximates PLN 196 billion11. The list of investments to be funded under the increased limit is to be presented by the Minister of Infrastructure and Development by year-end. It has not been decided yet whether any additional funds will be allocated to finance all projects planned or whether the projects will be reprioritized and rescheduled. The limit of the current Programme expenses is higher than in NRBP for 2011-2015, which amounted to PLN 82.8 billion. The current NRBP for 2014-2023 (with projections by 2025) assumes the construction of approx. 4 000 km of motorways, including:
• 168.6 km of highways
• 3,832.6 km of expressways
• 56 ring roads (including 12 S-class ones12)
According to draft data provided by the Ministry of Infrastructure and Construction, a substantial amount shall be allocated to the Eastern Poland (Via Carpatia, S17 - the road from Lublin to Ukraine, the road from SiedlcetoBiałaPodlaskaandadditionalring roads in cities).
In 2016 approximately 130 km of new national ways were commissioned and the value of completed works approximated PLN 15.7 billion compared to PLN 11.5 billion in 2015 (a 36% increase y-o-y).
SectionLength
(km)Construction period
Gross value (PLN million)
1 A1 Stryków – Tuszyn 37,3 12.2012-06.2016 1 030
2 A4Rzeszów–Jarosław 42,2 09.2014-12.2016 719
3 S7Miłomłyn–Ostródanorth 9,2 11.2014-12.2016 292
4 S8Zambrów–Mężenin 15,4 09.2014-12.2016 435
5 S19 Lublin, western ring road 9,8 09.2015-12.2016 620
6 DK15 Brodnica, ring road 1,5 01.2015-06.2016 48
7 DK74Bełchatów,ringroad 11 10.2015-11.2016 146
Key sections of highways and national roads commissioned from December 2012 to June 2016
11 July 201712 In Poland, “S” class includes expressways.
Source: DGNRM “Report for 2016”
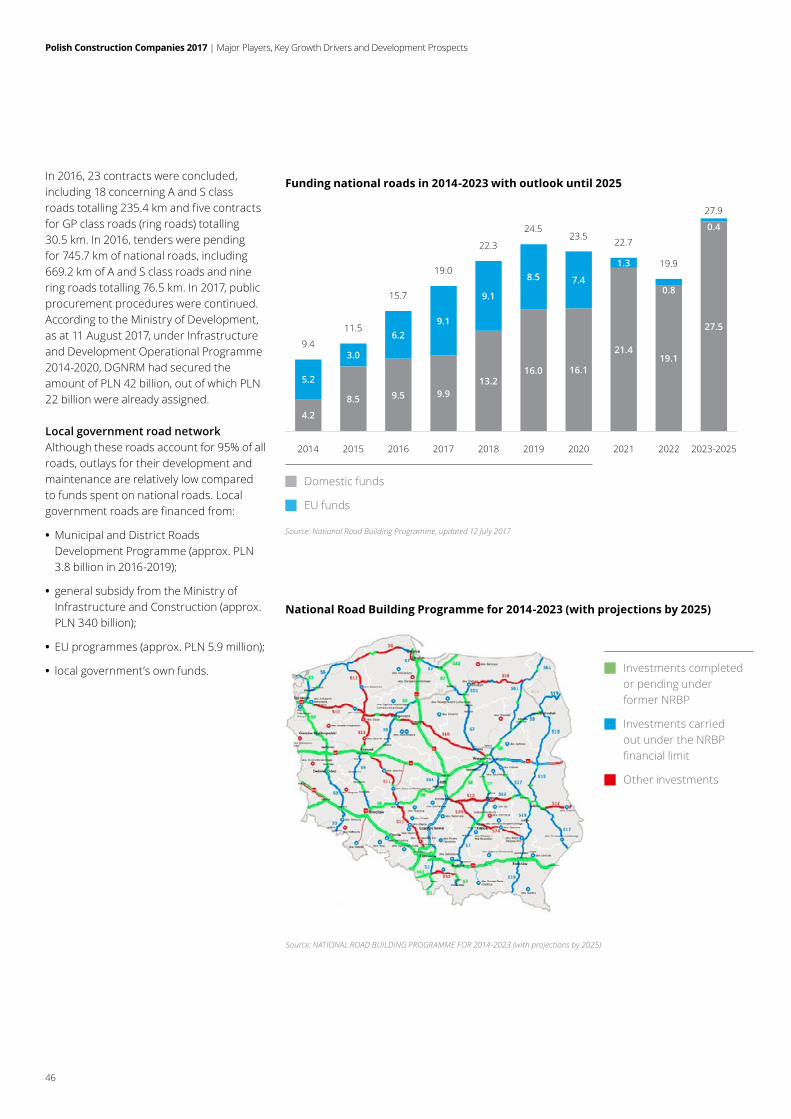
Polish Construction Companies 2017 | Major Players, Key Growth Drivers and Development Prospects
46
In 2016, 23 contracts were concluded, including 18 concerning A and S class roads totalling 235.4 km and five contracts for GP class roads (ring roads) totalling 30.5 km. In 2016, tenders were pending for 745.7 km of national roads, including 669.2 km of A and S class roads and nine ring roads totalling 76.5 km. In 2017, public procurement procedures were continued. According to the Ministry of Development, as at 11 August 2017, under Infrastructure and Development Operational Programme 2014-2020, DGNRM had secured the amount of PLN 42 billion, out of which PLN 22 billion were already assigned.
Local government road networkAlthough these roads account for 95% of all roads, outlays for their development and maintenance are relatively low compared to funds spent on national roads. Local government roads are financed from:
• Municipal and District Roads Development Programme (approx. PLN 3.8 billion in 2016-2019);
• general subsidy from the Ministry of Infrastructure and Construction (approx. PLN 340 billion);
• EU programmes (approx. PLN 5.9 million);
• local government’s own funds.
Funding national roads in 2014-2023 with outlook until 2025
4.2
8.5 9.5 9.913.2
16.0 16.1
21.419.1
27.5
5.2
3.0
6.29.1
9.1
8.5 7.4
1.3
0.8
0.4
9.4
11.5
15.7
19.0
22.3
24.523.5
22.7
19.9
27.9
2014 2015 2016 2017 2018 2019 2020 2021 2022 2023-2025
Domestic funds
EU funds
Source: National Road Building Programme, updated 12 July 2017
National Road Building Programme for 2014-2023 (with projections by 2025)
Source: NATIONAL ROAD BUILDING PROGRAMME FOR 2014-2023 (with projections by 2025)
Investments completed or pending under former NRBP
Investments carried out under the NRBP financiallimit
Other investments
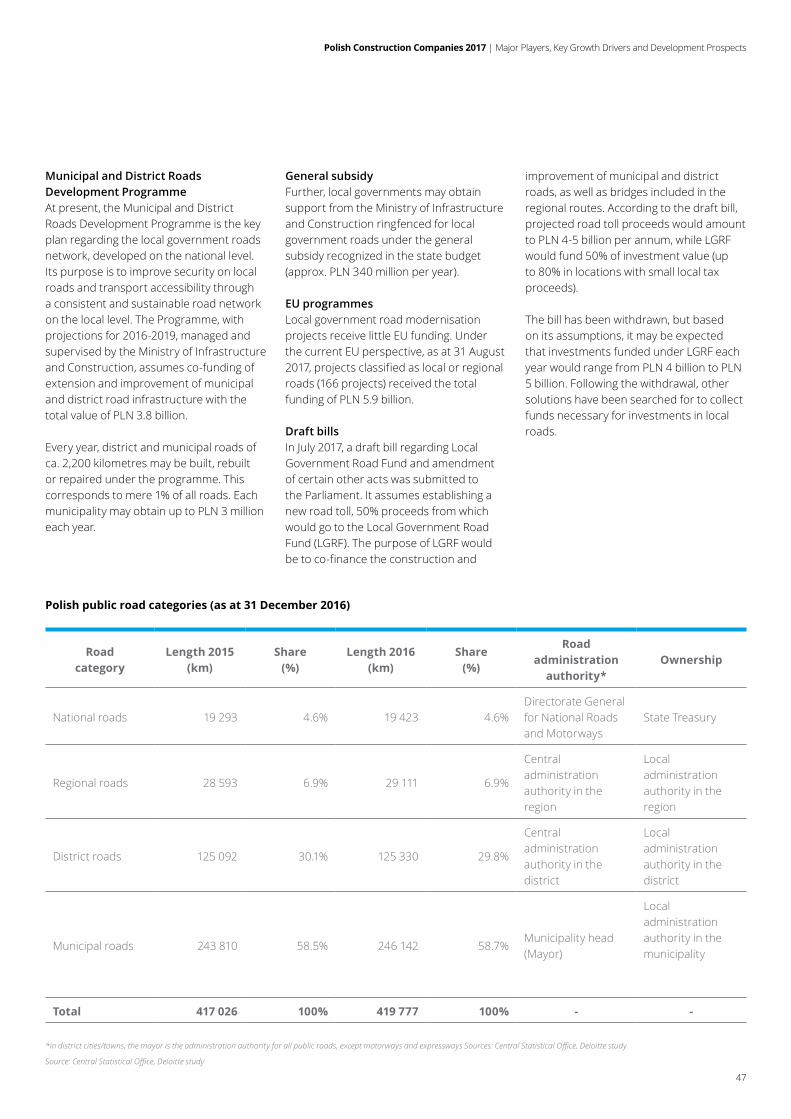
Polish Construction Companies 2017 | Major Players, Key Growth Drivers and Development Prospects
47
Road category
Length 2015 (km)
Share (%)
Length 2016 (km)
Share (%)
Road administration
authority*Ownership
National roads 19 293 4.6% 19 423 4.6%Directorate General for National Roads and Motorways
State Treasury
Regional roads 28 593 6.9% 29 111 6.9%
Central administration authority in the region
Local administration authority in the region
District roads 125 092 30.1% 125 330 29.8%
Central administration authority in the district
Local administration authority in the district
Municipal roads 243 810 58.5% 246 142 58.7%Municipality head (Mayor)
Local administration authority in the municipality
Total 417 026 100% 419 777 100% - -
Polish public road categories (as at 31 December 2016)
*in district cities/towns, the mayor is the administration authority for all public roads, except motorways and expressways Sources: Central Statistical Office, Deloitte study
Source: Central Statistical Office, Deloitte study
Municipal and District Roads Development ProgrammeAt present, the Municipal and District Roads Development Programme is the key plan regarding the local government roads network, developed on the national level. Its purpose is to improve security on local roads and transport accessibility through a consistent and sustainable road network on the local level. The Programme, with projections for 2016-2019, managed and supervised by the Ministry of Infrastructure and Construction, assumes co-funding of extension and improvement of municipal and district road infrastructure with the total value of PLN 3.8 billion.
Every year, district and municipal roads of ca. 2,200 kilometres may be built, rebuilt or repaired under the programme. This corresponds to mere 1% of all roads. Each municipality may obtain up to PLN 3 million each year.
General subsidyFurther, local governments may obtain support from the Ministry of Infrastructure and Construction ringfenced for local government roads under the general subsidy recognized in the state budget (approx. PLN 340 million per year).
EU programmesLocal government road modernisation projects receive little EU funding. Under the current EU perspective, as at 31 August 2017, projects classified as local or regional roads (166 projects) received the total funding of PLN 5.9 billion.
Draft billsIn July 2017, a draft bill regarding Local Government Road Fund and amendment of certain other acts was submitted to the Parliament. It assumes establishing a new road toll, 50% proceeds from which would go to the Local Government Road Fund (LGRF). The purpose of LGRF would be to co-finance the construction and
improvement of municipal and district roads, as well as bridges included in the regional routes. According to the draft bill, projected road toll proceeds would amount to PLN 4-5 billion per annum, while LGRF would fund 50% of investment value (up to 80% in locations with small local tax proceeds).
The bill has been withdrawn, but based on its assumptions, it may be expected that investments funded under LGRF each year would range from PLN 4 billion to PLN 5 billion. Following the withdrawal, other solutions have been searched for to collect funds necessary for investments in local roads.
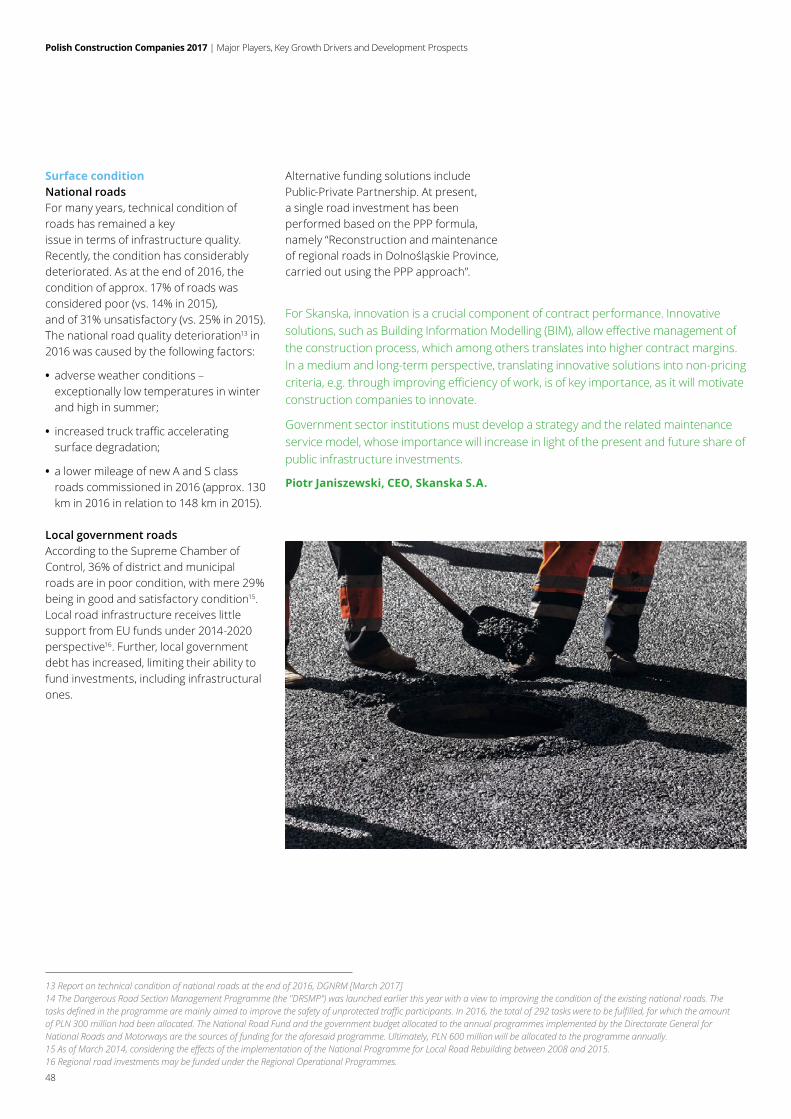
Polish Construction Companies 2017 | Major Players, Key Growth Drivers and Development Prospects
48
Surface condition National roadsFor many years, technical condition of roads has remained a keyissue in terms of infrastructure quality.Recently, the condition has considerably deteriorated. As at the end of 2016, the condition of approx. 17% of roads was considered poor (vs. 14% in 2015),and of 31% unsatisfactory (vs. 25% in 2015). The national road quality deterioration13 in 2016 was caused by the following factors:
• adverse weather conditions – exceptionally low temperatures in winter and high in summer;
• increasedtrucktrafficacceleratingsurface degradation;
• a lower mileage of new A and S class roads commissioned in 2016 (approx. 130 km in 2016 in relation to 148 km in 2015).
Local government roadsAccording to the Supreme Chamber of Control, 36% of district and municipal roads are in poor condition, with mere 29% being in good and satisfactory condition15. Local road infrastructure receives little support from EU funds under 2014-2020 perspective16. Further, local government debt has increased, limiting their ability to fund investments, including infrastructural ones.
13 Report on technical condition of national roads at the end of 2016, DGNRM [March 2017]14 The Dangerous Road Section Management Programme (the "DRSMP") was launched earlier this year with a view to improving the condition of the existing national roads. The tasks defined in the programme are mainly aimed to improve the safety of unprotected traffic participants. In 2016, the total of 292 tasks were to be fulfilled, for which the amount of PLN 300 million had been allocated. The National Road Fund and the government budget allocated to the annual programmes implemented by the Directorate General for National Roads and Motorways are the sources of funding for the aforesaid programme. Ultimately, PLN 600 million will be allocated to the programme annually.15 As of March 2014, considering the effects of the implementation of the National Programme for Local Road Rebuilding between 2008 and 2015. 16 Regional road investments may be funded under the Regional Operational Programmes.
For Skanska, innovation is a crucial component of contract performance. Innovative solutions,suchasBuildingInformationModelling(BIM),alloweffectivemanagementofthe construction process, which among others translates into higher contract margins. In a medium and long-term perspective, translating innovative solutions into non-pricing criteria,e.g.throughimprovingefficiencyofwork,isofkeyimportance,asitwillmotivateconstruction companies to innovate.
Government sector institutions must develop a strategy and the related maintenance service model, whose importance will increase in light of the present and future share of public infrastructure investments.
Piotr Janiszewski, CEO, Skanska S.A.
Alternative funding solutions include Public-Private Partnership. At present, a single road investment has been performed based on the PPP formula, namely “Reconstruction and maintenance ofregionalroadsinDolnośląskieProvince,carried out using the PPP approach”.
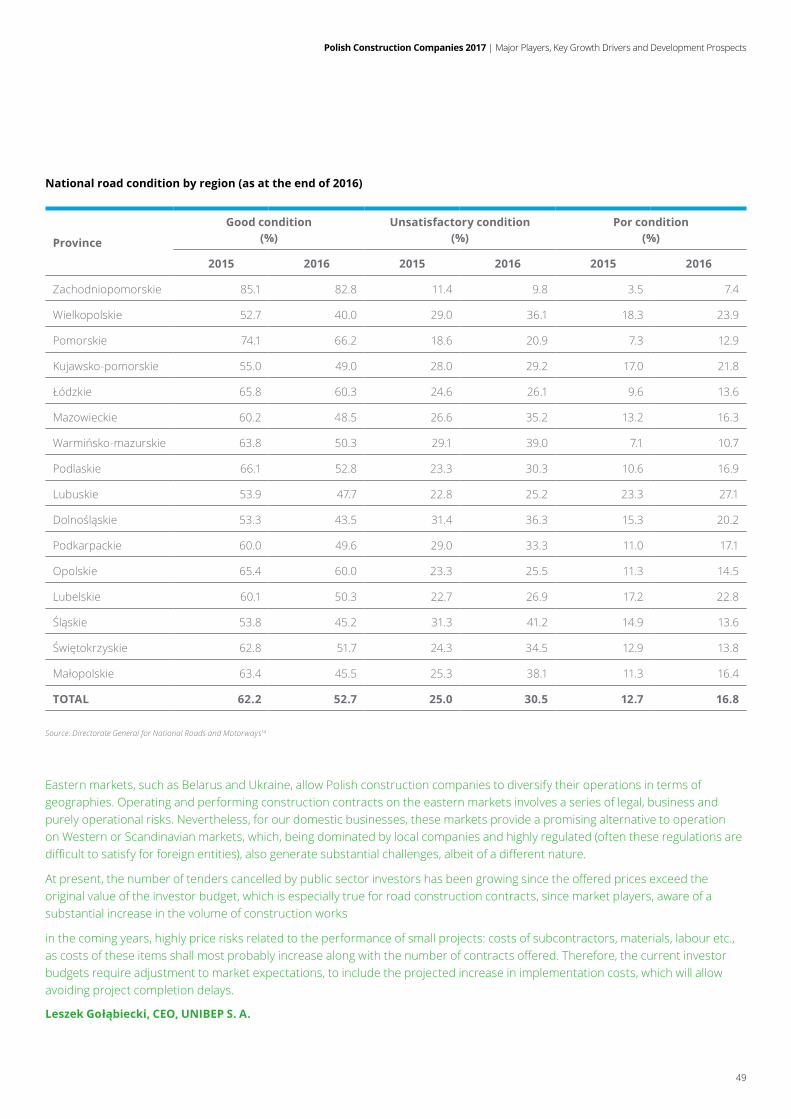
Polish Construction Companies 2017 | Major Players, Key Growth Drivers and Development Prospects
49
Eastern markets, such as Belarus and Ukraine, allow Polish construction companies to diversify their operations in terms of geographies. Operating and performing construction contracts on the eastern markets involves a series of legal, business and purely operational risks. Nevertheless, for our domestic businesses, these markets provide a promising alternative to operation on Western or Scandinavian markets, which, being dominated by local companies and highly regulated (often these regulations are difficulttosatisfyforforeignentities),alsogeneratesubstantialchallenges,albeitofadifferentnature.
Atpresent,thenumberoftenderscancelledbypublicsectorinvestorshasbeengrowingsincetheofferedpricesexceedtheoriginal value of the investor budget, which is especially true for road construction contracts, since market players, aware of a substantial increase in the volume of construction works
in the coming years, highly price risks related to the performance of small projects: costs of subcontractors, materials, labour etc., ascostsoftheseitemsshallmostprobablyincreasealongwiththenumberofcontractsoffered.Therefore,thecurrentinvestorbudgets require adjustment to market expectations, to include the projected increase in implementation costs, which will allow avoiding project completion delays.
Leszek Gołąbiecki, CEO, UNIBEP S. A.
Province
Good condition (%)
Unsatisfactory condition (%)
Por condition (%)
2015 2016 2015 2016 2015 2016
Zachodniopomorskie 85.1 82.8 11.4 9.8 3.5 7.4
Wielkopolskie 52.7 40.0 29.0 36.1 18.3 23.9
Pomorskie 74.1 66.2 18.6 20.9 7.3 12.9
Kujawsko-pomorskie 55.0 49.0 28.0 29.2 17.0 21.8
Łódzkie 65.8 60.3 24.6 26.1 9.6 13.6
Mazowieckie 60.2 48.5 26.6 35.2 13.2 16.3
Warmińsko-mazurskie 63.8 50.3 29.1 39.0 7.1 10.7
Podlaskie 66.1 52.8 23.3 30.3 10.6 16.9
Lubuskie 53.9 47.7 22.8 25.2 23.3 27.1
Dolnośląskie 53.3 43.5 31.4 36.3 15.3 20.2
Podkarpackie 60.0 49.6 29.0 33.3 11.0 17.1
Opolskie 65.4 60.0 23.3 25.5 11.3 14.5
Lubelskie 60.1 50.3 22.7 26.9 17.2 22.8
Śląskie 53.8 45.2 31.3 41.2 14.9 13.6
Świętokrzyskie 62.8 51.7 24.3 34.5 12.9 13.8
Małopolskie 63.4 45.5 25.3 38.1 11.3 16.4
TOTAL 62.2 52.7 25.0 30.5 12.7 16.8
National road condition by region (as at the end of 2016)
Source: Directorate General for National Roads and Motorways14
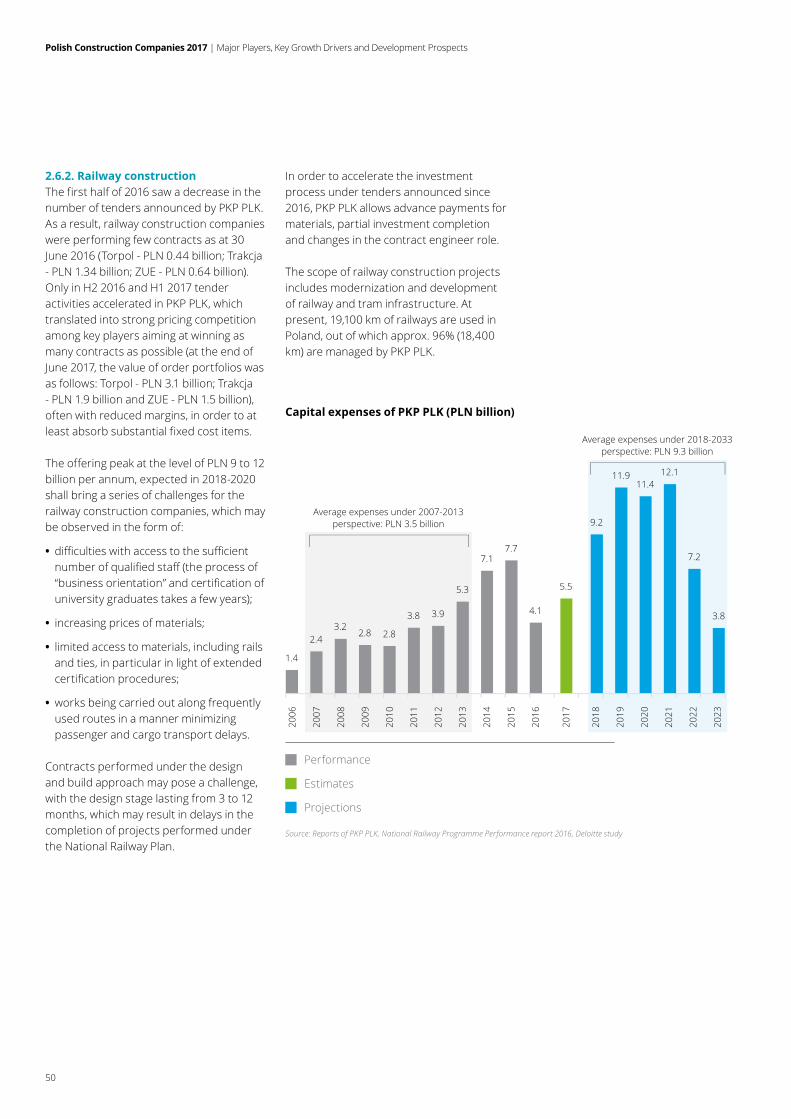
Polish Construction Companies 2017 | Major Players, Key Growth Drivers and Development Prospects
50
Capital expenses of PKP PLK (PLN billion)
Source: Reports of PKP PLK, National Railway Programme Performance report 2016, Deloitte study
2.6.2. Railway constructionThe first half of 2016 saw a decrease in the number of tenders announced by PKP PLK. As a result, railway construction companies were performing few contracts as at 30 June 2016 (Torpol - PLN 0.44 billion; Trakcja - PLN 1.34 billion; ZUE - PLN 0.64 billion). Only in H2 2016 and H1 2017 tender activities accelerated in PKP PLK, which translated into strong pricing competition among key players aiming at winning as many contracts as possible (at the end of June 2017, the value of order portfolios was as follows: Torpol - PLN 3.1 billion; Trakcja - PLN 1.9 billion and ZUE - PLN 1.5 billion), often with reduced margins, in order to at least absorb substantial fixed cost items.
The offering peak at the level of PLN 9 to 12 billion per annum, expected in 2018-2020 shall bring a series of challenges for the railway construction companies, which may be observed in the form of:
• difficultieswithaccesstothesufficientnumberofqualifiedstaff(theprocessof“businessorientation”andcertificationofuniversity graduates takes a few years);
• increasing prices of materials;
• limited access to materials, including rails and ties, in particular in light of extended certificationprocedures;
• works being carried out along frequently used routes in a manner minimizing passenger and cargo transport delays.
Contracts performed under the design and build approach may pose a challenge, with the design stage lasting from 3 to 12 months, which may result in delays in the completion of projects performed under the National Railway Plan.
In order to accelerate the investment process under tenders announced since 2016, PKP PLK allows advance payments for materials, partial investment completion and changes in the contract engineer role.
The scope of railway construction projects includes modernization and development of railway and tram infrastructure. At present, 19,100 km of railways are used in Poland, out of which approx. 96% (18,400 km) are managed by PKP PLK.
1.4
2.43.2
2.8 2.8
3.8 3.9
5.3
7.17.7
4.1
5.5
9.2
11.911.4
12.1
7.2
3.8
2006
2007
2008
2009
2010
2011
2012
2013
2014
2015
2016
2017
2018
2019
2020
2021
2022
2023
Average expenses under 2007-2013perspective: PLN 3.5 billion
Average expenses under 2018-2033perspective: PLN 9.3 billion
Performance
Estimates
Projections
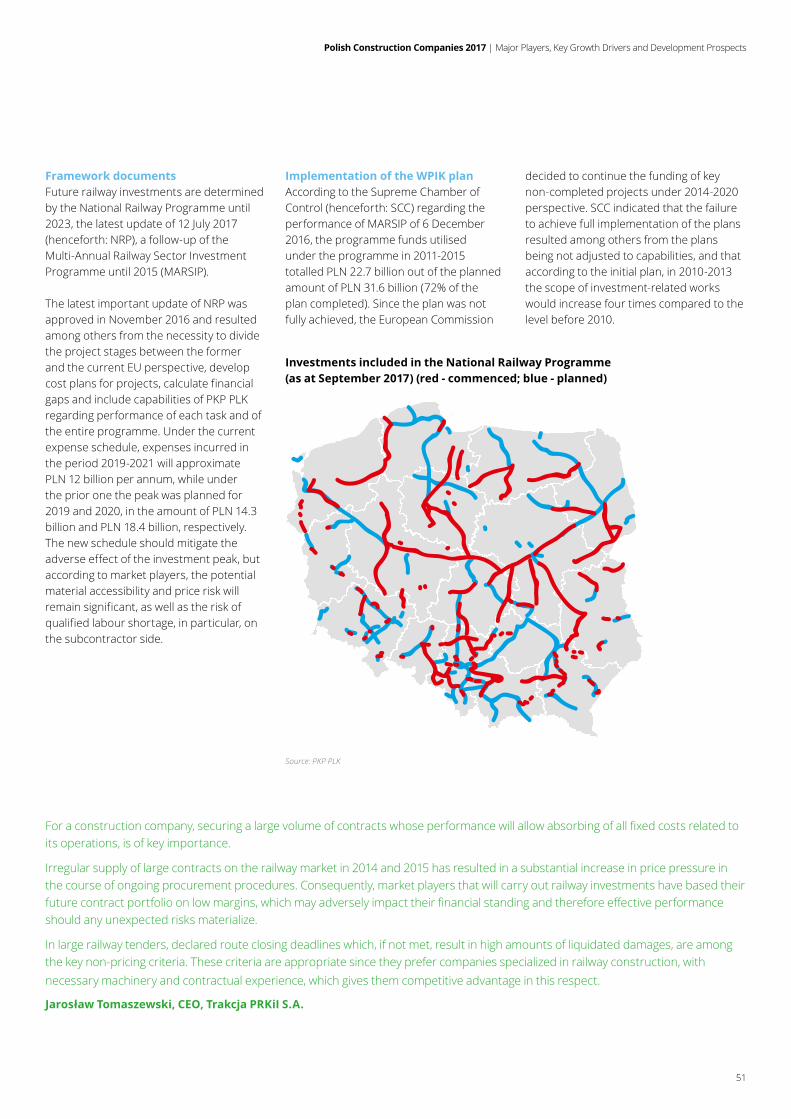
Polish Construction Companies 2017 | Major Players, Key Growth Drivers and Development Prospects
51
Framework documentsFuture railway investments are determined by the National Railway Programme until 2023, the latest update of 12 July 2017 (henceforth: NRP), a follow-up of the Multi-Annual Railway Sector Investment Programme until 2015 (MARSIP).
The latest important update of NRP was approved in November 2016 and resulted among others from the necessity to divide the project stages between the former and the current EU perspective, develop cost plans for projects, calculate financial gaps and include capabilities of PKP PLK regarding performance of each task and of the entire programme. Under the current expense schedule, expenses incurred in the period 2019-2021 will approximate PLN 12 billion per annum, while under the prior one the peak was planned for 2019 and 2020, in the amount of PLN 14.3 billion and PLN 18.4 billion, respectively. The new schedule should mitigate the adverse effect of the investment peak, but according to market players, the potential material accessibility and price risk will remain significant, as well as the risk of qualified labour shortage, in particular, on the subcontractor side.
Investments included in the National Railway Programme(as at September 2017) (red - commenced; blue - planned)
Source: PKP PLK
Foraconstructioncompany,securingalargevolumeofcontractswhoseperformancewillallowabsorbingofallfixedcostsrelatedtoits operations, is of key importance.
Irregular supply of large contracts on the railway market in 2014 and 2015 has resulted in a substantial increase in price pressure in the course of ongoing procurement procedures. Consequently, market players that will carry out railway investments have based their futurecontractportfolioonlowmargins,whichmayadverselyimpacttheirfinancialstandingandthereforeeffectiveperformanceshould any unexpected risks materialize.
In large railway tenders, declared route closing deadlines which, if not met, result in high amounts of liquidated damages, are among the key non-pricing criteria. These criteria are appropriate since they prefer companies specialized in railway construction, with necessary machinery and contractual experience, which gives them competitive advantage in this respect.
Jarosław Tomaszewski, CEO, Trakcja PRKiI S.A.
Implementation of the WPIK planAccording to the Supreme Chamber of Control (henceforth: SCC) regarding the performance of MARSIP of 6 December 2016, the programme funds utilised under the programme in 2011-2015 totalled PLN 22.7 billion out of the planned amount of PLN 31.6 billion (72% of the plan completed). Since the plan was not fully achieved, the European Commission
decided to continue the funding of key non-completed projects under 2014-2020 perspective. SCC indicated that the failure to achieve full implementation of the plans resulted among others from the plans being not adjusted to capabilities, and that according to the initial plan, in 2010-2013 the scope of investment-related works would increase four times compared to the level before 2010.
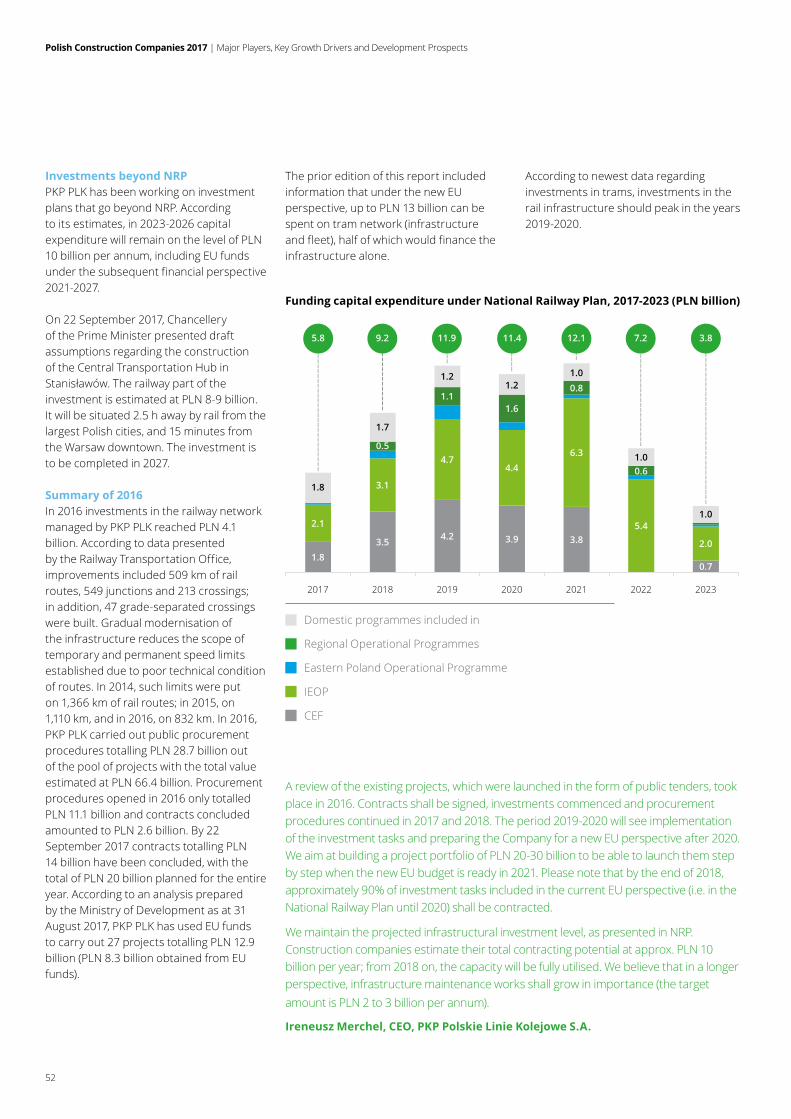
Polish Construction Companies 2017 | Major Players, Key Growth Drivers and Development Prospects
52
Funding capital expenditure under National Railway Plan, 2017-2023 (PLN billion)
Investments beyond NRPPKP PLK has been working on investment plans that go beyond NRP. According to its estimates, in 2023-2026 capital expenditure will remain on the level of PLN 10 billion per annum, including EU funds under the subsequent financial perspective 2021-2027.
On 22 September 2017, Chancellery of the Prime Minister presented draft assumptions regarding the construction of the Central Transportation Hub in Stanisławów.Therailwaypartoftheinvestment is estimated at PLN 8-9 billion. It will be situated 2.5 h away by rail from the largest Polish cities, and 15 minutes from the Warsaw downtown. The investment is to be completed in 2027.
Summary of 2016In 2016 investments in the railway network managed by PKP PLK reached PLN 4.1 billion. According to data presented by the Railway Transportation Office, improvements included 509 km of rail routes, 549 junctions and 213 crossings; in addition, 47 grade-separated crossings were built. Gradual modernisation of the infrastructure reduces the scope of temporary and permanent speed limits established due to poor technical condition of routes. In 2014, such limits were put on 1,366 km of rail routes; in 2015, on 1,110 km, and in 2016, on 832 km. In 2016, PKP PLK carried out public procurement procedures totalling PLN 28.7 billion out of the pool of projects with the total value estimated at PLN 66.4 billion. Procurement procedures opened in 2016 only totalled PLN 11.1 billion and contracts concluded amounted to PLN 2.6 billion. By 22 September 2017 contracts totalling PLN 14 billion have been concluded, with the total of PLN 20 billion planned for the entire year. According to an analysis prepared by the Ministry of Development as at 31 August 2017, PKP PLK has used EU funds to carry out 27 projects totalling PLN 12.9 billion (PLN 8.3 billion obtained from EU funds).
The prior edition of this report included information that under the new EU perspective, up to PLN 13 billion can be spent on tram network (infrastructure and fleet), half of which would finance the infrastructure alone.
According to newest data regarding investments in trams, investments in the rail infrastructure should peak in the years 2019-2020.
1.83.5 4.2 3.9 3.8
0.7
2.1
3.1
4.74.4
6.3
5.4
2.0
1.6
0.8
2017 2018 2019 2020 2021 2022 2023
1.8
1.7
1.21.2
1.0
1.0
1.0
1.1
0.5
0.6
5.8 9.2 11.9 11.4 12.1 7.2 3.8
Domestic programmes included in
Regional Operational Programmes
Eastern Poland Operational Programme
IEOP
CEF
A review of the existing projects, which were launched in the form of public tenders, took place in 2016. Contracts shall be signed, investments commenced and procurement procedures continued in 2017 and 2018. The period 2019-2020 will see implementation of the investment tasks and preparing the Company for a new EU perspective after 2020. We aim at building a project portfolio of PLN 20-30 billion to be able to launch them step by step when the new EU budget is ready in 2021. Please note that by the end of 2018, approximately 90% of investment tasks included in the current EU perspective (i.e. in the National Railway Plan until 2020) shall be contracted.
We maintain the projected infrastructural investment level, as presented in NRP. Construction companies estimate their total contracting potential at approx. PLN 10 billion per year; from 2018 on, the capacity will be fully utilised. We believe that in a longer perspective, infrastructure maintenance works shall grow in importance (the target amount is PLN 2 to 3 billion per annum).
Ireneusz Merchel, CEO, PKP Polskie Linie Kolejowe S.A.
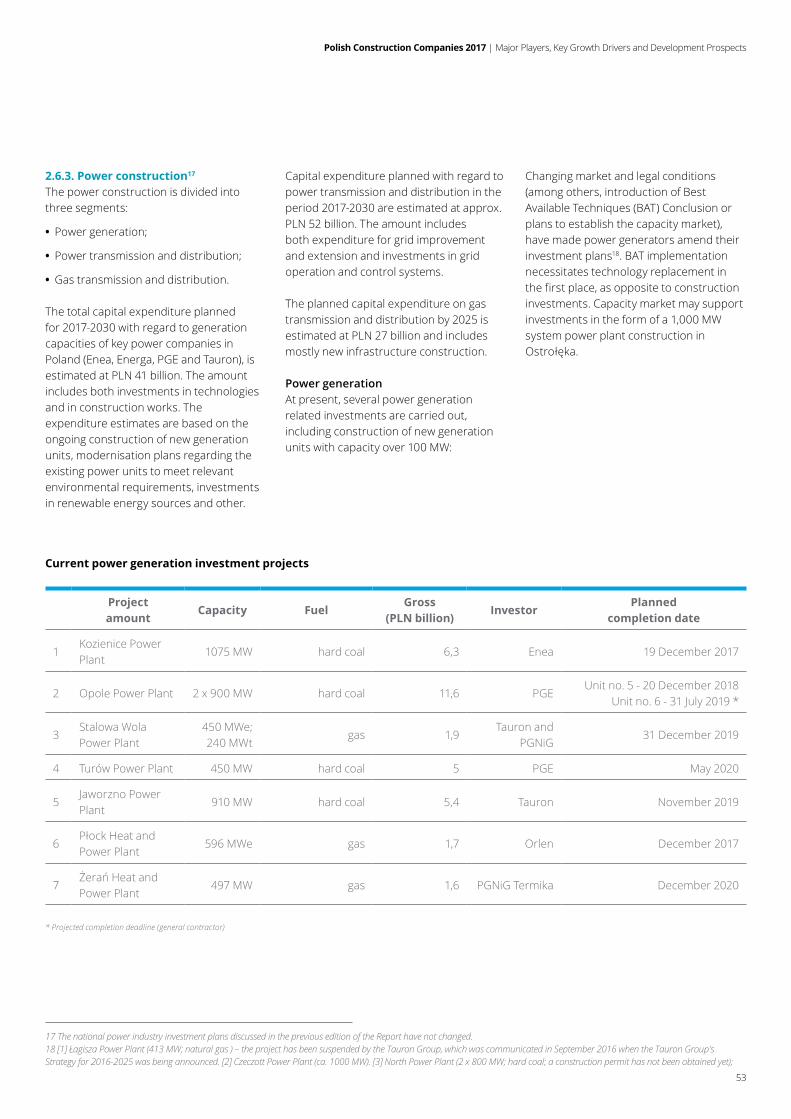
Polish Construction Companies 2017 | Major Players, Key Growth Drivers and Development Prospects
53
2.6.3. Power construction17
The power construction is divided into three segments:
• Power generation;
• Power transmission and distribution;
• Gas transmission and distribution.
The total capital expenditure planned for 2017-2030 with regard to generation capacities of key power companies in Poland (Enea, Energa, PGE and Tauron), is estimated at PLN 41 billion. The amount includes both investments in technologies and in construction works. The expenditure estimates are based on the ongoing construction of new generation units, modernisation plans regarding the existing power units to meet relevant environmental requirements, investments in renewable energy sources and other.
Capital expenditure planned with regard to power transmission and distribution in the period 2017-2030 are estimated at approx. PLN 52 billion. The amount includes both expenditure for grid improvement and extension and investments in grid operation and control systems.
The planned capital expenditure on gas transmission and distribution by 2025 is estimated at PLN 27 billion and includes mostly new infrastructure construction.
Power generation At present, several power generation related investments are carried out, including construction of new generation units with capacity over 100 MW:
Changing market and legal conditions (among others, introduction of Best Available Techniques (BAT) Conclusion or plans to establish the capacity market), have made power generators amend their investment plans18. BAT implementation necessitates technology replacement in the first place, as opposite to construction investments. Capacity market may support investments in the form of a 1,000 MW system power plant construction in Ostrołęka.
17 The national power industry investment plans discussed in the previous edition of the Report have not changed.18 [1] Łagisza Power Plant (413 MW; natural gas ) – the project has been suspended by the Tauron Group, which was communicated in September 2016 when the Tauron Group's Strategy for 2016-2025 was being announced. [2] Czeczott Power Plant (ca. 1000 MW). [3] North Power Plant (2 x 800 MW; hard coal; a construction permit has not been obtained yet);
Projectamount
Capacity FuelGross
(PLN billion)Investor
Plannedcompletion date
1Kozienice Power Plant
1075 MW hard coal 6,3 Enea 19 December 2017
2 Opole Power Plant 2 x 900 MW hard coal 11,6 PGEUnit no. 5 - 20 December 2018
Unit no. 6 - 31 July 2019 *
3Stalowa Wola Power Plant
450 MWe; 240 MWt
gas 1,9Tauron and
PGNiG31 December 2019
4 Turów Power Plant 450 MW hard coal 5 PGE May 2020
5Jaworzno Power Plant
910 MW hard coal 5,4 Tauron November 2019
6PłockHeatandPower Plant
596 MWe gas 1,7 Orlen December 2017
7ŻerańHeatandPower Plant
497 MW gas 1,6 PGNiG Termika December 2020
Current power generation investment projects
* Projected completion deadline (general contractor)
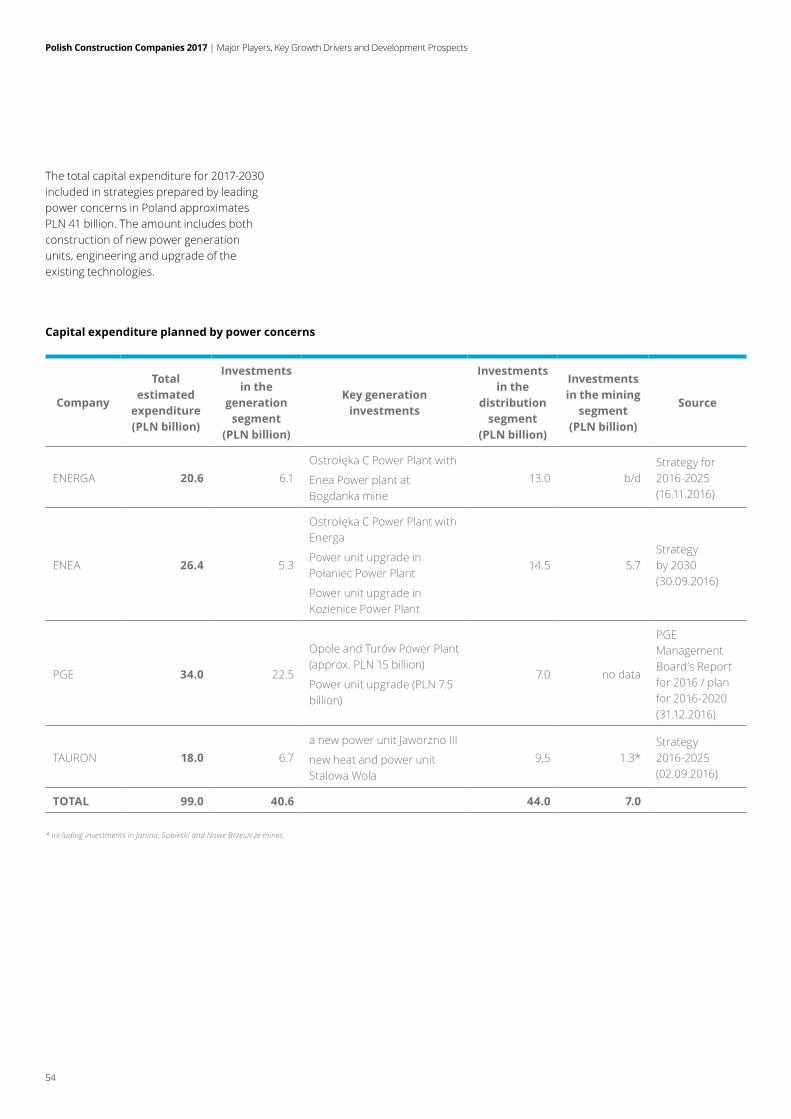
Polish Construction Companies 2017 | Major Players, Key Growth Drivers and Development Prospects
54
Company
Total estimated
expenditure (PLN billion)
Investments in the
generation segment
(PLN billion)
Key generation investments
Investments in the
distribution segment
(PLN billion)
Investments in the mining
segment (PLN billion)
Source
ENERGA 20.6 6.1OstrołękaCPowerPlantwith
Enea Power plant at Bogdanka mine
13.0 b/dStrategy for 2016-2025 (16.11.2016)
ENEA 26.4 5.3
OstrołękaCPowerPlantwithEnerga
Power unit upgrade in PołaniecPowerPlant
Power unit upgrade in Kozienice Power Plant
14.5 5.7Strategy by 2030 (30.09.2016)
PGE 34.0 22.5
Opole and Turów Power Plant (approx. PLN 15 billion)
Power unit upgrade (PLN 7.5 billion)
7.0 no data
PGE Management Board’s Report for 2016 / plan for 2016-2020(31.12.2016)
TAURON 18.0 6.7a new power unit Jaworzno III
new heat and power unit Stalowa Wola
9.5 1.3*Strategy 2016-2025 (02.09.2016)
TOTAL 99.0 40.6 44.0 7.0
Capital expenditure planned by power concerns
* including investments in Janina, Sobieski and Nowe Brzeszcze mines
The total capital expenditure for 2017-2030 included in strategies prepared by leading power concerns in Poland approximates PLN 41 billion. The amount includes both construction of new power generation units, engineering and upgrade of the existing technologies.
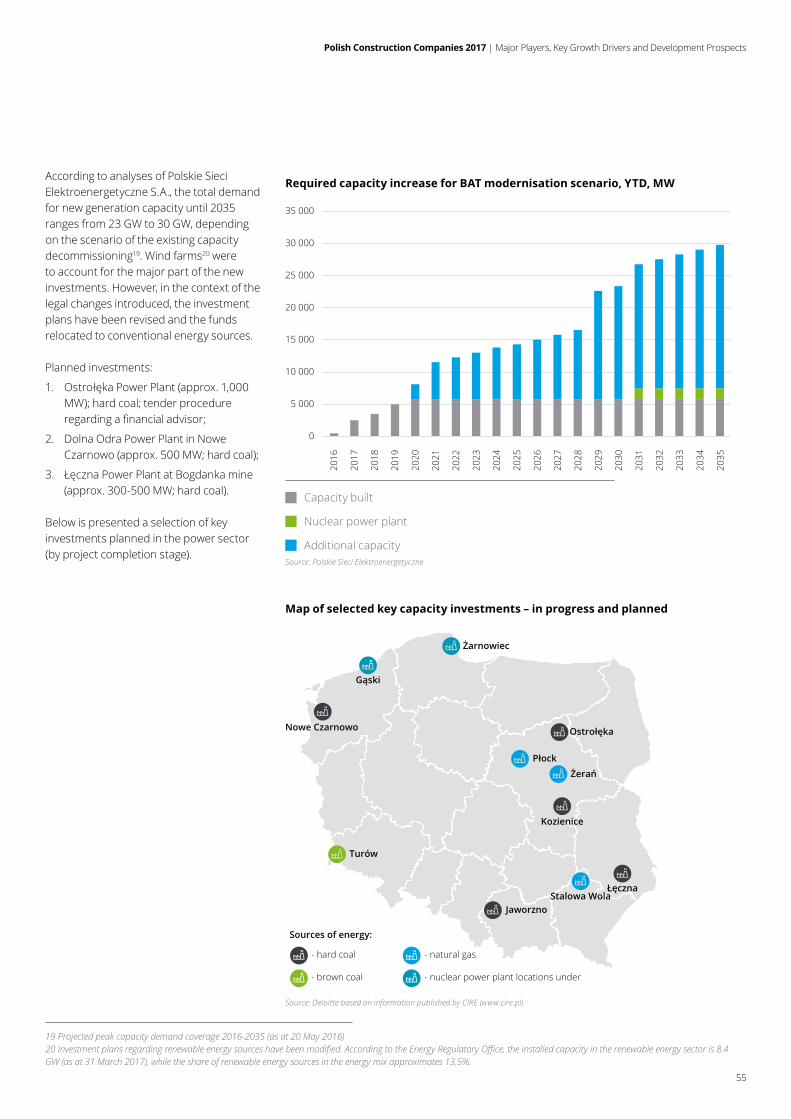
Polish Construction Companies 2017 | Major Players, Key Growth Drivers and Development Prospects
55
According to analyses of Polskie Sieci Elektroenergetyczne S.A., the total demand for new generation capacity until 2035 ranges from 23 GW to 30 GW, depending on the scenario of the existing capacity decommissioning19. Wind farms20 were to account for the major part of the new investments. However, in the context of the legal changes introduced, the investment plans have been revised and the funds relocated to conventional energy sources.
Planned investments:
1. OstrołękaPowerPlant(approx.1,000MW); hard coal; tender procedure regardingafinancialadvisor;
2. Dolna Odra Power Plant in Nowe Czarnowo (approx. 500 MW; hard coal);
3. ŁęcznaPowerPlantatBogdankamine(approx. 300-500 MW; hard coal).
Below is presented a selection of key investments planned in the power sector (by project completion stage).
Map of selected key capacity investments – in progress and planned
Source: Deloitte based on information published by CIRE (www.cire.pl)
Żarnowiec
Ostrołęka
Żerań
Płock
Kozienice
ŁęcznaStalowa Wola
Jaworzno
Turów
Nowe Czarnowo
Gąski
Sources of energy:
- hard coal
- brown coal
- natural gas
- nuclear power plant locations under
0
5 000
10 000
15 000
20 000
25 000
30 000
35 000
2016
2017
2018
2019
2020
2021
2022
2023
2024
2025
2026
2027
2028
2029
2030
2031
2032
2033
2034
2035
Source: Polskie Sieci Elektroenergetyczne
Capacity built
Nuclear power plant
Additional capacity
Required capacity increase for BAT modernisation scenario, YTD, MW
19 Projected peak capacity demand coverage 2016-2035 (as at 20 May 2016)20 Investment plans regarding renewable energy sources have been modified. According to the Energy Regulatory Office, the installed capacity in the renewable energy sector is 8.4 GW (as at 31 March 2017), while the share of renewable energy sources in the energy mix approximates 13.5%.
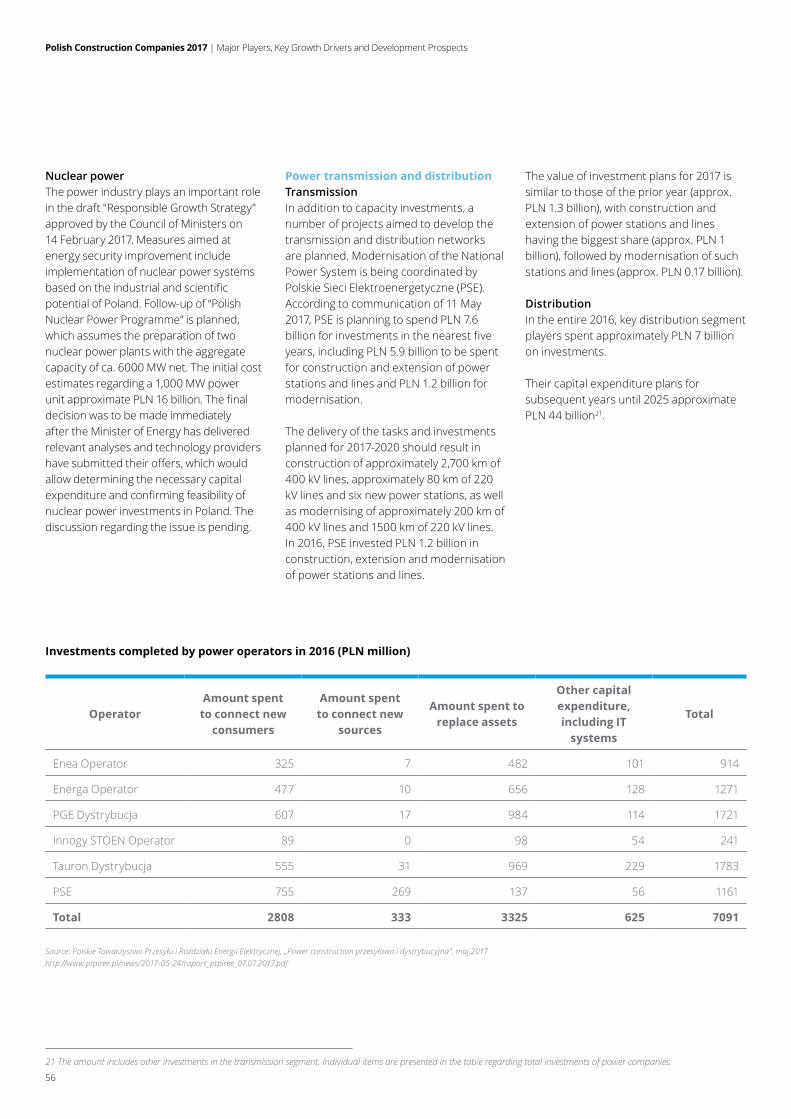
Polish Construction Companies 2017 | Major Players, Key Growth Drivers and Development Prospects
56
Nuclear powerThe power industry plays an important role in the draft "Responsible Growth Strategy" approved by the Council of Ministers on 14 February 2017. Measures aimed at energy security improvement include implementation of nuclear power systems based on the industrial and scientific potential of Poland. Follow-up of “Polish Nuclear Power Programme” is planned, which assumes the preparation of two nuclear power plants with the aggregate capacity of ca. 6000 MW net. The initial cost estimates regarding a 1,000 MW power unit approximate PLN 16 billion. The final decision was to be made immediately after the Minister of Energy has delivered relevant analyses and technology providers have submitted their offers, which would allow determining the necessary capital expenditure and confirming feasibility of nuclear power investments in Poland. The discussion regarding the issue is pending.
Power transmission and distributionTransmissionIn addition to capacity investments, a number of projects aimed to develop the transmission and distribution networks are planned. Modernisation of the National Power System is being coordinated by Polskie Sieci Elektroenergetyczne (PSE). According to communication of 11 May 2017, PSE is planning to spend PLN 7.6 billion for investments in the nearest five years, including PLN 5.9 billion to be spent for construction and extension of power stations and lines and PLN 1.2 billion for modernisation.
The delivery of the tasks and investments planned for 2017-2020 should result in construction of approximately 2,700 km of 400 kV lines, approximately 80 km of 220 kV lines and six new power stations, as well as modernising of approximately 200 km of 400 kV lines and 1500 km of 220 kV lines. In 2016, PSE invested PLN 1.2 billion in construction, extension and modernisation of power stations and lines.
The value of investment plans for 2017 is similar to those of the prior year (approx. PLN 1.3 billion), with construction and extension of power stations and lines having the biggest share (approx. PLN 1 billion), followed by modernisation of such stations and lines (approx. PLN 0.17 billion).
DistributionIn the entire 2016, key distribution segment players spent approximately PLN 7 billion on investments.
Their capital expenditure plans for subsequent years until 2025 approximate PLN 44 billion21.
OperatorAmount spent
to connect new consumers
Amount spent to connect new
sources
Amount spent to replace assets
Other capital expenditure, including IT
systems
Total
Enea Operator 325 7 482 101 914
Energa Operator 477 10 656 128 1271
PGE Dystrybucja 607 17 984 114 1721
Innogy STOEN Operator 89 0 98 54 241
Tauron Dystrybucja 555 31 969 229 1783
PSE 755 269 137 56 1161
Total 2808 333 3325 625 7091
Investments completed by power operators in 2016 (PLN million)
Source: Polskie Towarzystwo Przesyłu i Rozdziału Energii Elektrycznej, „Power construction przesyłowa i dystrybucyjna”, maj 2017 http://www.ptpiree.pl/news/2017-05-24/raport_ptpiree_07.07.2017.pdf
21 The amount includes other investments in the transmission segment. Individual items are presented in the table regarding total investments of power companies.
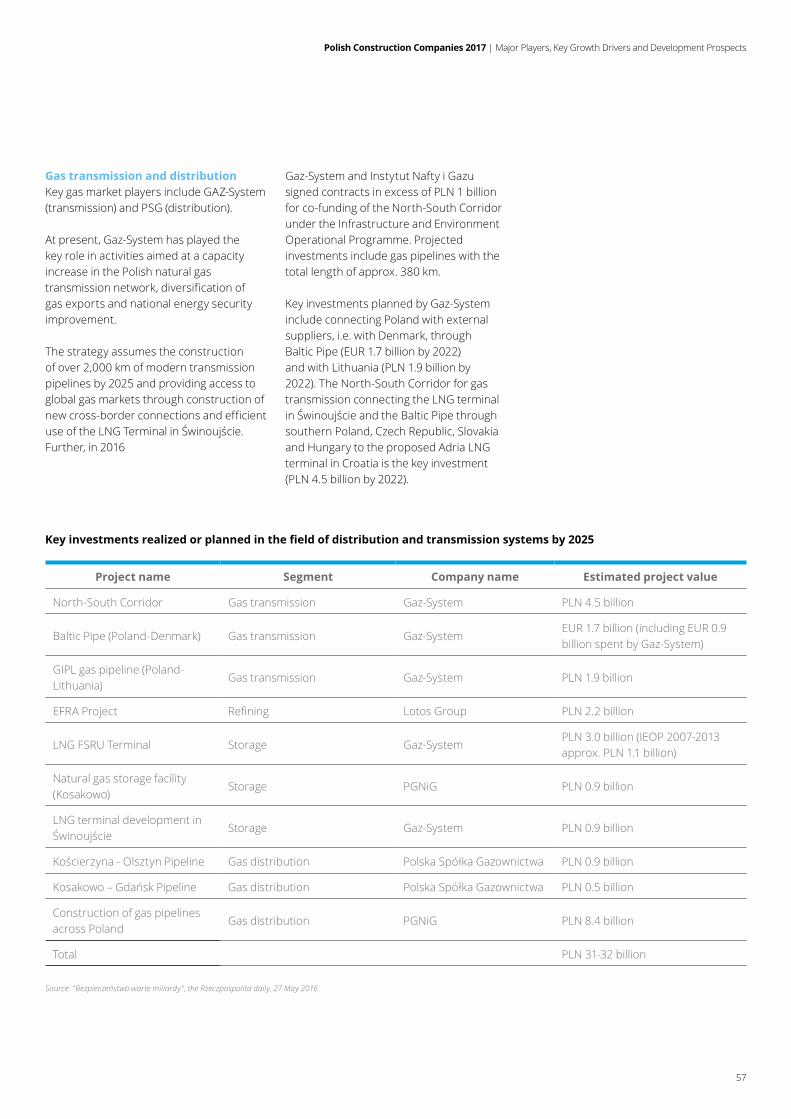
Polish Construction Companies 2017 | Major Players, Key Growth Drivers and Development Prospects
57
Gas transmission and distributionKey gas market players include GAZ-System (transmission) and PSG (distribution).
At present, Gaz-System has played the key role in activities aimed at a capacity increase in the Polish natural gas transmission network, diversification of gas exports and national energy security improvement.
The strategy assumes the construction of over 2,000 km of modern transmission pipelines by 2025 and providing access to global gas markets through construction of new cross-border connections and efficient useoftheLNGTerminalinŚwinoujście.Further, in 2016
Gaz-System and Instytut Nafty i Gazu signed contracts in excess of PLN 1 billion for co-funding of the North-South Corridor under the Infrastructure and Environment Operational Programme. Projected investments include gas pipelines with the total length of approx. 380 km.
Key investments planned by Gaz-System include connecting Poland with external suppliers, i.e. with Denmark, through Baltic Pipe (EUR 1.7 billion by 2022) and with Lithuania (PLN 1.9 billion by 2022). The North-South Corridor for gas transmission connecting the LNG terminal inŚwinoujścieandtheBalticPipethroughsouthern Poland, Czech Republic, Slovakia and Hungary to the proposed Adria LNG terminal in Croatia is the key investment (PLN 4.5 billion by 2022).
Project name Segment Company name Estimated project value
North-South Corridor Gas transmission Gaz-System PLN 4.5 billion
Baltic Pipe (Poland-Denmark) Gas transmission Gaz-SystemEUR 1.7 billion (including EUR 0.9 billion spent by Gaz-System)
GIPL gas pipeline (Poland-Lithuania)
Gas transmission Gaz-System PLN 1.9 billion
EFRA Project Refining Lotos Group PLN 2.2 billion
LNG FSRU Terminal Storage Gaz-SystemPLN 3.0 billion (IEOP 2007-2013approx. PLN 1.1 billion)
Natural gas storage facility (Kosakowo)
Storage PGNiG PLN 0.9 billion
LNG terminal development in Świnoujście
Storage Gaz-System PLN 0.9 billion
Kościerzyna-OlsztynPipeline Gas distribution PolskaSpółkaGazownictwa PLN 0.9 billion
Kosakowo–GdańskPipeline Gas distribution PolskaSpółkaGazownictwa PLN 0.5 billion
Construction of gas pipelines across Poland
Gas distribution PGNiG PLN 8.4 billion
Total PLN 31-32 billion
Key investments realized or planned in the field of distribution and transmission systems by 2025
Source: "Bezpieczeństwo warte miliardy”, the Rzeczpospolita daily, 27 May 2016
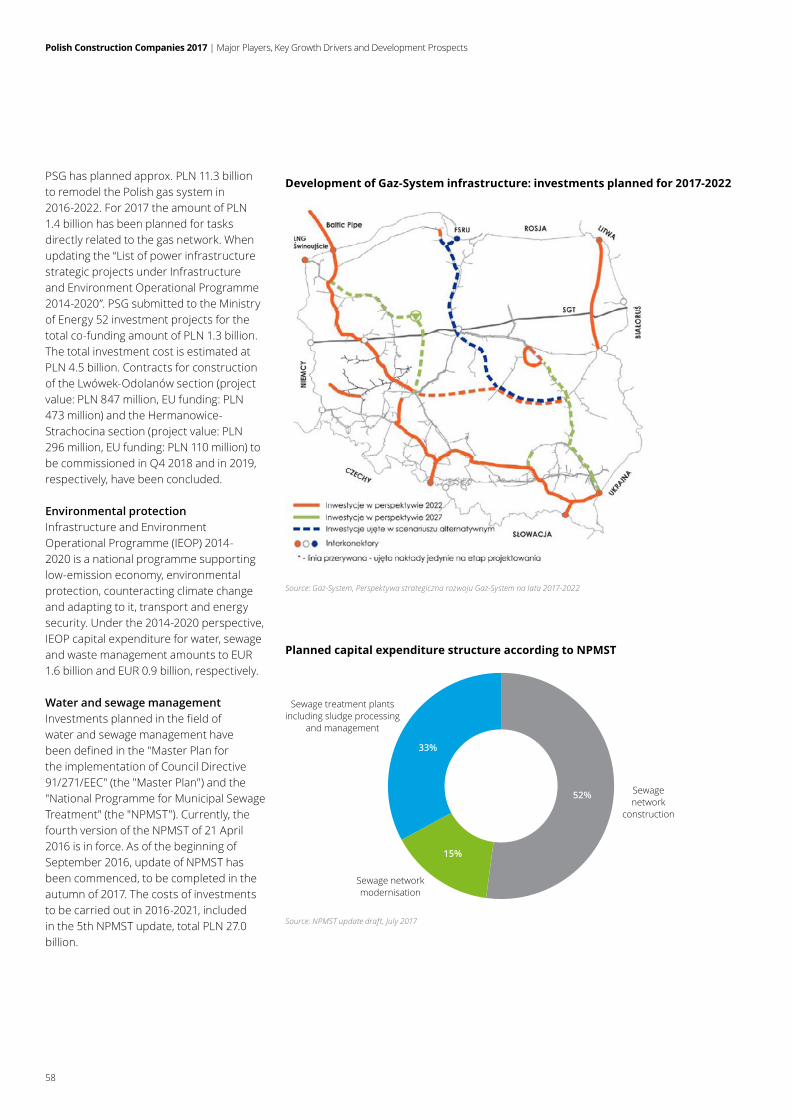
Polish Construction Companies 2017 | Major Players, Key Growth Drivers and Development Prospects
58
PSG has planned approx. PLN 11.3 billion to remodel the Polish gas system in 2016-2022. For 2017 the amount of PLN 1.4 billion has been planned for tasks directly related to the gas network. When updating the “List of power infrastructure strategic projects under Infrastructure and Environment Operational Programme 2014-2020”. PSG submitted to the Ministry of Energy 52 investment projects for the total co-funding amount of PLN 1.3 billion. The total investment cost is estimated at PLN 4.5 billion. Contracts for construction of the Lwówek-Odolanów section (project value: PLN 847 million, EU funding: PLN 473 million) and the Hermanowice-Strachocina section (project value: PLN 296 million, EU funding: PLN 110 million) to be commissioned in Q4 2018 and in 2019, respectively, have been concluded.
Environmental protectionInfrastructure and Environment Operational Programme (IEOP) 2014-2020 is a national programme supporting low-emission economy, environmental protection, counteracting climate change and adapting to it, transport and energy security. Under the 2014-2020 perspective, IEOP capital expenditure for water, sewage and waste management amounts to EUR 1.6 billion and EUR 0.9 billion, respectively.
Water and sewage managementInvestments planned in the field of water and sewage management have been defined in the "Master Plan for the implementation of Council Directive 91/271/EEC" (the "Master Plan") and the "National Programme for Municipal Sewage Treatment" (the "NPMST"). Currently, the fourth version of the NPMST of 21 April 2016 is in force. As of the beginning of September 2016, update of NPMST has been commenced, to be completed in the autumn of 2017. The costs of investments to be carried out in 2016-2021, included in the 5th NPMST update, total PLN 27.0 billion.
Sewage treatment plantsincluding sludge processing
and management
33%
52%
15%
Sewage networkmodernisation
Sewagenetwork
construction
Planned capital expenditure structure according to NPMST
Source: NPMST update draft, July 2017
Development of Gaz-System infrastructure: investments planned for 2017-2022
Source: Gaz-System, Perspektywa strategiczna rozwoju Gaz-System na lata 2017-2022
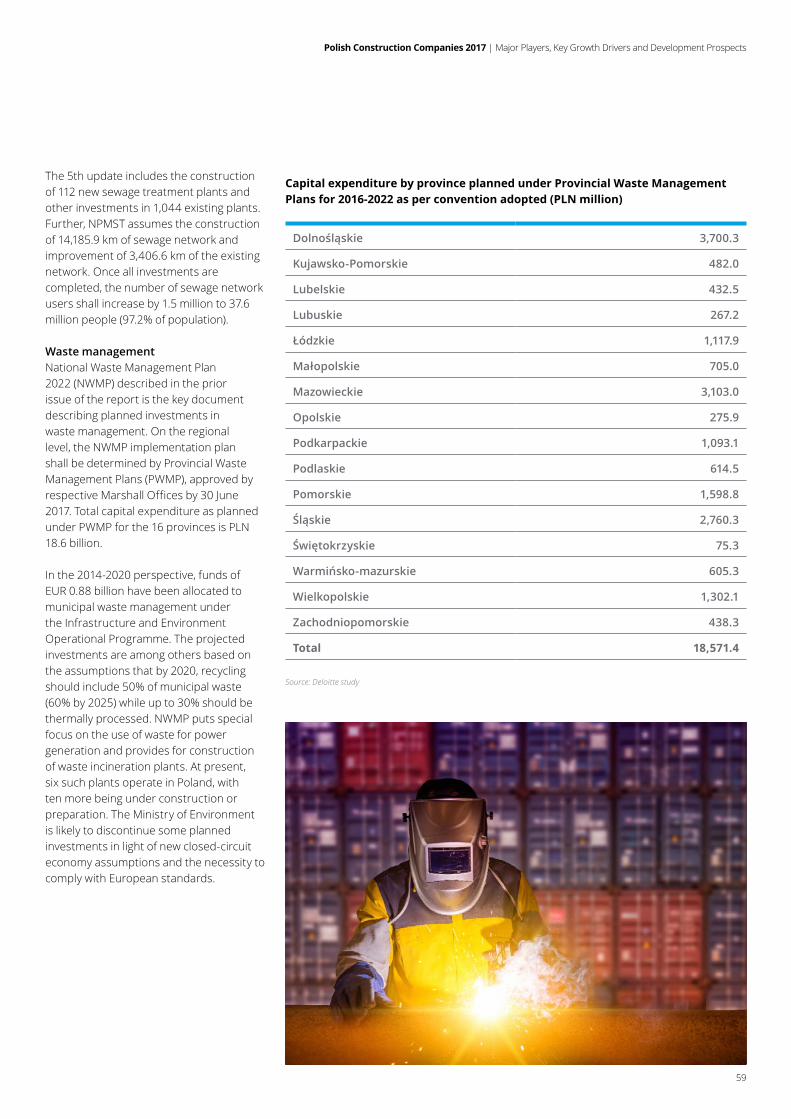
Polish Construction Companies 2017 | Major Players, Key Growth Drivers and Development Prospects
59
The 5th update includes the construction of 112 new sewage treatment plants and other investments in 1,044 existing plants. Further, NPMST assumes the construction of 14,185.9 km of sewage network and improvement of 3,406.6 km of the existing network. Once all investments are completed, the number of sewage network users shall increase by 1.5 million to 37.6 million people (97.2% of population).
Waste management National Waste Management Plan 2022 (NWMP) described in the prior issue of the report is the key document describing planned investments in waste management. On the regional level, the NWMP implementation plan shall be determined by Provincial Waste Management Plans (PWMP), approved by respective Marshall Offices by 30 June 2017. Total capital expenditure as planned under PWMP for the 16 provinces is PLN 18.6 billion.
In the 2014-2020 perspective, funds of EUR 0.88 billion have been allocated to municipal waste management under the Infrastructure and Environment Operational Programme. The projected investments are among others based on the assumptions that by 2020, recycling should include 50% of municipal waste (60% by 2025) while up to 30% should be thermally processed. NWMP puts special focus on the use of waste for power generation and provides for construction of waste incineration plants. At present, six such plants operate in Poland, with ten more being under construction or preparation. The Ministry of Environment is likely to discontinue some planned investments in light of new closed-circuit economy assumptions and the necessity to comply with European standards.
Dolnośląskie 3,700.3
Kujawsko-Pomorskie 482.0
Lubelskie 432.5
Lubuskie 267.2
Łódzkie 1,117.9
Małopolskie 705.0
Mazowieckie 3,103.0
Opolskie 275.9
Podkarpackie 1,093.1
Podlaskie 614.5
Pomorskie 1,598.8
Śląskie 2,760.3
Świętokrzyskie 75.3
Warmińsko-mazurskie 605.3
Wielkopolskie 1,302.1
Zachodniopomorskie 438.3
Total 18,571.4
Capital expenditure by province planned under Provincial Waste Management Plans for 2016-2022 as per convention adopted (PLN million)
Source: Deloitte study
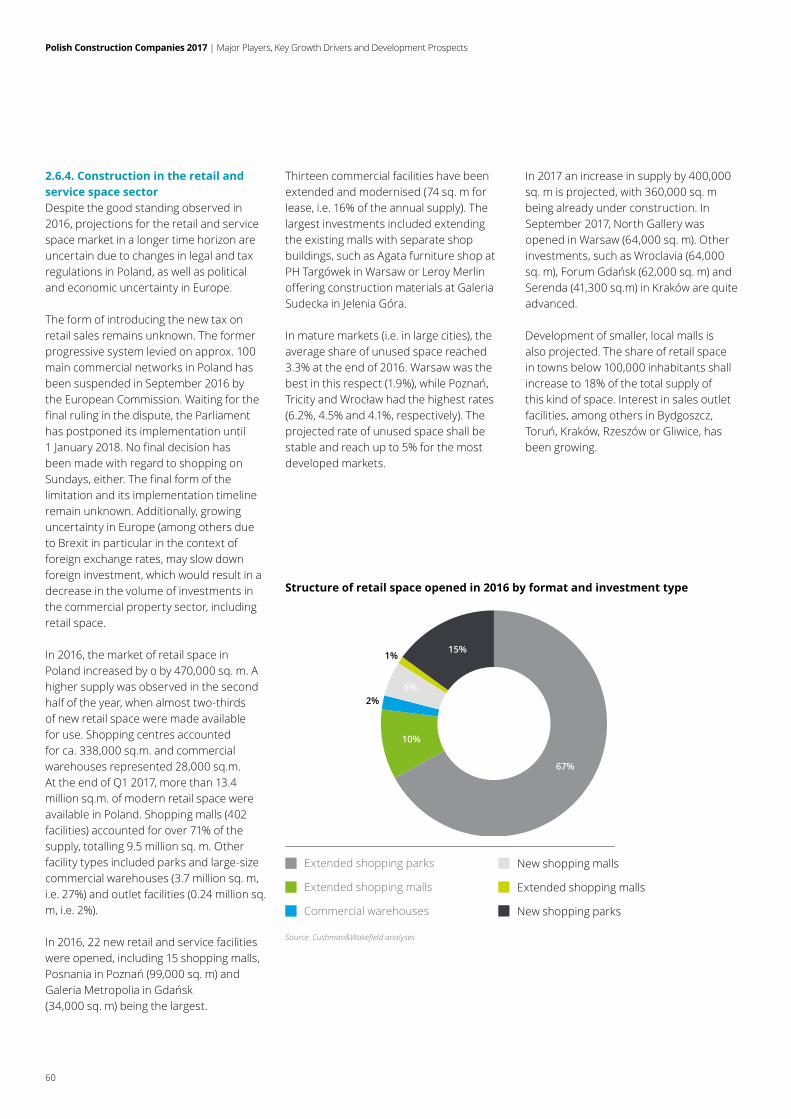
Polish Construction Companies 2017 | Major Players, Key Growth Drivers and Development Prospects
60
2.6.4. Construction in the retail and service space sectorDespite the good standing observed in 2016, projections for the retail and service space market in a longer time horizon are uncertain due to changes in legal and tax regulations in Poland, as well as political and economic uncertainty in Europe.
The form of introducing the new tax on retail sales remains unknown. The former progressive system levied on approx. 100 main commercial networks in Poland has been suspended in September 2016 by the European Commission. Waiting for the final ruling in the dispute, the Parliament has postponed its implementation until 1 January 2018. No final decision has been made with regard to shopping on Sundays, either. The final form of the limitation and its implementation timeline remain unknown. Additionally, growing uncertainty in Europe (among others due to Brexit in particular in the context of foreign exchange rates, may slow down foreign investment, which would result in a decrease in the volume of investments in the commercial property sector, including retail space.
In 2016, the market of retail space in Poland increased by o by 470,000 sq. m. A higher supply was observed in the second half of the year, when almost two-thirds of new retail space were made available for use. Shopping centres accounted for ca. 338,000 sq.m. and commercial warehouses represented 28,000 sq.m. At the end of Q1 2017, more than 13.4 million sq.m. of modern retail space were available in Poland. Shopping malls (402 facilities) accounted for over 71% of the supply, totalling 9.5 million sq. m. Other facility types included parks and large-size commercial warehouses (3.7 million sq. m, i.e. 27%) and outlet facilities (0.24 million sq. m, i.e. 2%).
In 2016, 22 new retail and service facilities were opened, including 15 shopping malls, PosnaniainPoznań(99,000sq.m)andGaleriaMetropoliainGdańsk(34,000 sq. m) being the largest.
67%
10%
2%5%
1%15%
Structure of retail space opened in 2016 by format and investment type
Extended shopping parks
Extended shopping malls
Commercial warehouses
New shopping malls
Extended shopping malls
New shopping parks
Source: Cushman&Wakefield analyses
Thirteen commercial facilities have been extended and modernised (74 sq. m for lease, i.e. 16% of the annual supply). The largest investments included extending the existing malls with separate shop buildings, such as Agata furniture shop at PH Targówek in Warsaw or Leroy Merlin offering construction materials at Galeria Sudecka in Jelenia Góra.
In mature markets (i.e. in large cities), the average share of unused space reached 3.3% at the end of 2016. Warsaw was the bestinthisrespect(1.9%),whilePoznań,TricityandWrocławhadthehighestrates(6.2%, 4.5% and 4.1%, respectively). The projected rate of unused space shall be stable and reach up to 5% for the most developed markets.
In 2017 an increase in supply by 400,000 sq. m is projected, with 360,000 sq. m being already under construction. In September 2017, North Gallery was opened in Warsaw (64,000 sq. m). Other investments, such as Wroclavia (64,000 sq.m),ForumGdańsk(62,000sq.m)andSerenda (41,300 sq.m) in Kraków are quite advanced.
Development of smaller, local malls is also projected. The share of retail space in towns below 100,000 inhabitants shall increase to 18% of the total supply of this kind of space. Interest in sales outlet facilities, among others in Bydgoszcz, Toruń,Kraków,RzeszóworGliwice,hasbeen growing.
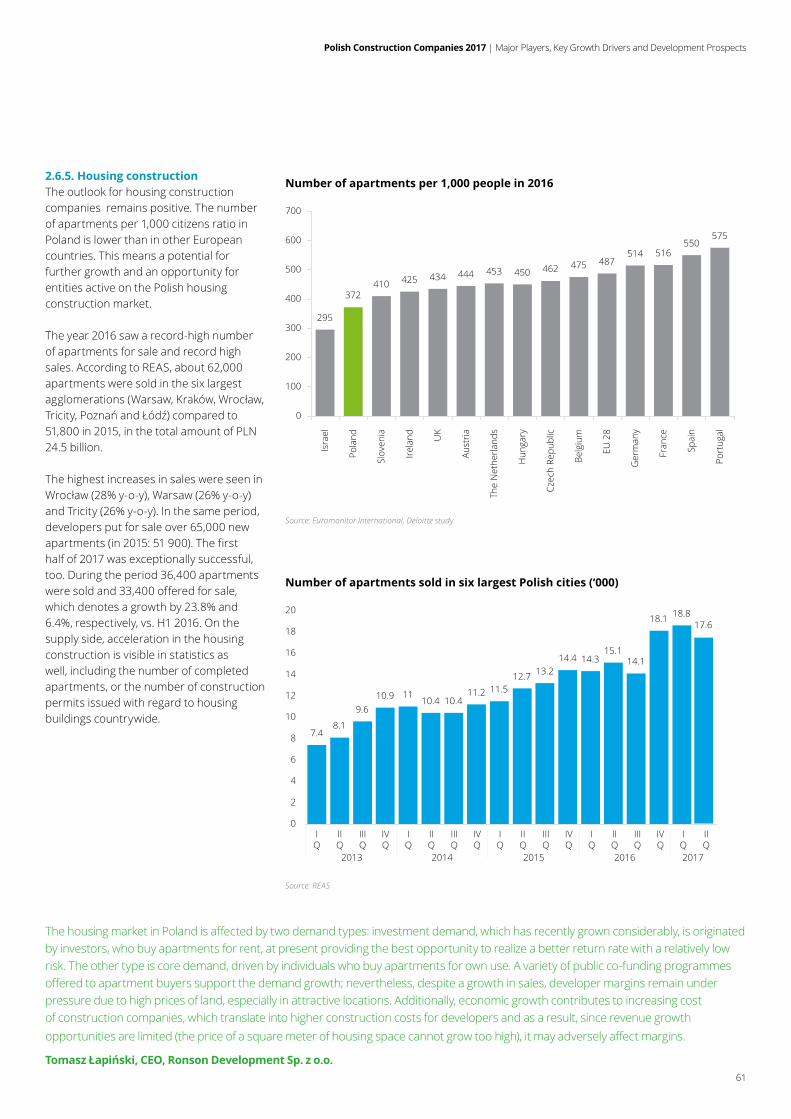
Polish Construction Companies 2017 | Major Players, Key Growth Drivers and Development Prospects
61
2.6.5. Housing constructionThe outlook for housing construction companies remains positive. The number of apartments per 1,000 citizens ratio in Poland is lower than in other European countries. This means a potential for further growth and an opportunity for entities active on the Polish housing construction market.
The year 2016 saw a record-high number of apartments for sale and record high sales. According to REAS, about 62,000 apartments were sold in the six largest agglomerations(Warsaw,Kraków,Wrocław,Tricity,PoznańandŁódź)comparedto51,800 in 2015, in the total amount of PLN 24.5 billion.
The highest increases in sales were seen in Wrocław(28%y-o-y),Warsaw(26%y-o-y)and Tricity (26% y-o-y). In the same period, developers put for sale over 65,000 new apartments (in 2015: 51 900). The first half of 2017 was exceptionally successful, too. During the period 36,400 apartments were sold and 33,400 offered for sale, which denotes a growth by 23.8% and 6.4%, respectively, vs. H1 2016. On the supply side, acceleration in the housing construction is visible in statistics as well, including the number of completed apartments, or the number of construction permits issued with regard to housing buildings countrywide.
295
372410 425 434 444 453 450 462 475 487
514 516550
575
0
100
200
300
400
500
600
700
Isra
el
Pola
nd
Slov
enia
Irela
nd UK
Aust
ria
The
Net
herla
nds
Hun
gary
Czec
h Re
publ
ic
Belg
ium
EU 2
8
Ger
man
y
Fran
ce
Spai
n
Port
ugal
Number of apartments per 1,000 people in 2016
Source: Euromonitor International, Deloitte study
7.48.1
9.610.9 11
10.4 10.411.2 11.5
12.7 13.214.4 14.3
15.114.1
18.1 18.8
0
2
4
6
8
10
12
14
16
18
20
IQ
IIQ
IIIQ
IVQ
IQ
IIQ
IIIQ
IVQ
IQ
IIQ
IIIQ
IVQ
IQ
IIQ
IIIQ
IVQ
17.6
IQ
IIQ
2013 2014 2015 2016 2017
Number of apartments sold in six largest Polish cities (‘000)
Source: REAS
ThehousingmarketinPolandisaffectedbytwodemandtypes:investmentdemand,whichhasrecentlygrownconsiderably,isoriginatedby investors, who buy apartments for rent, at present providing the best opportunity to realize a better return rate with a relatively low risk. The other type is core demand, driven by individuals who buy apartments for own use. A variety of public co-funding programmes offeredtoapartmentbuyerssupportthedemandgrowth;nevertheless,despiteagrowthinsales,developermarginsremainunderpressure due to high prices of land, especially in attractive locations. Additionally, economic growth contributes to increasing cost of construction companies, which translate into higher construction costs for developers and as a result, since revenue growth opportunitiesarelimited(thepriceofasquaremeterofhousingspacecannotgrowtoohigh),itmayadverselyaffectmargins.
Tomasz Łapiński, CEO, Ronson Development Sp. z o.o.
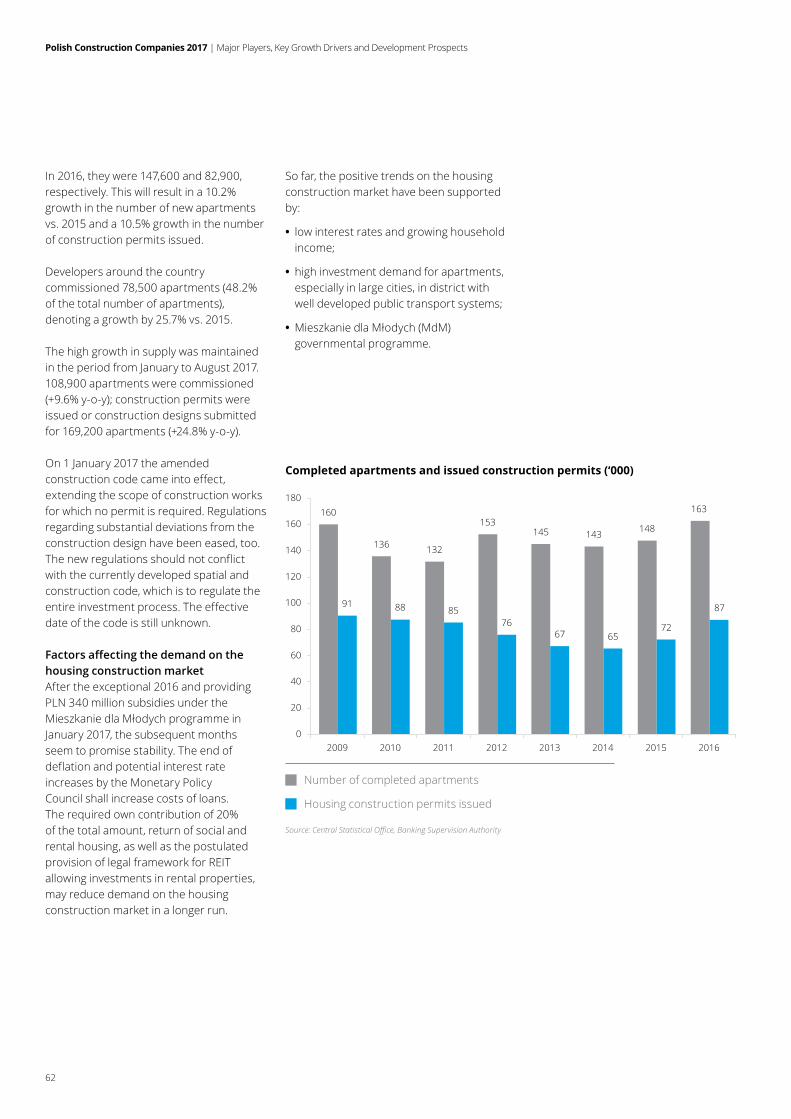
Polish Construction Companies 2017 | Major Players, Key Growth Drivers and Development Prospects
62
In 2016, they were 147,600 and 82,900, respectively. This will result in a 10.2% growth in the number of new apartments vs. 2015 and a 10.5% growth in the number of construction permits issued.
Developers around the country commissioned 78,500 apartments (48.2% of the total number of apartments), denoting a growth by 25.7% vs. 2015.
The high growth in supply was maintained in the period from January to August 2017. 108,900 apartments were commissioned (+9.6% y-o-y); construction permits were issued or construction designs submitted for 169,200 apartments (+24.8% y-o-y).
On 1 January 2017 the amended construction code came into effect, extending the scope of construction works for which no permit is required. Regulations regarding substantial deviations from the construction design have been eased, too. The new regulations should not conflict with the currently developed spatial and construction code, which is to regulate the entire investment process. The effective date of the code is still unknown.
Factors affecting the demand on the housing construction marketAfter the exceptional 2016 and providing PLN 340 million subsidies under the MieszkaniedlaMłodychprogrammeinJanuary 2017, the subsequent months seem to promise stability. The end of deflation and potential interest rate increases by the Monetary Policy Council shall increase costs of loans. The required own contribution of 20% of the total amount, return of social and rental housing, as well as the postulated provision of legal framework for REIT allowing investments in rental properties, may reduce demand on the housing construction market in a longer run.
Completed apartments and issued construction permits (‘000)
160
136 132
153145 143 148
163
91 88 8576
67 6572
87
0
20
40
60
80
100
120
140
160
180
2009 2010 2011 2012 2013 2014 2015 2016
Source: Central Statistical Office, Banking Supervision Authority
Number of completed apartments
Housing construction permits issued
So far, the positive trends on the housing construction market have been supported by:
• low interest rates and growing household income;
• high investment demand for apartments, especially in large cities, in district with well developed public transport systems;
• MieszkaniedlaMłodych(MdM)governmental programme.
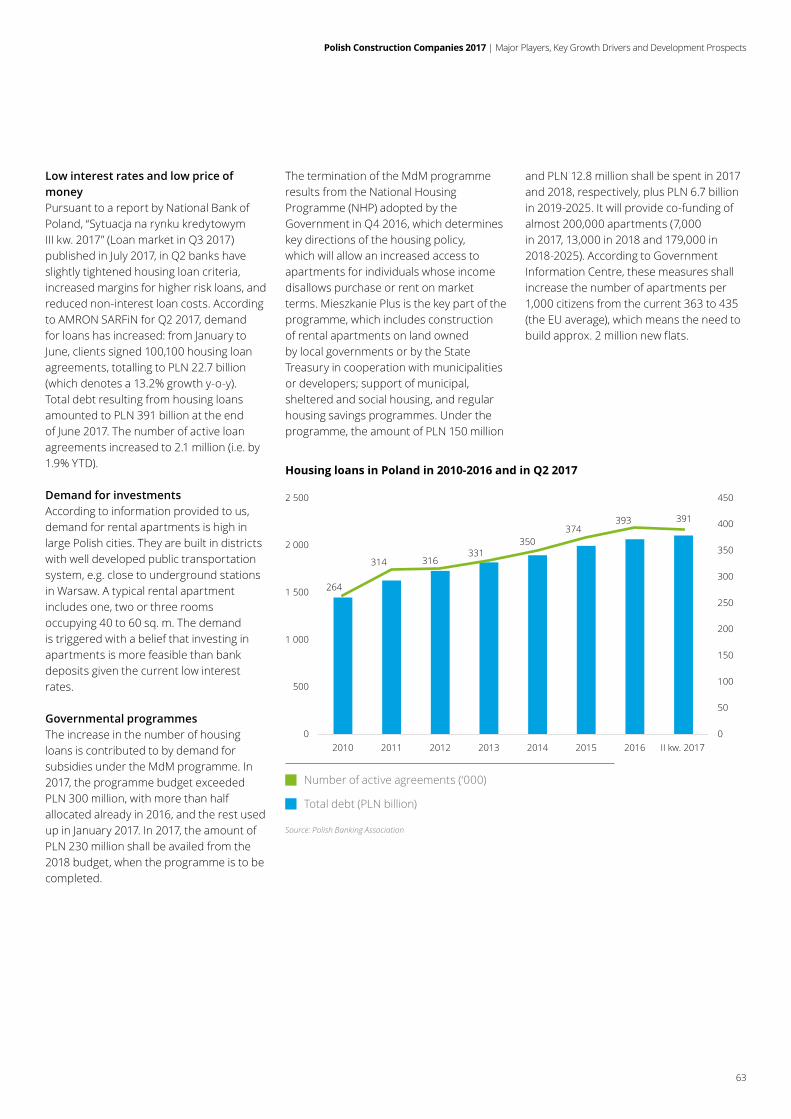
Polish Construction Companies 2017 | Major Players, Key Growth Drivers and Development Prospects
63
Low interest rates and low price of moneyPursuant to a report by National Bank of Poland, “Sytuacja na rynku kredytowym III kw. 2017” (Loan market in Q3 2017) published in July 2017, in Q2 banks have slightly tightened housing loan criteria, increased margins for higher risk loans, and reduced non-interest loan costs. According to AMRON SARFiN for Q2 2017, demand for loans has increased: from January to June, clients signed 100,100 housing loan agreements, totalling to PLN 22.7 billion (which denotes a 13.2% growth y-o-y). Total debt resulting from housing loans amounted to PLN 391 billion at the end of June 2017. The number of active loan agreements increased to 2.1 million (i.e. by 1.9% YTD).
Demand for investmentsAccording to information provided to us, demand for rental apartments is high in large Polish cities. They are built in districts with well developed public transportation system, e.g. close to underground stations in Warsaw. A typical rental apartment includes one, two or three rooms occupying 40 to 60 sq. m. The demand is triggered with a belief that investing in apartments is more feasible than bank deposits given the current low interest rates.
Governmental programmesThe increase in the number of housing loans is contributed to by demand for subsidies under the MdM programme. In 2017, the programme budget exceeded PLN 300 million, with more than half allocated already in 2016, and the rest used up in January 2017. In 2017, the amount of PLN 230 million shall be availed from the 2018 budget, when the programme is to be completed.
264
314 316331
350374
393 391
0
50
100
150
200
250
300
350
400
450
0
500
1 000
1 500
2 000
2 500
2010 2011 2012 2013 2014 2015 2016 II kw. 2017
Housing loans in Poland in 2010-2016 and in Q2 2017
Source: Polish Banking Association
Number of active agreements (‘000)
Total debt (PLN billion)
The termination of the MdM programme results from the National Housing Programme (NHP) adopted by the Government in Q4 2016, which determines key directions of the housing policy, which will allow an increased access to apartments for individuals whose income disallows purchase or rent on market terms. Mieszkanie Plus is the key part of the programme, which includes construction of rental apartments on land owned by local governments or by the State Treasury in cooperation with municipalities or developers; support of municipal, sheltered and social housing, and regular housing savings programmes. Under the programme, the amount of PLN 150 million
and PLN 12.8 million shall be spent in 2017 and 2018, respectively, plus PLN 6.7 billion in 2019-2025. It will provide co-funding of almost 200,000 apartments (7,000in 2017, 13,000 in 2018 and 179,000 in 2018-2025). According to Government Information Centre, these measures shall increase the number of apartments per 1,000 citizens from the current 363 to 435 (the EU average), which means the need to build approx. 2 million new flats.
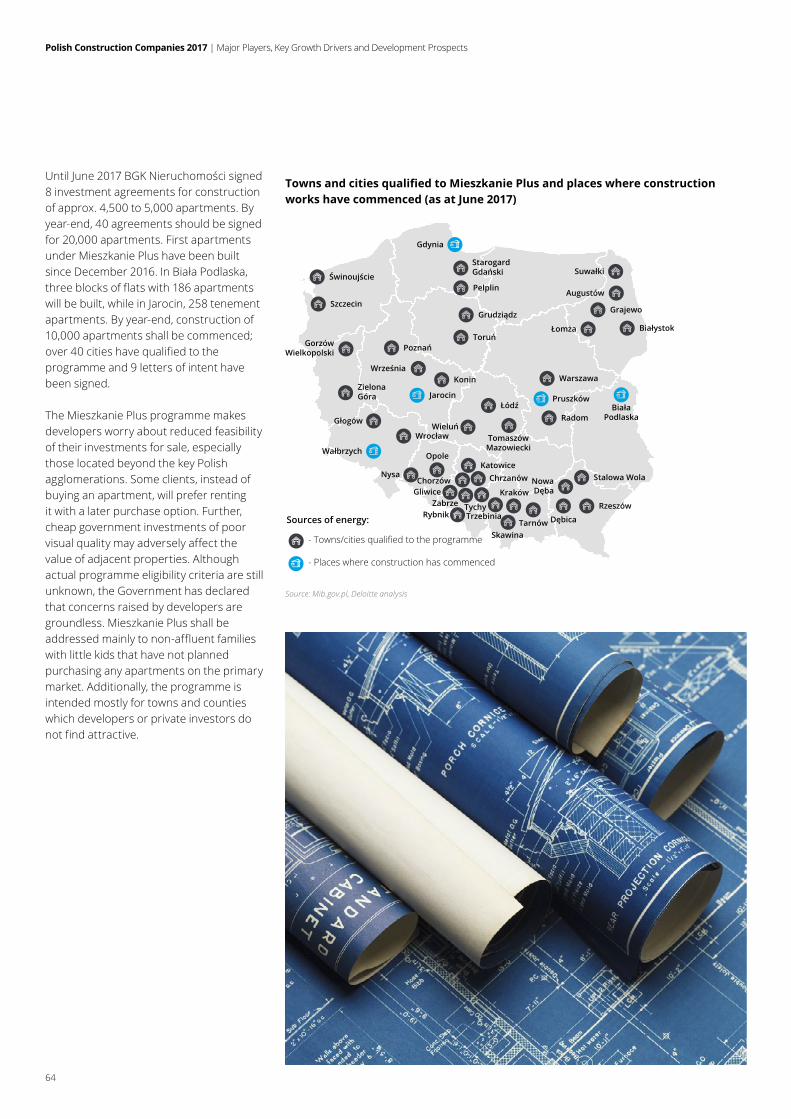
Polish Construction Companies 2017 | Major Players, Key Growth Drivers and Development Prospects
64
UntilJune2017BGKNieruchomościsigned8 investment agreements for construction of approx. 4,500 to 5,000 apartments. By year-end, 40 agreements should be signed for 20,000 apartments. First apartments under Mieszkanie Plus have been built sinceDecember2016.InBiałaPodlaska,three blocks of flats with 186 apartments will be built, while in Jarocin, 258 tenement apartments. By year-end, construction of 10,000 apartments shall be commenced; over 40 cities have qualified to the programme and 9 letters of intent have been signed.
The Mieszkanie Plus programme makes developers worry about reduced feasibility of their investments for sale, especially those located beyond the key Polish agglomerations. Some clients, instead of buying an apartment, will prefer renting it with a later purchase option. Further, cheap government investments of poor visual quality may adversely affect the value of adjacent properties. Although actual programme eligibility criteria are still unknown, the Government has declared that concerns raised by developers are groundless. Mieszkanie Plus shall be addressed mainly to non-affluent families with little kids that have not planned purchasing any apartments on the primary market. Additionally, the programme is intended mostly for towns and counties which developers or private investors do not find attractive.
Towns and cities qualified to Mieszkanie Plus and places where construction works have commenced (as at June 2017)
Source: Mib.gov.pl, Deloitte analysis
Suwałki
Sources of energy:
- Towns/cities qualified to the programme
- Places where construction has commenced
Augustów
Grajewo
Łomża Białystok
Gdynia
StarogardGdański
Pelplin
BiałaPodlaska
Świnoujście
SzczecinGrudziądz
Toruń
Konin
Jarocin
Września
PoznańGorzówWielkopolski
ZielonaGóra
Głogów
Wałbrzych
Wrocław
Łódź
Warszawa
Pruszków
Radom
Stalowa Wola
Rzeszów
Dębica
NowaDęba
Tarnów
Kraków
Skawina
Trzebinia
ChrzanówKatowice
Chorzów
TychyZabrzeRybnik
Gliwice
Opole
Nysa
WieluńTomaszówMazowiecki
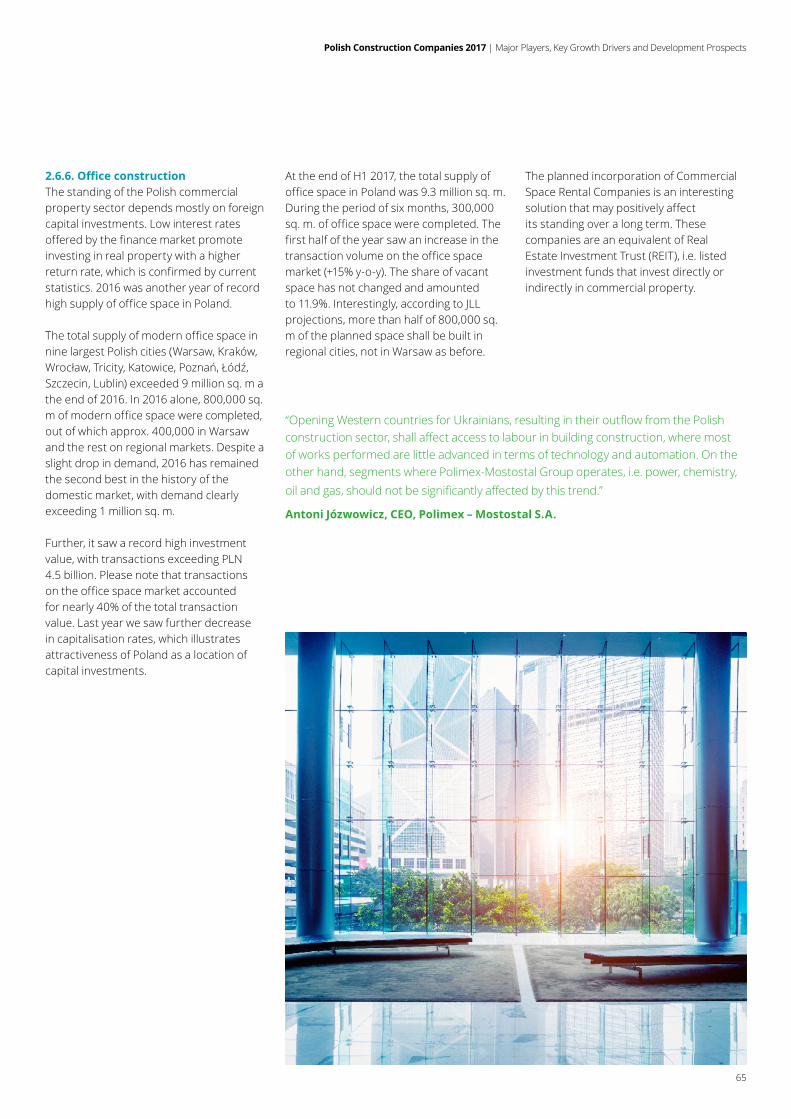
Polish Construction Companies 2017 | Major Players, Key Growth Drivers and Development Prospects
65
2.6.6. Office constructionThe standing of the Polish commercial property sector depends mostly on foreign capital investments. Low interest rates offered by the finance market promote investing in real property with a higher return rate, which is confirmed by current statistics. 2016 was another year of record high supply of office space in Poland.
The total supply of modern office space in nine largest Polish cities (Warsaw, Kraków, Wrocław,Tricity,Katowice,Poznań,Łódź,Szczecin, Lublin) exceeded 9 million sq. m a the end of 2016. In 2016 alone, 800,000 sq. m of modern office space were completed, out of which approx. 400,000 in Warsaw and the rest on regional markets. Despite a slight drop in demand, 2016 has remained the second best in the history of the domestic market, with demand clearly exceeding 1 million sq. m.
Further, it saw a record high investment value, with transactions exceeding PLN 4.5 billion. Please note that transactions on the office space market accounted for nearly 40% of the total transaction value. Last year we saw further decrease in capitalisation rates, which illustrates attractiveness of Poland as a location of capital investments.
At the end of H1 2017, the total supply of office space in Poland was 9.3 million sq. m. During the period of six months, 300,000 sq. m. of office space were completed. The first half of the year saw an increase in the transaction volume on the office space market (+15% y-o-y). The share of vacant space has not changed and amounted to 11.9%. Interestingly, according to JLL projections, more than half of 800,000 sq. m of the planned space shall be built in regional cities, not in Warsaw as before.
The planned incorporation of Commercial Space Rental Companies is an interesting solution that may positively affect its standing over a long term. These companies are an equivalent of Real Estate Investment Trust (REIT), i.e. listed investment funds that invest directly or indirectly in commercial property.
“OpeningWesterncountriesforUkrainians,resultingintheiroutflowfromthePolishconstructionsector,shallaffectaccesstolabourinbuildingconstruction,wheremostof works performed are little advanced in terms of technology and automation. On the other hand, segments where Polimex-Mostostal Group operates, i.e. power, chemistry, oilandgas,shouldnotbesignificantlyaffectedbythistrend.”
Antoni Józwowicz, CEO, Polimex – Mostostal S.A.
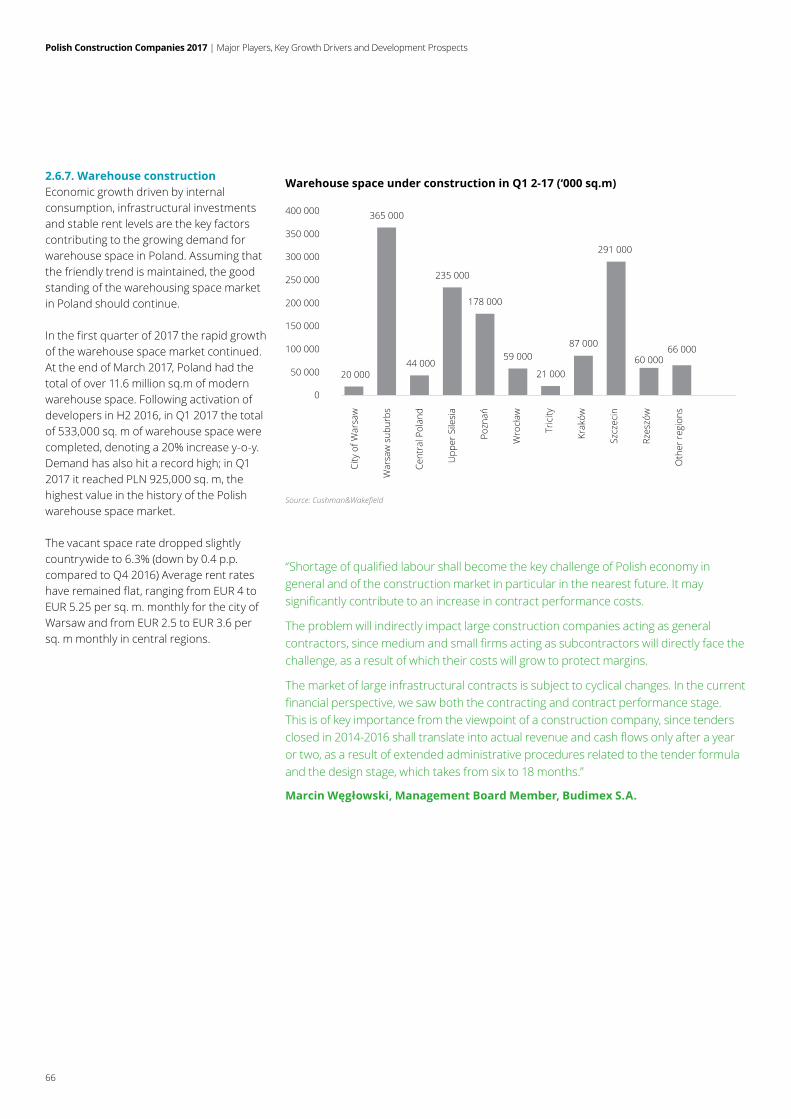
Polish Construction Companies 2017 | Major Players, Key Growth Drivers and Development Prospects
66
2.6.7. Warehouse constructionEconomic growth driven by internal consumption, infrastructural investments and stable rent levels are the key factors contributing to the growing demand for warehouse space in Poland. Assuming that the friendly trend is maintained, the good standing of the warehousing space market in Poland should continue.
In the first quarter of 2017 the rapid growth of the warehouse space market continued. At the end of March 2017, Poland had the total of over 11.6 million sq.m of modern warehouse space. Following activation of developers in H2 2016, in Q1 2017 the total of 533,000 sq. m of warehouse space were completed, denoting a 20% increase y-o-y. Demand has also hit a record high; in Q1 2017 it reached PLN 925,000 sq. m, the highest value in the history of the Polish warehouse space market.
The vacant space rate dropped slightly countrywide to 6.3% (down by 0.4 p.p. compared to Q4 2016) Average rent rates have remained flat, ranging from EUR 4 to EUR 5.25 per sq. m. monthly for the city of Warsaw and from EUR 2.5 to EUR 3.6 per sq. m monthly in central regions.
20 000
365 000
44 000
235 000
178 000
59 000
21 000
87 000
291 000
60 00066 000
0
50 000
100 000
150 000
200 000
250 000
300 000
350 000
400 000
City
of W
arsa
w
War
saw
sub
urbs
Cent
ral P
olan
d
Upp
er S
ilesi
a
Pozn
ań
Wro
cław
Tric
ity
Krak
ów
Szcz
ecin
Rzes
zów
Oth
er re
gion
s
Warehouse space under construction in Q1 2-17 (‘000 sq.m)
Source: Cushman&Wakefield
“ShortageofqualifiedlabourshallbecomethekeychallengeofPolisheconomyingeneral and of the construction market in particular in the nearest future. It may significantlycontributetoanincreaseincontractperformancecosts.
The problem will indirectly impact large construction companies acting as general contractors,sincemediumandsmallfirmsactingassubcontractorswilldirectlyfacethechallenge, as a result of which their costs will grow to protect margins.
The market of large infrastructural contracts is subject to cyclical changes. In the current financialperspective,wesawboththecontractingandcontractperformancestage.This is of key importance from the viewpoint of a construction company, since tenders closedin2014-2016shalltranslateintoactualrevenueandcashflowsonlyafterayearor two, as a result of extended administrative procedures related to the tender formula and the design stage, which takes from six to 18 months.”
Marcin Węgłowski, Management Board Member, Budimex S.A.
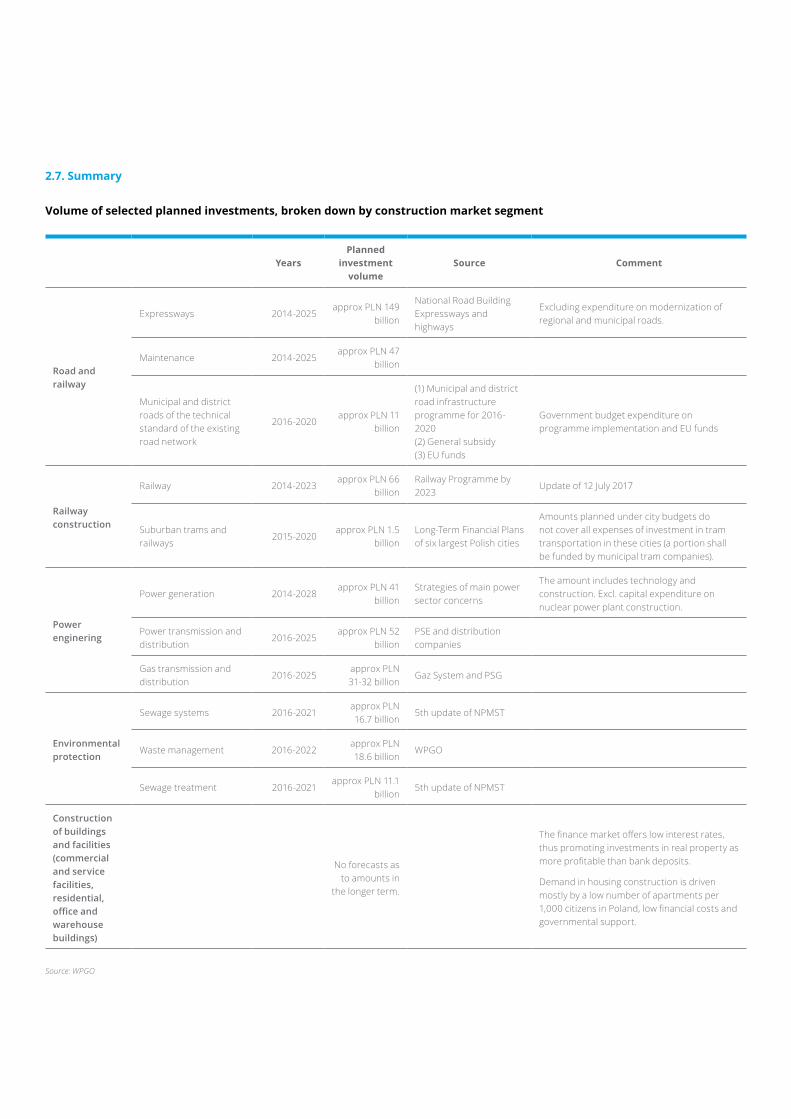
2.7. Summary
YearsPlanned
investment volume
Source Comment
Road and railway
Expressways 2014-2025approx PLN 149
billion
National Road Building Expressways and highways
Excluding expenditure on modernization of regional and municipal roads.
Maintenance 2014-2025approx PLN 47
billion
Municipal and district roads of the technical standard of the existing road network
2016-2020approx PLN 11
billion
(1) Municipal and district road infrastructure programme for 2016-2020(2) General subsidy(3) EU funds
Government budget expenditure on programme implementation and EU funds
Railway construction
Railway 2014-2023approx PLN 66
billionRailway Programme by 2023
Update of 12 July 2017
Suburban trams and railways
2015-2020 approx PLN 1.5
billionLong-Term Financial Plans of six largest Polish cities
Amounts planned under city budgets do not cover all expenses of investment in tram transportation in these cities (a portion shall be funded by municipal tram companies).
Power enginering
Power generation 2014-2028approx PLN 41
billionStrategies of main power sector concerns
The amount includes technology and construction. Excl. capital expenditure on nuclear power plant construction.
Power transmission and distribution
2016-2025approx PLN 52
billionPSE and distributioncompanies
Gas transmission and distribution
2016-2025approx PLN 31-32 billion
Gaz System and PSG
Environmental protection
Sewage systems 2016-2021approx PLN 16.7 billion
5th update of NPMST
Waste management 2016-2022approx PLN 18.6 billion
WPGO
Sewage treatment 2016-2021approx PLN 11.1
billion5th update of NPMST
Construction of buildings and facilities (commercial and service facilities, residential, office and warehouse buildings)
No forecasts as to amounts in
the longer term.
Thefinancemarketofferslowinterestrates,thus promoting investments in real property as moreprofitablethanbankdeposits.
Demand in housing construction is driven mostly by a low number of apartments per 1,000citizensinPoland,lowfinancialcostsandgovernmental support.
Volume of selected planned investments, broken down by construction market segment
Source: WPGO

Polish Construction Companies 2017 | Major Players, Key Growth Drivers and Development Prospects
68
Polish Construction Companies 2017 | Major Players, Key Growth Drivers and Development Prospects
69
Section 3. Profilesoflargest
construction companies
in Poland
Polish Construction Companies 2017 | Major Players, Key Growth Drivers and Development Prospects
70
Budimex Group
Budimex S.A. was established through the conversion of Centrala Handlu Zagranicznego Budownictwa Budimex, founded in 1968 in order to export construction services, mainly to developing markets in Asia and Africa, and to the Socialist block countries.
In the late 1980s and the early 1990s, Budimex became a leading contractor on the Polish market.
In 1992, the enterprise was privatised and two years later converted into a joint-stock company. Since 1995, its shares have been traded on the Warsaw Stock Exchange.
As at 31 December 2016, its key shareholders included Valivala Holdings B.V. (The Netherlands) with 59.1% of shares (a member of the Spanish Ferrovial S.A. Group) and Aviva OFE Aviva BZ WBK with 6.7% of shares.
The Budimex Group provides broadly definedconstructionandassemblyservices acting as a general contractor, both in Poland and abroad, it is a property developer and manager and engages in sales, manufacturing, transport and other activities,whichaccountforaninsignificantpart of its operations.
Along with performing construction operations, Budimex has been acting as an advisory,managementcentreandfinancecentre in the Group.
In 2016, the revenue of the Budimex Group went up by 8.5% year-on-year. Poland and Germany are the key markets where the Group operates. Over 91% of its total sales revenue were generated from construction activities. As compared to 2015, sales in this segment increased by 9% and exceeded PLN 5.1 billion.
The Group’s EBIT was PLN 505.1 million, up byover70%year-on-year.Thenetprofitincreased by over 70% as well.
The net debt increased o by 22.1% y-o-y at the end of 2016. Expenditure for non-financialnon-currentassetsincurredin2016 was similar to that of the year before and amounted to PLN 71 million.
In 2016, the Budimex Group companies entered into construction contracts totalling PLN 5.7 billion. As at 31 December 2016, the Group’s contract portfolio totalled PLN 8.9 billion, which represented a rise by 6% year-on-year.
Its market capitalisation increased by 2% and exceeded PLN 5 billion at the end of 2016.

Polish Construction Companies 2017 | Major Players, Key Growth Drivers and Development Prospects
71
Key data (PLN’000)
2016 2015 2014
Change in percentage
terms '16 vs '15
Assets
Non-current assets 856 936 821 207 677 496 4.4%
Current assets 4 736 729 3 892 157 3 178 532 21.7%
Current assets held for sale 0 0 2 181 0.0%
Total assets 5 593 665 4 713 364 3 858 209 18.7%
Equity and liabilities
Equity 805 820 603 124 522 509 33.6%
Provisions for liabilities 372 138 317 256 290 767 17.3%
Long-term liabilities 278 401 262 535 233 460 6.0%
Short-term liabilities and accruals 4 137 306 3 530 449 2 811 473 17.2%
Total equity and liabilities 5 593 665 4 713 364 3 858 209 18.7%
Profit and loss account
Revenue 5 572 290 5 133 994 4 949 939 8.5%
Domestic sales 5 371 130 4 927 035 4 754 307 9.0%
Foreign sales 201 160 206 959 195 632 -2.8%
Construction operations 5 079 431 4 673 666 4 566 628 8.7%
Other operations 492 859 460 328 383 311 7.1%
EBITDA 531 030 314 566 270 349 68.8%
EBIT 505 107 292 218 247 318 72.9%
Netprofit/loss 410 476 236 520 193 938 73.6%
Other data
Net debt 2 072 711 1 697 114 1 504 048 22.1%
Debt/Balance sheet total 85.6% 87.2% 86.5% -1.8%
Capital expenditure/Revenue 1.3% 1.3% 0.5% -2.1%
Market capitalisation 5 053 683 4 952 839 3 612 509 2,0%
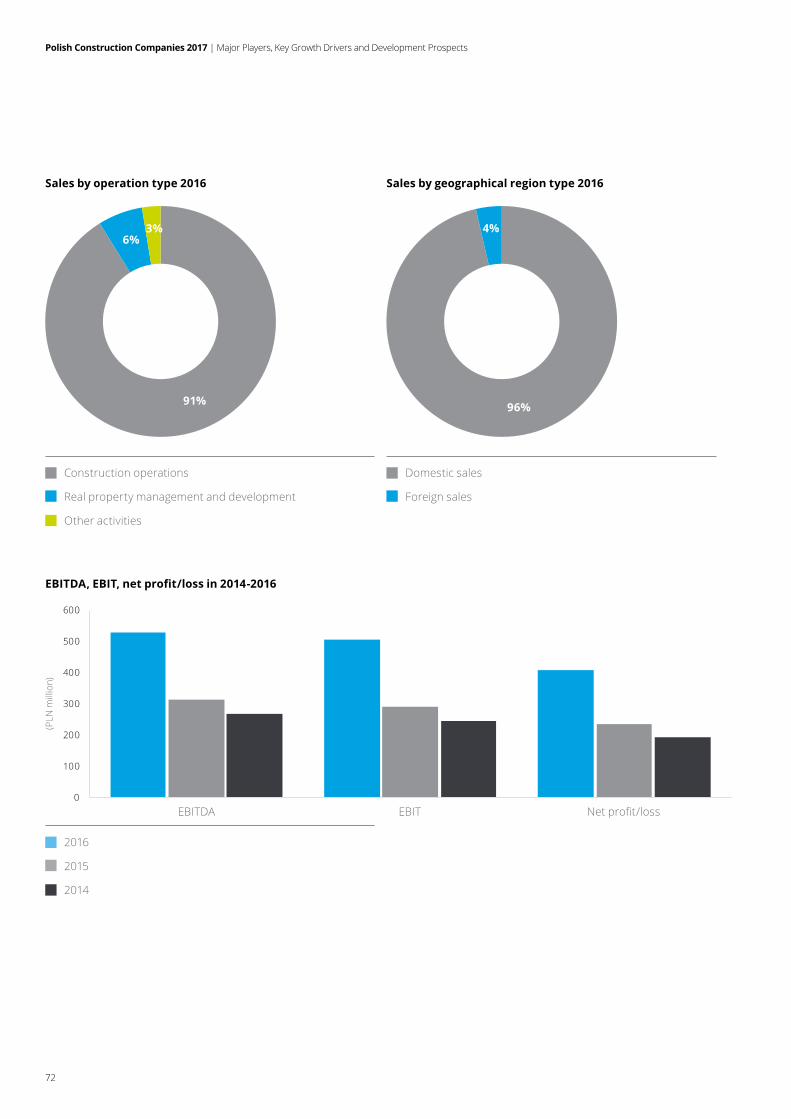
Polish Construction Companies 2017 | Major Players, Key Growth Drivers and Development Prospects
72
0
100
200
300
400
500
600
Sales by operation type 2016 Sales by geographical region type 2016
Construction operations
Real property management and development
Other activities
Domestic sales
Foreign sales
EBITDA, EBIT, net profit/loss in 2014-2016
2016
2015
2014
EBITDA EBIT Netprofit/loss
(PLN
mill
ion)
3%6%
91%
4%
96%
Polish Construction Companies 2017 | Major Players, Key Growth Drivers and Development Prospects
73
Skanska S.A.
Skanska has been operating on the Polish construction market since early 1970’s and has operated in all construction segments, buildingoffice,housing,commercialand industrial facilities. It specializes in road, bridge, railway and hydrotechnical construction as well. In Poland, it has built ZłoteTarasyinWarsaw,thearrivalterminalin International Katowice Pyrzowice Airport, the northern section of A1 motorway and ŚwinnaPorębareservoir.
Skanska is among the founders of the Construction Safety Agreement, an initiative of the largest general contractors operating in Poland, whose mission is to improve construction site security.
General constructionSkanska acts as a general contractor in the building construction segment; its contracts include science and technology parks, sports facilities, healthcare investments, shopping malls and entertainment centres, public utilities, culturalandleisurecentres,offices,hotelsand residential buildings.
Engineering constructionProjects carried out by Skanska S.A. include transport infrastructure, railways, hydrotechnical facilities and environmental protection initiatives.
Unlike in previous editions of the report, presenting the consolidated data of the entire capital group, for this edition of our report, we have received only selected financialdataofSkanskaS.A.
Revenue of Skanska S.A. in 2016 amounted to PLN 3.8 billion (compared to PLN 4.4 billion in 2015 regarding the Skanska Group in Poland; we did not provide data for Skanska SA itself for 2015). In 2016, the Company employed over 7,400 people.
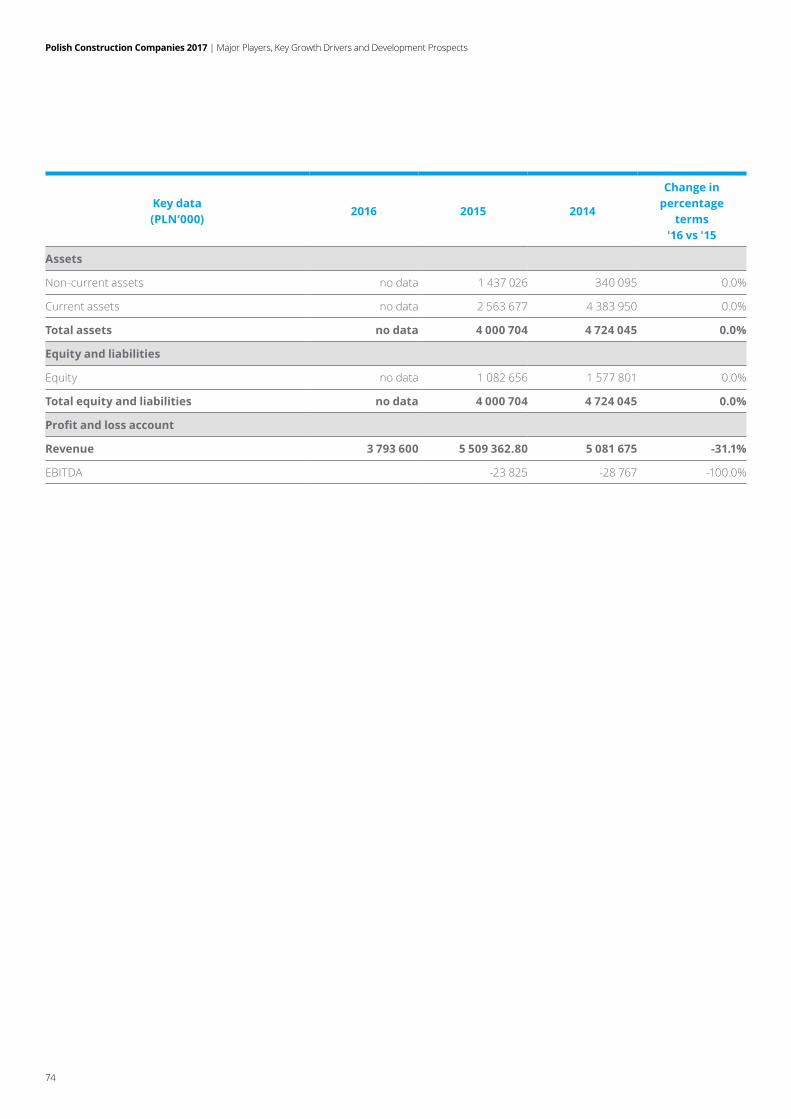
Polish Construction Companies 2017 | Major Players, Key Growth Drivers and Development Prospects
74
Key data (PLN’000)
2016 2015 2014
Change in percentage
terms '16 vs '15
Assets
Non-current assets no data 1 437 026 340 095 0.0%
Current assets no data 2 563 677 4 383 950 0.0%
Total assets no data 4 000 704 4 724 045 0.0%
Equity and liabilities
Equity no data 1 082 656 1 577 801 0.0%
Total equity and liabilities no data 4 000 704 4 724 045 0.0%
Profit and loss account
Revenue 3 793 600 5 509 362.80 5 081 675 -31.1%
EBITDA -23 825 -28 767 -100.0%
Polish Construction Companies 2017 | Major Players, Key Growth Drivers and Development Prospects
75
Strabag
Strabag is a European construction concern with over a hundred years of professional tradition. It has been operating in Poland since 1987.
Its key companies in Poland are STRABAG Sp. z o.o. and Strabag Infrastruktura PołudnieSp.zo.o.
Their key operations include general construction, infrastructure, bridge and railway construction. STRABAG operates in other sectors as well, among others in hydrotechnical and power construction, acting also as a property developer and facility manager.
ThefinancialstatementsoftheSTRABAGGroup are not consolidated at the local level.
STRABAG SP. Z O.O.The operations of STRABAG Sp. z o.o. focus mainly on infrastructure investments as well as on general construction and construction engineering. Its other projects include environmental protection, railway construction, modernization and construction of wharves, industrial and power engineering construction, also in relation to renewable energy.
In 2016, the Company’s revenue decreased by 22.7% y-o-y and amounted to PLN 2.5 billion.
It generated a positive EBIT of PLN 216 millionandnetprofitofPLN203million.
Its net debt decreased by nearly 40% y-o-y and amounted to PLN 209 million at the end of 2016.
The STRABAG Group companies do not use any external sources of funding and participate in a cash pool system instead.
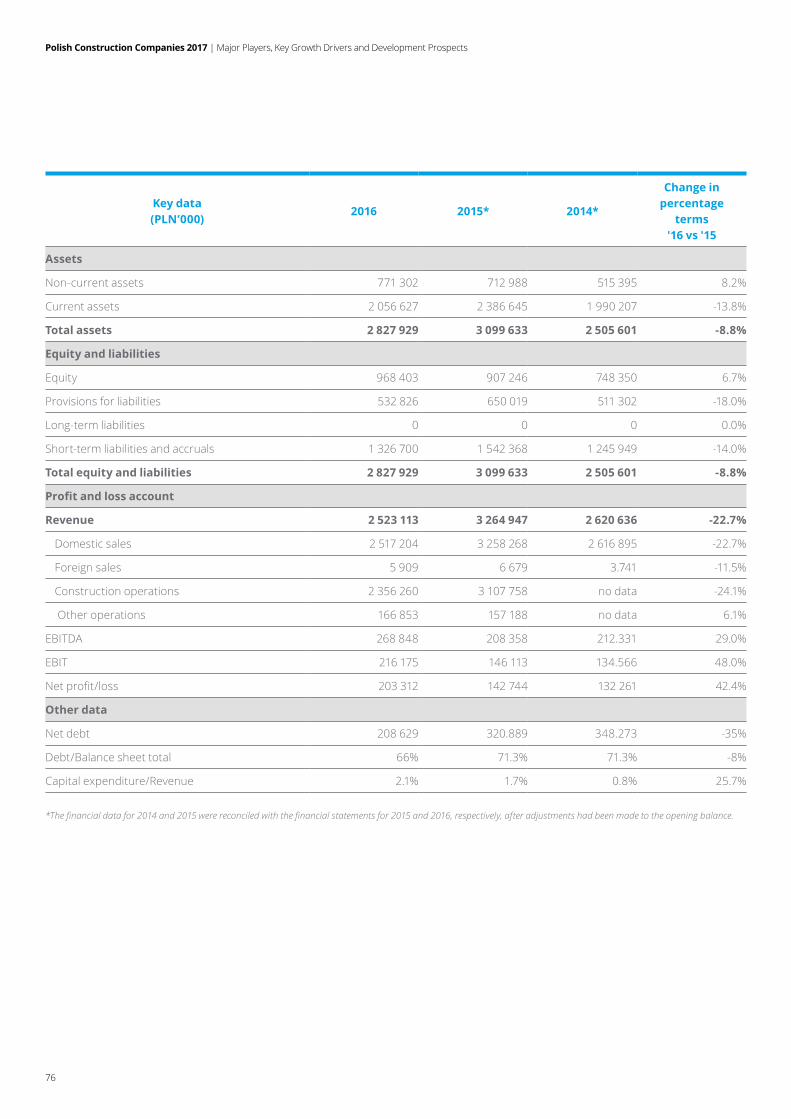
Polish Construction Companies 2017 | Major Players, Key Growth Drivers and Development Prospects
76
Key data (PLN’000)
2016 2015* 2014*
Change in percentage
terms '16 vs '15
Assets
Non-current assets 771 302 712 988 515 395 8.2%
Current assets 2 056 627 2 386 645 1 990 207 -13.8%
Total assets 2 827 929 3 099 633 2 505 601 -8.8%
Equity and liabilities
Equity 968 403 907 246 748 350 6.7%
Provisions for liabilities 532 826 650 019 511 302 -18.0%
Long-term liabilities 0 0 0 0.0%
Short-term liabilities and accruals 1 326 700 1 542 368 1 245 949 -14.0%
Total equity and liabilities 2 827 929 3 099 633 2 505 601 -8.8%
Profit and loss account
Revenue 2 523 113 3 264 947 2 620 636 -22.7%
Domestic sales 2 517 204 3 258 268 2 616 895 -22.7%
Foreign sales 5 909 6 679 3.741 -11.5%
Construction operations 2 356 260 3 107 758 no data -24.1%
Other operations 166 853 157 188 no data 6.1%
EBITDA 268 848 208 358 212.331 29.0%
EBIT 216 175 146 113 134.566 48.0%
Netprofit/loss 203 312 142 744 132 261 42.4%
Other data
Net debt 208 629 320.889 348.273 -35%
Debt/Balance sheet total 66% 71.3% 71.3% -8%
Capital expenditure/Revenue 2.1% 1.7% 0.8% 25.7%
*The financial data for 2014 and 2015 were reconciled with the financial statements for 2015 and 2016, respectively, after adjustments had been made to the opening balance.
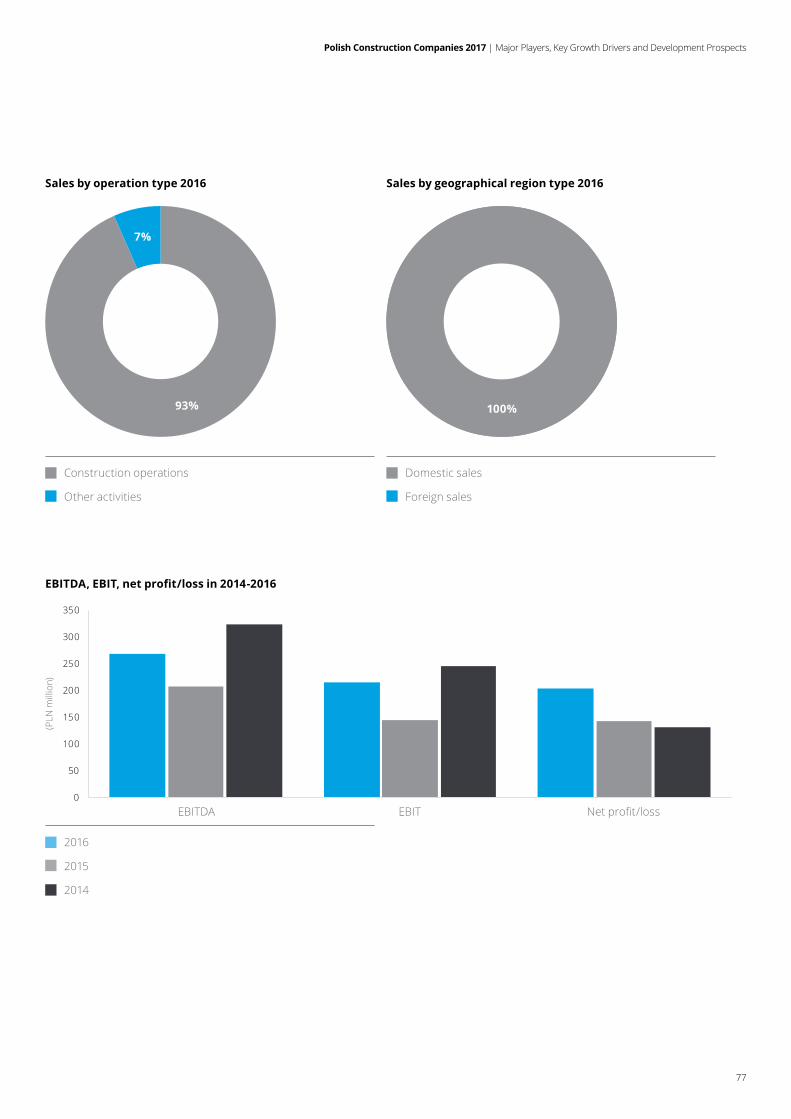
Polish Construction Companies 2017 | Major Players, Key Growth Drivers and Development Prospects
77
0
50
100
150
200
250
300
350
Sales by operation type 2016 Sales by geographical region type 2016
Construction operations
Other activities
Domestic sales
Foreign sales
EBITDA, EBIT, net profit/loss in 2014-2016
2016
2015
2014
EBITDA EBIT Netprofit/loss
(PLN
mill
ion)
93%
7%
100%
Polish Construction Companies 2017 | Major Players, Key Growth Drivers and Development Prospects
78
Strabag Infrastruktura PołudnieSp.zo.o.The Company has been active on the Polish market for 20 years and its business focuses mainly on design and construction works in the sector of roads and bridges as wellasairfieldpavements.Untiltheendof2014, it had operated as Heilit+ Woerner Sp Sp. zo.o. It adopted the name of STRABAG undertheimageunificationcampaign.It has specialized mainly in concrete pavements. The major part of its revenue is generated in Poland.
The operations of Strabag Infrastruktura Południearenotparticularlydiversified.In 2016, the Company generated revenue of PLN 900.5 million, which denotes a 55%increasey-o-y.ItsEBITandnetprofitamounted to PLN 28.2 million and PLN 27.4 million, respectively, and both decreased year-on-year.
Thecompany'soperationsarefinancedmainly with cash pool loans from related parties.
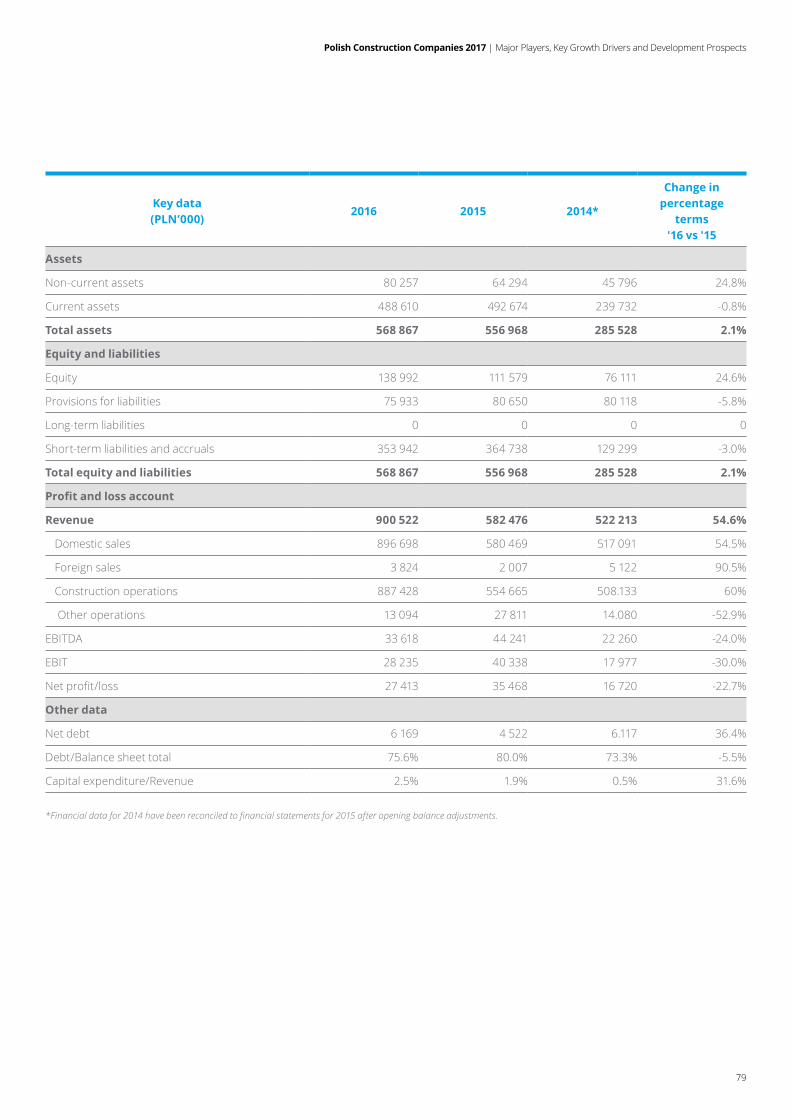
Polish Construction Companies 2017 | Major Players, Key Growth Drivers and Development Prospects
79
Key data (PLN’000)
2016 2015 2014*
Change in percentage
terms '16 vs '15
Assets
Non-current assets 80 257 64 294 45 796 24.8%
Current assets 488 610 492 674 239 732 -0.8%
Total assets 568 867 556 968 285 528 2.1%
Equity and liabilities
Equity 138 992 111 579 76 111 24.6%
Provisions for liabilities 75 933 80 650 80 118 -5.8%
Long-term liabilities 0 0 0 0
Short-term liabilities and accruals 353 942 364 738 129 299 -3.0%
Total equity and liabilities 568 867 556 968 285 528 2.1%
Profit and loss account
Revenue 900 522 582 476 522 213 54.6%
Domestic sales 896 698 580 469 517 091 54.5%
Foreign sales 3 824 2 007 5 122 90.5%
Construction operations 887 428 554 665 508.133 60%
Other operations 13 094 27 811 14.080 -52.9%
EBITDA 33 618 44 241 22 260 -24.0%
EBIT 28 235 40 338 17 977 -30.0%
Netprofit/loss 27 413 35 468 16 720 -22.7%
Other data
Net debt 6 169 4 522 6.117 36.4%
Debt/Balance sheet total 75.6% 80.0% 73.3% -5.5%
Capital expenditure/Revenue 2.5% 1.9% 0.5% 31.6%
*Financial data for 2014 have been reconciled to financial statements for 2015 after opening balance adjustments.
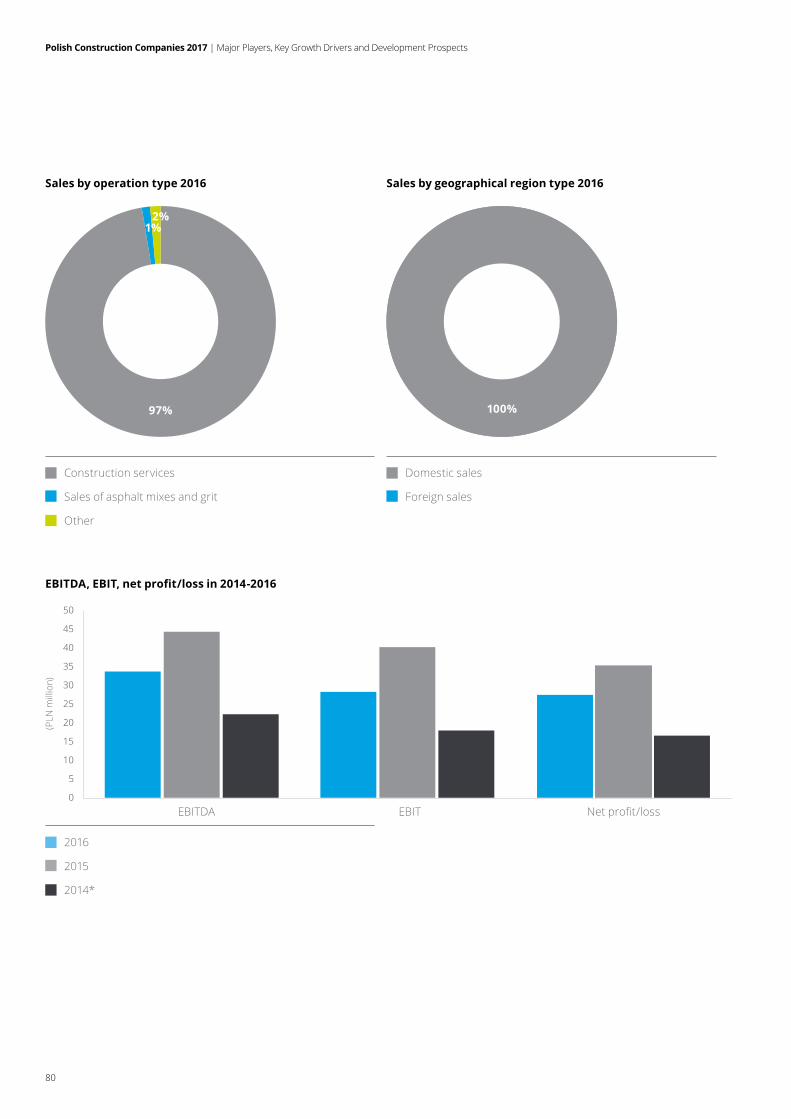
Polish Construction Companies 2017 | Major Players, Key Growth Drivers and Development Prospects
80
100%
Sales by operation type 2016 Sales by geographical region type 2016
Construction services
Sales of asphalt mixes and grit
Other
Domestic sales
Foreign sales
EBITDA, EBIT, net profit/loss in 2014-2016
2016
2015
2014*
EBITDA EBIT Netprofit/loss
(PLN
mill
ion)
0
5
10
15
20
25
30
35
40
45
50
97%
2%1%
Polish Construction Companies 2017 | Major Players, Key Growth Drivers and Development Prospects
81
Polimex-Mostostal Group
The Polimex-Mostostal Group has been ranked among the largest Polish construction and engineering groups for a few years. Polimex-Mostostal S.A. listed on the Warsaw Stock Exchange since 1997 is its parent. Its present legal form has resulted from a merger of Polimex-Cekop S.A.andMostostalSiedlceS.A.effectedin 2004. The history of the entire Group originates from 1945.
Its operations focus on four segments:
• power construction: project delivery including construction, design, overhaul and modernisation of power facilities (among others, power units in Kozienice and Opole power plants);
• oil-chemistry-natural gas: services for the refineryandpetrochemicalindustryandfor the power engineering segment;
• industrial construction: comprehensive services for the segment;
• manufacturing: steel structures and elements, including catwalk grids.
presented its new strategy for the years 2017-2023. The vision involves regaining the leading position on the construction markets.
Along with the parent, the Group includes Polimex Power construction, Naftoremont-Naftobudowa, Mostostal Siedlce, Polimex Budownictwo, Polimex Infrastruktura, Polimex Operator, Polimex Opole, Stalfa, Polimex-Mostostal Ukraine.
In 2016 sales revenue generated by the Group was 4.7% higher than a year before and amounted to nearly PLN 2.7 billion. Most of the amount (PLN 1.9 billion) came from power construction; the general construction segment generated PLN 288 million. 82% of the revenue originated from the domestic market.
The Company closed the year 2016 with a loss of PLN 61 million unlike in 2015, when it hadmanagedtogenerateaprofitofnearlyPLN 69 million after a few years of losses. In 2016, EBIT was negative and amounted to PLN -28 million.
The Group’s debt ratio did not change compared to the prior year.
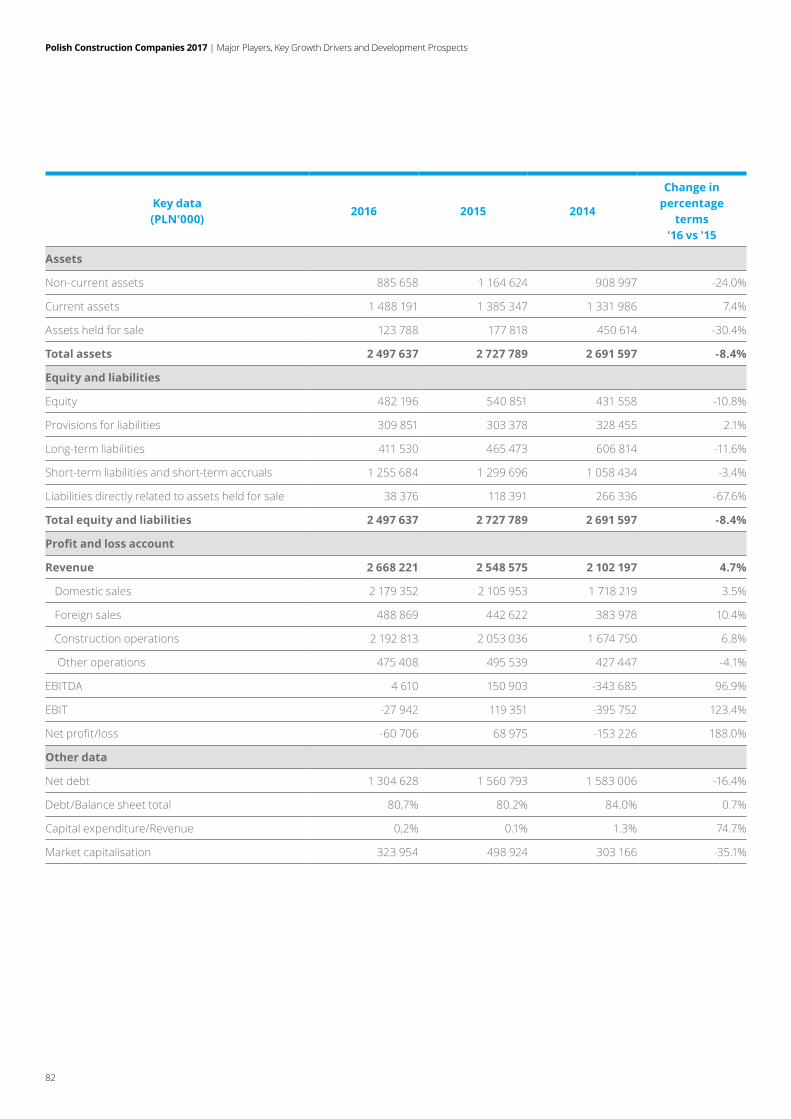
Polish Construction Companies 2017 | Major Players, Key Growth Drivers and Development Prospects
82
Key data (PLN’000)
2016 2015 2014
Change in percentage
terms '16 vs '15
Assets
Non-current assets 885 658 1 164 624 908 997 -24.0%
Current assets 1 488 191 1 385 347 1 331 986 7.4%
Assets held for sale 123 788 177 818 450 614 -30.4%
Total assets 2 497 637 2 727 789 2 691 597 -8.4%
Equity and liabilities
Equity 482 196 540 851 431 558 -10.8%
Provisions for liabilities 309 851 303 378 328 455 2.1%
Long-term liabilities 411 530 465 473 606 814 -11.6%
Short-term liabilities and short-term accruals 1 255 684 1 299 696 1 058 434 -3.4%
Liabilities directly related to assets held for sale 38 376 118 391 266 336 -67.6%
Total equity and liabilities 2 497 637 2 727 789 2 691 597 -8.4%
Profit and loss account
Revenue 2 668 221 2 548 575 2 102 197 4.7%
Domestic sales 2 179 352 2 105 953 1 718 219 3.5%
Foreign sales 488 869 442 622 383 978 10.4%
Construction operations 2 192 813 2 053 036 1 674 750 6.8%
Other operations 475 408 495 539 427 447 -4.1%
EBITDA 4 610 150 903 -343 685 96.9%
EBIT -27 942 119 351 -395 752 123.4%
Netprofit/loss -60 706 68 975 -153 226 188.0%
Other data
Net debt 1 304 628 1 560 793 1 583 006 -16.4%
Debt/Balance sheet total 80,7% 80.2% 84.0% 0.7%
Capital expenditure/Revenue 0,2% 0.1% 1.3% 74.7%
Market capitalisation 323 954 498 924 303 166 -35.1%
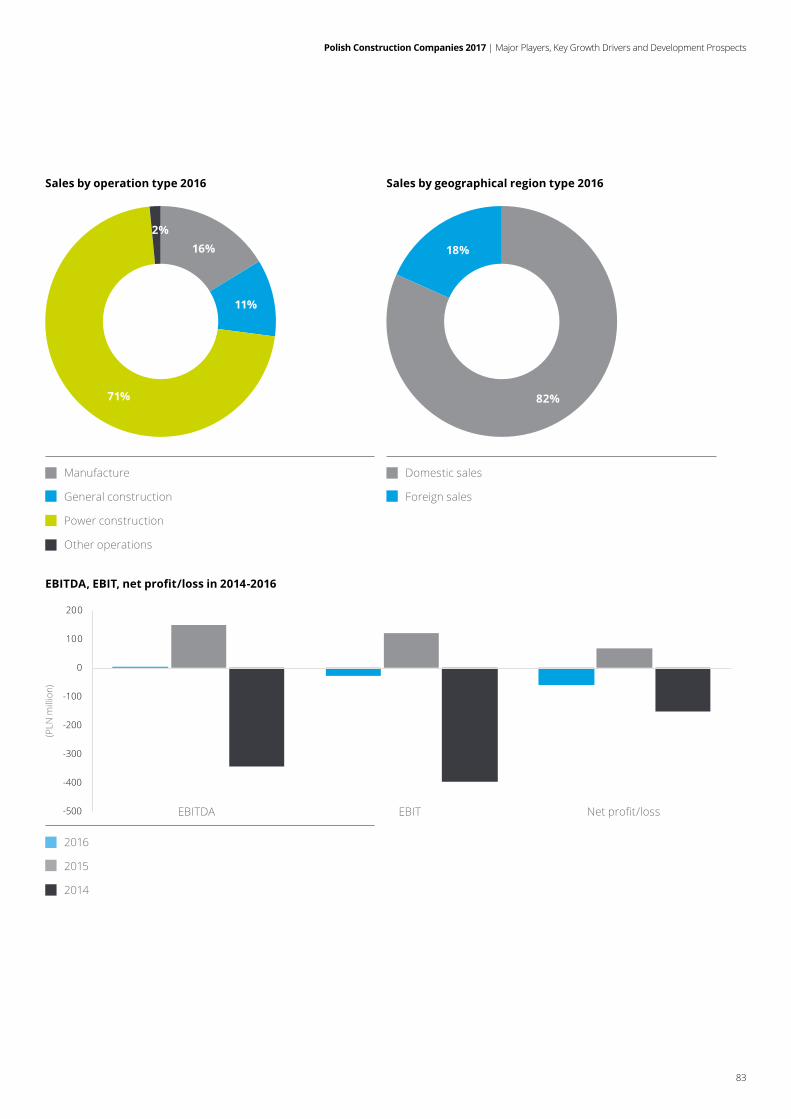
Polish Construction Companies 2017 | Major Players, Key Growth Drivers and Development Prospects
83
-500
-400
-300
-200
-100
0
100
200
Sales by operation type 2016 Sales by geographical region type 2016
Manufacture
General construction
Power construction
Other operations
Domestic sales
Foreign sales
EBITDA, EBIT, net profit/loss in 2014-2016
2016
2015
2014
EBITDA EBIT Netprofit/loss
(PLN
mill
ion)
82%
18%16%
11%
71%
2%
Polish Construction Companies 2017 | Major Players, Key Growth Drivers and Development Prospects
84
PBG Group
The PBG Group has been operating since 1994. It originated as a family business namedPiecobiogazs.c.JerzyWiśniewski,MałgorzataWiśniewska(apartnership).Initially, the entity focused primarily on construction, modernisation and maintenance of pressure reduction and metering stations, as well as construction of steel and polyethylene pipelines for transmission and distribution of natural gas. In 1997, Technologie Gazowe "Piecobiogaz" Sp. z o.o. was established and it took over the key part of the partnership’s business involving construction of gas facilities. Continuous growth and implementation of innovative projects resulted in a change of the company's legal form into a joint-stock company named PBG S.A.
Its IPO on the Warsaw Stock Exchange took place in mid-2004 and enabled the company to secure funding and establish the PBG Capital Group.
Since June 2012, PBG S.A. has been in bankruptcy by arrangement. The vote on the arrangement with creditors was held in August 2015, and approved by the Bankruptcy Court in October 2015. When the decision became binding, in June 2016 negotiations with key creditors were completed.
The Companies and PBG regained full business capacity in September 2016. Pursuant to the assumed timeline, the Management Board of the Company has followed its obligations imposed by the arrangement, including issue of shares andbondsandtheirpublicoffering,aswellas changes in corporate governance and other measures related to restructuring of its assets and operations. Funds obtained from divestment shall become the key source to repay instalments negotiated under the arrangement and to redeem bonds.
At the end of June 2016, Jerzy Wisniewski holding 23.61% of interest in the share capital and 23.61% of the voting rights was the key shareholder of PBG S.A.
At the end of 2016, the value of the PBG Group’s contract portfolio was ca. PLN 4.9 billion, out of which contracts totalling ca. PLN2billionweretobefulfilledin2016andthe remaining part in the following years.
The Group focuses on the domestic market, which remains its key investment location, both in the power sector and in investment planning regarding natural gas and crude oil, as well as hydrotechnical investmentsinanti-floodsystems.
At the end of 2016, the PBG Group saw a 10.5% increase in sales revenue year-on-year. Its performance improved substantially following implementation of the arrangement provisions. The Group's revenue went up from PLN 1.8 billion in 2015 to nearly PLN 2.0 billion in 2016. EBIT andnetprofitwerepositiveandamountedto PLN 820.4 million and PLN 788.7 million, respectively.
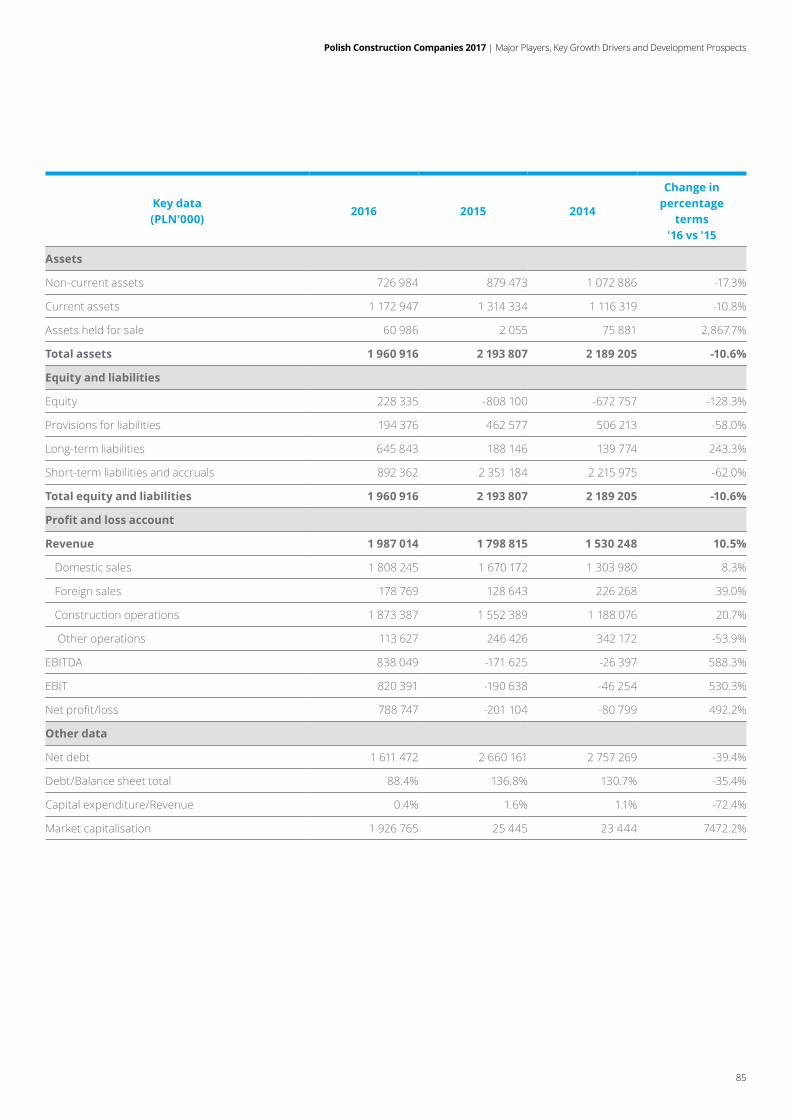
Polish Construction Companies 2017 | Major Players, Key Growth Drivers and Development Prospects
85
Key data (PLN’000)
2016 2015 2014
Change in percentage
terms '16 vs '15
Assets
Non-current assets 726 984 879 473 1 072 886 -17.3%
Current assets 1 172 947 1 314 334 1 116 319 -10.8%
Assets held for sale 60 986 2 055 75 881 2,867.7%
Total assets 1 960 916 2 193 807 2 189 205 -10.6%
Equity and liabilities
Equity 228 335 -808 100 -672 757 -128.3%
Provisions for liabilities 194 376 462 577 506 213 -58.0%
Long-term liabilities 645 843 188 146 139 774 243.3%
Short-term liabilities and accruals 892 362 2 351 184 2 215 975 -62.0%
Total equity and liabilities 1 960 916 2 193 807 2 189 205 -10.6%
Profit and loss account
Revenue 1 987 014 1 798 815 1 530 248 10.5%
Domestic sales 1 808 245 1 670 172 1 303 980 8.3%
Foreign sales 178 769 128 643 226 268 39.0%
Construction operations 1 873 387 1 552 389 1 188 076 20.7%
Other operations 113 627 246 426 342 172 -53.9%
EBITDA 838 049 -171 625 -26 397 588.3%
EBIT 820 391 -190 638 -46 254 530.3%
Netprofit/loss 788 747 -201 104 -80 799 492.2%
Other data
Net debt 1 611 472 2 660 161 2 757 269 -39.4%
Debt/Balance sheet total 88.4% 136.8% 130.7% -35.4%
Capital expenditure/Revenue 0.4% 1.6% 1.1% -72.4%
Market capitalisation 1 926 765 25 445 23 444 7472.2%
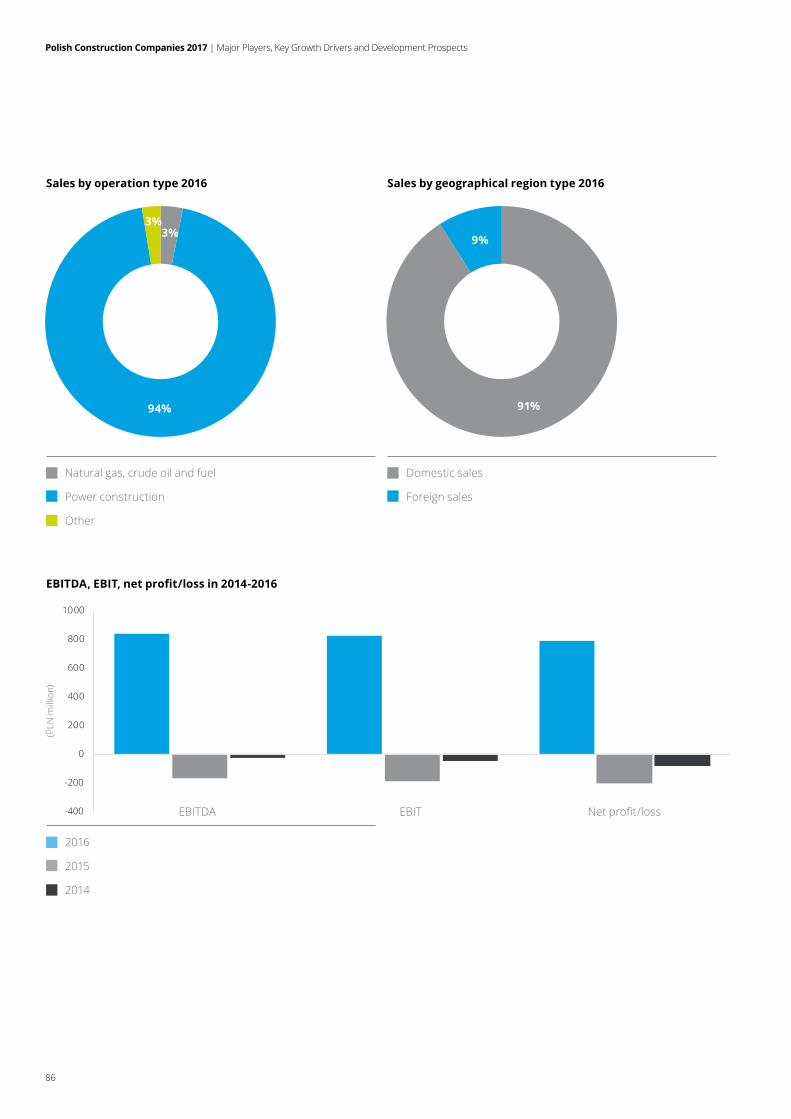
Polish Construction Companies 2017 | Major Players, Key Growth Drivers and Development Prospects
86
-400
-200
0
200
400
600
800
1000
Sales by operation type 2016 Sales by geographical region type 2016
Natural gas, crude oil and fuel
Power construction
Other
Domestic sales
Foreign sales
EBITDA, EBIT, net profit/loss in 2014-2016
2016
2015
2014
EBITDA EBIT Netprofit/loss
(PLN
mill
ion)
91%
9%
94%
3%3%
Polish Construction Companies 2017 | Major Players, Key Growth Drivers and Development Prospects
87
Erbud Group
Erbud originates from 1990, when it commenced operations under the name ofPrzedsiębiorstwoBudowlaneiUsługTechnicznychErbudinToruń.Ayearlater,itsfirstforeignbranchwasopenedintheFederal Republic of Germany. In 2003it changed its name to Erbud Sp. z o.o. andmoveditsheadofficetoWarsaw.At the same time, a subsidiary, Erbud International Sp. z o.o., was incorporated andastrategicinvestor,Wolff&MullerGmbH & Co. KG, provided a capital injection. Erbud’s foreign business grew rapidly and in 2005 it entered Belgian, French, Swedish, Irish and English markets. In 2006 Erbud Sp. z o.o. changed its legal form to a joint-stock company and a year later had its IPO on the Warsaw Stock Exchange. In 2007, it acquired Budlex S.A, Rembet Plus Sp. z o.o. and PRD S.A. In 2012-2015 more acquisitions followed and allowed establishing the construction and service segment for power and industry clients.
In 2016 the Company concluded its largest contract for the construction of Galeria Młocinyshoppingandservicemallin Warsaw.
Erbud acts as the general contractor and subcontractor both in Poland and in other European countries. It specializes in:
• building construction (shopping malls, hospitals,officebuildings,publicutilitiesand residential buildings);
• power construction (power, heat and power and incineration plants);
• renewable energy (wind farms, photocell farms);
• road and engineering construction (earthworks, construction of roads, parking plots, storage yards, vehicle manoeuvring areas, etc.).
In 2016 the Company generated revenue of PLN 1,790 million, which denoted a y-o-y growth by 1.5%. 79% of the revenue originated from the domestic market. The Group implements mainly building construction (64%), road and engineering (19%) and power construction (14%) projects.
In the surveyed period, its EBITDA and EBIT increased by 10.7% and 12.7%, respectively, year-on-year.Itsnetprofitgeneratedonsaleofasignificantasset:BudlexS.A.,aproperty developer, amounted to PLN 1million,whilenetprofitoncontinuingoperations was PLN 35.3 million denoting a 51.7% increase year-on-year.
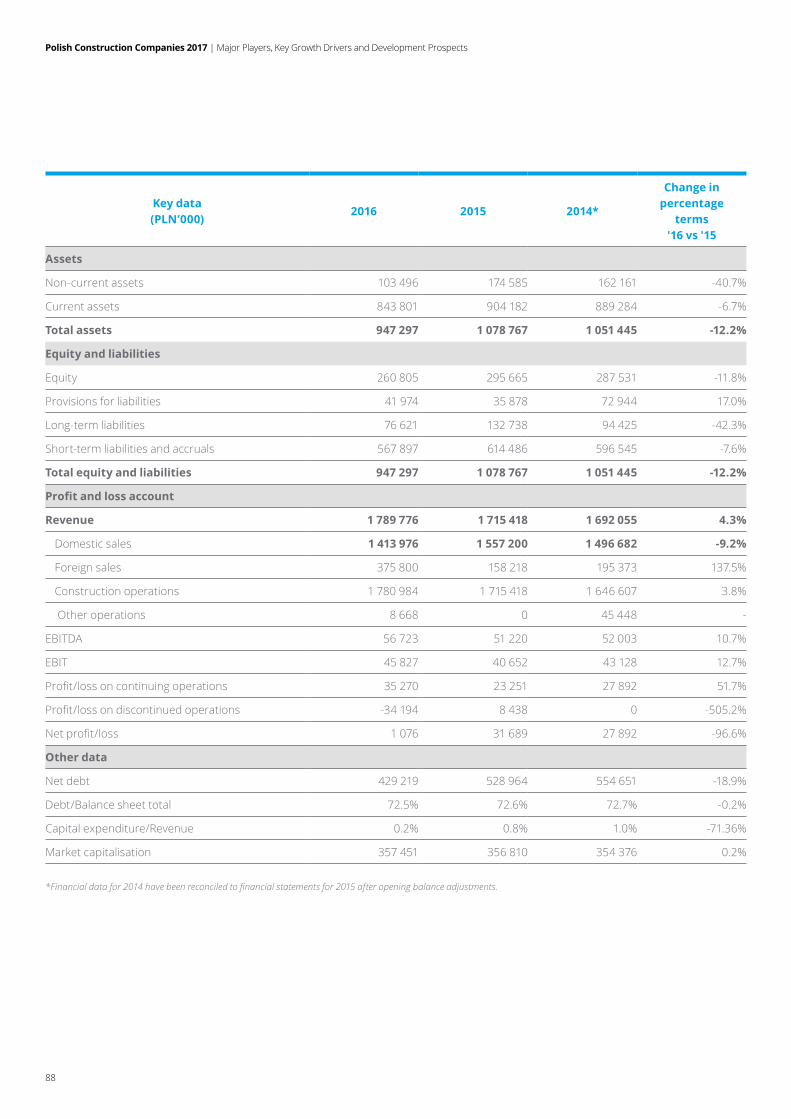
Polish Construction Companies 2017 | Major Players, Key Growth Drivers and Development Prospects
88
Key data (PLN’000)
2016 2015 2014*
Change in percentage
terms '16 vs '15
Assets
Non-current assets 103 496 174 585 162 161 -40.7%
Current assets 843 801 904 182 889 284 -6.7%
Total assets 947 297 1 078 767 1 051 445 -12.2%
Equity and liabilities
Equity 260 805 295 665 287 531 -11.8%
Provisions for liabilities 41 974 35 878 72 944 17.0%
Long-term liabilities 76 621 132 738 94 425 -42.3%
Short-term liabilities and accruals 567 897 614 486 596 545 -7.6%
Total equity and liabilities 947 297 1 078 767 1 051 445 -12.2%
Profit and loss account
Revenue 1 789 776 1 715 418 1 692 055 4.3%
Domestic sales 1 413 976 1 557 200 1 496 682 -9.2%
Foreign sales 375 800 158 218 195 373 137.5%
Construction operations 1 780 984 1 715 418 1 646 607 3.8%
Other operations 8 668 0 45 448 -
EBITDA 56 723 51 220 52 003 10.7%
EBIT 45 827 40 652 43 128 12.7%
Profit/lossoncontinuingoperations 35 270 23 251 27 892 51.7%
Profit/lossondiscontinuedoperations -34 194 8 438 0 -505.2%
Netprofit/loss 1 076 31 689 27 892 -96.6%
Other data
Net debt 429 219 528 964 554 651 -18.9%
Debt/Balance sheet total 72.5% 72.6% 72.7% -0.2%
Capital expenditure/Revenue 0.2% 0.8% 1.0% -71.36%
Market capitalisation 357 451 356 810 354 376 0.2%
*Financial data for 2014 have been reconciled to financial statements for 2015 after opening balance adjustments.
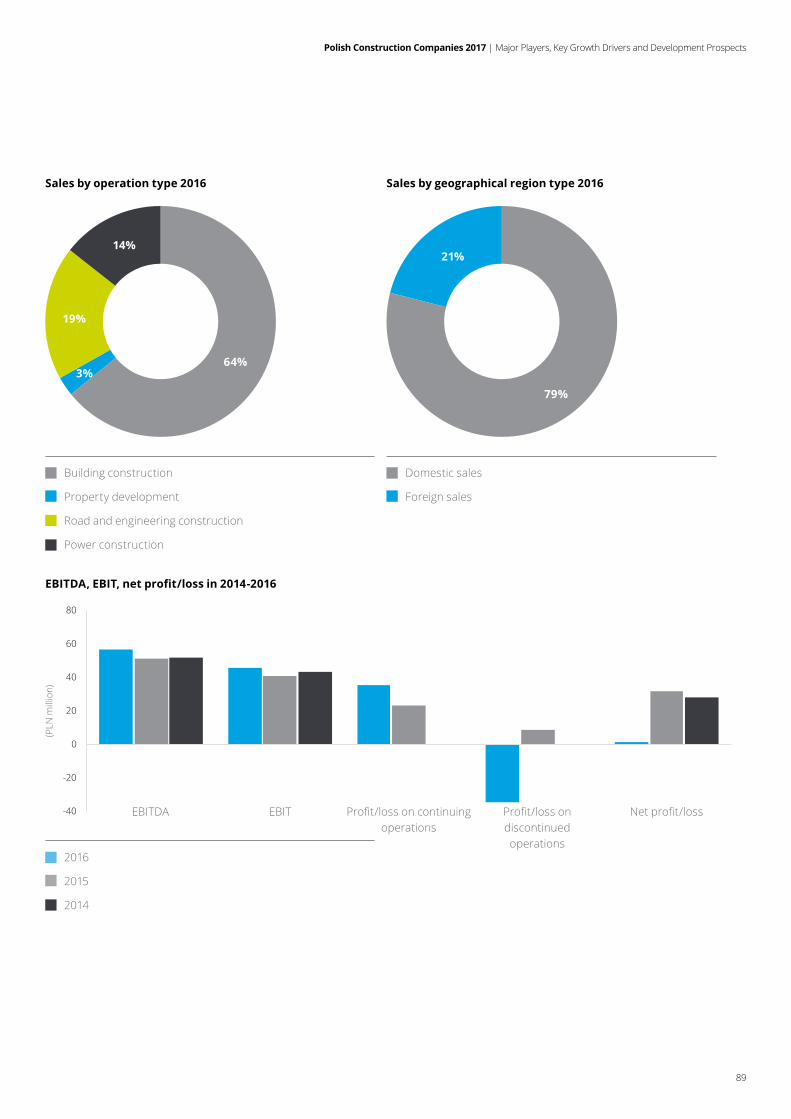
Polish Construction Companies 2017 | Major Players, Key Growth Drivers and Development Prospects
89
-40
-20
0
20
40
60
80
Sales by operation type 2016 Sales by geographical region type 2016
Building construction
Property development
Road and engineering construction
Power construction
Domestic sales
Foreign sales
EBITDA, EBIT, net profit/loss in 2014-2016
2016
2015
2014
EBITDA EBIT Netprofit/loss
(PLN
mill
ion)
79%
21%
64%3%
19%
14%
Profit/lossoncontinuingoperations
Profit/lossondiscontinued operations
Polish Construction Companies 2017 | Major Players, Key Growth Drivers and Development Prospects
90
Mostostal Warszawa Group
Mostostal Warszawa was incorporated in 1945 and was among the few ones participating in post-war reconstruction of Warsaw. It launched its business operations abroad in 1973. In 1991, it was transformed into a joint-stock company and privatised. Its IPO on the Warsaw Stock Exchange took place in 1993. At present, Mostostal Warszawa SA is the key shareholder of a few businesses included in the Mostostal Warszawa Capital Group. In 1999, the company was merged with the Spanish Acciona Group.
At the end of 2016, Acciona Construcción S.A. with 50.09% of shares was the majority shareholder of Mostostal Warszawa. OtwartyFunduszEmerytalnyPZU"ZłotaJesień”,anopen-endedpensionfund,andAVIVA PTE AVIVA BZ WBK S.A. also held considerable interest of 18.33% and 5.83%, respectively.
The operations of Mostostal Warszawa can be divided into two main segments, namely industrial engineering and general construction. Its current key projects in the general construction segment include Park Wodny Tychy, new university buildings for AGH University of Science andTechnologyinKrakówandforPoznańUniversityofTechnology,anofficebuildingforLPPinGdańsk,MennicaResidenceIIhousing building, residential settlements in Warsaw and Kraków. The power segment investments include construction of power units in Opole Power Plant, and in the eco segment, extension of the sewage treatment plants in Otwock and Krosno;infrastructural projects include the constructionofringroadsinStrzyżów,Stalowa Wola and Nisko, and a bridge named Roskilde Fjord Link in Denmark.
The consolidated revenue generated by Mostostal Warszawa in 2016 amounted to PLN 1.4 billion and was almost in whole derived from construction operations. The majority of contracts focused on general construction and industrial engineering works.
The revenue earned in 2016 was 10% higher than in the preceding year and approx. 2% of sales revenue was generated abroad. In 2016, the Group reported a net profitofPLN14.5million.EBITgeneratedin 2016 was PLN 47.4 million denoting a 3% decrease year-on-year.
In 2016, the average headcount in the Mostostal Warszawa Group neared 1,500, which means a nearly 2% growth as compared to 2015.
The net debt ratio in 2016 was 79% and it was lower than in the preceding year, when it reached the level of 83%.
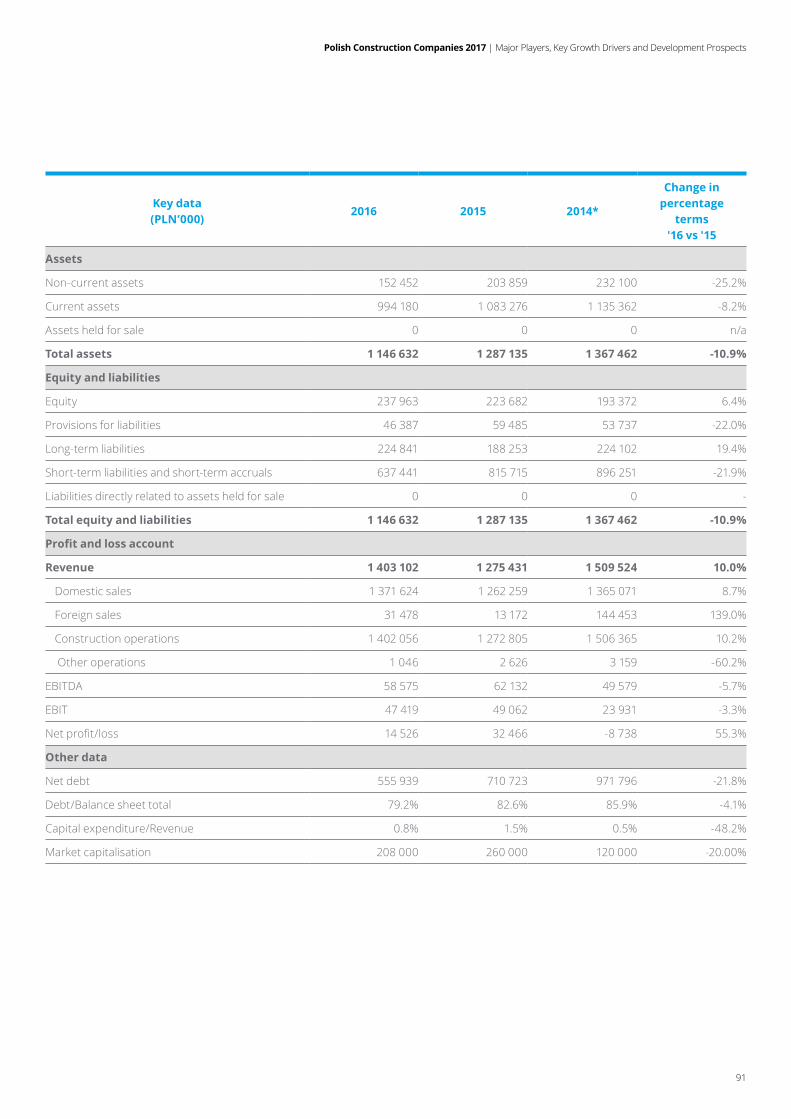
Polish Construction Companies 2017 | Major Players, Key Growth Drivers and Development Prospects
91
Key data (PLN’000)
2016 2015 2014*
Change in percentage
terms '16 vs '15
Assets
Non-current assets 152 452 203 859 232 100 -25.2%
Current assets 994 180 1 083 276 1 135 362 -8.2%
Assets held for sale 0 0 0 n/a
Total assets 1 146 632 1 287 135 1 367 462 -10.9%
Equity and liabilities
Equity 237 963 223 682 193 372 6.4%
Provisions for liabilities 46 387 59 485 53 737 -22.0%
Long-term liabilities 224 841 188 253 224 102 19.4%
Short-term liabilities and short-term accruals 637 441 815 715 896 251 -21.9%
Liabilities directly related to assets held for sale 0 0 0 -
Total equity and liabilities 1 146 632 1 287 135 1 367 462 -10.9%
Profit and loss account
Revenue 1 403 102 1 275 431 1 509 524 10.0%
Domestic sales 1 371 624 1 262 259 1 365 071 8.7%
Foreign sales 31 478 13 172 144 453 139.0%
Construction operations 1 402 056 1 272 805 1 506 365 10.2%
Other operations 1 046 2 626 3 159 -60.2%
EBITDA 58 575 62 132 49 579 -5.7%
EBIT 47 419 49 062 23 931 -3.3%
Netprofit/loss 14 526 32 466 -8 738 55.3%
Other data
Net debt 555 939 710 723 971 796 -21.8%
Debt/Balance sheet total 79.2% 82.6% 85.9% -4.1%
Capital expenditure/Revenue 0.8% 1.5% 0.5% -48.2%
Market capitalisation 208 000 260 000 120 000 -20.00%
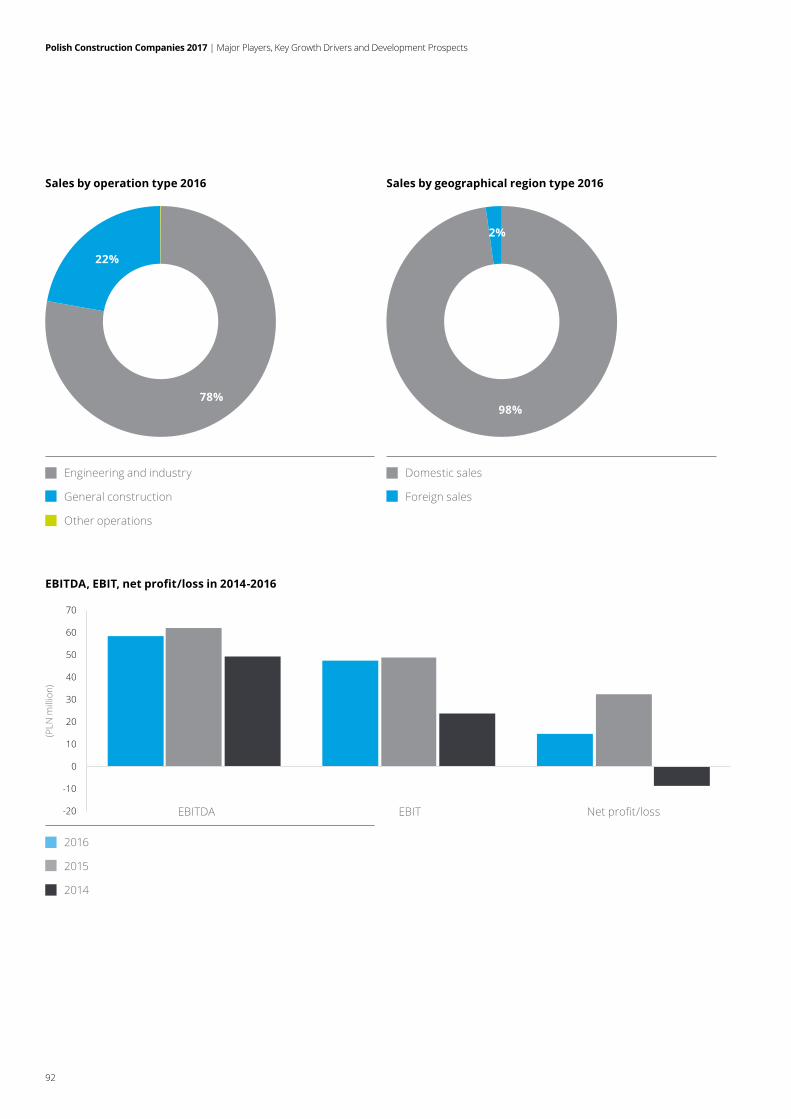
Polish Construction Companies 2017 | Major Players, Key Growth Drivers and Development Prospects
92
-20
-10
0
10
20
30
40
50
60
70
Sales by operation type 2016 Sales by geographical region type 2016
Engineering and industry
General construction
Other operations
Domestic sales
Foreign sales
EBITDA, EBIT, net profit/loss in 2014-2016
2016
2015
2014
EBITDA EBIT Netprofit/loss
(PLN
mill
ion)
78%
22%
98%
2%
Polish Construction Companies 2017 | Major Players, Key Growth Drivers and Development Prospects
93
Trakcja Group
The Trakcja Group is among leaders of the Polish and Lithuanian rail, tram and road infrastructure construction market. It employs over 2,000 people. Trakcja PRKiI S.A.withtheregisteredofficeinWarsawisits parent.
The Group was established in stages, beginning from restructuring of a state-owned enterprise in 1995, all the way through privatisation in 2005 (Spanish Comsa S.A. purchasing a minority share).
In 2008, the parent had its IPO on the Warsaw Stock Exchange. In 2009 and 2011, Trakcja acquired PRK 7 S.A. and Tiltra Group, respectively, which allowed extending the Group’s operations in Poland by property development and obtaining one of the largest Lithuanian construction businesses, specialized in infrastructure (roads, bridges, tunnels, airports and seaports) and railway modernisation.
The core business of the Group involves comprehensive works regarding road and railway infrastructure, performed with the use of modern machinery. The Group specializes in engineering and construction services involving design, construction and modernisation of railways and tram lines, as well as their power supply networks, power transmission lines, construction ofbridges,viaducts,flyovers,channels,tunnels, underground passages, retaining walls, roads and auxiliary road and railwayinfrastructure. It can also perform general construction works including site preparation, construction and improvement of structures, as well asinstallationsandfinishing.Buildingconstruction, both infrastructural and for generalpurposes(residentialandofficebuildings)isacrucialelementofitsoffer.Other services include construction of power engineering and remote control systems.
The Group has modernised several thousand kilometres of railways and provided power supply to over 10,000 km of railways.
It has built and modernised over 450 power supply substations and 350 distribution boards.
In the road construction segment, the Group specializes in the construction and remodelling of roads, motorways, bridges, viaducts, airports, seaports and public utility infrastructural installations. Since its incorporation, i.e. 1949, AB Kauno Tiltai, a Group company being among the largest infrastructural business in the Baltic states, has built over 100 bridges and viaducts and has been in charge of construction and reconstruction of many roads in Lithuania.
As at 31 December 2016, the Parent’s key shareholders included COMSA S.A. with 30.8% of shares, OFE Nationale Nederlanden with 9.9% of shares and OFE PZU with 8.5% of shares.
In 2016, the Group generated sales revenue of nearly PLN 1.4 billion, which denoted a 4% increase year-on-year. Its sales in the domestic segment increasedin 2016 to PLN 870 million. Its foreign sales grew to PLN 511 million and accounted for 37% of total sales, mostly thanks to contracts performed for the Lithuanian Road Administration. PKP PLK S.A. is the Group’s key client on the Polish market. Railway works have the biggest share in the Group’s sales structure (53%), and are followed by road construction works (37%).
As at 31 December 2016, its order portfolio amounted to PLN 1,201 million. In 2016 the Group concluded construction contracts totalling PLN 911 million.
Its largest contracts performed in 2016 included three ones involving railway modernisation amounting to PLN 625 million(Podłęże–Bochniasection),PLN535million(Wrocław-theDolnośląskieProvince border section) and PLN 417 million(Dębica–SędziszówMałopolskisection).
The Group’s EBIT for 2016 was PLN 73.8 million(2015:PLN76.7million).Itsnetprofitfor 2016 was PLN 56.3 million in relation to PLN 51.8 million in 2015, denoting a 9% growth. As at 31 December 2016, the Group’s funding structure was the same as at 31 December 2015, the foreign capital to total assets ratio being 45%.
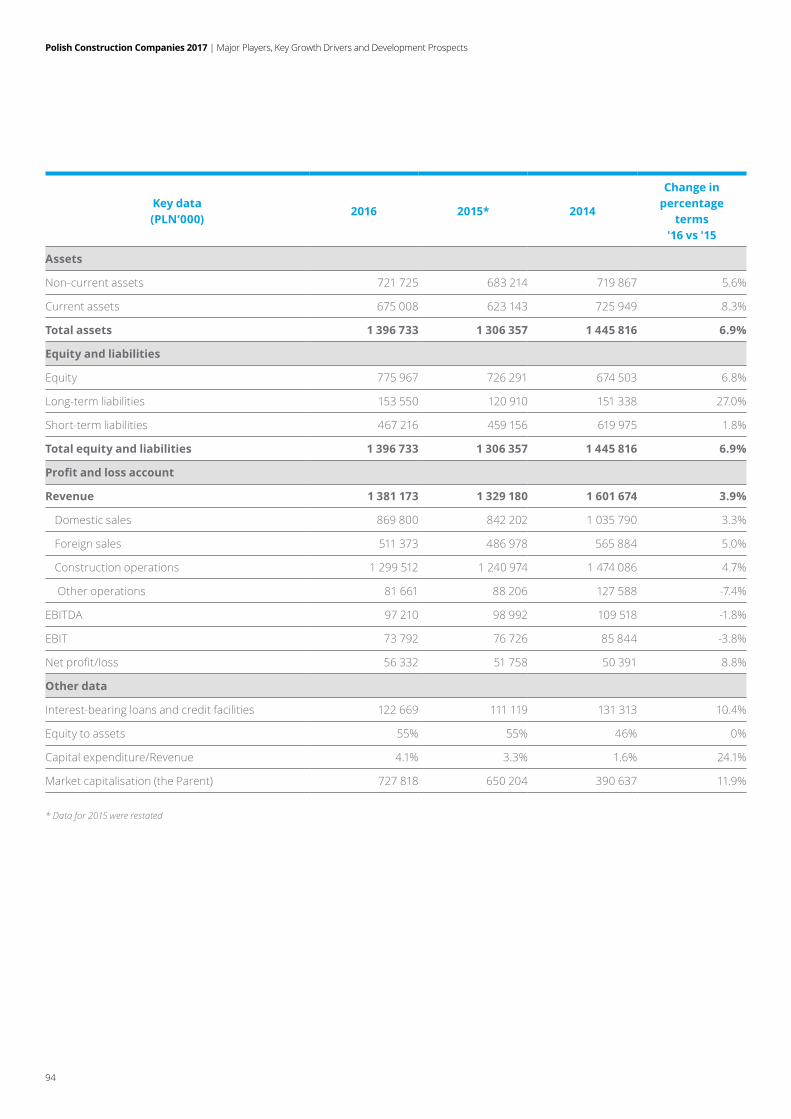
Polish Construction Companies 2017 | Major Players, Key Growth Drivers and Development Prospects
94
Key data (PLN’000)
2016 2015* 2014
Change in percentage
terms '16 vs '15
Assets
Non-current assets 721 725 683 214 719 867 5.6%
Current assets 675 008 623 143 725 949 8.3%
Total assets 1 396 733 1 306 357 1 445 816 6.9%
Equity and liabilities
Equity 775 967 726 291 674 503 6.8%
Long-term liabilities 153 550 120 910 151 338 27.0%
Short-term liabilities 467 216 459 156 619 975 1.8%
Total equity and liabilities 1 396 733 1 306 357 1 445 816 6.9%
Profit and loss account
Revenue 1 381 173 1 329 180 1 601 674 3.9%
Domestic sales 869 800 842 202 1 035 790 3.3%
Foreign sales 511 373 486 978 565 884 5.0%
Construction operations 1 299 512 1 240 974 1 474 086 4.7%
Other operations 81 661 88 206 127 588 -7.4%
EBITDA 97 210 98 992 109 518 -1.8%
EBIT 73 792 76 726 85 844 -3.8%
Netprofit/loss 56 332 51 758 50 391 8.8%
Other data
Interest-bearing loans and credit facilities 122 669 111 119 131 313 10.4%
Equity to assets 55% 55% 46% 0%
Capital expenditure/Revenue 4.1% 3.3% 1.6% 24.1%
Market capitalisation (the Parent) 727 818 650 204 390 637 11.9%
* Data for 2015 were restated
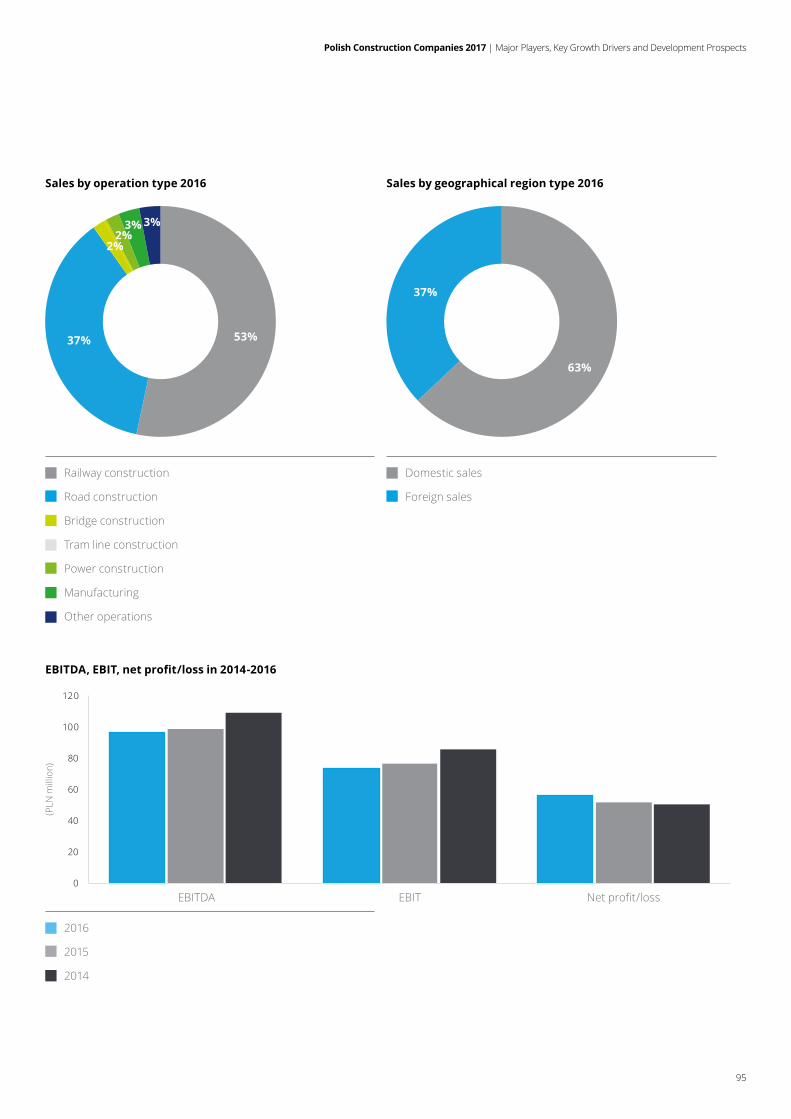
Polish Construction Companies 2017 | Major Players, Key Growth Drivers and Development Prospects
95
0
20
40
60
80
100
120
Sales by operation type 2016 Sales by geographical region type 2016
Railway construction
Road construction
Bridge construction
Tram line construction
Power construction
Manufacturing
Other operations
Domestic sales
Foreign sales
EBITDA, EBIT, net profit/loss in 2014-2016
2016
2015
2014
EBITDA EBIT Netprofit/loss
(PLN
mill
ion)
63%
37%
53%37%
2%2%
3% 3%
Polish Construction Companies 2017 | Major Players, Key Growth Drivers and Development Prospects
96
Unibep Group
In 1950’s, the company had operated in Bielsk Podlaski under the name Powiatowe PrzedsiębiorstwoBudowlaneandpriorto1998 had been owned by the state. Then it was transformed into a limited liability company, and in 2006, into a joint-stock company, which was accompanied with a change of its image and logo. Its IPO on the Warsaw Stock Exchange took place in 2008.
In the same year, Unidevelopment, a subsidiary in charge of property development, was incorporated (in 2013 transformed into a joint-stock company). In 2009, Unibep S.A. acquired Makbud Sp. z o.o. and thus entered the road construction segment. A year later,itacquiredPrzedsiębiorstwoRobót Drogowych i Mostowych, and in 2015, Budrex-Kobi Sp. z o.o., a bridge construction company with the registered officeinBiałystok.
In 2010 the Company opened its Belarussian branch, which successfully built a four-star Victoria Hotel in Minsk. At present, two major contract have been delivered in Belarus: a shopping mall in Grodno and a tennis centre in Minsk. Besides, it carried out some contractual works in Russia and in Germany.
Modular construction performed by Unihouse made the Company one of the largest European suppliers of the technology. At present, Norway has been the key market for Unihouse, but Polish buildings can be found also in Sweden. In 2016 Unihouse commenced cooperation with CRAMO, for which it has built modules based on a commissioned design.
Group’s activities in 2016:
• constructedGaleriaPółnocnaatWarsawBiałołęka;
• constructed Aura Sky residential building in Warsaw;
• constructed a 16 km section of S8 expresswayfromWarsawtoBiałystok(in a consortium with PORR Polska Infrastructure);
• prepared for the construction of a shopping mall in Grodno, Belarus;
• built a powdered milk factory Mlekovita 3 in Wysokie Mazowieckie.
The Group’s core business includes general construction. Building construction accounts for 67% of its total revenue. Road and bridge construction is the second largest revenue source with the share of 13%. Domestic market generates 85% of revenue.
At the end of 2016, the Unibep Group generated revenue of PLN 1,249 million, i.e. similar to the prior year (a slight increase of o0.5%).BothEBITandnetprofit,though,increased substantially year-on-year (by approx. 42% and 37%, respectively).
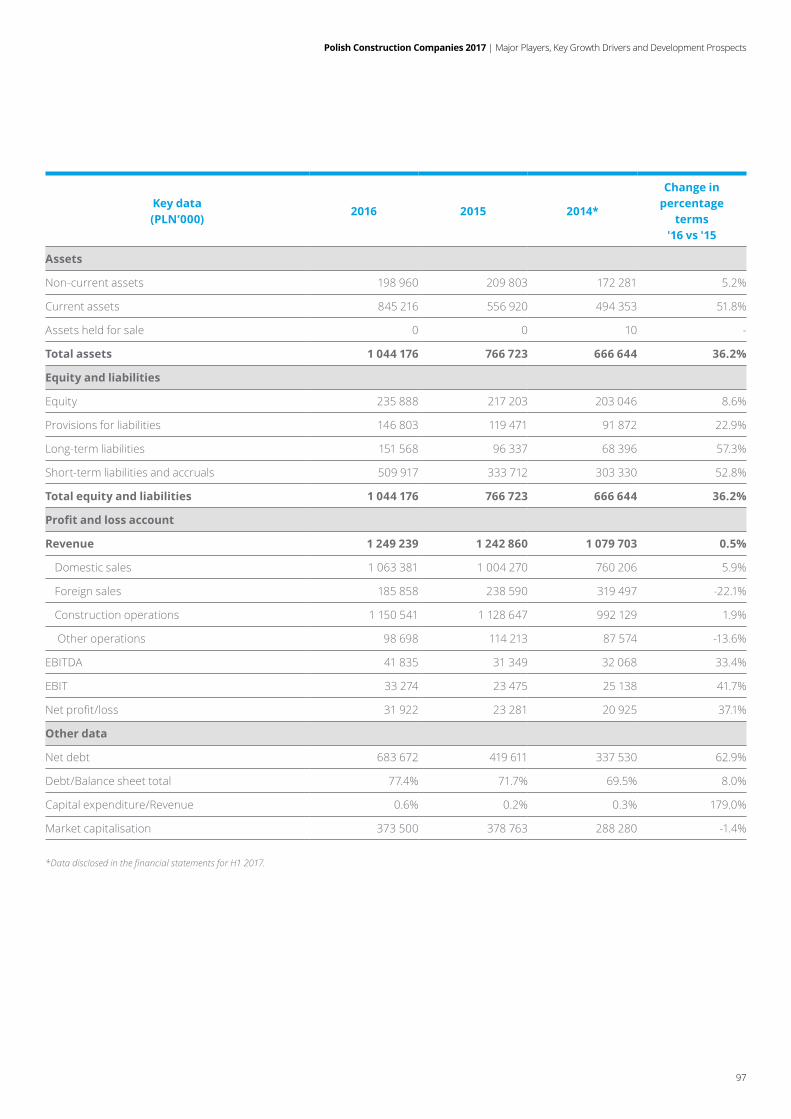
Polish Construction Companies 2017 | Major Players, Key Growth Drivers and Development Prospects
97
Key data (PLN’000)
2016 2015 2014*
Change in percentage
terms '16 vs '15
Assets
Non-current assets 198 960 209 803 172 281 5.2%
Current assets 845 216 556 920 494 353 51.8%
Assets held for sale 0 0 10 -
Total assets 1 044 176 766 723 666 644 36.2%
Equity and liabilities
Equity 235 888 217 203 203 046 8.6%
Provisions for liabilities 146 803 119 471 91 872 22.9%
Long-term liabilities 151 568 96 337 68 396 57.3%
Short-term liabilities and accruals 509 917 333 712 303 330 52.8%
Total equity and liabilities 1 044 176 766 723 666 644 36.2%
Profit and loss account
Revenue 1 249 239 1 242 860 1 079 703 0.5%
Domestic sales 1 063 381 1 004 270 760 206 5.9%
Foreign sales 185 858 238 590 319 497 -22.1%
Construction operations 1 150 541 1 128 647 992 129 1.9%
Other operations 98 698 114 213 87 574 -13.6%
EBITDA 41 835 31 349 32 068 33.4%
EBIT 33 274 23 475 25 138 41.7%
Netprofit/loss 31 922 23 281 20 925 37.1%
Other data
Net debt 683 672 419 611 337 530 62.9%
Debt/Balance sheet total 77.4% 71.7% 69.5% 8.0%
Capital expenditure/Revenue 0.6% 0.2% 0.3% 179.0%
Market capitalisation 373 500 378 763 288 280 -1.4%
*Data disclosed in the financial statements for H1 2017.
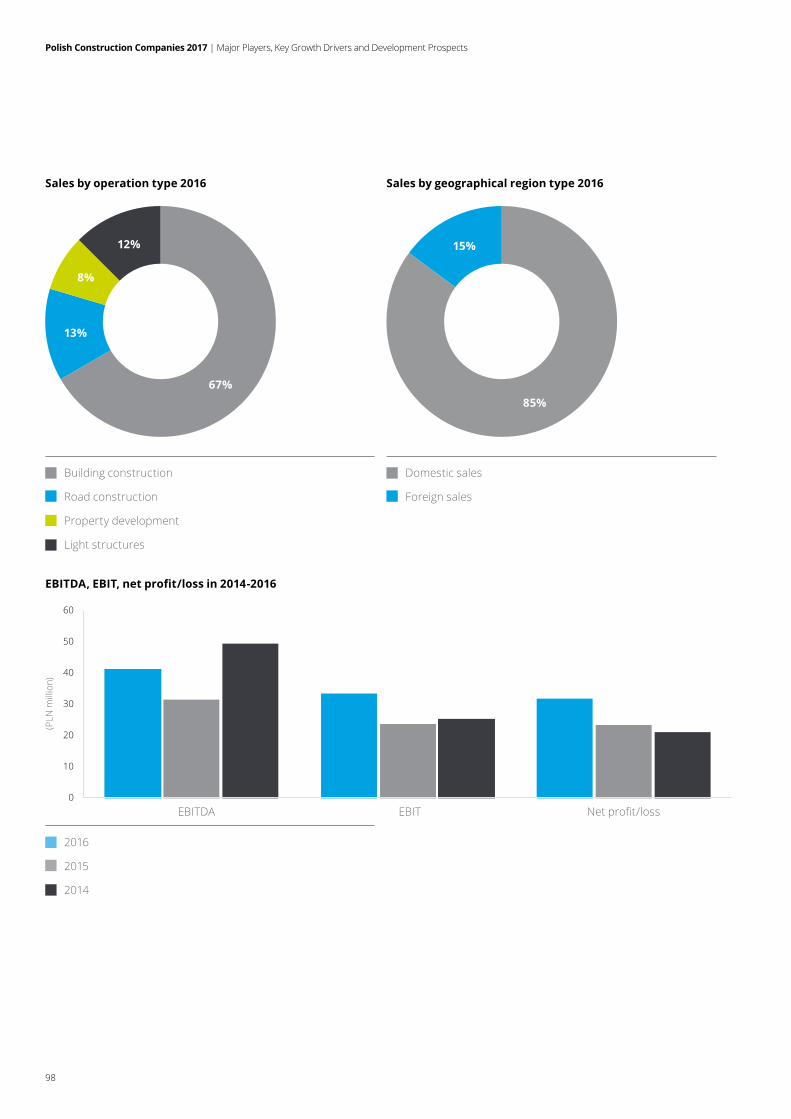
Polish Construction Companies 2017 | Major Players, Key Growth Drivers and Development Prospects
98
0
10
20
30
40
50
60
Sales by operation type 2016 Sales by geographical region type 2016
Building construction
Road construction
Property development
Light structures
Domestic sales
Foreign sales
EBITDA, EBIT, net profit/loss in 2014-2016
2016
2015
2014
EBITDA EBIT Netprofit/loss
(PLN
mill
ion)
85%
15%
67%
13%
8%
12%
Polish Construction Companies 2017 | Major Players, Key Growth Drivers and Development Prospects
99
PORR Group
Established in 1869, PORR is one of the largest Austrian construction companies and a key player on the European market. WithnumerousofficesacrossCentral,Eastern and South-Eastern Europe, PORR has embarked on expansion in the Middle East, mainly in Qatar.
In Poland, PORR has been carrying out construction operations since 1987 and has been represented by two key companies, PORR Polska ConstructionS.A. and PORR Polska Infrastructure S.A.
The former specializes in building and railway construction, while the latter focuses on transport infrastructure, power and hydrotechnical engineering.
In 2016, the Group’s Management Board decided to combine the Polish companies into one entity to achieve synergies, fully utilise their potential and know-how. The formal merger was to take place in Q2 2017, while the Shared Service Center commenced its operations in October 2016. Following the merger, the new company named PORR S.A. shall become a supplier of comprehensive services in all segments of the current construction market.
ThefinancialstatementsofthePORRGroup are not consolidated at the local level.
PORR Polska Construction S.A.PORR Polska Construction S.A. specializes in the construction of buildings and facilities as well as in railway engineering.
PORR Polska Infrastructure S.APORR Polska Infrastructure S.A. specializes in transport infrastructure, power and civil engineering, and in hydrotechnical construction.
Key data (PLN’000)
2016 2015Change in percentage
terms '16 vs '15
Revenue – PORR Polska Construction 657 752 626 862 5.0%
Revenue – PORR Polska Infrastructure 451 985 667 342 -32%
Polish Construction Companies 2017 | Major Players, Key Growth Drivers and Development Prospects
100
Elektrobudowa Group
The Parent, ELEKTROBUDOWA SA, was incorporated in 1953 under the name PrzedsiębiorstwoMontażuElektrycznego“Elektrobudowa”. In 1992, this state-owned enterprise was converted into a joint-stock company. Three years later it had an IPO, and since 1996 it has been quoted on the Warsaw Stock Exchange.
At the end of 2016, its key shareholders included open-ended pension funds: AVIVA OFE AVIVA BZ WBK S.A. (10.75%), Nationale-Nederlanden Otwarty Fundusz Emerytalny (9.89%), PKO BP Bankowy Otwarty Fundusz Emerytalny (9.79%), AXA Otwarty Fundusz Emerytalny(9.41%),OFEPZU„ZłotaJesień”(9.31%), Allianz Polska Otwarty Fundusz Emerytalny (6.31%), MetLife Otwarty Fundusz Emerytalny (5.72%), Generali Otwarty Fundusz Emerytalny (5.09%).
At present, the ELEKTROBUDOWA S.A. Group provides comprehensive construction and assembly services for the needs of the power engineering, petrochemical, mining and public utility buildings construction segments. The business activity of the Group can be divided into the following segments:
• power engineering: acting as the general contractor (PC) and turnkey (EPC) provider; comprehensive assembly of low, medium and high voltage power installations; instrumentation and automation; manufacturing of power engineering,transmissionandtakeoffequipment;
• industrial segment: acting as the general contractor (PC) and turnkey (EPC) provider; comprehensive assembly of low, medium and high voltage power installations; instrumentation and automation; manufacturing of power engineering and power distribution equipment;
• power transmission and distribution segment: acting as a general contractor in the course of construction, remodelling and modernisation of power stations, underground and overground cable lines of all voltages;
• automation segment: comprehensive services (design, delivery, research and commissioning) regarding automated systems; power engineering, technology, control and supervision systems for power plants, heat and power plants, transmission and distribution stations and for industry; manufacturing of automated systems for the power engineering segment.
In 2016, ELEKTROBUDOWA Group employed over 2,000 people. Its domestic revenue reached PLN 785 million, while that generated abroad amounted to PLN 186.5 million. This denotes a general sales decrease by 22% year-on-year.
In 2016, EBITDA was PLN 75.2 million and decreased by 3% as compared to 2015. The Group's EBIT for 2016 totalled PLN 61.8 million as compared to PLN 63.1 million intheprecedingyear.Thenetprofitfor2015 amounted to PLN 55.1 million and increased by 10% year-on-year.
In 2016, foreign capital accounted for 54% of the Group’s funding as compared to nearly 57% in 2015.
The contract portfolio of ELEKTROBUDOWA SA totalled PLN 1 billion at the end of 2016.
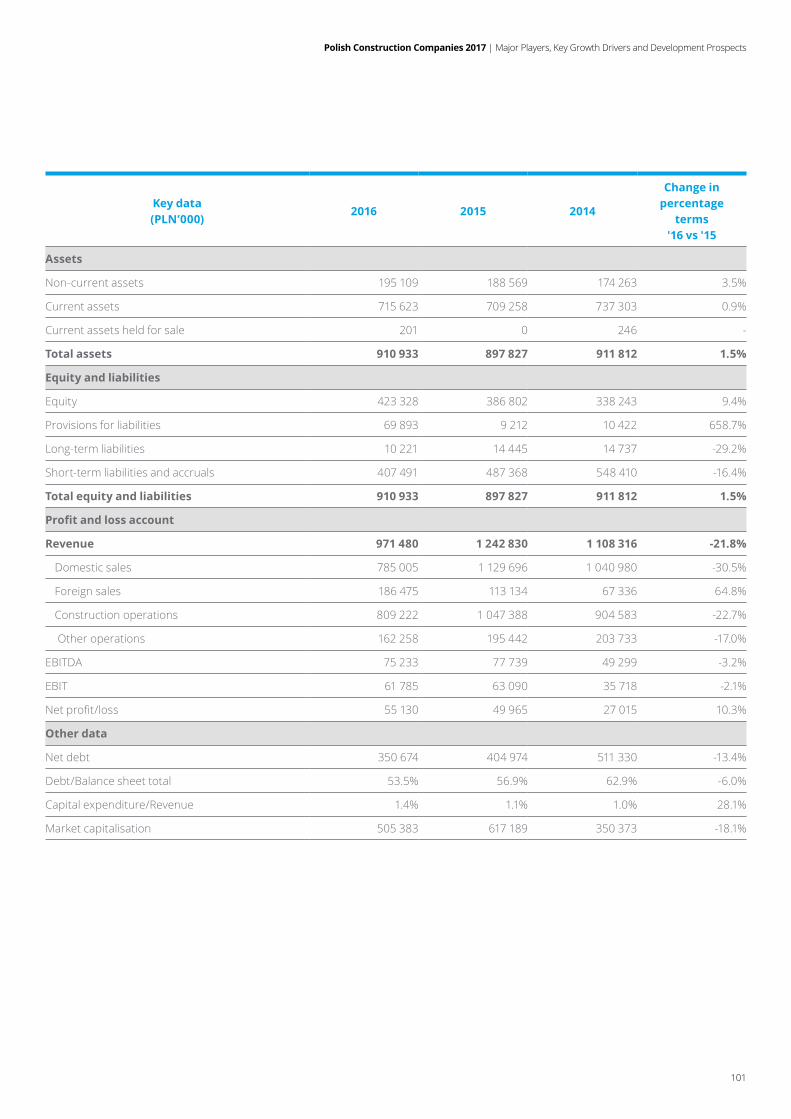
Polish Construction Companies 2017 | Major Players, Key Growth Drivers and Development Prospects
101
Key data (PLN’000)
2016 2015 2014
Change in percentage
terms '16 vs '15
Assets
Non-current assets 195 109 188 569 174 263 3.5%
Current assets 715 623 709 258 737 303 0.9%
Current assets held for sale 201 0 246 -
Total assets 910 933 897 827 911 812 1.5%
Equity and liabilities
Equity 423 328 386 802 338 243 9.4%
Provisions for liabilities 69 893 9 212 10 422 658.7%
Long-term liabilities 10 221 14 445 14 737 -29.2%
Short-term liabilities and accruals 407 491 487 368 548 410 -16.4%
Total equity and liabilities 910 933 897 827 911 812 1.5%
Profit and loss account
Revenue 971 480 1 242 830 1 108 316 -21.8%
Domestic sales 785 005 1 129 696 1 040 980 -30.5%
Foreign sales 186 475 113 134 67 336 64.8%
Construction operations 809 222 1 047 388 904 583 -22.7%
Other operations 162 258 195 442 203 733 -17.0%
EBITDA 75 233 77 739 49 299 -3.2%
EBIT 61 785 63 090 35 718 -2.1%
Netprofit/loss 55 130 49 965 27 015 10.3%
Other data
Net debt 350 674 404 974 511 330 -13.4%
Debt/Balance sheet total 53.5% 56.9% 62.9% -6.0%
Capital expenditure/Revenue 1.4% 1.1% 1.0% 28.1%
Market capitalisation 505 383 617 189 350 373 -18.1%
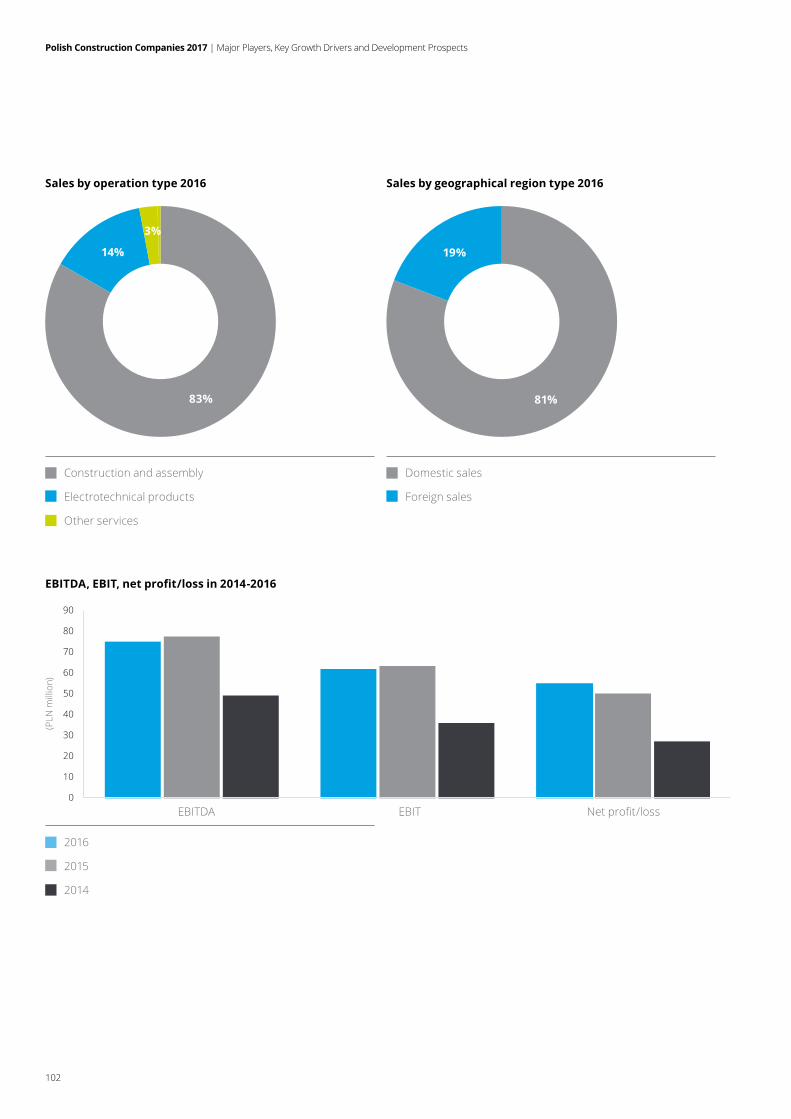
Polish Construction Companies 2017 | Major Players, Key Growth Drivers and Development Prospects
102
0
10
20
30
40
50
60
70
80
90
Sales by operation type 2016 Sales by geographical region type 2016
Construction and assembly
Electrotechnical products
Other services
Domestic sales
Foreign sales
EBITDA, EBIT, net profit/loss in 2014-2016
2016
2015
2014
EBITDA EBIT Netprofit/loss
(PLN
mill
ion)
81%
19%
83%
14%
3%
Polish Construction Companies 2017 | Major Players, Key Growth Drivers and Development Prospects
103
Warbud
Warbud has been present on the Polish market since 1989. Initially, the company had operated as a private business. In 1992 it was transformed into a joint-stock company co-owned by a French construction giant, at present the VINCI Group. VINCI Construction International Network remains the majority shareholder of the company with 99.76% of interest in the share capital as at 31 December 2016. For a few years, the VINCI Group has been the leader in the ranking of the largest European construction companies, measured by revenue. As it is part of the VINCI Group, Warbud may draw on the international experience of its experts in addition to enjoying stability and a strong financialposition.
Warbud provides services in all segments of the construction market, including building construction (shopping malls, officebuildings,residentialbuildingsand estates), civil engineering structures (roads, bridges), healthcare facilities (hospitals, health centres, spas), cultural facilities (theatres, philharmonics, museums), military, power engineering and environmental projects (sewage treatment plants, incineration plants). It carries out specialist construction; one of the Group companies (Warbud Beton Sp. z o.o.) is a concrete manufacturer.
In 2016, Warbud employed 1,082 people and generated revenue of PLN 930 million from its core operations, which means a drop in sales by 16% as compared to the preceding year. Construction and assemblyservices accounted for 98% of the said revenue.
The Company's EBIT in 2016 was PLN 38.6 million as compared to PLN 40.8 million in 2015, down by 5%.
In 2016, EBITDA was PLN 49.4 million and decreased by 2% as compared to 2015. The netprofitfor2016totalledPLN35.1millionand dropped by 2% year-on-year. In 2016 foreign capital accounted for 81.6% of the company’s funding, much like in the prior year. The funding structure has virtually not changed over the past few years.
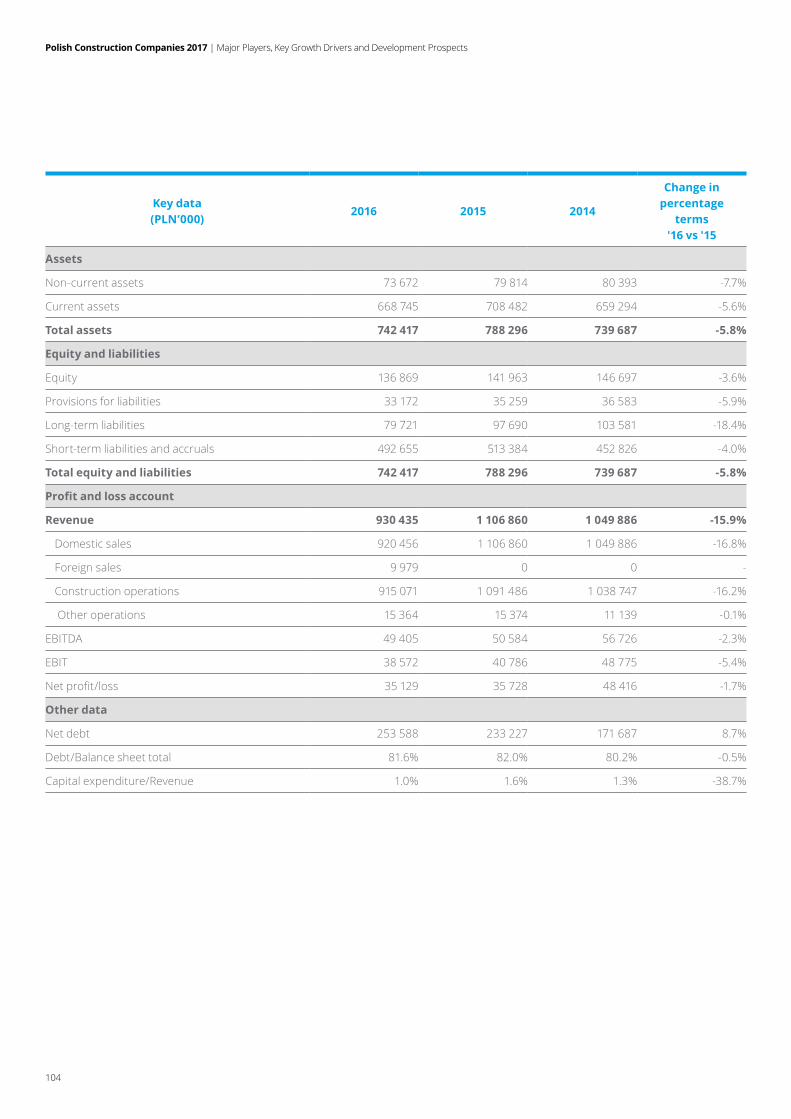
Polish Construction Companies 2017 | Major Players, Key Growth Drivers and Development Prospects
104
Key data (PLN’000)
2016 2015 2014
Change in percentage
terms '16 vs '15
Assets
Non-current assets 73 672 79 814 80 393 -7.7%
Current assets 668 745 708 482 659 294 -5.6%
Total assets 742 417 788 296 739 687 -5.8%
Equity and liabilities
Equity 136 869 141 963 146 697 -3.6%
Provisions for liabilities 33 172 35 259 36 583 -5.9%
Long-term liabilities 79 721 97 690 103 581 -18.4%
Short-term liabilities and accruals 492 655 513 384 452 826 -4.0%
Total equity and liabilities 742 417 788 296 739 687 -5.8%
Profit and loss account
Revenue 930 435 1 106 860 1 049 886 -15.9%
Domestic sales 920 456 1 106 860 1 049 886 -16.8%
Foreign sales 9 979 0 0 -
Construction operations 915 071 1 091 486 1 038 747 -16.2%
Other operations 15 364 15 374 11 139 -0.1%
EBITDA 49 405 50 584 56 726 -2.3%
EBIT 38 572 40 786 48 775 -5.4%
Netprofit/loss 35 129 35 728 48 416 -1.7%
Other data
Net debt 253 588 233 227 171 687 8.7%
Debt/Balance sheet total 81.6% 82.0% 80.2% -0.5%
Capital expenditure/Revenue 1.0% 1.6% 1.3% -38.7%
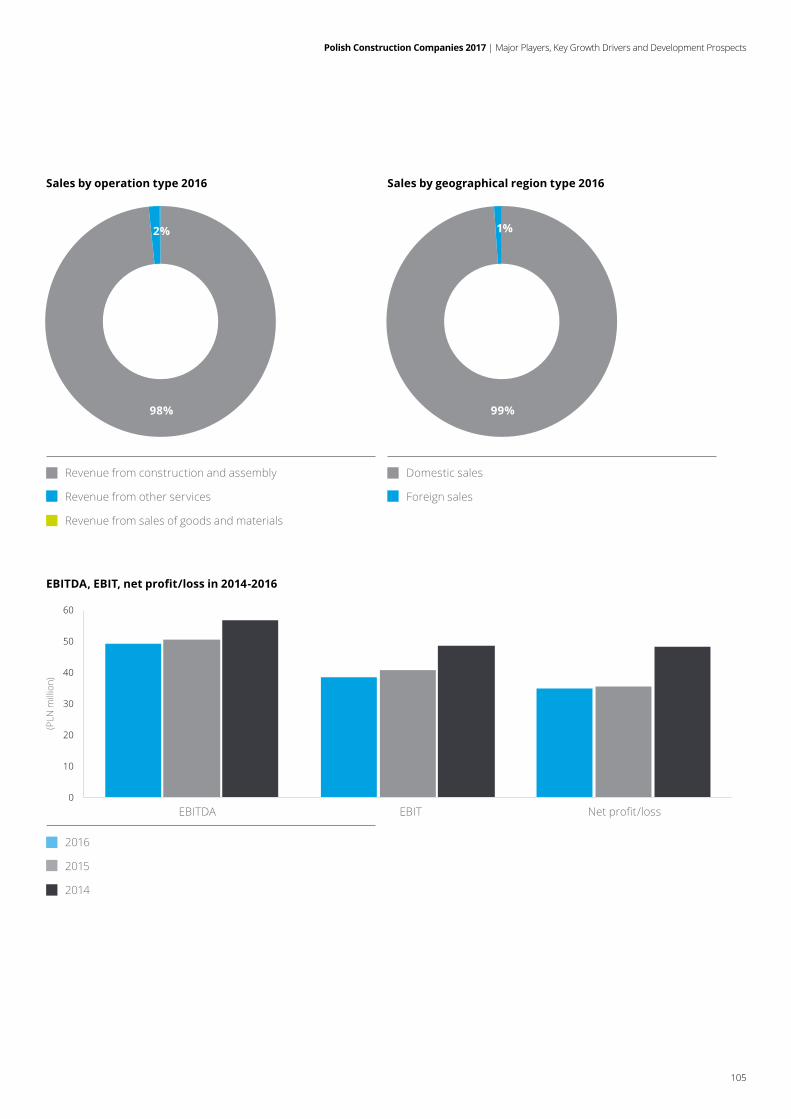
Polish Construction Companies 2017 | Major Players, Key Growth Drivers and Development Prospects
105
0
10
20
30
40
50
60
Sales by operation type 2016 Sales by geographical region type 2016
Revenue from construction and assembly
Revenue from other services
Revenue from sales of goods and materials
Domestic sales
Foreign sales
EBITDA, EBIT, net profit/loss in 2014-2016
2016
2015
2014
EBITDA EBIT Netprofit/loss
(PLN
mill
ion)
99%
1%
98%
2%
Polish Construction Companies 2017 | Major Players, Key Growth Drivers and Development Prospects
106
Mostostal Zabrze Group
The Mostostal Zabrze Group originates from 1945, when it was incorporated under thenameofPrzedsiębiorstwoBudowyMostów i Konstrukcji Stalowych “Mostostal” in Kraków. In 1951, independent enterprises called “Mostostal” were separated,locatedinZabrze,Poznań,Piotrków Trybunalski and Warsaw. The sameyear,SamodzielnePrzedsiębiorstwo“Mostostal” in Zabrze was established underthenameZjednoczenieMontażuUrządzeńPrzemysłowychinZabrze.In1958, its name was changed again to ŚląskiePrzedsiębiorstwoKonstrukcjiStalowychiUrządzeńPrzemysłowych“Mostostal” in Zabrze.
On 1 November 1992 the enterprise was privatised and Mostostal Zabrze - Holding S.A. joint-stock company was incorporated. Two years later, it had its IPO on the Warsaw Stock Exchange. In 2013, its name changed to Mostostal Zabrze S.A.
The company operates in four segments: construction and assembly, machinery construction, general construction and engineering, design and engineering services.
Projects performed in 2016:
• construction works under the pyrometallurgy modernisation programmeatHutaMiedziGłogówand delivery of a waste heat boiler for HutaMiedzi“GłogówI”systemwiththefluidised-bedfurnaceatKGHMPolskaMiedźS.A.
• construction of a metal components productionhallwithoffice,socialandauxiliary facilities in Ropczyce for Aero Gearbox International Poland Sp. z o.o.;
• works contracted by Polimex Projekt Opole Sp. z o.o. under “Construction of Power Units no. 5 and 6 in Elektrownia Opole S.A.”;
• shell and road construction along with external infrastructure in GEMINI PARK TYCHY shopping mall.
2016 saw a 4% y-o-y revenue growth in the Mostostal Zabrze Group. o Construction operations accounted for 73% of the Group’s revenue in 2016; 63% came from production and assembly,and 68% of the total revenue was generated in Poland.
EBIT for 2016 was negative and amounted to PLN -19.7 million. The Group incurred a net loss of PLN -22.6 million, which denotes a decrease in performance; in 2015, it had generatedaprofitofPLN2.5million.
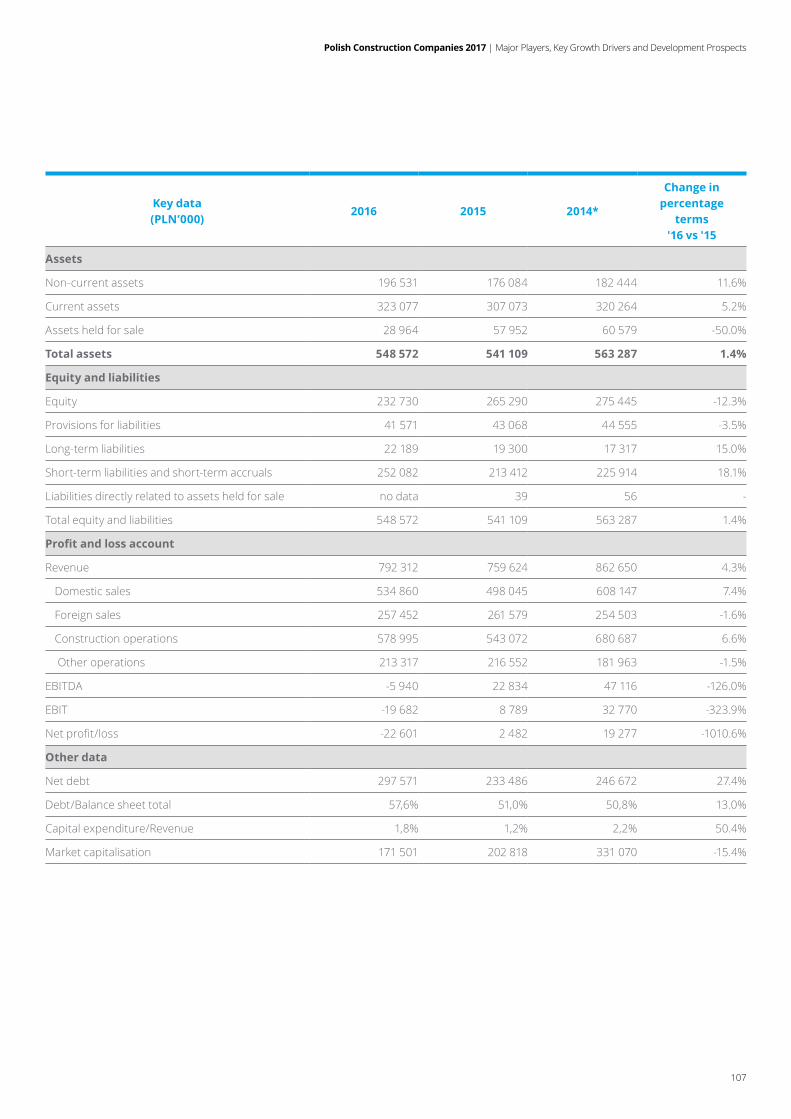
Polish Construction Companies 2017 | Major Players, Key Growth Drivers and Development Prospects
107
Key data (PLN’000)
2016 2015 2014*
Change in percentage
terms '16 vs '15
Assets
Non-current assets 196 531 176 084 182 444 11.6%
Current assets 323 077 307 073 320 264 5.2%
Assets held for sale 28 964 57 952 60 579 -50.0%
Total assets 548 572 541 109 563 287 1.4%
Equity and liabilities
Equity 232 730 265 290 275 445 -12.3%
Provisions for liabilities 41 571 43 068 44 555 -3.5%
Long-term liabilities 22 189 19 300 17 317 15.0%
Short-term liabilities and short-term accruals 252 082 213 412 225 914 18.1%
Liabilities directly related to assets held for sale no data 39 56 -
Total equity and liabilities 548 572 541 109 563 287 1.4%
Profit and loss account
Revenue 792 312 759 624 862 650 4.3%
Domestic sales 534 860 498 045 608 147 7.4%
Foreign sales 257 452 261 579 254 503 -1.6%
Construction operations 578 995 543 072 680 687 6.6%
Other operations 213 317 216 552 181 963 -1.5%
EBITDA -5 940 22 834 47 116 -126.0%
EBIT -19 682 8 789 32 770 -323.9%
Netprofit/loss -22 601 2 482 19 277 -1010.6%
Other data
Net debt 297 571 233 486 246 672 27.4%
Debt/Balance sheet total 57,6% 51,0% 50,8% 13.0%
Capital expenditure/Revenue 1,8% 1,2% 2,2% 50.4%
Market capitalisation 171 501 202 818 331 070 -15.4%
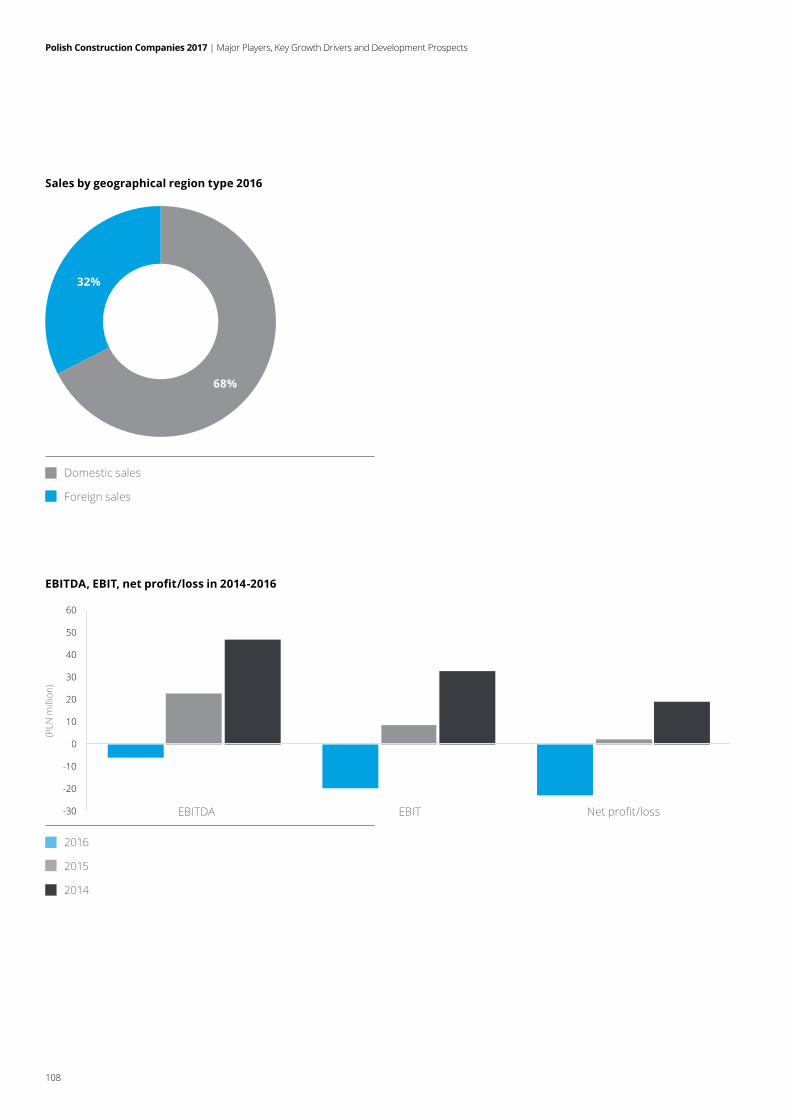
Polish Construction Companies 2017 | Major Players, Key Growth Drivers and Development Prospects
108
-30
-20
-10
0
10
20
30
40
50
60
Sales by geographical region type 2016
Domestic sales
Foreign sales
EBITDA, EBIT, net profit/loss in 2014-2016
2016
2015
2014
EBITDA EBIT Netprofit/loss
(PLN
mill
ion)
68%
32%
Polish Construction Companies 2017 | Major Players, Key Growth Drivers and Development Prospects
109
Mota-Engil Central Europe S.A.
Mota - Engil Central Europe S.A. is among the largest construction companies operating in Poland. It was established through the merger of two Polish enterprises, namely Krakowskie PrzedsiębiorstwoRobótDrogowychS.A.(KPRD)andPrzedsiębiorstwoBudowyMostów w Lubartowie Sp. z o.o. (PBM), which had been present on the local market since 1949.
Today, Mota-Engil Central Europe is a strong construction company drawing on more than 60 years' Polish tradition in road and bridge construction and specializing at the same time in the construction of buildings and facilities, railways and in power engineering. Additionally, it has a mine in Górka Sobocka, where high quality aggregate is extracted for sale.
Mota-Engil Central Europe has built hundreds of kilometres of motorways which are of crucial importance to Poland, including A4, A2 and the S11, S17, S5 and S3 expressways, a ring road in Nysa and Odra-Widawa channel, residential and public utility buildings or electric power stations. Acting as the general contractor on the major construction projects in Poland, Mota-Engil Central Europe cooperates with hundreds of local businesses.
The company has substantial equipment resources, a network of bituminous material production facilities as well as itsownboardingandscaffoldingdivision.In 2016, production of mineral asphalt mixtures exceeded 4,000,000 tons, denoting a year-on-year growthby ca. 17%.
In 2016, revenue generated by Mota-Engil Central Europe S.A. amounted to PLN 787 million, i.e. PLN 163 million less than in 2015. Revenue from construction services accounted for almost 97% of its total revenue in 2016. The remaining portion was generated from sales of materials and products (aggregate and mineral asphalt mixtures).
The road and railway construction segment was the source of over 75% of the total revenue. In 2016, EBITDA exceeded PLN 20 million as compared to more PLN 35 million a year before. EBIT amounted to PLN 9 million vs. more than PLN 7 million in 2015. In 2016, the company reported a loss ofPLN12millionascomparedtoaprofitofPLN 4.5 million in the preceding year.
At the end of 2016, the order portfolio amounted to PLN 1.4 billion and the total contract value approximated PLN 2.5 billion. Gross investments in non-current assets neared PLN 30 million.
In 2016, the headcount approximated 1,250 people and was about 3% lower than in the prior year.
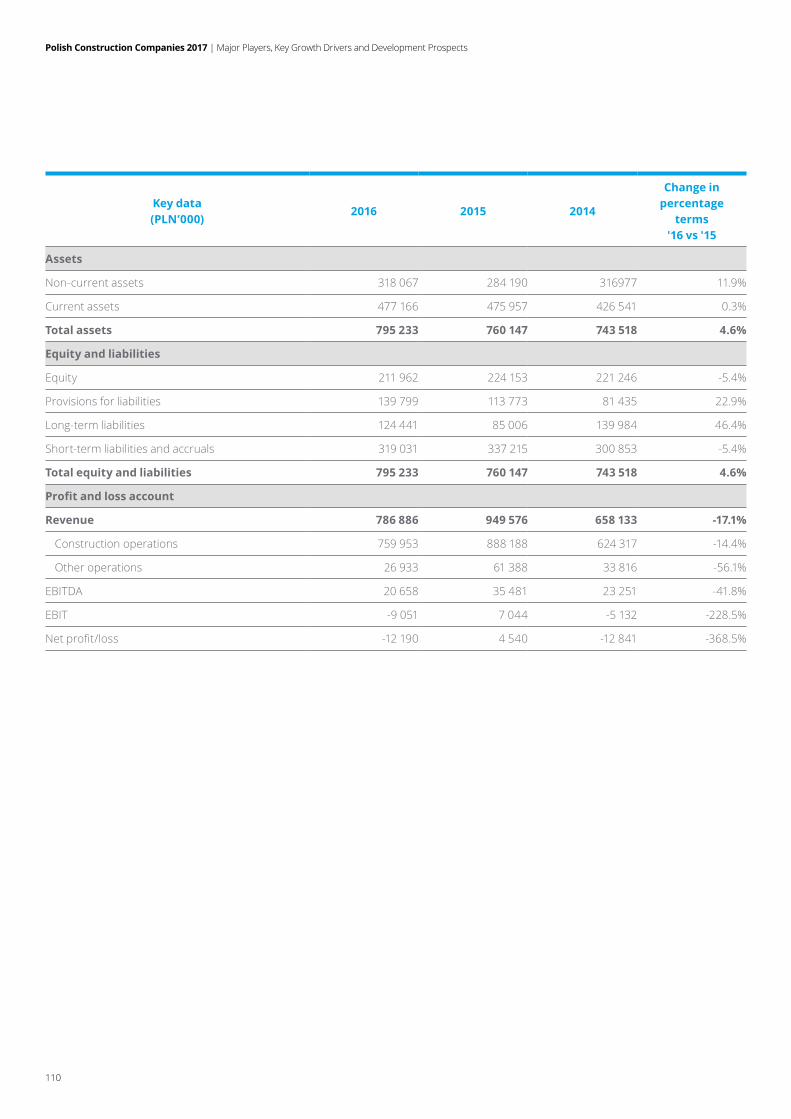
Polish Construction Companies 2017 | Major Players, Key Growth Drivers and Development Prospects
110
Key data (PLN’000)
2016 2015 2014
Change in percentage
terms '16 vs '15
Assets
Non-current assets 318 067 284 190 316977 11.9%
Current assets 477 166 475 957 426 541 0.3%
Total assets 795 233 760 147 743 518 4.6%
Equity and liabilities
Equity 211 962 224 153 221 246 -5.4%
Provisions for liabilities 139 799 113 773 81 435 22.9%
Long-term liabilities 124 441 85 006 139 984 46.4%
Short-term liabilities and accruals 319 031 337 215 300 853 -5.4%
Total equity and liabilities 795 233 760 147 743 518 4.6%
Profit and loss account
Revenue 786 886 949 576 658 133 -17.1%
Construction operations 759 953 888 188 624 317 -14.4%
Other operations 26 933 61 388 33 816 -56.1%
EBITDA 20 658 35 481 23 251 -41.8%
EBIT -9 051 7 044 -5 132 -228.5%
Netprofit/loss -12 190 4 540 -12 841 -368.5%
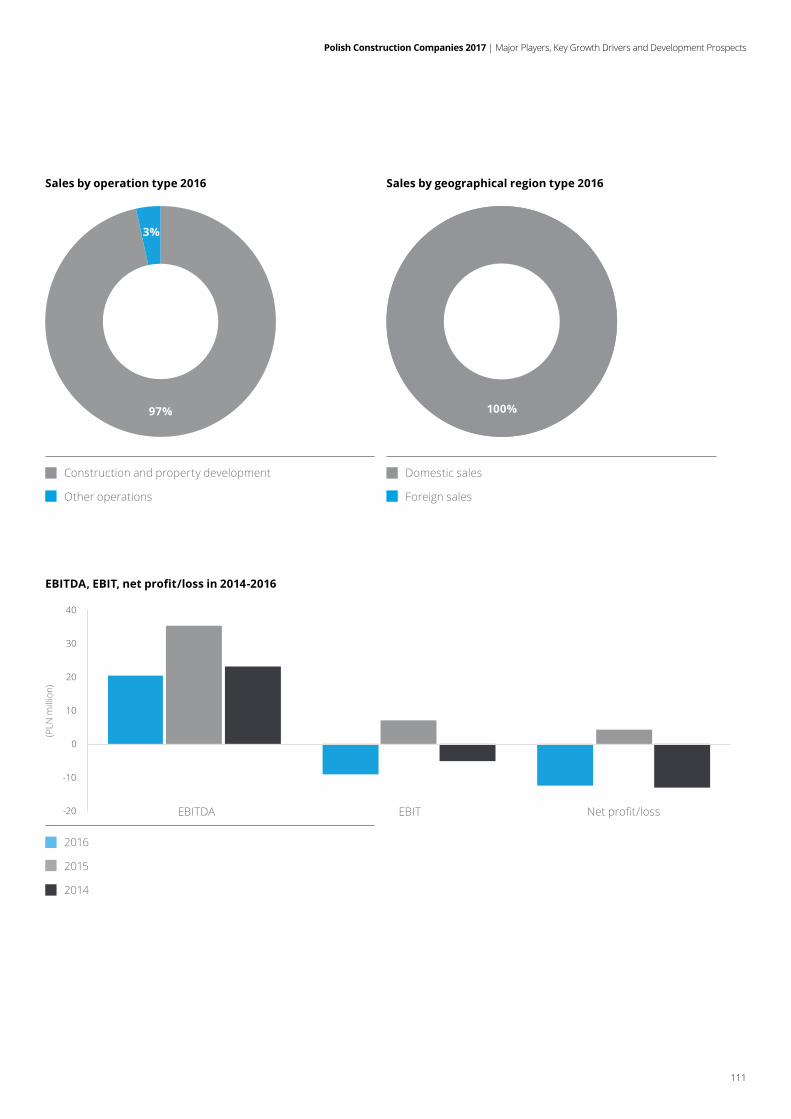
Polish Construction Companies 2017 | Major Players, Key Growth Drivers and Development Prospects
111
-20
-10
0
10
20
30
40
Sales by operation type 2016 Sales by geographical region type 2016
Construction and property development
Other operations
Domestic sales
Foreign sales
EBITDA, EBIT, net profit/loss in 2014-2016
2016
2015
2014
EBITDA EBIT Netprofit/loss
(PLN
mill
ion)
97%
3%
100%
Polish Construction Companies 2017 | Major Players, Key Growth Drivers and Development Prospects
112
MIRBUD S.A.
MIRBUD S.A. is one of the largest construction companies in Poland. It has been present on the Polish market since 1988. From 2002 on, it has performed construction contracts including industrial facilities, public utilities and residential buildings, acting solely as the general contractor.Since2004,itsofferhasincluded road infrastructure projects. In 2006, the Company changed its legal form, continuing as a joint-stock company. On 28 December 2008 (after 20 years in business)it had a successful IPO on the Warsaw Stock Exchange.
At present, with thirty years of practice, the Company has completed 500 investment projects, including industrial, commercial, engineering and road, residential and public utility construction. The MIRBUD Capital Group employs nearly 750 people (mostlycertifiedconstructionengineers)includinghighlyqualifiedengineeringstaffspecializedinvariousconstructionsegments. Modern machinery allowing performance of most works based on own resources is another asset of the Company.
Since 2006, MIRBUD S.A. has been the parent in the capital group carrying out diversifiedbusinessoperations.JHMDEVELOPMENT S.A. is a separate business specialized in residential construction, whilePrzedsiębiorstwoBudowyDrógiMostów KOBYLARNIA S.A. in Bydgoszcz carries out road and bridge construction and production of bituminous mass. Further, the Capital Group includes MARYWILSKA 44 Sp. z o.o., the owner and manager of one of the largest shopping malls in Warsaw, and EXPO MAZURY S.A., the owner and operator of an exhibition and event centre in Ostróda.
In2016,thecompanycarriedoutfivelargeconstruction projects. Three of them to be completed in Q3 and Q4 2017 include:
• construction of an event hall in Gliwice (the contract value: PLN 321 million);
• construction of a secondary school in Wrocław(thecontractvalue:PLN36.5million);
• constructionofaringroadinInowrocław(the contract value: PLN 359 million).
The remaining two contracts shall be completed in Q2 and Q4 2018 and include:
• construction of a section of S-3 expressway from Nowa Sól to Legnica (the contract value: PLN 448 million);
• construction of a section of S-5 expressway from Nowe Marzy to Bydgoszcz (the contract value: PLN 442 million).
In 2016, the MIRBUD Group generated revenue of PLN 774 million, which denotes a 2% growth year-on-year. All sales took place on the domestic market.
In 2016, its EBIT amounted to PLN 41.5 million and increased by 24% year-on-year. ThenetprofitoftheGroupwas47%higherthan in 2015 and amounted to PLN 21.5 million.
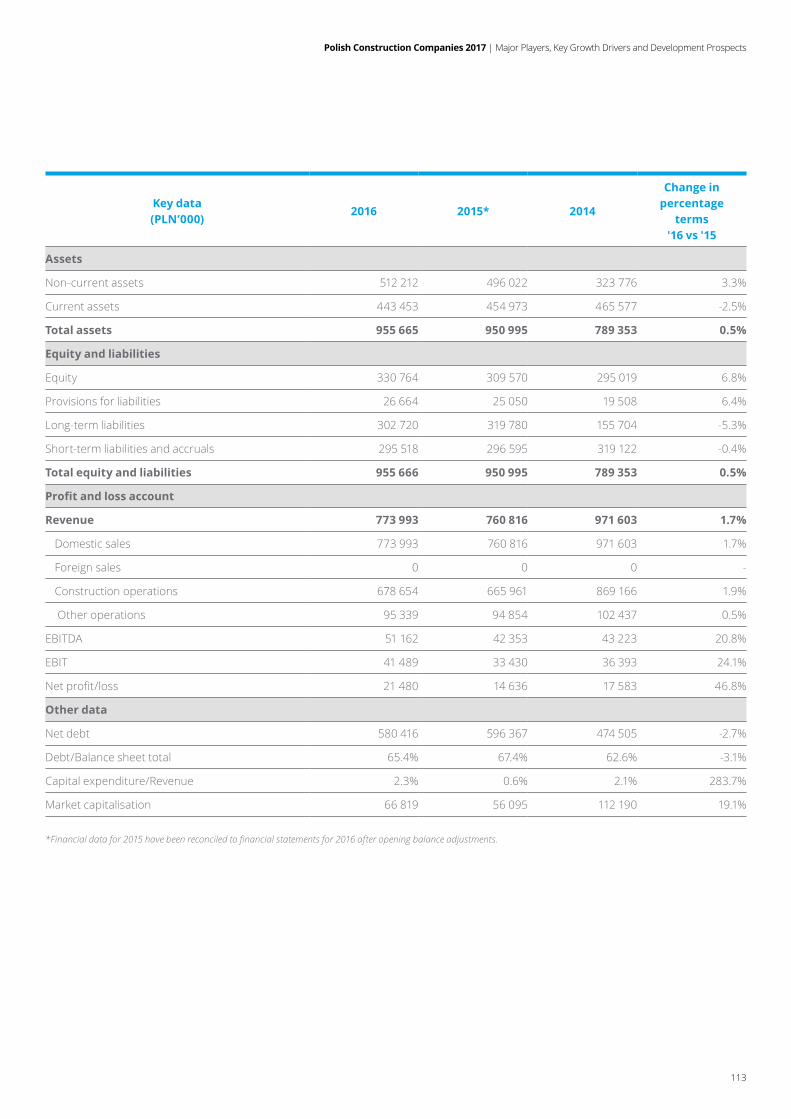
Polish Construction Companies 2017 | Major Players, Key Growth Drivers and Development Prospects
113
Key data (PLN’000)
2016 2015* 2014
Change in percentage
terms '16 vs '15
Assets
Non-current assets 512 212 496 022 323 776 3.3%
Current assets 443 453 454 973 465 577 -2.5%
Total assets 955 665 950 995 789 353 0.5%
Equity and liabilities
Equity 330 764 309 570 295 019 6.8%
Provisions for liabilities 26 664 25 050 19 508 6.4%
Long-term liabilities 302 720 319 780 155 704 -5.3%
Short-term liabilities and accruals 295 518 296 595 319 122 -0.4%
Total equity and liabilities 955 666 950 995 789 353 0.5%
Profit and loss account
Revenue 773 993 760 816 971 603 1.7%
Domestic sales 773 993 760 816 971 603 1.7%
Foreign sales 0 0 0 -
Construction operations 678 654 665 961 869 166 1.9%
Other operations 95 339 94 854 102 437 0.5%
EBITDA 51 162 42 353 43 223 20.8%
EBIT 41 489 33 430 36 393 24.1%
Netprofit/loss 21 480 14 636 17 583 46.8%
Other data
Net debt 580 416 596 367 474 505 -2.7%
Debt/Balance sheet total 65.4% 67.4% 62.6% -3.1%
Capital expenditure/Revenue 2.3% 0.6% 2.1% 283.7%
Market capitalisation 66 819 56 095 112 190 19.1%
*Financial data for 2015 have been reconciled to financial statements for 2016 after opening balance adjustments.
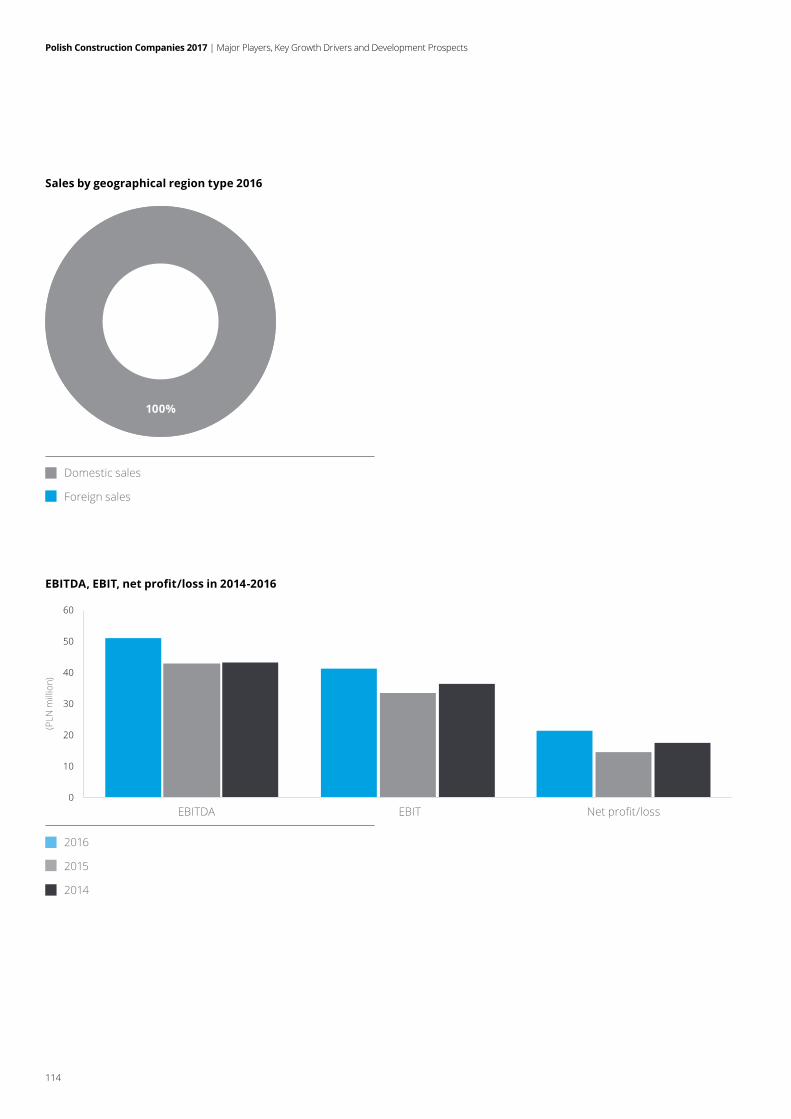
Polish Construction Companies 2017 | Major Players, Key Growth Drivers and Development Prospects
114
0
10
20
30
40
50
60
Sales by geographical region type 2016
Domestic sales
Foreign sales
EBITDA, EBIT, net profit/loss in 2014-2016
2016
2015
2014
EBITDA EBIT Netprofit/loss
(PLN
mill
ion)
100%
Polish Construction Companies 2017 | Major Players, Key Growth Drivers and Development Prospects
115
1. CentralStatisticalOffice,Concise Statistical Yearbook of the Republic of Poland 2015, www.stat.gov.pl
2. CentralStatisticalOffice,Economic Situation, Economic conditions in the industry, construction, commerce and services in July 2017., www.stat.gov.pl
3. CentralStatisticalOffice,Concise Statistical Yearbook of Poland 2017, www.stat.gov.pl
4. CentralStatisticalOffice,Employment and salaries in the national economy, www.stat.gov.pl
5. Coface, Coface reports on bankruptcies in Poland, (http://www.coface.pl/Aktualnosci-i-Media/Biuro-prasowe)
6. CushmanandWakefield, Industrial Market in Poland, Q1 2017
7. Deloitte, European Powers of Construction 2014, July 2017
8. Deloitte, Property Index. Overview of European Residential Markets, July 2017
9. Knight Frank, Poland: Competitive Market 2015/2016,
10. JournalofLawsofthe RepublicofPoland, Act of 10 July 2015 amending the Railway Fund Act
11. EUI, Country Forecast Poland, August 2016 update
12. Euler Hermes, Bankruptcy reports, (http://www.eulerhermes.pl/analizy-ekonomiczne/economic-publications/ )
13. Euromoney Institutional Investor, Poland Construction and Infrastructure Industry Data, 2016
14. Hays, Payroll Report 2017, Job market trends
15. Jones Lang LaSalle, Polish warehouse property market in 2015
16. National Council of Water Management, Master Plan for the implementation of Council Directive 91/271/EEC, May 2015
17. National Council of Water Management, Master Plan for the implementation of Council Directive 91/271/EEC, May 2016
18. Minister of Economy, National Action Plan for Renewal Energy Sources, 2010
19. Ministry of Finance, Public Finance Sector Debt Management Strategy for 2017-2020, September 2016
20. Ministry of Environmental Protection, National Waste Management Plan 2022, July 2016
21. Ministry of Infrastructure and Construction, Infrastructure and Environment Operational Programme 2014 – 2020
22. Ministry of Infrastructure and Construction, National Road Building Programme for 2011-2015 , including appendices and progress reports (http://www.mir.gov.pl/transport/infrastruktura_drogowa/program_budowy_drog_krajowych/strony/start.aspx)
23. Ministry of Infrastructure and Construction, National Road Building Programme for 2014-2023 (with projections by 2025) including appendices (https://www.mir.gov.pl/strony/zadania/transport/drogi/program-budowy-drog-krajowych/ )
24. Ministry of Infrastructure and Construction , Municipal and Regional Road Infrastructure Development Programme for 2016-2020 (https://www.mir.gov.pl/strony/zadania/transport/drogi/finansowanie-drog-samorzadowych/program-rozwoju-drog-gminnych-i- powiatowych/ )
25. Ministry of Infrastructure and Development, National Railway Programme, (including appendices)
26. Ministry of Infrastructure and Development, Programming in the 2014 -2020 Financial Perspective , Partnership Agreement
27. ManpowerGroup, Manpower Employment Prospects Barometer Poland Q4 2017
28. Railway Transportation Office, Railway Traffic Security Report 2016, August 2017
29. Gaz System, National Ten-Year Gas Transmission Development Programme 2016-2025, July 2015
30. PSE, Development plan for satisfaction of the current and future demand for electricity between 2016 and 2025
31. Tauron, TAURON Group’s Strategy 2016-2025, September 2016
32. Energa, ENERGA Group’s Strategy 2016-2025, November 2016
Bibliografia
Polish Construction Companies 2017 | Major Players, Key Growth Drivers and Development Prospects
116
33. PGE, Management Board’s Report on the Activities of PGE Polska Grupa Energetyczna S.A. and of the PGE Capital Group for 2016, March 2017
34. Enea, Development Strategy of the Enea Group until 2030, October 2016
35. ClientEarth, Analysis of the RES amendment bill, May 2016
36. Ministry of Infrastructure and Construction, National Housing Programme, June 2016
37. Polish Waste Management Chamber, National Waste Management Programme, July 2016
38. REAS, Residential Poland Q1 2017, February 2017
39. REAS, Residential Poland Q4 2017
40. CIRE.pl website
41. Eurostat website: http://ec.europa.eu/eurostat
42. Website of the Ministry of Infrastructure and Development, dedicated to EU funds 2014-2020: https://www.funduszeeuropejskie.gov.pl/
43. Website of DGNRM: Report on technical condition of national roads at the end of 2016,
44. DGNRM, 2016 Recap, January 2017
45. PKP PLK website: http://www.plk-sa.pl
46. Website of the National Council of Water Management devoted to the National Sewage Treatment Programme: http://kzgw.gov.pl/pl/Krajowy-program-oczyszczania-sciekow-komunalnych.html
47. Website of the National Council of Water Management, Master Plan for the implementation of Council Directive 91/271/EEC (http://www.kzgw.gov.pl/pl/Wiadomosci/Master-Plan-dla-wdrazania-dyrektywy-Rady-91271EWG.html)
48. Website of the Energy Regulatory Office: http://www.ure.gov.pl/
49. TechNavio, Construction Market in Poland 2015-2019
50. Energy Regulatory Office, National Report of the President of the Energy Regulatory Office 2016, September 2017
51. Multi-Annual Financial Plans for Warsaw, Kraków, Poznań, Wrocław, Gdańsk and Katowice
52. Polish Bank Association, Nationwide report on home loans and real estate transactional prices, July 2017
Information, press releases and websites:
53. http://mib.gov.pl/files/0/1797173/MieszkaniePlus.pdf
54. http://www.bankier.pl/wiadomosc/Program-Mieszkanie-Plus-szczegoly-7408952.html
55. http://www.polskieradio.pl/42/4393/Artykul/1481586,Zamiast-kupowac-nareszcie-bedzie-mozna-wynajac-tanio-mieszkanie
56. http://wroclaw.wyborcza.pl/wroclaw/1,35771,19620311,najczesciej-plajtuja-firmy-budowlane-ale-bankrutow-coraz-mniej.html
57. http://www.rynekbudowlany.com/aktualnosci/271291/rekordowa-podaz-na-rynku-biurowym-w-i-pol-2016/done
58. http://www.pois.gov.pl/media/18557/Zal_5_Wykaz_projektow_zidetyfikowanych_2016-04-13.pdf
59. http://www.rynek-kolejowy.pl/watki/fundusze-unijne.html
60. Article http://www.rynek-kolejowy.pl/wiadomosci/jest-pierwsza-wersja-nowego-krajowego-programu-kolejowego-76778.html
61. http://www.mg.gov.pl/Energetyka+jadrowa elektro-innowacje.plhttp://odnawialnezrodlaenergii.pl/oze-aktualnosci/item/2290-wojewodztwo- podlaskie-wyda-50-mln-zl-z-ue-na-inwestycje-w-oze

Polish Construction Companies 2017 | Major Players, Key Growth Drivers and Development Prospects
117
Contact usMaciej KrasońDeloittePartner, Leader, Real Estate & Construction Sector, Poland and Central Europe, Audit & Assurance+48 (22) 511 03 [email protected]
Łukasz MichorowskiDeloitteDirector, Audit & Assurance+48 (22) 348 36 [email protected]
Paweł SadowskiDeloitteDirector, Financial Advisory Services Department+48 (22) 511 02 [email protected]
Michał KubikDeloitteManager, Financial Advisory Services Department+48 (22) 511 09 [email protected]

Polish Construction Companies 2017 | Major Players, Key Growth Drivers and Development Prospects
118

Polish Construction Companies 2017 | Major Players, Key Growth Drivers and Development Prospects
119

Deloitteprovidesaudit,tax,consulting,financialadvisoryandlegalservicestopublic and private clients spanning multiple industries. With a globally connected networkofmemberfirmsinmorethan150countriesandterritories,Deloittebrings world-class capabilities and high-quality service to clients, delivering the insights they need to address their most complex business challenges. delivering the insights they need to address their most complex business challenges.
Deloitteprofessionalsareunifiedbyacollaborativeculturethatfostersintegrity,outstanding value to markets and clients, commitment to each other and strength from diversity. They enjoy an environment of continuous learning, challenging experiences, and enriching career opportunities. Deloitte's professionals are dedicated to strengthening corporate responsibility, building public trust, and making a positive impact in their communities.
Deloitte refers to one or more of Deloitte Touche Tohmatsu Limited, a UK private companylimitedbyguarantee(“DTTL”),itsnetworkofmemberfirms,andtheirrelatedentities.DTTLandeachofitsmemberfirmsarelegallyseparateandindependent entities. Please see www.deloitte.com/pl/onas for a more detailed descriptionofDTTLanditsmemberfirms.
© 2017 Deloitte Poland