political risk – investment risk due to changes in ... · iii. liquidity risk ... • current...
TRANSCRIPT

1. i. Credit Risk
• Business Credit Risk – Risk that a counterparty does not fulfill its obligations • Invested Asset Credit Risk – Risk that an asset does not make payments • Political Risk – Investment risk due to changes in government policy • Concentration Risk – Increased exposure to credit risk due to lack of
diversification across industries, sectors, or geographic locations ii. Market Risk
• Basis Risk – Risk that yields on investments move in opposite direction if liabilities they are backing
• Interest Rate Risk – Risk of adverse interest rate fluctuations • Reinvestment Risk – Risk that reinvested cash flows earn less than expected
due to falling interest rates • Currency Risk – Risk of adverse currency fluctuations. EG, US dollar rises in
value relative to a foreign government. • Sovereign Risk – Risk that investments in foreign countries are impacted by
interference from foreign governments • Asset/Liability Matching Risk – If interest rate fluctuations have opposite
effects on assets & liabilities, this could expose the insurer to insolvency • Asset/Liability Concentration risk – Increased exposure to interest rate risk
due to lack of diversification across industries, sectors, or geographic locations
• Asset Market Value Risk – Risk that the realizable value is less than the carrying value upon conversion to cash due to poor market conditions
• Political Risk – Risk of adverse changes in government policy iii. Liquidity Risk
• Liquidity Risk – Risk that an asset must be sold during unfavorable market conditions
• Asset/Liability Matching Risk – Risk that actual cash flows and liquidation asset values do not match obligations to policyholders during adverse market conditions
• Asset-Affiliates – Risk that value of an investment affiliate declines

2. a) Benefits:
• Transfer of risk to reinsurer • Surplus relief • New business opportunity in the sense of improved earnings and optimizing
returns on capital • Opportunity to optimize the use of tax losses and gains • Savings on admin, IT, overhead expenses
Risks:
• Counterparty risk exposure – risk of the reinsurer becoming insolvent b) Income Statement:
Revenues: FY premium: 20.5 x 0.25 = 5.125 Premium allowance: 20.5 x 0.75 x 0.5 = 7.688 Expense allowance: 20.5 x 0.75 x 0.03 = 0.046 Net Investment Income = (5.125 + 7.688 + 0.046 – 1.4 x 0.25 – 4.7) x 0.5
x 0.08 + (12.3 x 0.25 + 0) x 0.5 x 0.08 = 0.435 Total Revenue = 13.294
Benefits and Expenses
Claims: 1.4 x 0.25 = 0.35 Expenses and commissions: 4.7 Changes in reserves: 12.3 x 0.25 = 3.075
Total benefits and expenses = 8.125 Net income = 13.294 – 8.125 = 5.169
Balance Sheet: Assets = 5.169 + 3.075 = 8.244 Liabilities and Capital:
Reserves = 12.3 x 0.25 = 3.075 Surplus = 5.169
Total Liabilities and surplus = 8.244 c) Advantages of F/W coinsurance:
• No cash changes hands initially – avoid the need to liquidate assets • Cash flows between the parties are minimized in all years • Lessens the risk of reinsurer becoming insolvent • Ceding company has a larger pool of assets to manage • Ceding company retains control of investment policy – easier to manage
interest sensitive products

2. • Can claim reserve credit up to the funds withheld amount
Disadvantages:
• More complicated to administer than regular coinsurance • Need to track AR or AP • Need to calculate interest adjustment on AR or AP • May have problems claiming reserve credit if reinsurer is not registered
d) Income Statement:
• No changes to the income statement (unless there is an adjustment form the investment income on funds withheld)
Balance Sheet:
• Surplus: assuming no changes to income, the surplus is still the same (at 5.169)
• Liabilities: ceding company establishes an account payable in the amount of 15.375 – 7.688 0 0.046 = 7.641. No other changes. Reserves are still the same (at 12.3 x 0.25 = 3.075)
• Assets are higher by 7.641

3. Three Primary Variables in Financial Economics Valuation Models:
1. Discount rate: risk-free rate versus risk-adjusted rate 2. Probability: “true” probability versus risk-adjusted probability 3. Cash flows: unadjusted cash flows versus cash flows adjusted to account for
risk Using twin security payoff: Modify the probabilities of the risky future cash flows to account for risk and discount at risk-free interest rates ( ) ( ) ( )4.5 1 3
0.6251 f
p p
r
′ ′× + − × −⎡ ⎤⎣ ⎦ =⎡ ⎤+⎣ ⎦
where 1.08fr =
p′ = risk-neutral probability = 0.49 Cash flow certainty equivalent:
( ) ( )( ) ( )( )1 1 2 1 1 21.3 1.08
p S p S Z p S p S′ ′× + − × − × + − ×= where p′ is the risk adjusted
probability Using 8% risk-free interest rate with risk neutral probabilities ( ) ( )0.49 90 0.51 60
1.08× + ×−
=( )44.1 30.6
12.51.08+ −
= =
Using a 30% risk adjusted discount factor with true probabilities ( ) ( ) ( ).5 90 0.5 60
12.51.3
x× + × −= =
45 30 0.5 12.51.3
x− + ×= =
2.5x = million Monte Carlo
• Uses repeated random sampling from the probability distributions for the various CF components to generate distributions of NPV
• Key underlying variables need to be properly modeled • May be difficult to capture model interdependencies • Problem of interpretation of output, such as unreliability of extreme values • If outcome of simulation is distribution of NPVs rather than cash flows,
meaning is questionable • Not clear what discount rate should be used • Difficult to translate distribution of NPVs into clear decision rules

3. • Forward-looking technique based on pre-determined operating strategy that
may not handle management flexibility to adapt and modify • Should focus on generating cash flows, not NPV distributions • Model building may be turned over to experts, management understanding
reduced

4. Separate Account Reserve a) Assumed rate = valuation rate = 7% in all years
Policy Year 0 1 2 3 4 5 AV (End of Year) 900 954 1011.2 1071.9 1136.2 1204.4Surrender Value (End of Year) 860 914 981.2 1051.9 1126.2 1204.4PV (Surrender Value) at 7% value rate 860 854.2 857.0 858.7 859.2 858.7
Where
( )( )( )( )( )( )
1
1
1
1 assumed rate - Net Asset change
1 .07 .01
1.06
t t
t
t
AV AV
AV
AV
−
−
−
= +
= + −
=
Surrender Value t = (Account Value t ) – (Premium paid to date)(SC% t ) = 1000tAV − (Surrender Charge% t ) The Separate Account reserve is the maximum PV of the surrender value across all durations Here, that is 860 at time t=0 Note that is simply the CARVM reserve, ignoring the GMDB.

4. Integrated Reserve Year 0 1 2 3 4 5 Assumed first year drop -14% Assumed fund recovery 14% 14% 14% 14% 14% 14% AV (after drop) 774 AV (end of year) 900 874.6 988.3 1116.8 1262.0 1426 Average AV 824.3 931.5 1052.6 1189.4 1344 GMDB 1000 1050 1102.5 1157.6 1262.0 1426.1 Death Benefit 1000 1050 1102.5 1157.6 1262.0 1426 Average Death Benefit 1025 1076.3 1130.1 1209.8 1344 Net Amount at Risk 200.7 144.8 77.5 20.4 0 PV (NAR paid at death each
year) 0 3.30 2.44 1.32 0.35 0
A= PV (NAR paid at death all years)
0 3.30 5.74 7.06 7.41 7.41
PV (Average AV paid at death each year)
0 13.55 15.72 17.99 20.38 23.70
B= PV (Average AV paid at death all years)
0 13.55 29.27 47.26 67.64 91.4
C= PV (Base CSV paid to survivors)
860 839.68 826.15 810.61 792.18 771.1
Integrated Reserve
(A + B + C) 860 856.53 861.16 864.93 867.23 869.9
(Formulas next page) The Integrated Reserve is the maximum PV across all durations. Here, that is 869.92 at time t=5. Thus, GMDB reserve = integrated Reserve – Sep. Account Reserve = 869.92 – 860 = 9.92

4. AV (after drop) = 900(1-14%) = 774
Average AV = 1
2t tAV AV −+
GMDB t = Max. of annual ratchet and 5% rollup
( ) ( )1 1, , 1.05
annual ratchet 5% rollup
t t tMax Max AV AV GMDB− −⎡ ⎤= ⎣ ⎦↑ ↑
Death Benefit t = Max (AV t , GMDB t )
Average Death Benefit t = 1
2t tDB DB −+
Net Amount at Risk = Average Death benefit – Average Account Value PV (NAR paid at death each period) at time t
( ) ( )( ) ( )0.5tt t-1
Mortality rates per 1,000NAR Survival function 1 7% Val. Rate1000
t− −⎛ ⎞= +⎜ ⎟⎝ ⎠
PV (Average AV paid at death each year) at time t
( )( ) ( )( ) ( )0.5tt t-1
Mortality rates per 1,000Average AV Survival function 1 7% Val. Rate1000
t− −⎛ ⎞= +⎜ ⎟⎝ ⎠
PV (Base CSV paid to survivors) at time t = (End of year surrender value)(Survival function t )(1 + Val. Rate) t−
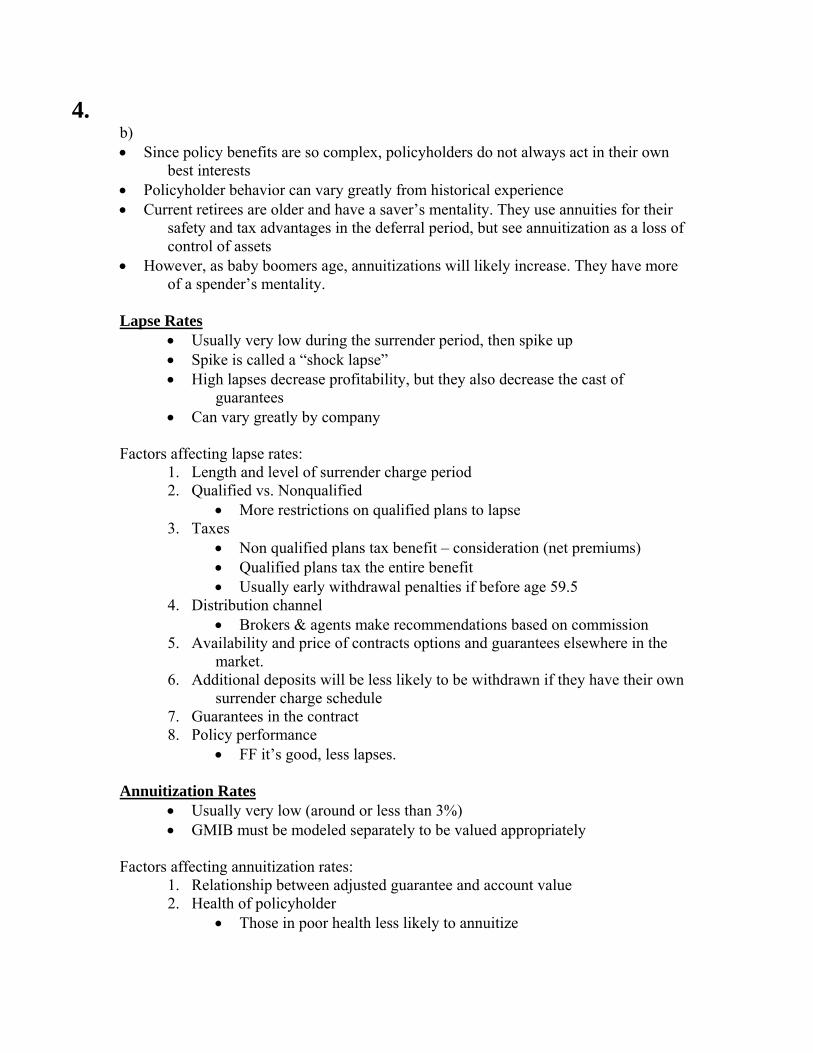
4. b) • Since policy benefits are so complex, policyholders do not always act in their own
best interests • Policyholder behavior can vary greatly from historical experience • Current retirees are older and have a saver’s mentality. They use annuities for their
safety and tax advantages in the deferral period, but see annuitization as a loss of control of assets
• However, as baby boomers age, annuitizations will likely increase. They have more of a spender’s mentality.
Lapse Rates
• Usually very low during the surrender period, then spike up • Spike is called a “shock lapse” • High lapses decrease profitability, but they also decrease the cast of
guarantees • Can vary greatly by company
Factors affecting lapse rates:
1. Length and level of surrender charge period 2. Qualified vs. Nonqualified
• More restrictions on qualified plans to lapse 3. Taxes
• Non qualified plans tax benefit – consideration (net premiums) • Qualified plans tax the entire benefit • Usually early withdrawal penalties if before age 59.5
4. Distribution channel • Brokers & agents make recommendations based on commission
5. Availability and price of contracts options and guarantees elsewhere in the market.
6. Additional deposits will be less likely to be withdrawn if they have their own surrender charge schedule
7. Guarantees in the contract 8. Policy performance
• FF it’s good, less lapses.
Annuitization Rates • Usually very low (around or less than 3%) • GMIB must be modeled separately to be valued appropriately
Factors affecting annuitization rates:
1. Relationship between adjusted guarantee and account value 2. Health of policyholder
• Those in poor health less likely to annuitize

4. 3. Expectations of policy performance
• Annuitization is more likely when a recovery in AV is unlikely 4. Age
• Some assume no annuitizations before age 50 or 55 5. Market Volatility
• During times of market volatility, policyholders flock to the safety of a guaranteed annuity
6. Other assets • Annuitization less likely if the policyholder already has stable monthly
income 7. Taxes
• Benefits above the exclusion amount can be taxed
• Considerations already taxedExclusion amount = Expected # of payments
8. Commissions • Annuitization rates are higher if broker gets a commission.
Pre-Annuitization Mortality
• This has the largest impact on the valuation of GMDB’s • Should make sure the GMDB does not cause antiselection
Partial Withdrawals
• If GMDB of GMIB is reduced by withdrawals on a dollar-for-dollar basis, this creates an incentive for partial withdraw • Instead, should reduce benefit proportionately
• Tax implications provide a disincentive for withdrawals c) Could Impose Limits on the Guarantee Amount
• Benefit only adjusts or ratchets up until a certain age • Benefit capped by some absolute limit
Ex. Twice the starting amount • Only offer benefit to certain issue ages
Ex. 50 and younger • Benefit made not in effect after a certain age • Reduce benefit amounts proportionately with partial withdrawal
Rather than dollar-for-dollar • Limit the benefit amount by (Some percentage) x (Premiums – Withdrawal)
Limit Investment Choices
• Since guarantees are more valuable in volatile assets, could limit the amount of investment placed in risky funds
• Could not offer risky funds as investment choices

4. Rider Termination
• Could allow policyholder to cancel the benefit and its associated fee voluntarily

5. a)
Accounting Balance Sheet Assets Liabilities and Equities
Investment Portfolio Asset insurance
650,00025,000
GICs Debt Equity
396,330189,65589,014
Total assets 675,000 Total liabilities and equity 675,000 Market value: GIC = face * (1 + coupon rate) / (1 + yield rate) = 400 * 1.08 / 1.09 = 396,330 Debt = face * (1 + coupon rate) / (1 + yield rate) = 200 * 1.10 / 1.16 = 189,655
Risk Capital Balance Sheet Assets Capital
Investment Portfolio Asset insurance provided by Equity holders Insurance company Debt holders Customers
650,000
11,64025,00015,9527,408
Cash capital provided by: Customers Debt holders Equity holders Risk capital provided by: Equity holders
403,738205,60740,654
60,000Total assets 710,000 Total capital 710,000 Cash capital: Customers = face * (1 + coupon rate) / (1 + risk-free rate) = 400 * 1.08 / 1.07 = 403,738 Debt holders = face * (1 + coupon rate) / (1 + risk-free rate) = 200 * 1.10 / 1.07 = 205,607 Asset insurance: Customers = default-free value – market value = 403,738 – 396,330 = 7,408
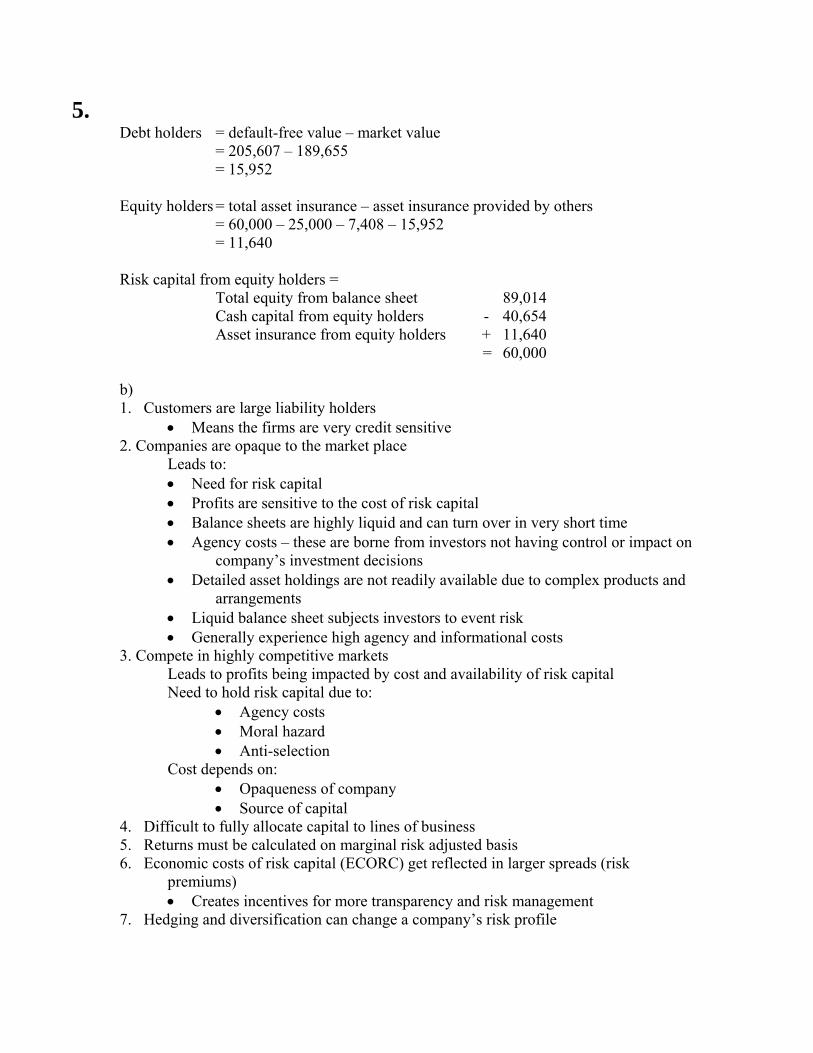
5. Debt holders = default-free value – market value = 205,607 – 189,655 = 15,952 Equity holders = total asset insurance – asset insurance provided by others = 60,000 – 25,000 – 7,408 – 15,952 = 11,640 Risk capital from equity holders = Total equity from balance sheet 89,014 Cash capital from equity holders - 40,654 Asset insurance from equity holders + 11,640 = 60,000 b) 1. Customers are large liability holders
• Means the firms are very credit sensitive 2. Companies are opaque to the market place
Leads to: • Need for risk capital • Profits are sensitive to the cost of risk capital • Balance sheets are highly liquid and can turn over in very short time • Agency costs – these are borne from investors not having control or impact on
company’s investment decisions • Detailed asset holdings are not readily available due to complex products and
arrangements • Liquid balance sheet subjects investors to event risk • Generally experience high agency and informational costs
3. Compete in highly competitive markets Leads to profits being impacted by cost and availability of risk capital Need to hold risk capital due to:
• Agency costs • Moral hazard • Anti-selection
Cost depends on: • Opaqueness of company • Source of capital
4. Difficult to fully allocate capital to lines of business 5. Returns must be calculated on marginal risk adjusted basis 6. Economic costs of risk capital (ECORC) get reflected in larger spreads (risk
premiums) • Creates incentives for more transparency and risk management
7. Hedging and diversification can change a company’s risk profile

6. The three strategic questions are: Exclusiveness of Option Ownership, Interproject or Intraproject Interactions, and Timing or Urgency. First question: Exclusiveness of Option of Ownership
Proprietary Option (P) – the firm retains an exclusive right as to whether and when to invest
Shared Option (S) – competitors share the right to exercise or invest For this investment, other insurance company or financial institutions could put in competitive bid for this block of business. Therefore, the investment option is shared.
Second question: Interproject or Intraproject Interactions Compound option (C) – a real option leading upon exercise to further investment
opportunities or an option whose payoff is another option Simple option (S) – independent opportunities whose value upon exercise is
limited to the underlying project in and of itself This investment represents a compound option because the payoff of this acquisition is not limited to the embedded in force profit of this block of business, but also include the gain in market share and market knowledge which could lead to expansion into a new market
Third question: Timing or Urgency
Expiring option (E) – projects that need an immediately accept or reject decision Deferrable option (D) – projects that can be deferred for future action This investment is clearly an expiring option since the block of business is offered for sale now. There’s a limited time frame for the company to submit a purchase offer. Therefore, this investment belongs to the S – C – E classification.
The following formula is used to calculate weighted average cost of capital (WACC):
( )( )D Et m f
D Er r r r rD E D E
β⎛ ⎞= × + × + × −⎜ ⎟+ +⎝ ⎠
Where r = WACC
( )( )1.8 4.50.056 0.028 0.87 0.108 0.0281.8 4.5 1.8 4.5
0.016 0.06970.0857 or 8.57%
r ⎛ ⎞ ⎛ ⎞= × + × + × −⎜ ⎟ ⎜ ⎟+ +⎝ ⎠ ⎝ ⎠= +=

6. Internal company targets
• Current hurdle rates that are used as minimum benchmarks for pricing or long term targets for pricing
• May vary by line of business based on the perceived risk in the business or based on market conditions
• Cost of funds for transactions • May have specific target rates for the various tiers of debt and equity
financing of a transaction • Overall WACC of the financing, including the expected return on the equity,
use as a discount rate • M&A marketplace discount rates • If there is enough actual or potential M&A transactions, participants have a
sense of discount rates currently being used by buyers • Marketplace discount rates vary depend on:
• The supply and demand of sellers and buyers • Cost of financing • Type of business being sold
Note below values are in millions Maximum purchase value = PurchaseValue = X = EV(0) – Tax(0) – TransCosts – ReqCap(0) X = 420 – Tax(0) – 10 – 118 = 292 – Tax(0) Tax(0) = (SolvRes(0) – TaxRes(0) – PurchaseValue – TransCosts)EarnTaxRate = (2400 – 2200 – X – 10) * 0.4 = (190 – X) * 0.4 = 76 – 0.4X Substitute Tax(0) into the first formula X = 292 – (76 – 0.4X) X = 216 + 0.4X 0.6X = 216 X = 360 Therefore, the maximum purchase value for GE Life is $360 million.
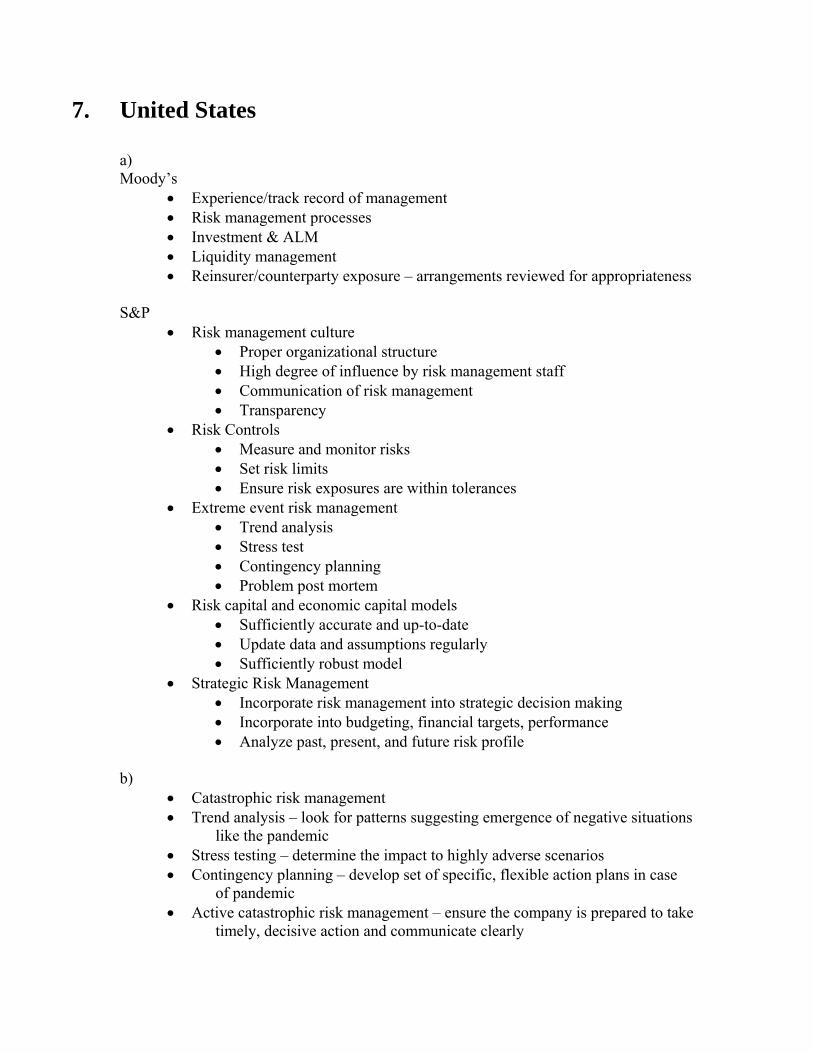
7. United States
a) Moody’s
• Experience/track record of management • Risk management processes • Investment & ALM • Liquidity management • Reinsurer/counterparty exposure – arrangements reviewed for appropriateness
S&P
• Risk management culture • Proper organizational structure • High degree of influence by risk management staff • Communication of risk management • Transparency
• Risk Controls • Measure and monitor risks • Set risk limits • Ensure risk exposures are within tolerances
• Extreme event risk management • Trend analysis • Stress test • Contingency planning • Problem post mortem
• Risk capital and economic capital models • Sufficiently accurate and up-to-date • Update data and assumptions regularly • Sufficiently robust model
• Strategic Risk Management • Incorporate risk management into strategic decision making • Incorporate into budgeting, financial targets, performance • Analyze past, present, and future risk profile
b)
• Catastrophic risk management • Trend analysis – look for patterns suggesting emergence of negative situations
like the pandemic • Stress testing – determine the impact to highly adverse scenarios • Contingency planning – develop set of specific, flexible action plans in case
of pandemic • Active catastrophic risk management – ensure the company is prepared to take
timely, decisive action and communicate clearly
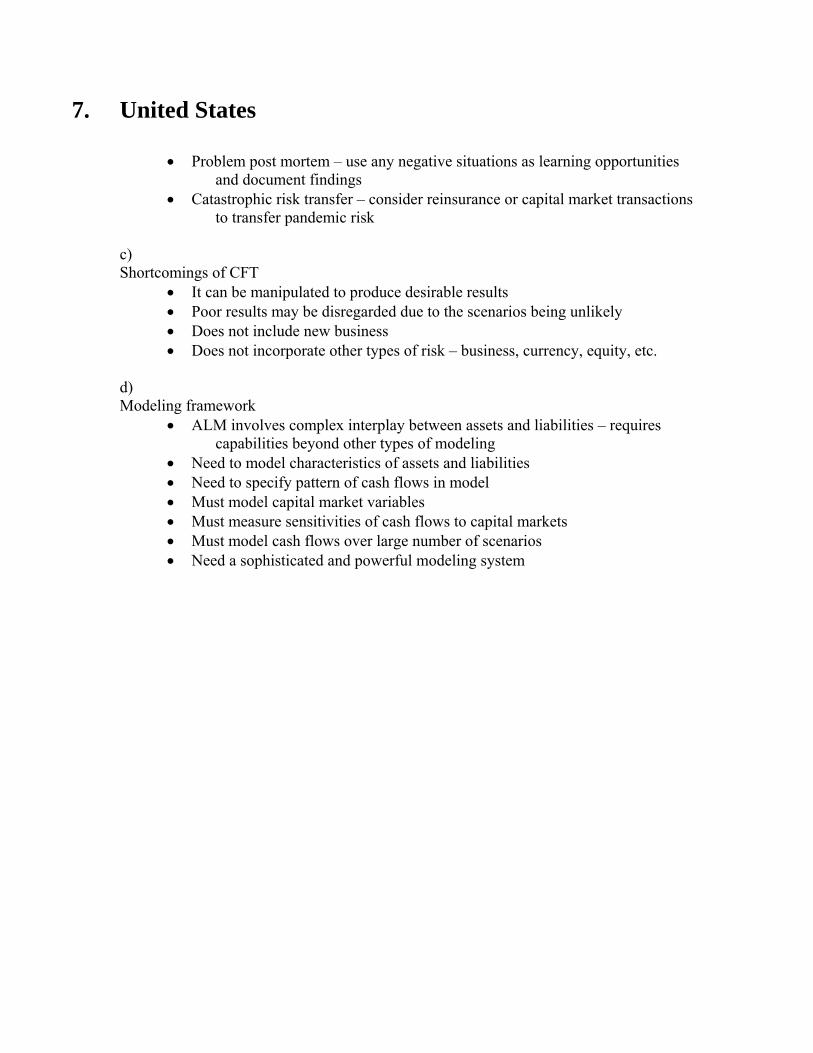
7. United States
• Problem post mortem – use any negative situations as learning opportunities and document findings
• Catastrophic risk transfer – consider reinsurance or capital market transactions to transfer pandemic risk
c) Shortcomings of CFT
• It can be manipulated to produce desirable results • Poor results may be disregarded due to the scenarios being unlikely • Does not include new business • Does not incorporate other types of risk – business, currency, equity, etc.
d) Modeling framework
• ALM involves complex interplay between assets and liabilities – requires capabilities beyond other types of modeling
• Need to model characteristics of assets and liabilities • Need to specify pattern of cash flows in model • Must model capital market variables • Must measure sensitivities of cash flows to capital markets • Must model cash flows over large number of scenarios • Need a sophisticated and powerful modeling system

7. Canada
a) Disclosure information
• Yield rate formula: 2I(A+B-I) • Explain significant changes in yield rates between years for each class • If asset mix, including bond quality, has changed materially – discuss reasons • If investment policy changed, discuss effect on liabilities • Disclose use of assets other than bonds, mortgages, equity, real estate, policy
loans, or cash to back actuarial liabilities • Asset-liability matching objectives for each business segment • Investment strategy used to achieve ALM objectives • Breakdown of assets used to back each business segment and surplus • Frequency of rebalancing to meet ALM objective • Use of derivatives, stock, or real estate in ALM matching • Assumptions used in developing cash flows • Metrics used to measure and monitor the exposure to interest rate risk
(duration, convexity, etc.) • Process used to validate immunization strategy
b) Source of Earnings
• Expected profit on in-force business • Release of PfAD • Expected net management fees • Expected earnings on deposits
• Impact of new business • Point of sale impact on net income • Different between premium received and expenses incurred as a result
of new sales • Experience gains & losses
• Differences between actual experience and best estimates at beginning of period
• Should not include effect of management actions or change in assumptions
• Management actions and changes in assumptions • Changes in best-estimate assumptions • Changes in assumptions for margins for adverse deviations • Changes in methodology for valuation of policy liabilities • Correction of errors • Change in price of a product • Change in fees or fee structure • Changes in asset mix

7. Canada
• New or revised reinsurance deals • Acquisition of block of business • Changes in mortality, laps, dividends, expenses, etc. • Changes due to valuation calculation system changes • Changes due to new actuarial or accounting standards • Changes in bulk actuarial liabilities • New economic scenarios
• Other – taxes • Income on Surplus
c) Commentary on each component of source of earnings
• In force – best estimate could change due to • Change in assumptions for investment returns on new asset classes
• Impact of new business – liabilities could change due to new investment policy/mix
• Experience gains/losses – does not include management actions – changes in investment policy would be considered a management action
• Management actions/changes in assumptions – Variance between actual and expected income should be disclosed
• Changes in MfAD levels could be required, should be disclosed as a basis change
• Source of earnings disclosure must be consistent with assumptions used in AAR

8. Planning and Scoping
• Well thought out planning pays off • Most frequently done through a steering committee that includes officers from
key business areas including actuarial • A detailed plan is developed that identifies timing, tasks, and responsibilities • If outside resources are used, it is usually for project management and/or
documentation assistance • Start with a detailed scoping phase and then refine it as the project develops • Need to identify the actuarial processes and sub-processes that feed and
support financial statements • Clearly identify the process owners/sub-process owners and determine the
objectives • The processes that support GAAP reserves, DAC and VOBA are included
along with a number of more controversial areas upon which financial statement figures are more indirectly dependent (e.g. pricing process, assumptions, modeling, experience studies, underwriting)
Risk Identification
• Only when the risks are identified can there be focus on the controls around those risks
• Risk profiles can be created by noting that processes used to determine reserves consist of four key areas • Data – gathering and interpreting (e.g. policy data, claims paid,
mortality, persistency) • Actuarial valuation systems – programs, spreadsheets, etc. used to
calculate reserves • Compilation – compilation of reserves and other pieces of financial
statement balances for input into the • Management review process – way that management evaluates the
processes involved in data gathering, interpretation of valuations and compilation of results
Assessment of Control
• Identifying appropriate types of controls • Determines whether appropriate controls exist • Assessing whether the existing controls are effective • For each significant risk, it is necessary to place adequate controls and
document them • Control documentation should include
• The purpose, i.e., what risks are being controlled • Responsibility of the control • Explanation of the control • Evidence that the control was performed

8. • Should also consider the length of time the control has been in
operation and whether the control is operating as designed on a consistent and timely basis from period to period
Testing of Controls
• Process owners should assess the controls and develop tests for the controls • Process owners are responsible for documenting the test results and providing
these results to management • Determine what actions are necessary to define the effectiveness of the
control • Adding/changing test steps for each control as changes are needed • Executing test activities • Documenting test results (for both internal and external auditors) • Determining and documenting alternate controls that would be
effective if the specific control doesn’t exist or is not effective • Preparing a remediation plan for controls that are deemed to be not
effective and ensuring the plan is executed techniques for testing controls
• High level review using inquiry and observation of control activities • Detailed walk-through of processes in selected assessments, inspecting
control evidence maintained by individuals responsible for performing the key process activities
• Selection of a sample for which work is reperformed to ensure proper processing and recording other considerations in assessing a control
Documentation
• Keep in mind that both internal and external auditors have to review the documentation
• Include the following: • Formal identification of processes • Identification of risks involved • Narrative descriptions of processes • Flow charts • Control matrix including for each key control the objective, activity,
description of testing, financial statements involved and other relevant information

8. 1. Validation of input data 2. File/data security measures 3. Appropriateness and accuracy of algorithms 4. Adequacy of reserves 5. Conformity with law (including taxes) 6. Appropriateness of assumptions 7. Follow documented workflow 8. Identify change in assumptions/methods 9. Document assumptions/methods 10. Analysis, review and approval process 11. Worksheet checks and balances COSO 1. Yes 2. Yes 3. Yes 4. Yes 5. Yes 6. Yes 7. Yes 8. Yes 9. Yes 10. Yes 11. Yes SEC 1. Yes 2. Yes 3. No 4. No 5. No 6. No 7. Yes 8. Yes 9. Yes 10. Yes 11. Yes

9. a) Probabilistic Approach
• In the probabilistic approach, every yield curve can be defined by its level (the 10-year rate) and its slope (ratio of 90-day rate / 10-year rate)
• Develop a grid of probabilities • Use table of probabilities and randomly generated numbers to determine the
level and slope in the next period Successive Ratios Approach
• Assumes successive rates follow a lognormal distribution • Correlation between the 90-day rate and 10-year rate is reflected by
generating random numbers Z1 and Z2. • Use Z1 to develop the 90-day rate, and use Z1 and Z2 to develop the 10-year
rate.
( ) ( ) ( )
( ) ( ) ( )
190 90
1010 10
1
1
Z VolatilityFactorday day
Z yr VolatilityFactoryear year
i t i t e
i t i t e
×− −
×− −
+ = ×
+ = ×
Where 210 1 2 1Z yr Z Z
correlationfactorρ ρ
ρ= × + −
=
Advantages of Successive Ratios Method:
• Not limited to a predetermined set of interest rates and slopes • Don’t need large probability grids
Disadvantages of Successive Ratios Method:
• Can provide highly unlikely interest rates • This can be corrected by applying a maximum and a minimum
• May need to adjust the formulas if you expect rates to fluctuate within some moderate range
• Tends to produce more inverted yield curves than would normally be expected • Difference between 90-day and 10-year rates can grow unrealistically large

9. b)
( )
( )12
135 10021 31 100
2
Z−
= = −
( )
( )12
180 10022 61 100
2
Z−
= =
Given 0.8ρ = , Volatility Factor = 0.10 Need Z10yr:
( )( ) ( ) ( )210 3 0.8 6 1 0.8Z yr = − + − = 1.2
( ) ( ) ( )
( ) ( ) ( )
3 0.1090
1.2 0.1010
1 .03 2.22%
1 .06 6.76%
day
year
i t e
i t e
−−
−
+ = × =
+ = × =

10. United States
Dedicated Matching of Cash Flows • There are problems with cash flow matching
• Attempt is to try and match liability cash flows with identical asset cashflows
• Uncertainty of cash flows • Although annuitant options limited with payout annuities • Mortality is uncertain
• Too constraining • May have to accept inadequate yield to get matching asset
• Too expensive (from a yield perspective) • Has cost yield to match when match will be inexact in a few years
anyway • Undesirable
• May feel that current investment environment will change leaving matched portfolio in undesirable position
• Dynamic Financial analysis becoming popular Active Asset Liability Management
• Analyzes how company would fare under a range of scenarios • Leads to improved decision making
• Whether to reinsure • Can assets be allocated to reduce risk or enhance returns? • How much capital is required • Can new business be added without undue capital requirements • Helps management focus priorities • Better information sharing across functions • Compliance with GAAP or statutory has economic value • Firm could be insolvent from statutory standpoint although healthy
from ALM • Can risk be diversified?
• Determine interest rate sensitivities • Trade off between risk and return
• Increase Complexity • Lack of a Uniform Approach • Increased Cost to Run Program • Need to Consider Future Business
• Not enough to focus on current balance sheet • Effects of interest rate on same

10. United States
Selection of Data • Relying on data supplied by others • Complete comprehensive data often not available • Need to disclose known data limitations • Is data current? • Is data internally and externally consistent? • Known material limitations? • What would the cost be of obtaining more complete information? • Would it be available in a reasonable time?
Review of Data
• Data should be reviewed for accuracy • Should be consistent with prior reviews? • Should identify questionable values • Is data of sufficient quality for analysis? • Will data introduce a material bias • Need to disclose
• Actuary not required to audit the data, • or determine whether data supplied by others is misleading, • or develop additional data compilations • the accuracy and comprehensiveness are responsibility of those who
supply the data • Report on Disclosure / Communication
• Needs to disclose source of data • Was the data reviewed • Extent of reliance on data supplied by others • Any conflicts that arose from complying with any applicable law or
regulation SFAS 97 required If life contingent payment does not exceed 5-10% of present value payments, product is investment contract Since benefit Payment not conditional on annuitant’s survival = investment contract i/ premium considered deposit: Premium [PY0] = 10000; Premium[PY1 and PY2] = 0
Acquisition Expense [PY0] = 190; [PY1 and PY2] = 0 Annuity payment considered return of deposit: Policy Benefit [PY1] = 0 and
[PY2] = 10816
IRR/Discount Rate for net reserve = .510,816 1 4%
10,000⎛ ⎞ − =⎜ ⎟⎝ ⎠
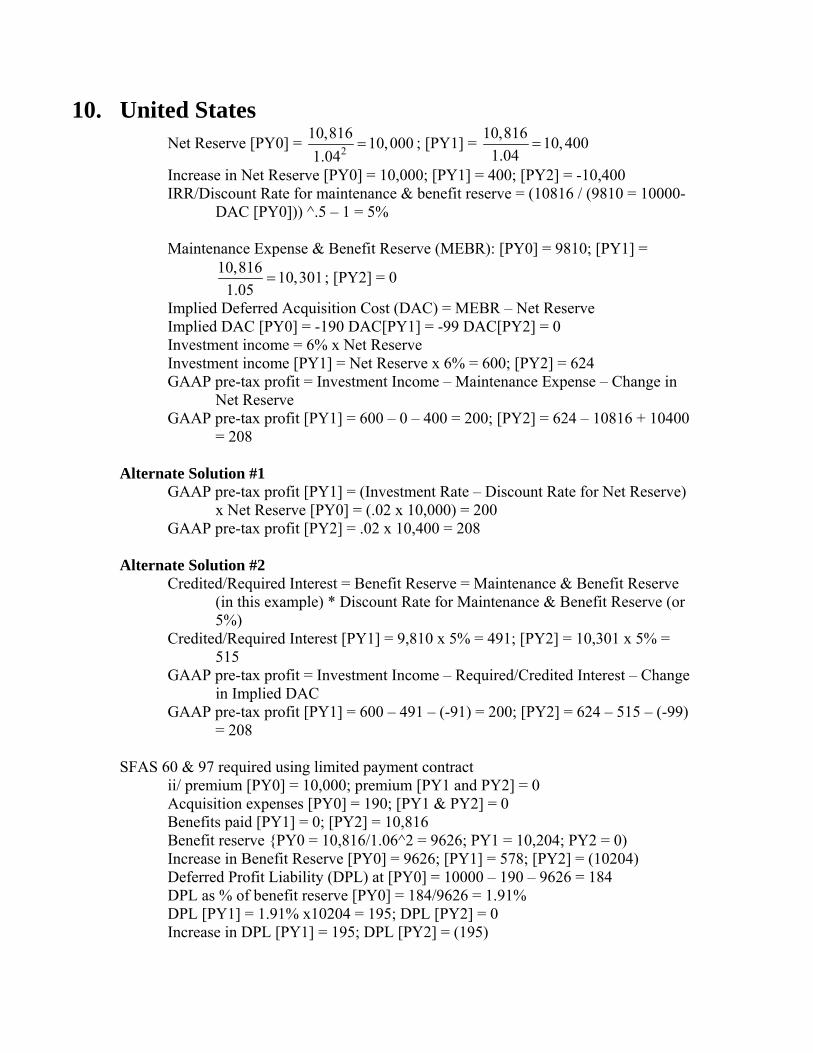
10. United States Net Reserve [PY0] = 2
10,816 10,0001.04
= ; [PY1] = 10,816 10,4001.04
=
Increase in Net Reserve [PY0] = 10,000; [PY1] = 400; [PY2] = -10,400 IRR/Discount Rate for maintenance & benefit reserve = (10816 / (9810 = 10000-
DAC [PY0])) ^.5 – 1 = 5% Maintenance Expense & Benefit Reserve (MEBR): [PY0] = 9810; [PY1] =
10,816 10,3011.05
= ; [PY2] = 0
Implied Deferred Acquisition Cost (DAC) = MEBR – Net Reserve Implied DAC [PY0] = -190 DAC[PY1] = -99 DAC[PY2] = 0 Investment income = 6% x Net Reserve Investment income [PY1] = Net Reserve x 6% = 600; [PY2] = 624 GAAP pre-tax profit = Investment Income – Maintenance Expense – Change in
Net Reserve GAAP pre-tax profit [PY1] = 600 – 0 – 400 = 200; [PY2] = 624 – 10816 + 10400
= 208 Alternate Solution #1
GAAP pre-tax profit [PY1] = (Investment Rate – Discount Rate for Net Reserve) x Net Reserve [PY0] = (.02 x 10,000) = 200
GAAP pre-tax profit [PY2] = .02 x 10,400 = 208 Alternate Solution #2
Credited/Required Interest = Benefit Reserve = Maintenance & Benefit Reserve (in this example) * Discount Rate for Maintenance & Benefit Reserve (or 5%)
Credited/Required Interest [PY1] = 9,810 x 5% = 491; [PY2] = 10,301 x 5% = 515
GAAP pre-tax profit = Investment Income – Required/Credited Interest – Change in Implied DAC
GAAP pre-tax profit [PY1] = 600 – 491 – (-91) = 200; [PY2] = 624 – 515 – (-99) = 208
SFAS 60 & 97 required using limited payment contract
ii/ premium [PY0] = 10,000; premium [PY1 and PY2] = 0 Acquisition expenses [PY0] = 190; [PY1 & PY2] = 0 Benefits paid [PY1] = 0; [PY2] = 10,816 Benefit reserve {PY0 = 10,816/1.06^2 = 9626; PY1 = 10,204; PY2 = 0) Increase in Benefit Reserve [PY0] = 9626; [PY1] = 578; [PY2] = (10204) Deferred Profit Liability (DPL) at [PY0] = 10000 – 190 – 9626 = 184 DPL as % of benefit reserve [PY0] = 184/9626 = 1.91% DPL [PY1] = 1.91% x10204 = 195; DPL [PY2] = 0 Increase in DPL [PY1] = 195; DPL [PY2] = (195)

10. United States Investment income = 6% x (Benefit Reserve + DPL) or 6% x (Premium – Acq.
Expenses) Inv. In. [PY1] = .06 x (9626 + 184) = 589; [PY2] = .06 x (10204 + 195) = 624 GAAP pretax profit = Premium + Inv Inc – Benefits paid – increase in Benefit
Reserve – increase in DPL – Acq. Exp. GAAP pretax profit [PY1] = 10000 + 589 – 0 – 10204 – 195 – 190 = 0; [PY2] = 0
+ 624 – 10816 – (-10204) – (-195) – 0 = 207

10. Canada Dedicated Matching of Cash Flows
• There are problems with cash flow matching • Attempt is to try and match liability cash flows with identical asset
cashflows • Uncertainty of cash flows
• Although annuitant options limited with payout annuities • Mortality is uncertain
• Too constraining • May have to accept inadequate yield to get matching asset
• Too expensive (from a yield perspective) • Has cost yield to match when match will be inexact in a few years
anyway • Undesirable
• May feel that current investment environment will change leaving matched portfolio in undesirable position
• Dynamic Financial analysis becoming popular Active Asset Liability Management
• Analyzes how company would fare under a range of scenarios • Leads to improved decision making
• Whether to reinsure • Can assets be allocated to reduce risk or enhance returns? • How much capital is required • Can new business be added without undue capital requirements • Helps management focus priorities • Better information sharing across functions • Compliance with GAAP or statutory has economic value • Firm could be insolvent from statutory standpoint although healthy
from ALM • Can risk be diversified?
• Determine interest rate sensitivities • Trade off between risk and return
• Increase Complexity • Lack of a Uniform Approach • Increased Cost to Run Program • Need to Consider Future Business
• Not enough to focus on current balance sheet • Effects of interest rate on same
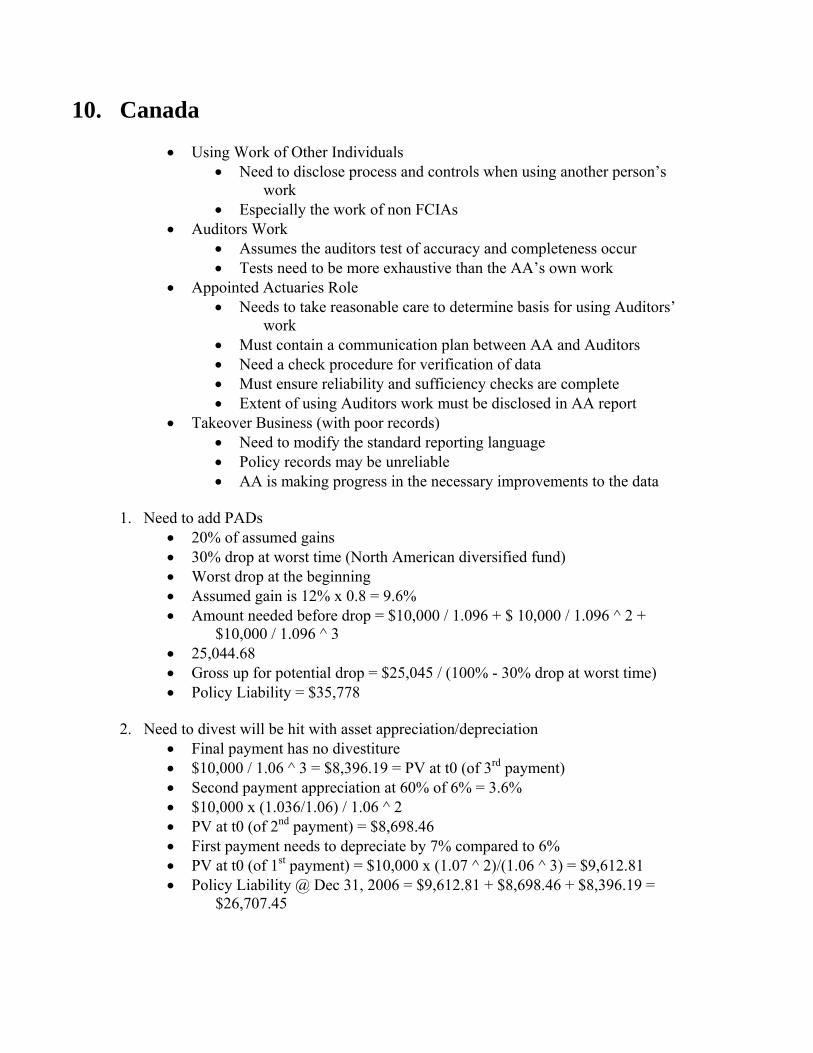
10. Canada
• Using Work of Other Individuals • Need to disclose process and controls when using another person’s
work • Especially the work of non FCIAs
• Auditors Work • Assumes the auditors test of accuracy and completeness occur • Tests need to be more exhaustive than the AA’s own work
• Appointed Actuaries Role • Needs to take reasonable care to determine basis for using Auditors’
work • Must contain a communication plan between AA and Auditors • Need a check procedure for verification of data • Must ensure reliability and sufficiency checks are complete • Extent of using Auditors work must be disclosed in AA report
• Takeover Business (with poor records) • Need to modify the standard reporting language • Policy records may be unreliable • AA is making progress in the necessary improvements to the data
1. Need to add PADs
• 20% of assumed gains • 30% drop at worst time (North American diversified fund) • Worst drop at the beginning • Assumed gain is 12% x 0.8 = 9.6% • Amount needed before drop = $10,000 / 1.096 + $ 10,000 / 1.096 ^ 2 +
$10,000 / 1.096 ^ 3 • 25,044.68 • Gross up for potential drop = $25,045 / (100% - 30% drop at worst time) • Policy Liability = $35,778
2. Need to divest will be hit with asset appreciation/depreciation
• Final payment has no divestiture • $10,000 / 1.06 ^ 3 = $8,396.19 = PV at t0 (of 3rd payment) • Second payment appreciation at 60% of 6% = 3.6% • $10,000 x (1.036/1.06) / 1.06 ^ 2 • PV at t0 (of 2nd payment) = $8,698.46 • First payment needs to depreciate by 7% compared to 6% • PV at t0 (of 1st payment) = $10,000 x (1.07 ^ 2)/(1.06 ^ 3) = $9,612.81 • Policy Liability @ Dec 31, 2006 = $9,612.81 + $8,698.46 + $8,396.19 =
$26,707.45

11. • Must meet the needs of its users • In the case of insurance, management needs relevant and timely information for
several purposes: • To assist in making economic decisions • To evaluate the financial condition and performance of the company • To compare financial results with pre-determined goals • To allow an appraisal of management performance
• Desirable characteristics of a financial measurement system to meet the needs above: • Measurement system should reflect the economic fundamentals which
underlie the company’s business • Results should be available by profit centers deemed critical by management • Results should readily communicable to and understandable by senior
management • Both Stat and GAAP systems were designed for external reporting purposes and are
constrained by rules and guidelines • These rules and guidelines often do not permit statutory or GAAP financial
measurement systems to measure on a timely basis the emerging experience or underlying profitability of a product
• Artificial discount rates may obscure the fact that liabilities are potentially exposed to interest rate risk
• Accounting measures can vary across product lines and countries • This makes it difficult to compare performance
• Statutory reporting: • Primary concern is solvency • Thus focus is on a liquidation basis, not a going concern basis • Statutory reserves are calculated using conservative methods and
assumptions which are prescribed by regulatory authorities • All expenses associated with new business are charged in the year of
issue • Certain types of assets are not admitted for statutory purposes because
of focus on liquidation value, even though these assets may have real value to the company
• These characteristics can cause several anomalous situations to occur in financial reporting • Increase in new business production may cause a decrease in current
year statutory earnings • Policy terminations by lapse or surrender often result in increased
statutory earnings due to reserve release; however • Substantial capital expenditures are charged against statutory earnings
and can not be capitalized. However these often provide positive long term effects for a company.

11. • U.S. GAAP reporting:
• GAAP financial reporting does not adapt on a timely basis to fluctuations in interest rates or lapse rates
• Some products introduced in the 70’s and 80’s did not fit into GAAP financial reporting; hence a different GAAP methodology was introduced
• GAAP is transaction based which is inconsistent with the way most companies price products
• Because of the lock in principle GAAP assumptions cannot be changed until a loss recognition situation has occurred
• Thus a company’s GAAP earnings could look good each year until the loss
recognition, at which point a large negative adjustment is made • GAAP accounting does not provide enough ‘early warning signs’ to
management • Both Stat and GAAP reporting can fail to measure risk capital and its associated costs
correctly • This can lead to an overstatement of profitability • Risk capital is defined as the smallest amount that can be invested to insure the value
of the firm’s net assets against a loss in accounting; balance sheets often differ based on which party bears the risk of insuring the asset • However the risk capital should depend only on the riskiness of the net assets,
not on the form of financing All numbers shown in millions below Calculate Frictional Capital Costs
Frictional Cost 1t = Risk Capital 0t x2% = 0.6 Frictional Cost 2t = Risk Capital 1t x 2% = 0.4
Calculate the Economic Liability
Net Cashflow 0t = Premiums 0t – Claims 0t – Expenses 0t – Frictional Cost 0t = 90 – 0 – 15 – 0 = 75
Net Cashflow 1t = Premiums 1t – Claims 1t – Expenses 1t – Frictional Cost 1t = 60 – 40 – 5 – 0.6 = 14.4
Net Cashflow 2t = Premiums 2t – Claims 2t – Expenses 2t – Frictional cost 2t = 0 – 90 – 5 – 0.4 = (95.4)
Economic Liab 1t = - Net Cashflow 2t / (1 + 2-yr Risk free rate) = - (95.4) / 1.05 = 90.86

11. Economic Liab 0t = - Net Cashflow 1t / (1 + 1-yr Risk free rate) + Econ Liab 1t /
(1 + 2-yr Risk free rate) = -14.4 / 1.045 + 90.86 / 1.05 = 72.75 Calculate the Investment Return
Inv Return 0t = 0 Inv Return 1t = PV 0t (Econ Liab 1t ) * 1-yr Risk free rate + PV 0t (Econ Liab
2t ) * 2-yr Risk free rate = 86.53 * 5% - (13.78) * 4.5% = 3.71 Inv Return 2t = PV 1t (Econ Liab 2t ) * 2-yr Risk free rate = 90.86 * 5% = 4.54
Calculate the change in Economic Liability
∆ Economic Liab 0t = 72.75 ∆ Economic Liab 1t = Econ Liab 1t – Econ Liab 0t = 90.86 – 72.75 = 18.11 ∆ Economic Liab 2t = Econ Liab 2t – Econ Liab 1t = 0 – 90.86 = (90.86)
Calculate the Economic Profit
Economic Profit 0t = Premium 0t + Inv Return 0t – Claims 0t – Expenses 0t - ∆ Economic Liab 0 = 90 + 0 – 0 – 15 – 72.75 – 0 = 2.25
Economic Profit 1t = Premium 1t + Inv Return 1t – Claims 1t – Expenses 1t - ∆ Economic Liab 1t = 60 + 3.71 – 40 – 5 – 18.11 – 0.6 = 0
Economic Profit 2t = Premium 2t + Inv Return 2t – Claims 2t – Expenses 2t - ∆ Economic Liab 2t = 0 + 4.54 – 90 – 5 – (90.86) – 0.4 = 0
Thus the company should invest in Investment A since its Economic Profit at time 0 is $2.25 which is greater than $2.
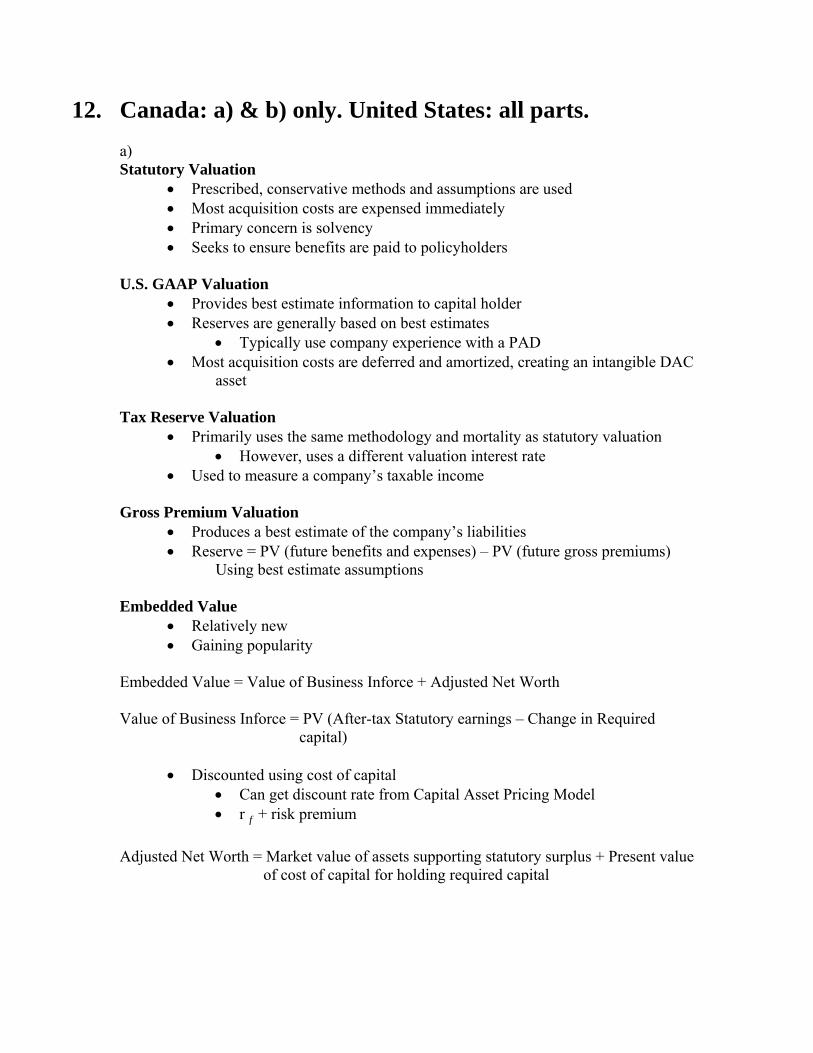
12. Canada: a) & b) only. United States: all parts. a) Statutory Valuation
• Prescribed, conservative methods and assumptions are used • Most acquisition costs are expensed immediately • Primary concern is solvency • Seeks to ensure benefits are paid to policyholders
U.S. GAAP Valuation
• Provides best estimate information to capital holder • Reserves are generally based on best estimates
• Typically use company experience with a PAD • Most acquisition costs are deferred and amortized, creating an intangible DAC
asset Tax Reserve Valuation
• Primarily uses the same methodology and mortality as statutory valuation • However, uses a different valuation interest rate
• Used to measure a company’s taxable income Gross Premium Valuation
• Produces a best estimate of the company’s liabilities • Reserve = PV (future benefits and expenses) – PV (future gross premiums)
Using best estimate assumptions Embedded Value
• Relatively new • Gaining popularity
Embedded Value = Value of Business Inforce + Adjusted Net Worth Value of Business Inforce = PV (After-tax Statutory earnings – Change in Required
capital)
• Discounted using cost of capital • Can get discount rate from Capital Asset Pricing Model • r f + risk premium
Adjusted Net Worth = Market value of assets supporting statutory surplus + Present value
of cost of capital for holding required capital

12. Canada: a) & b) only. United States: all parts. b)
i. Objective of International Accounting Standards is to create financial statements that are consistent.
ii. Objective of fair value accounting is to show the price at which an asset or liability could be exchanged in a current transaction between knowledgeable and willing parties.
c)
i. SFAS 109 created GAAP accounting standards related to:
1. Revenues, expenses, gains, or losses recognized in different time periods when comparing GAAP income to taxable income.
2. Other differences between GAAP income and taxable income 3. Carrybacks and carryforwards affecting taxable income
Basic principles for GAAP accounting of income taxes:
1. A tax liability or asset is recognized for taxes payable in the current period.
2. A deferred tax liability or asset is recognized for tax effects attributable to temporary differences and to loss or credit carryforwards.
3. The deferred tax liability or asset calculations should be based on current tax law • No change in tax law should be anticipated
4. If a future tax benefit is no longer expected to be realized, the deferred tax asset should be reduced.
ii. (1) (2) (1-2) Financial Statement
Carrying Amount Tax Basis Temporary Differences
GAAP DAC 450 450 Tax DAC 300 -300 Reserves -850 -600 -250
Net Temporary Differences = ( )Temporary Differences 100= −∑ Taxable Income = Current-year pretax income – Net Temporary Differences = 1,000 – (-100) = 1,100

12. Canada: a) & b) only. United States: all parts.
Current tax expense = (Taxable Income)(Tax Rate) = (1,100)(20%) = 220 Deferred Tax Liability: Based on the positive (taxable!) temporary difference
→ DTL = (GAAP DAC Temp. Diff.) (Tax Rate) = (450)(20%) = 90
Deferred Tax Asset: Based on the negative (deductible!) temporary differences:
→ DTA = (Tax DAC Temp. Diff. + Reserves Temp. Diff.)(Tax Rate) = (300 + 250)(20%) = 110
Then
Deferred Tax Asset 110 Valuation Allowance 0+ Deferred Tax Liability -90 Net Deferred Tax Asset = 20

13. United States a) For SFAS 97 products, DAC is amortized in proportion to EGP
( )( )
0
0
5002000deferred exp 1.06 49.43%EGP 5000
PVk
PV
+= = =
( ) ( )1 defer exp 1t t tDAC DAC i k EGP−= + × + − ×
( )1 0 2000 1.06 49.43% 10001625.66
DAC = + × − ×
=
( )2 1625.66 500 1.06 49.43% 9001808.33
DAC = + × − ×
=
( )3 1808.33 0 1.06 49.43% 8001521.39
DAC = + × − ×
=
b) Shadow DAC is the difference of DAC caused by unrealized gain
( )( )
0
0
5002000deferred exp 1.06 48.7%EGP 5000 75
PVk
PV
+′ = = =
′ +
( )1 0 2000 1.06 48.7% 1000 1633DAC′ = + × − × =
( )2 1633 500 1.06 48.7% 900 1822.68DAC′ = + × − × =
( ) ( )3 1822.68 0 1.06 48.7% 800 100 1493.74DAC′ = + × − × + = Shadow DAC adjustment 3 3DAC DAC′= −
1493.74 1521.39
27.65= −= −

13. Canada a)
• Internal Company Data • Get mortality data from a similar block of business or number of
blocks • Industry-wide Data
• Mortality tables published by government • Published tables by SOA/CIA • Care should be taken when using data from other countries
• Other Sources • Can look at medical data, from other health organizations • Population studies
b)
• Look at data on company ledger • Verify with systems personnel that values are recorded correctly • Check for reasonableness • Compare totals & Actual to Expected Ratios from one period to the next • Check with totals from other files, claims, and admin personnel • Look for trends • Look for any specific differences that might be affecting this new product • Look at underwriting data
c)
• Adjust for any trends in the data • Adjust for any information available now that was not 5 years ago • Consider credibility and amount of deaths. Need to apply credibility if you
don’t have sufficient data. • Is the data split by sex, smoking, even band – small versus large face amount.
Do we have separate tables for tested versus untested business. Does the data include joint lives, AIDS?
d)
• Limited Fluctuation Credibility Theory • Greatest Accuracy Credibility Theory
e)
Selective lapsation – refers to the fact that a policyholder may lapse the policy due to better rates elsewhere in the market. These lives are usually healthy and can get underwritten again. This leaves, however, less healthy lives in the block. i.e. those who believe they can’t get better rates are usually less healthy. Therefore selective lapsation leads to deterioration of remaining mortality in the bock.

13. Canada
Selective lapsation depends on level of renewal premium increases, competitor prices, sex, smoking, policy size and other factors. Mortality assumption should be adjusted for selective lapsation – especially for Term Renewable Business.

14. United States a) To determine contract segments, calculate the columns R(t) premium and R(t) mortality.
R(t) premium is GP(t)/GP(t-1)
R(1) prem = 1.0 R(2) prem = GP(2)/GP(1) = 3/3 = 1.000 R(3) prem = GP(3)/GP(2) = 3/3 = 1.000 R(4) prem = GP(4)/GP(3) = 5/3 = 1.6667 R(5) prem = GP(5)/GP(4) = 5/5 = 1.0 R(6) prem = GP(6)/GP(5) = 7/5 = 1.4000
R(t) mortality is q(t)/q(t-1)
R(1) mort = 1.0 R(2) mort = q(2)/q(1) = 4.4/4 = 1.100 R(3) mort = q(3)/q(2) = 4.84/4.4 = 1.100 R(4) mort = q(4)/q(3) = 5.32/4.84 = 1.100 R(5) mort = q(5)/q(4) = 5.86/5.32 = 1.100 R(6) mort = q(6)/q(5) = 6.44/5.86 = 1.100
A new contract segment starts where the slope of premium jumps relative to the slope of mortality, i.e. R(t) prem exceeds R(t) mort.
There are 3 contract segments
The first segment begins in pol yr 1 and ends in pol yr 3. The second begins in PY 4 and ends PY 5. The last begins and ends PY6.
Basic Reserve = max (unitary res, segment res) Death Benefit Calculation – DB(t) = p(t-1)*q(t)
DB(1) = p(0)*q(1) = 1.0*0.004 = 0.004 DB(2) = p(1)*q(2) = 0.9960*0.0044 = 0.0044 DB(3) = p(2)*q(3) = 0.9916*0.00484=0.0048 DB(4) = p(3)*q(4) = 0.9868*0.005324 = 0.0053 DB(5) = p(4)*q(5) = 0.9816*0.005856 = 0.0057 DB(6) = p(5)*q(6) = 0.9758*0.006442 = 0.0063
PVDB = DB because discount rate is 0
Segment PVDB = sum of PVDB for the years included in the segment Segment 1 PVDB = PVDB(1) + PVDB(2) + PVDB(3) = .0040 + .0044 + .0048 =
0.01318 Segment 2 PVDB = PVDB(4) + PVDB(5) = .0053 + .0057 = 0.01115 Segment 3 PVDB = PVDB(6) = 0.00644 Unitary PVDB = Sum(PVDB1 to PVDB6) = 0.0305

14. United States
Gross premium ratio = segment next year gross premium/segment first year gross premium except in year 1 when you have segment first year gross premium/segment first year gross premium
Segment 1: Gross premium (1) = 3/3 = 1 Segment 1: Gross premium (2) = 3/3 = 1 Segment 1: Gross premium (3) = 3/3 = 1 Segment 2: Gross premium (4) = 5/5 = 1 Segment 2: Gross premium (5) = 5/5 = 1 Segment 3: Gross premium (6) = 7/7 = 1 Unitary: Gross premium (1) = 3/3 = 1 Unitary: Gross premium (2) = 3/3 = 1 Unitary: Gross premium (3) = 3/3 = 1 Unitary: Gross premium (4) = 5/3 = 1.67 Unitary: Gross premium (5) = 5/3 = 1.67 Unitary: Gross premium (6) = 7/3 = 2.33
PV of a one dollar per year annuity for each segment (or unitary) = Segment PVAnn = sum of (PV of p(t-1) times gross premium ratio for each year of segment) divided by p(t-1) for 1st year of segment
For first segment and unitary, expense allowed, can use modified net premium Assume expense allowance not used (not enough information provided to calculate EA)
Segment 1 PVAnn = (1.000*1 + 0.9960*1 + 0.9916*1)/1.000 = 2.9876 Segment 2 PVAnn = (0.9868*1 + 0.9816*1)/0.9866 = 1.9947 Segment 3 PVAnn = (0.9758*1)/0.9758 = 1.000 Unitary: PVAnn = 1 + 0.996*1 + 0.9916*1 + 0.9868*1.67 + 0.9816*1.67 +
0.9758*2.33 = 8.5484
Net Prem for a segment (or unitary) is PV benefits for the segment divided by PV of a one dollar per year annuity
Segment 1 Net Premium = Segment 1 PVDB/Segment 1 PVAnn = .01318/2.9876
= .004412 Segment 2 Net Premium = Segment 2 PVDB/Segment 2 PVAnn = .01115/1.9947
= .005589 Segment 3 Net Premium = Segment 3 PVDB/Segment 3 PVAnn = .00644/1 =
.00644 Unitary Net Prem = Unitary PVDB / Unitary PVAnn = 0.003568
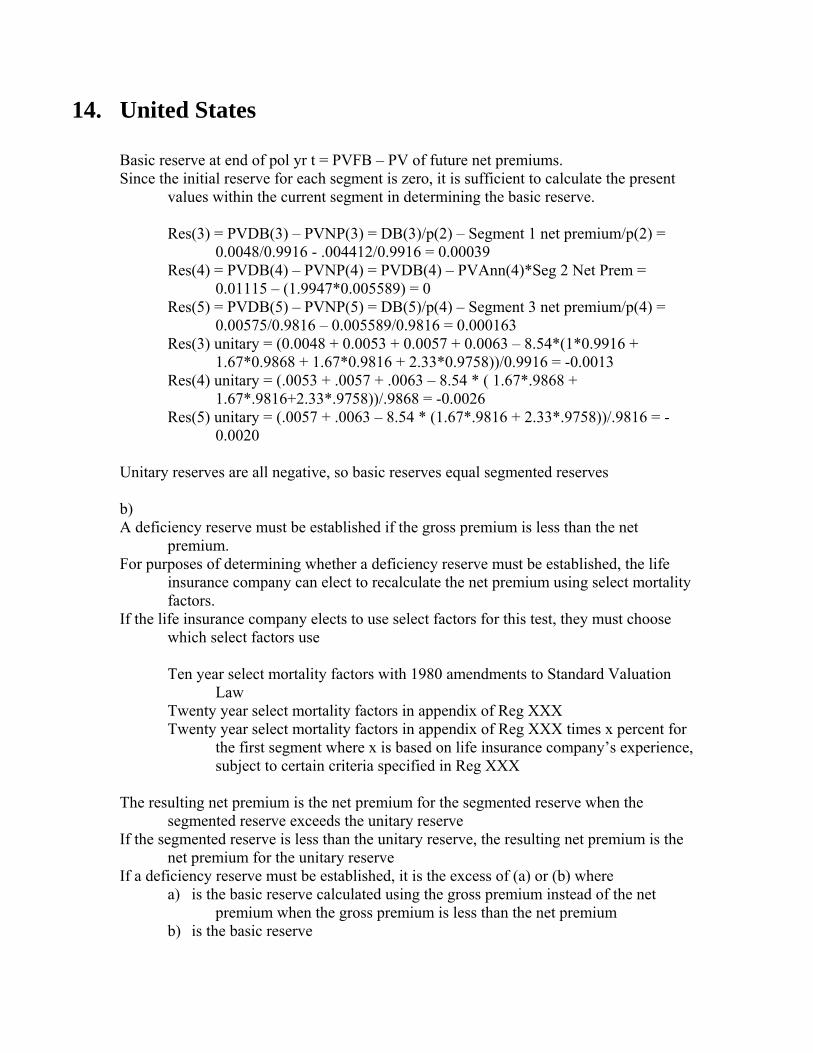
14. United States
Basic reserve at end of pol yr t = PVFB – PV of future net premiums. Since the initial reserve for each segment is zero, it is sufficient to calculate the present
values within the current segment in determining the basic reserve.
Res(3) = PVDB(3) – PVNP(3) = DB(3)/p(2) – Segment 1 net premium/p(2) = 0.0048/0.9916 - .004412/0.9916 = 0.00039
Res(4) = PVDB(4) – PVNP(4) = PVDB(4) – PVAnn(4)*Seg 2 Net Prem = 0.01115 – (1.9947*0.005589) = 0
Res(5) = PVDB(5) – PVNP(5) = DB(5)/p(4) – Segment 3 net premium/p(4) = 0.00575/0.9816 – 0.005589/0.9816 = 0.000163
Res(3) unitary = (0.0048 + 0.0053 + 0.0057 + 0.0063 – 8.54*(1*0.9916 + 1.67*0.9868 + 1.67*0.9816 + 2.33*0.9758))/0.9916 = -0.0013
Res(4) unitary = (.0053 + .0057 + .0063 – 8.54 * ( 1.67*.9868 + 1.67*.9816+2.33*.9758))/.9868 = -0.0026
Res(5) unitary = (.0057 + .0063 – 8.54 * (1.67*.9816 + 2.33*.9758))/.9816 = -0.0020
Unitary reserves are all negative, so basic reserves equal segmented reserves b) A deficiency reserve must be established if the gross premium is less than the net
premium. For purposes of determining whether a deficiency reserve must be established, the life
insurance company can elect to recalculate the net premium using select mortality factors.
If the life insurance company elects to use select factors for this test, they must choose which select factors use
Ten year select mortality factors with 1980 amendments to Standard Valuation
Law Twenty year select mortality factors in appendix of Reg XXX Twenty year select mortality factors in appendix of Reg XXX times x percent for
the first segment where x is based on life insurance company’s experience, subject to certain criteria specified in Reg XXX
The resulting net premium is the net premium for the segmented reserve when the
segmented reserve exceeds the unitary reserve If the segmented reserve is less than the unitary reserve, the resulting net premium is the
net premium for the unitary reserve If a deficiency reserve must be established, it is the excess of (a) or (b) where
a) is the basic reserve calculated using the gross premium instead of the net premium when the gross premium is less than the net premium
b) is the basic reserve

14. Canada • Value the actuarial and other policy liabilities • Opine that the policy liabilities are valued in accordance with accepted actuarial
practice • Select appropriate assumptions and methods • Make and file an Appointed Actuary’s Report • State whether the annual statement presents fairly the results of the valuation • Meet with and report to the directors or chief agent on the company’s financial
position • Report on the company’s expected future financial condition; DCAT • Report in writing to CEO and CFO any matters that have material adverse effects on
the financial condition of the company and that require rectification • Where suitable action is not being taken to rectify, report to Superintendent and
advise directors • Communication with insurer’s auditor is desirable when the actuary makes a report to
management on a matter requiring rectification • Report to directors in writing on the fairness to par policyholders of a proposed
dividend and whether it is in accordance with the dividend policy • Opine on whether the method selected for allocating investment income and expenses
to the par account is fair and equitable to the par policyholders • Report to directors whether payment to shareholders from the profits of the par
account would materially affect the company’s ability to maintain the level of dividends paid
• Report in writing on whether the changes that the company made in respect of its adjustable policies during the preceding 12 months are fair to the adjustable policyholders
• Confirm that the instructions pertaining to the MCCSR/TAAM guidelines and the annual return have been followed
• Exercise due diligence in ensuring that the principles underlying the MCCSR calculation have been respected
• May not be the CEO or COO of a company, unless authorized by Superintendent • May not be the CFO of a company, unless authorized by Superintendent • Perform a source of earnings analysis • ALM review • Par governance • Business analysis on mergers and acquisitions

14. Canada
• Spot checks or tests of calculations • Time-consuming so careful judgment must be exercised • Systematic sampling is generally superior in validity to a random sample • Tests of inventory to assure no major omissions or duplications • Check the policy or contract language • Transactional checks • Policy traces • Independent full recomputations • Tests of aggregate progress of reserve from one fiscal period to another • Analysis of increase in reserve checks • Check of increase in life reserve per 1000 over time • Tests of relationships of reserve items to other financial items • Tests of reserve adequacy • Loss ratio tests • Claim runoff tests on disabled life reserves • Errors of principle are more important than clerical errors or typographical errors
• The credibility of the company’s experience and studies is too low to be the main source of data
• Future experience is difficult to estimate • Untested refinements in underwriting criteria have been recently introduced • There is a new type of benefit or a new way of distributing the products • The cohort of risks lacks homogeneity • Unrefined derivation of the best estimate assumption • Approximations are made to establish joint ages using either an ESLA or a joint
equivalent age • Not all the necessary information is available to determine mortality rates • There have been recent changes in underwriting standards or methods of
classification • Antiselection is present from explicit or implicit reentry options for healthy lives or
from underwriting criteria • Unfavorable medical developments • The persistency rate of the product is low • The insurer has been slow to protect itself against changes which adversely affect it • Antiselection on certain options and benefits affects the mortality of certain specific
plans • A policy of internal replacement is favorable to rotation of the old business and its
impact is not supported by credible experience • The premium structure does not recognize mortality differentials as precisely as the
rest of the market, creating incentive for antiselection • Antiselection by the sales force

14. Canada
• Margin is too low • Should be at least the average of the low margin and the high margin • Low margin is 3.75 and high margin is 15 per thousand, divided by curtate life
expectancy • The cohort of risks lack homogeneity • Includes a block of policies issued with preferred underwriting • Margin should negate the trend in mortality improvement
• Policy liabilities should be calculated using CALM • Amount of policy liabilities for a particular scenario is equal to the amount of
supporting assets • Test the seven prescribed scenarios • Policy liabilities must not be less than the most adverse prescribed scenario • Scenarios of interest rate assumptions should comprise a base scenario which
assumes continuance of reinvestment and inflation rates • For each prescribed scenario, reinvestment strategy for debt instruments by type and
term at the balance sheet date is the distribution which the insurer is then purchasing
• At and after the 20th anniversary of the balance sheet date is default-free coupon bonds with a term of 15 years or less
• Between those dates is according to a uniform transition from the balance sheet date distribution to default-free coupon bonds • Scenario 1: interest rates for investments purchased at and after the 20th
anniversary of the balance sheet date are uniformly 5% • Scenario 2: same as scenario 1 but with 12% instead of 5% • Scenario 3: long-term default-free interest rate changes uniformly over three
years to 60% of the corresponding long-term interest rate • Scenario 4: same as scenario 3 except that the first irregular cycle reaches 5%
rather than 12% • Scenario 5: same as scenario 3 except the short-term rate is a percentage of the
long-term rate • Scenario 5: percentage moves cyclically in 20% annual steps from 40% to
120% and back • Scenario 6: same as scenario 4 for long-term rates • Scenario 6: same as scenario 5 for short-term rates, except the first cycle
reaches 40% rather than 120% • Scenario 7: default-free interest rates after the balance sheet date are the
forward interest rates implied by an equilibrium market yield curve

14. Canada
• CLIFR recommends using a lower bound rate of 3% for short-term and 5% for long-term reinvestments in scenario 1
• CLIFR recommends using a higher bound rate of 10% for short-term and 12% for long-term reinvestments in scenario 2
• CLIFR suggest testing an additional scenario which modifies scenario 1 • Modify scenario 1 with a drop in default-free interest rates to 75% of current rates
over the first year followed by a linear increase back into the ultimate 3% short-term rate
• Regarding scenario 7, it is acceptable to retain the default-free yield curve up to the point where the spot rate is at its peak
15. • Integration of the financial services sector • Deregulation and economic forces have led to breakdown of firewalls that separated
financial intermediaries • Wave of financial services sector consolidation • Creation of large multinational financial conglomerates offering all types of financial
services • Elimination of safe haven previously enjoyed by life insurers • Wave of demutualizations • Demutualizations often accompanied by securitization of blocks of business • Elimination of safe haven for stock companies – focus on capital structure to
maximize value for shareholders • Shift in types of products offered by insurers and competitors • De-emphasis of traditional contracts motivated insurers to consider securitizing older
blocks to capture embedded economic value • Sales growth in newer life and annuity products placed capital strain on insurers
because of accounting requirements • Mark to market accounting will place pressure on insurers to rationalize their use of
capital • Securitization may provide info to calibrate models for valuing non securitized blocks
of business • Insurance and solvency regs will continue to provide situations where insurers can
gain through securitization Limitations
• Investors don’t have the option to invest in particular cash flow streams originated by the insurer as in the case
• Insurance and annuity contracts held on balance sheet tend to be opaque to the market • Difficult for equity holders to evaluate the firm • Potentially raises cost of capital
• Not clear that the most efficient way to provide financial products is through a risk warehouse primarily financed with equity capital
• Risk warehouses subject to high agency costs Benefits
• Protects private information on clients, products, and markets developed by insurers
i. Block of business securitization • Writing new business creates liquidity strain for insurer • Reduce leverage • Obtain immediate access to profits expected to emerge from block of
policies • Obtain relief from regulatory and accounting rules

15. ii. Risk transfer securitization
• Mortality risk bond or special purpose vehicle structure covers the insurer for higher than expected mortality
• Securitization only affects mortality risk, not other risks affecting
profitability of business iii. Reserve funding securitization
• Redundant reserves create capital strain • Insurer wants to reduce leverage to finance new business or reduce
cost of capital • Other methods of risk mitigation too expensive (eg. Offshore
reinsurance backed by letters of credit)

16. Preferred Shares (Tier 1) Subordination
• Must be subordinated to policyholders and unsecured creditors or the company
Permanence
• The following features are not permitted: • Retraction by the holder • Obligation for the issuer to redeem shares • Redemption within the first 5 years of issuance • Any step-up representing a pre-set increase at a future date in the
dividend (or distribution rate) • Any conversion, other than to common shares of the issuer, or redemption is
subject to supervisory approval and: • Redemption can only be for the cash value or equivalent • Conversion privileges cannot be structured to effectively provide
either a redemption or of return on the original investment • Permanence is impaired when there are features that create an incentive to
redeem Free of Mandatory Fixed Charges
• Preferred shares included in tier 1 capital are not permitted to offer the following features: • Cumulative dividends • Dividends influenced by the credit standing of the institution • Compensation to preferred shareholders other than a dividend • Sinking or purchase funds
• The non-declaration of a dividend shall not trigger restrictions on the issuer
other than the need to seek approval of the holders of the preferred shares before paying dividends on other shares or before retiring other shares
• Acceptable Features
• Simple call feature • Dividends linked to an index not related to the financial condition of
the borrower • Dividends that are fixed for a period of years and then float over an
index (not related to condition of borrower) • Conversion to common shares where minimum conversion value or basis is
established at issue

16. • Features that are not acceptable
• Exploding rate preferred shares • Auction rate preferred share, or other dividend reset mechanism based
on issuer’s credit rating or condition • Dividend reset mechanism with no cap, consistent with institution’s
credit quality at issue Innovative Instruments (Tier 1) Principle #1: OSFI expects FRFI’s to met capital requirements without undue reliance on
innovative instruments
• Innovative instruments must not exceed 15% or tier 1 capital at time of issuance
• Excess cannot be included in regulatory capital • Must provide plan to eliminate excess after insurance • Strongly capitalized FRFI should not have innovative instruments &
cumulative preferred shares exceeding 25% of tier 1 capital in aggregate Principle #2: The nature of inter-company instruments issued by the FRFI in connection
with the raising of Tier 1 capital by way of innovative instruments must not compromise the Tier 1 qualities of the innovative instrument
• Inter-company instruments must be permanent • Failure to make payments or meet covenants must not be cause acceleration of
repayment • Inter-company instrument must not be secured or prioritized ahead of claims
of policyholders/depositors Principle #3: Innovative Instruments must allow FRFI’s to absorb losses within the
FRFI’s on an ongoing basis Principle #4: Innovative Instruments must absorb losses in liquidation Principle #5: Innovative Instruments must not contain any feature that may impair the
permanence of the instrument
• No more than one rate step-up over the life of the instrument