pollution prevention and waste management - epa.gov · pollution prevention and waste management...
TRANSCRIPT
TRI National Analysis 2016 www.epa.gov/trinationalanalysis/ January 2018
1
Pollution Prevention and Waste Management
Each year, the Toxics Release Inventory (TRI) collects information from more than 20,000
facilities on the quantities of TRI-listed chemicals they recycle, combust for energy recovery,
treat for destruction, and dispose of or otherwise release both on- and off-site. These
quantities, in aggregate, are collectively referred to as the quantity of production-related
waste managed.
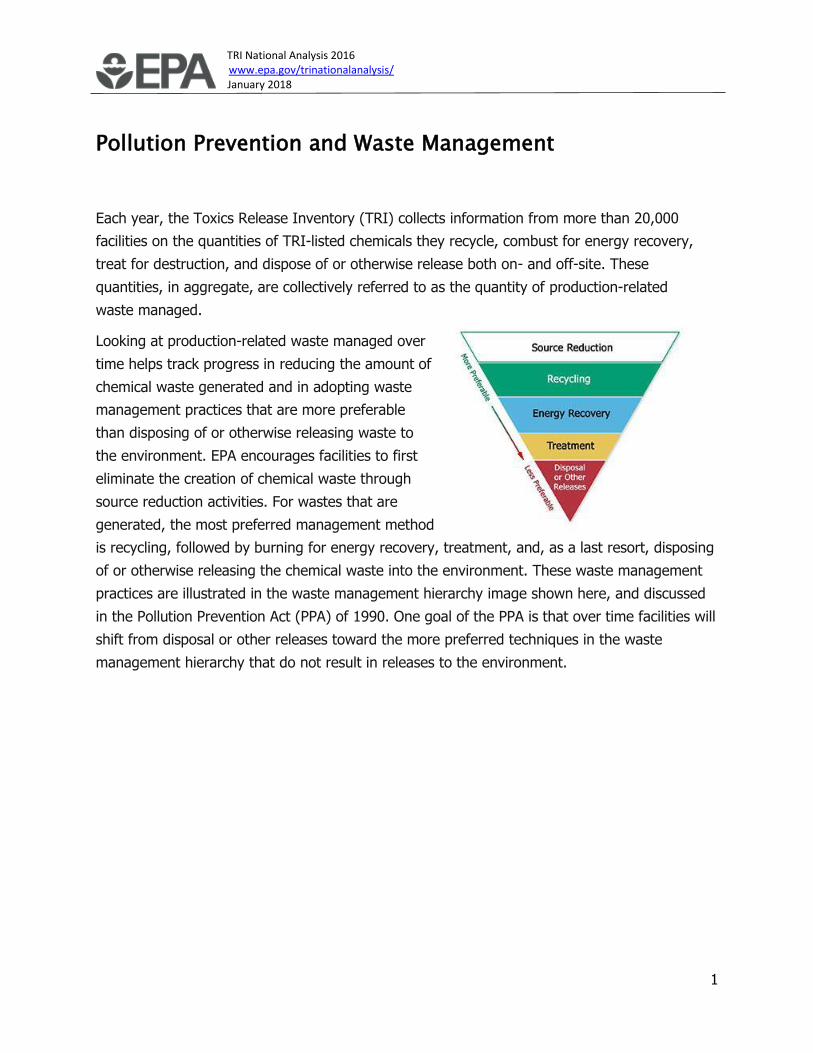
Looking at production-related waste managed over
time helps track progress in reducing the amount of
chemical waste generated and in adopting waste
management practices that are more preferable
than disposing of or otherwise releasing waste to
the environment. EPA encourages facilities to first
eliminate the creation of chemical waste through
source reduction activities. For wastes that are
generated, the most preferred management method
is recycling, followed by burning for energy recovery, treatment, and, as a last resort, disposing
of or otherwise releasing the chemical waste into the environment. These waste management
practices are illustrated in the waste management hierarchy image shown here, and discussed
in the Pollution Prevention Act (PPA) of 1990. One goal of the PPA is that over time facilities will
shift from disposal or other releases toward the more preferred techniques in the waste
management hierarchy that do not result in releases to the environment.
TRI National Analysis 2016 www.epa.gov/trinationalanalysis/ January 2018
2
Source Reduction Activities Reported
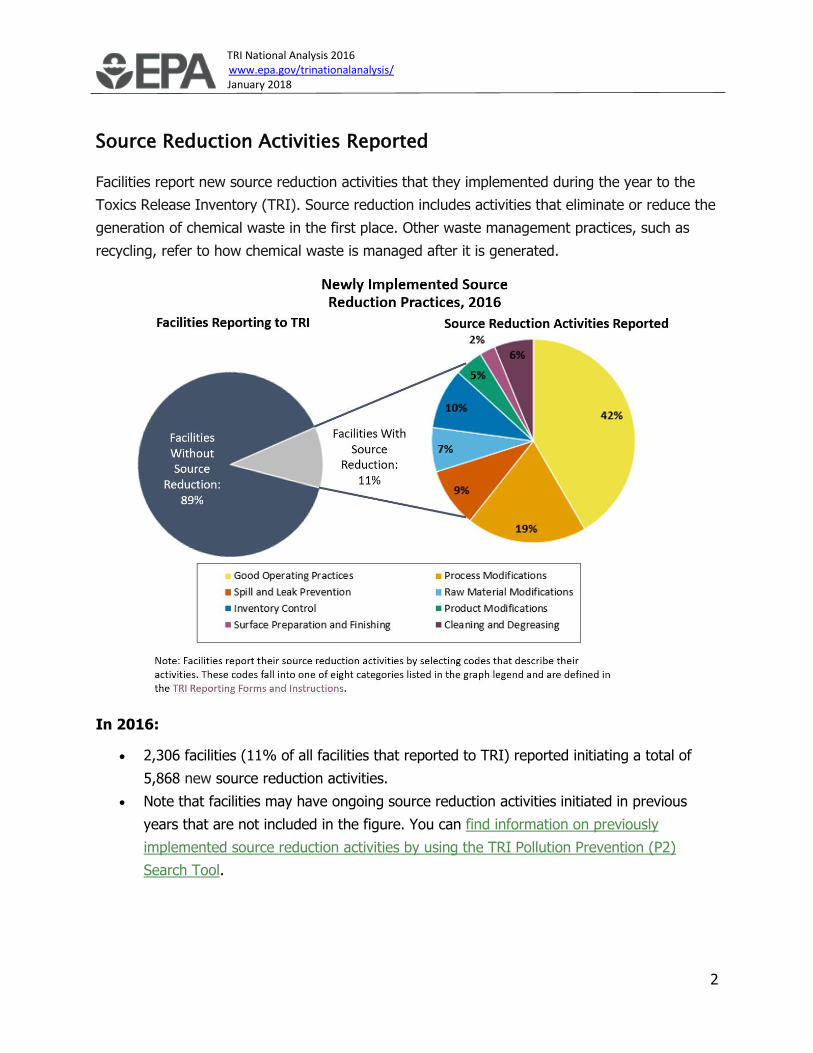
Facilities report new source reduction activities that they implemented during the year to the
Toxics Release Inventory (TRI). Source reduction includes activities that eliminate or reduce the
generation of chemical waste in the first place. Other waste management practices, such as
recycling, refer to how chemical waste is managed after it is generated.
In 2016:
• 2,306 facilities (11% of all facilities that reported to TRI) reported initiating a total of
5,868 new source reduction activities.
• Note that facilities may have ongoing source reduction activities initiated in previous
years that are not included in the figure. You can find information on previously
implemented source reduction activities by using the TRI Pollution Prevention (P2)
Search Tool.
TRI National Analysis 2016 www.epa.gov/trinationalanalysis/ January 2018
3
Anticipated Benefits of Source Reduction
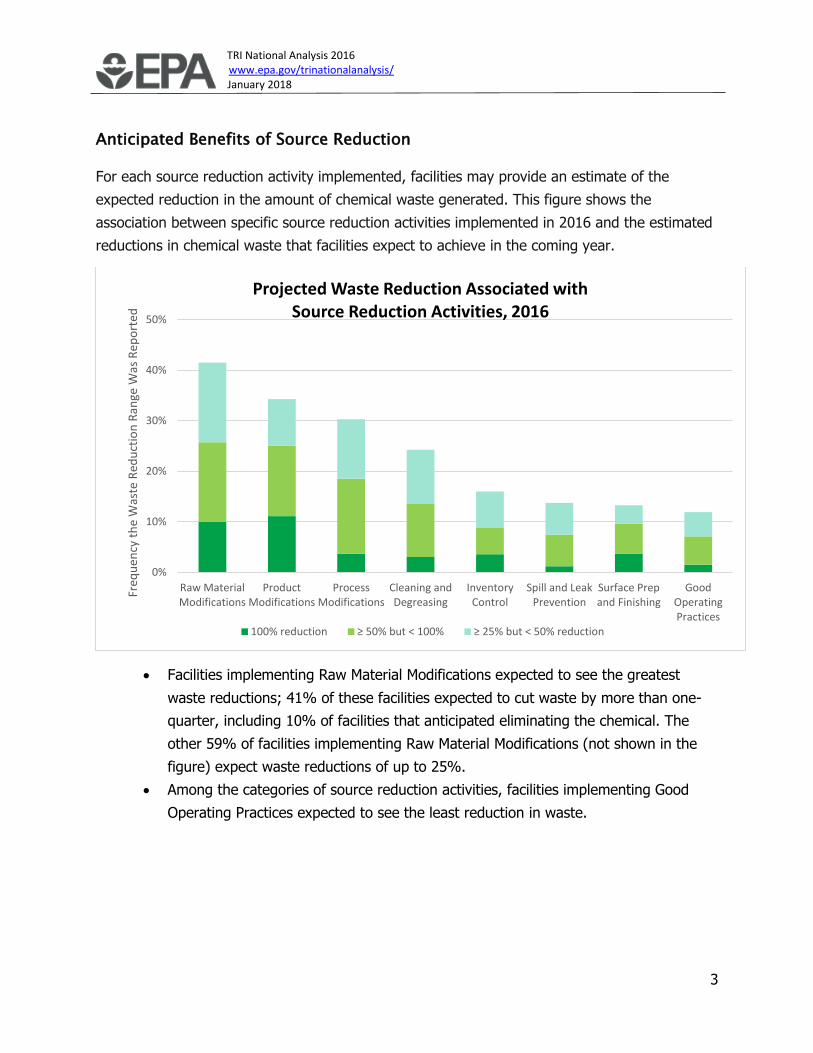
For each source reduction activity implemented, facilities may provide an estimate of the
expected reduction in the amount of chemical waste generated. This figure shows the
association between specific source reduction activities implemented in 2016 and the estimated
reductions in chemical waste that facilities expect to achieve in the coming year.
• Facilities implementing Raw Material Modifications expected to see the greatest
waste reductions; 41% of these facilities expected to cut waste by more than one-
quarter, including 10% of facilities that anticipated eliminating the chemical. The
other 59% of facilities implementing Raw Material Modifications (not shown in the
figure) expect waste reductions of up to 25%.
• Among the categories of source reduction activities, facilities implementing Good
Operating Practices expected to see the least reduction in waste.
0%
10%
20%
30%
40%
50%
Raw MaterialModifications
ProductModifications
ProcessModifications
Cleaning andDegreasing
InventoryControl
Spill and LeakPrevention
Surface Prepand Finishing
GoodOperatingPractices
Freq
uen
cy t
he
Was
te R
edu
ctio
n R
ange
Was
Rep
ort
ed
Projected Waste Reduction Associated with Source Reduction Activities, 2016
100% reduction ≥ 50% but < 100% ≥ 25% but < 50% reduction
TRI National Analysis 2016 www.epa.gov/trinationalanalysis/ January 2018
4
Is Source Reduction Effective?
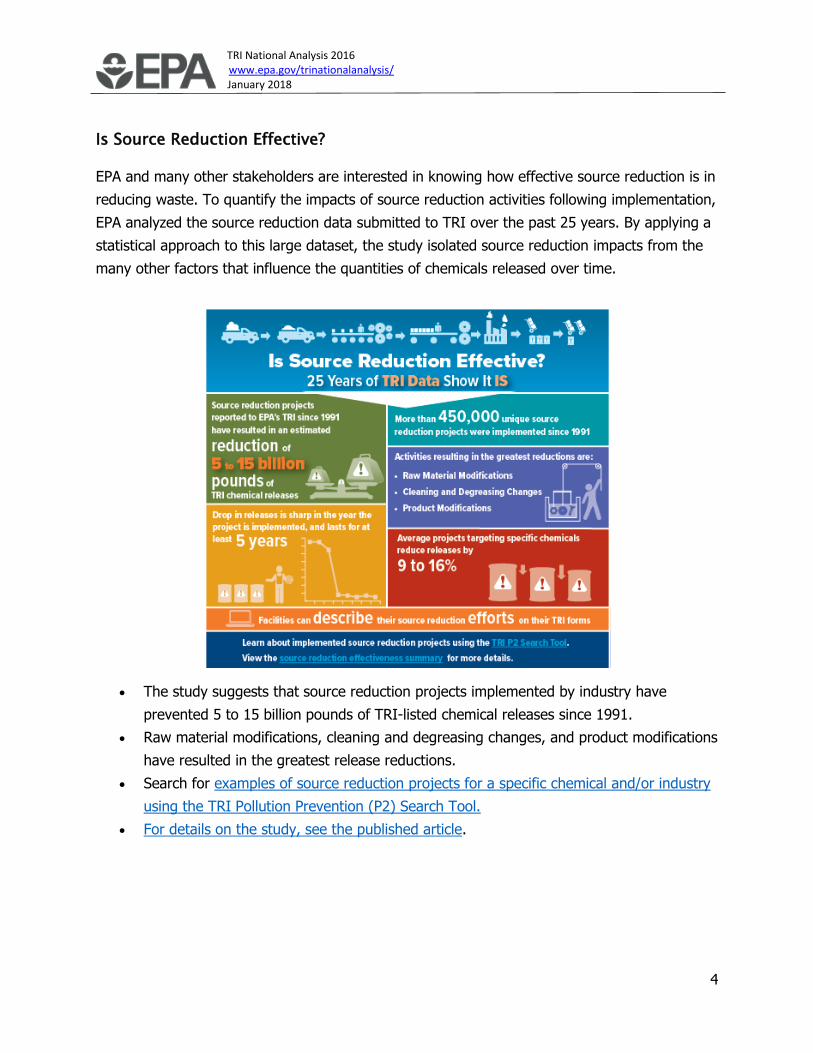
EPA and many other stakeholders are interested in knowing how effective source reduction is in
reducing waste. To quantify the impacts of source reduction activities following implementation,
EPA analyzed the source reduction data submitted to TRI over the past 25 years. By applying a
statistical approach to this large dataset, the study isolated source reduction impacts from the
many other factors that influence the quantities of chemicals released over time.
• The study suggests that source reduction projects implemented by industry have
prevented 5 to 15 billion pounds of TRI-listed chemical releases since 1991.
• Raw material modifications, cleaning and degreasing changes, and product modifications
have resulted in the greatest release reductions.
• Search for examples of source reduction projects for a specific chemical and/or industry
using the TRI Pollution Prevention (P2) Search Tool.
• For details on the study, see the published article.
TRI National Analysis 2016 www.epa.gov/trinationalanalysis/ January 2018
5
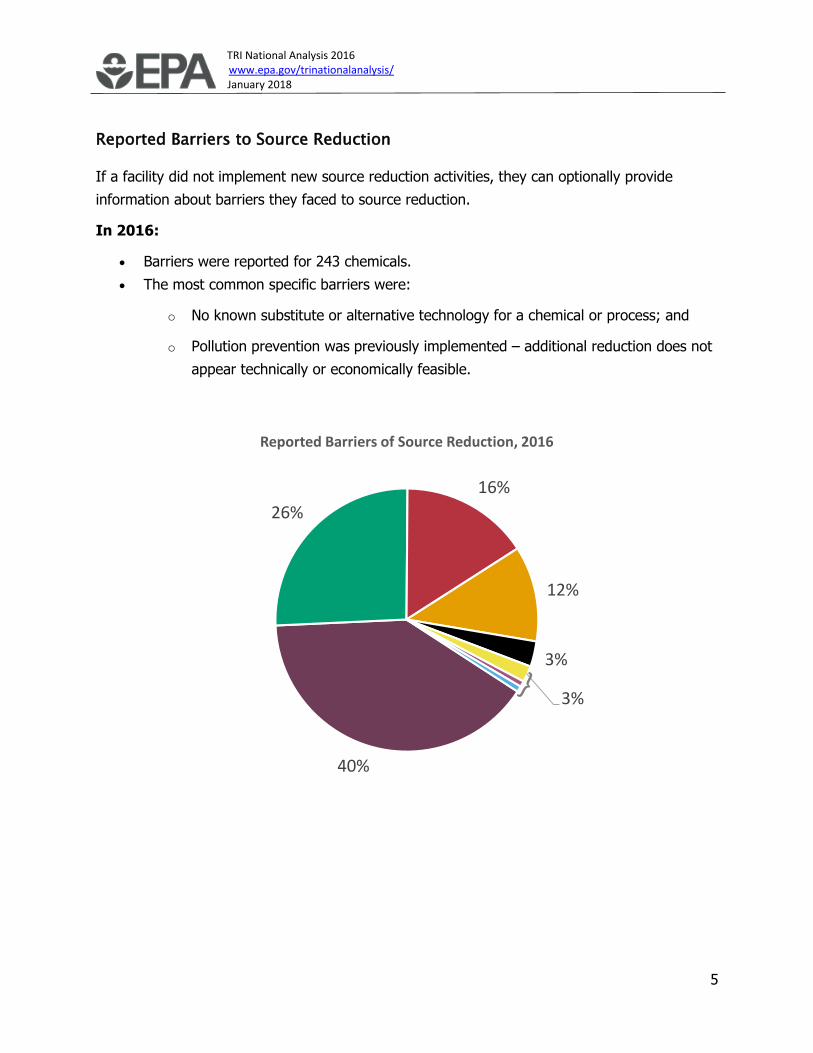
Reported Barriers to Source Reduction
If a facility did not implement new source reduction activities, they can optionally provide
information about barriers they faced to source reduction.
In 2016:
• Barriers were reported for 243 chemicals.
• The most common specific barriers were:
o No known substitute or alternative technology for a chemical or process; and
o Pollution prevention was previously implemented – additional reduction does not
appear technically or economically feasible.
40%
26%
16%
12%
3%
3%
Reported Barriers of Source Reduction, 2016
TRI National Analysis 2016 www.epa.gov/trinationalanalysis/ January 2018
6
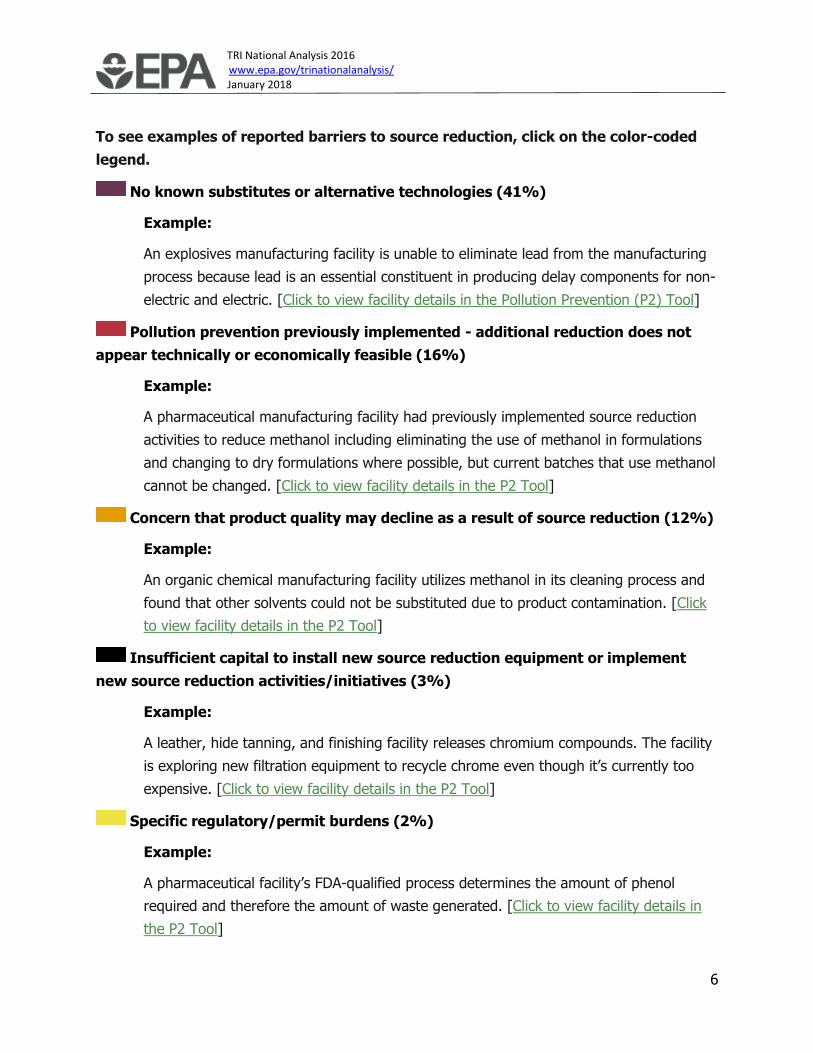
To see examples of reported barriers to source reduction, click on the color-coded
legend.
No known substitutes or alternative technologies (41%)
Example:
An explosives manufacturing facility is unable to eliminate lead from the manufacturing
process because lead is an essential constituent in producing delay components for non-
electric and electric. [Click to view facility details in the Pollution Prevention (P2) Tool]
Pollution prevention previously implemented - additional reduction does not
appear technically or economically feasible (16%)
Example:
A pharmaceutical manufacturing facility had previously implemented source reduction
activities to reduce methanol including eliminating the use of methanol in formulations
and changing to dry formulations where possible, but current batches that use methanol
cannot be changed. [Click to view facility details in the P2 Tool]
Concern that product quality may decline as a result of source reduction (12%)
Example:
An organic chemical manufacturing facility utilizes methanol in its cleaning process and
found that other solvents could not be substituted due to product contamination. [Click
to view facility details in the P2 Tool]
Insufficient capital to install new source reduction equipment or implement
new source reduction activities/initiatives (3%)
Example:
A leather, hide tanning, and finishing facility releases chromium compounds. The facility
is exploring new filtration equipment to recycle chrome even though it’s currently too
expensive. [Click to view facility details in the P2 Tool]
Specific regulatory/permit burdens (2%)
Example:
A pharmaceutical facility’s FDA-qualified process determines the amount of phenol
required and therefore the amount of waste generated. [Click to view facility details in
the P2 Tool]
TRI National Analysis 2016 www.epa.gov/trinationalanalysis/ January 2018
7
Require technical information on pollution prevention techniques applicable to
specific production processes (1%)
Example:
A resin compounding facility is currently searching for a substitute for di(2-ethylhexyl)
phthalate that will provide the same product performance. [Click to view facility details
in the P2 Tool]
Source reduction activities were implemented but were unsuccessful (1%)
Example:
An antenna manufacturer attempted implementing a resin infusion (closed molding)
process to reduce styrene use but so far cannot duplicate previous quality. [Click to view
facility details in the P2 Tool]
Other, including customer demand (26%)
Example:
A spring manufacturer uses steel which contains manganese and chromium but the steel
used in the product is specified by their customers. [Click to view facility details in the
P2 Tool]
TRI National Analysis 2016 www.epa.gov/trinationalanalysis/ January 2018
8
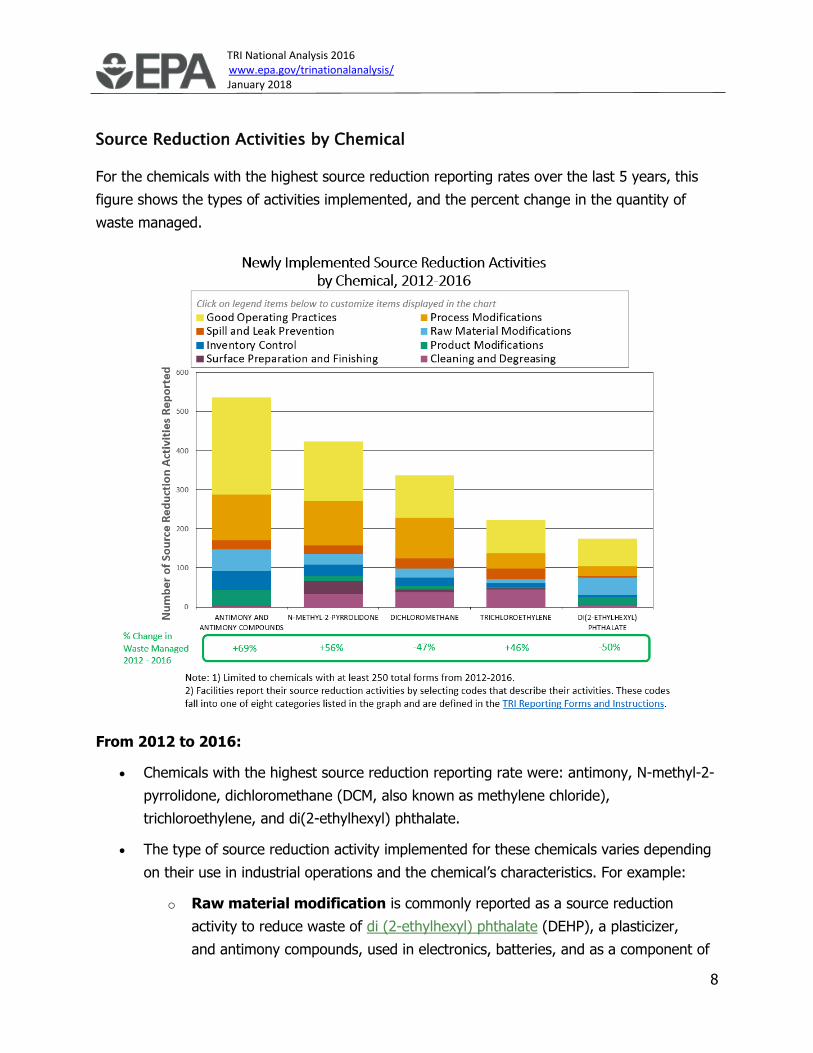
Source Reduction Activities by Chemical
For the chemicals with the highest source reduction reporting rates over the last 5 years, this
figure shows the types of activities implemented, and the percent change in the quantity of
waste managed.
From 2012 to 2016:
• Chemicals with the highest source reduction reporting rate were: antimony, N-methyl-2-
pyrrolidone, dichloromethane (DCM, also known as methylene chloride),
trichloroethylene, and di(2-ethylhexyl) phthalate.
• The type of source reduction activity implemented for these chemicals varies depending
on their use in industrial operations and the chemical’s characteristics. For example:
o Raw material modification is commonly reported as a source reduction
activity to reduce waste of di (2-ethylhexyl) phthalate (DEHP), a plasticizer,
and antimony compounds, used in electronics, batteries, and as a component of
TRI National Analysis 2016 www.epa.gov/trinationalanalysis/ January 2018
9
fire retardants. Many facilities report that they are replacing these chemicals with
environmentally preferable alternatives.
o Cleaning and degreasing, including changing to aqueous cleaners, is
implemented for common industrial solvents such
as trichloroethylene (TCE), dichloromethane (DCM, also known as methylene
chloride), and N-methyl-2-pyrrolidone (NMP).
• The quantity of waste managed over the last 5 years decreased considerably for DCM
and DEHP. For the other chemicals shown in the figure, waste quantities have increased.
While quantities of waste managed overall increased by 18% over this post-recession
time period, the increases in quantities of antimony, NMP, and TCE waste managed
exceeded this average increase. Use of NMP expanded in recent years as a substitute for
chlorinated solvents such as DCM.
Facilities may also report additional details to TRI about their source reduction, recycling, or
pollution control activities.
Examples of additional pollution prevention-related information for 2016:
• N-methyl-2-pyrrolidone: A semiconductor manufacturer replaced N-methyl-2-pyrrolidone
with de-ionized water for the cleaning processes of certain tools. [Click to view facility
details in the Pollution Prevention (P2) Tool]
• Dichloromethane: A maintenance products manufacturer is phasing out the use of
dichloromethane as a solvent, reducing its use by 64% in 2016. [Click to view facility
details in the P2 Tool]
• Trichloroethylene: A precision machining facility started using a vacuum vapor
degreasing system which will eliminate the use of trichloroethylene as a solvent. [Click
to view facility details in the P2 Tool]
• Di (2-ethylhexyl) phthalate: A rubber product manufacturer has been replacing di(2-
ethylhexyl) phthalate with a new chemical in existing formulations, and excluding the
chemical from use in new formulations. [Click to view facility details in the P2 Tool]
• Antimony Compounds: A resins manufacturer changed from using antimony trioxide
powder to propylene pellets with antimony trioxide incorporated into the pellet resulting
in less waste than the powder. [Click to view facility details in the P2 Tool]
You can compare facilities’ waste management methods and trends for any TRI chemical by
using the TRI P2 Search Tool.
TRI National Analysis 2016 www.epa.gov/trinationalanalysis/ January 2018
10
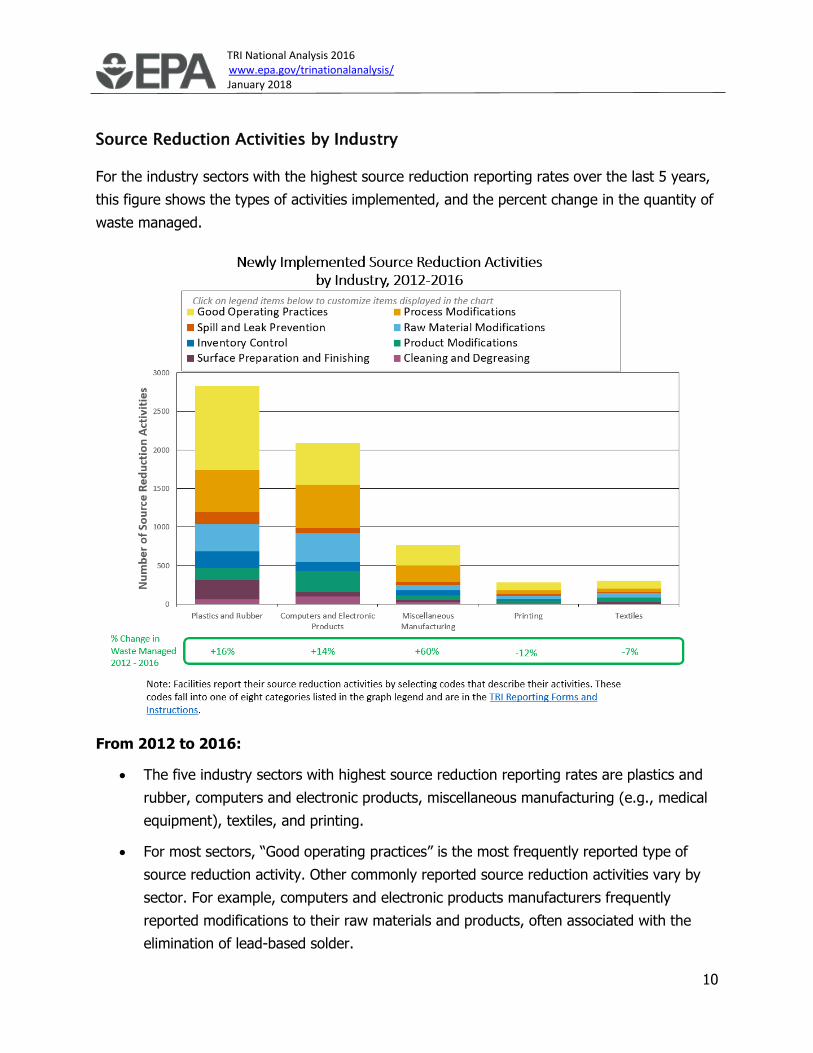
Source Reduction Activities by Industry
For the industry sectors with the highest source reduction reporting rates over the last 5 years,
this figure shows the types of activities implemented, and the percent change in the quantity of
waste managed.
From 2012 to 2016:
• The five industry sectors with highest source reduction reporting rates are plastics and
rubber, computers and electronic products, miscellaneous manufacturing (e.g., medical
equipment), textiles, and printing.
• For most sectors, “Good operating practices” is the most frequently reported type of
source reduction activity. Other commonly reported source reduction activities vary by
sector. For example, computers and electronic products manufacturers frequently
reported modifications to their raw materials and products, often associated with the
elimination of lead-based solder.
TRI National Analysis 2016 www.epa.gov/trinationalanalysis/ January 2018
11
• Facilities may also report additional details to TRI about their source reduction,
recycling, or pollution control activities.
Examples of additional pollution prevention-related information for 2016
• Plastics and Rubber: A garden tools manufacturer improved the recovery process for
scrap hose from 50% recovery (by weight) to 75%. [Click to view facility details in the
Pollution Prevention (P2) Tool]
• Computers and Electronic Products: A printed circuit board assembly facility designs
most new products as lead-free assemblies reducing the overall use of lead. [Click to
view facility details in the P2 Tool]
• Miscellaneous Manufacturing: A medical instrument manufacturer began using
chemical totes rather than drums to minimize generation of empty containers for
disposal. [Click to view facility details in the P2 Tool]
• Textiles: A fabric coating manufacturer minimized adhesive usage while maintaining
good adhesion and flame test results to reduce the amount of antimony in waste [Click
to view facility details in the P2 Tool]
• Printing: A printer reduced glycol ether air emissions by replacing one solvent based
ink containing 90% glycol ether compounds with a UV ink containing little or no glycol
ethers. [Click to view facility details in the P2 Tool]
You can view all reported pollution prevention activities and compare facilities’ waste
management methods and trends for any TRI chemical by using the TRI P2 Search Tool.
TRI National Analysis 2016 www.epa.gov/trinationalanalysis/ January 2018
12
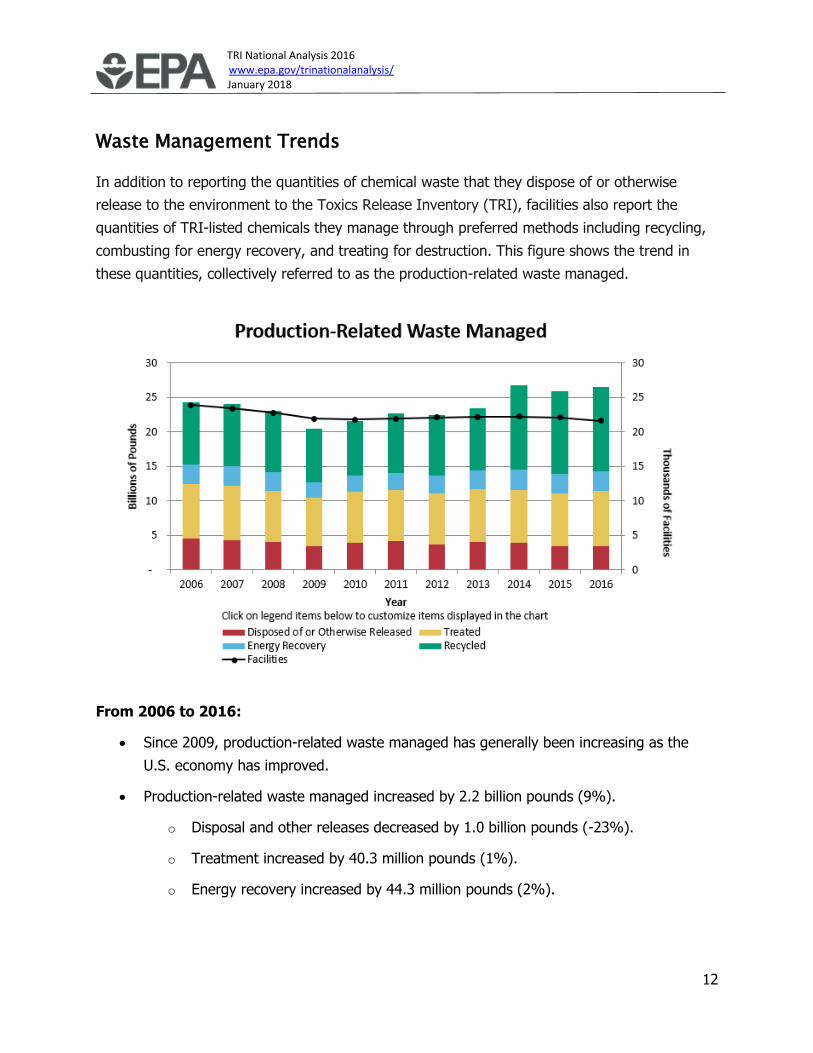
Waste Management Trends
In addition to reporting the quantities of chemical waste that they dispose of or otherwise
release to the environment to the Toxics Release Inventory (TRI), facilities also report the
quantities of TRI-listed chemicals they manage through preferred methods including recycling,
combusting for energy recovery, and treating for destruction. This figure shows the trend in
these quantities, collectively referred to as the production-related waste managed.
From 2006 to 2016:
• Since 2009, production-related waste managed has generally been increasing as the
U.S. economy has improved.
• Production-related waste managed increased by 2.2 billion pounds (9%).
o Disposal and other releases decreased by 1.0 billion pounds (-23%).
o Treatment increased by 40.3 million pounds (1%).
o Energy recovery increased by 44.3 million pounds (2%).
TRI National Analysis 2016 www.epa.gov/trinationalanalysis/ January 2018
13
o Recycling increased by 3.1 billion pounds (35%), a trend mostly driven by one
facility reporting over 3.4 billion pounds of cumene recycled in 2014 – 2016.
[Click to view facility details in the Pollution Prevention (P2) Tool]
• The number of facilities that report to TRI has declined by 9% since 2006, with 21,629
facilities reporting for 2016.
TRI National Analysis 2016 www.epa.gov/trinationalanalysis/ January 2018
14
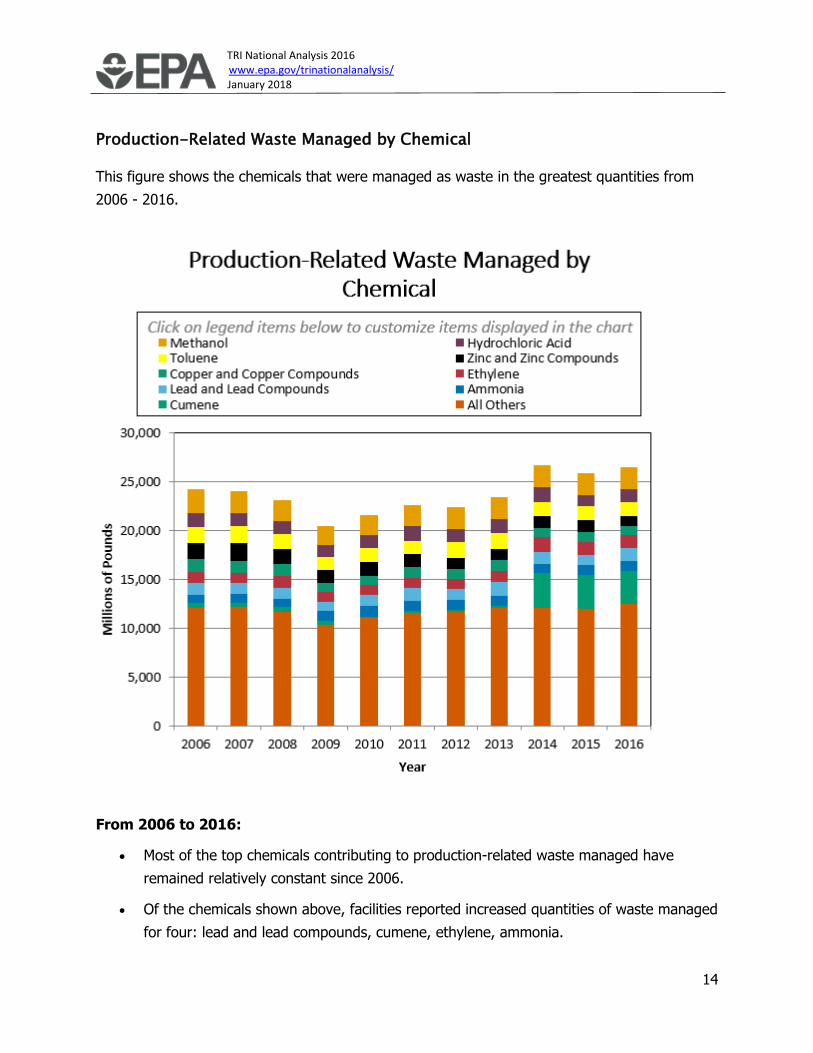
Production-Related Waste Managed by Chemical
This figure shows the chemicals that were managed as waste in the greatest quantities from
2006 - 2016.
From 2006 to 2016:
• Most of the top chemicals contributing to production-related waste managed have
remained relatively constant since 2006.
• Of the chemicals shown above, facilities reported increased quantities of waste managed
for four: lead and lead compounds, cumene, ethylene, ammonia.
TRI National Analysis 2016 www.epa.gov/trinationalanalysis/ January 2018
15
o Production-related waste of lead and lead compounds increased by 19%.
o Cumene increased six-fold, mostly driven by one facility reporting over 3.4 billion
pounds of cumene recycled in 2014 – 2016. [Click to view facility details in the
Pollution Prevention (P2) Tool]
o Ethylene increased by 17% and ammonia increased by 10%.
From 2015 to 2016:
• Facilities reported the greatest decreases in overall waste quantities for these chemicals:
o Zinc and zinc compounds, decreased by 114 million pounds (-10%)
o Copper and copper compounds, decreased by 94 million pounds (-9%)
• Lead and lead compounds, increased by 316 million pounds (30%)
TRI National Analysis 2016 www.epa.gov/trinationalanalysis/ January 2018
16
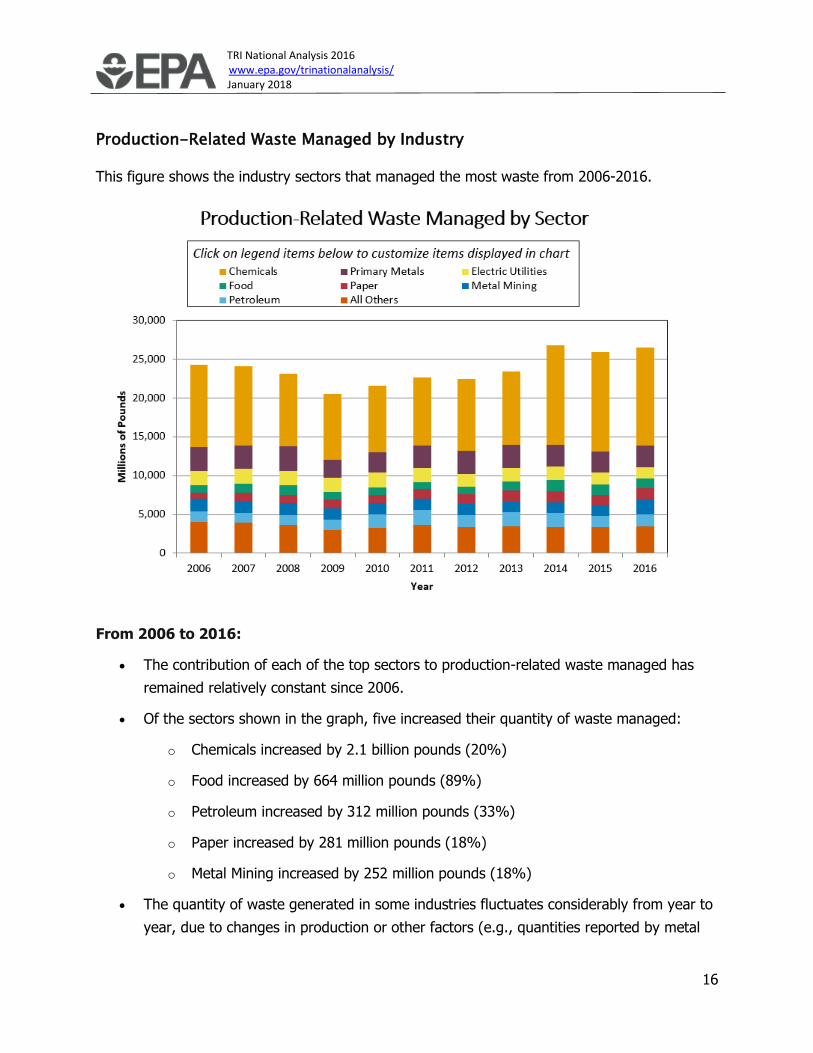
Production-Related Waste Managed by Industry
This figure shows the industry sectors that managed the most waste from 2006-2016.
From 2006 to 2016:
• The contribution of each of the top sectors to production-related waste managed has
remained relatively constant since 2006.
• Of the sectors shown in the graph, five increased their quantity of waste managed:
o Chemicals increased by 2.1 billion pounds (20%)
o Food increased by 664 million pounds (89%)
o Petroleum increased by 312 million pounds (33%)
o Paper increased by 281 million pounds (18%)
o Metal Mining increased by 252 million pounds (18%)
• The quantity of waste generated in some industries fluctuates considerably from year to
year, due to changes in production or other factors (e.g., quantities reported by metal
TRI National Analysis 2016 www.epa.gov/trinationalanalysis/ January 2018
17
mining facilities can change significantly based on changes in the composition of waste
rock).
From 2015 to 2016:
• Industry sectors with the greatest reported changes in overall waste quantities are:
o Paper increased by 521 million pounds (38%)
o Metal Mining increased by 248 million pounds (18%)
TRI National Analysis 2016 www.epa.gov/trinationalanalysis/ January 2018
18
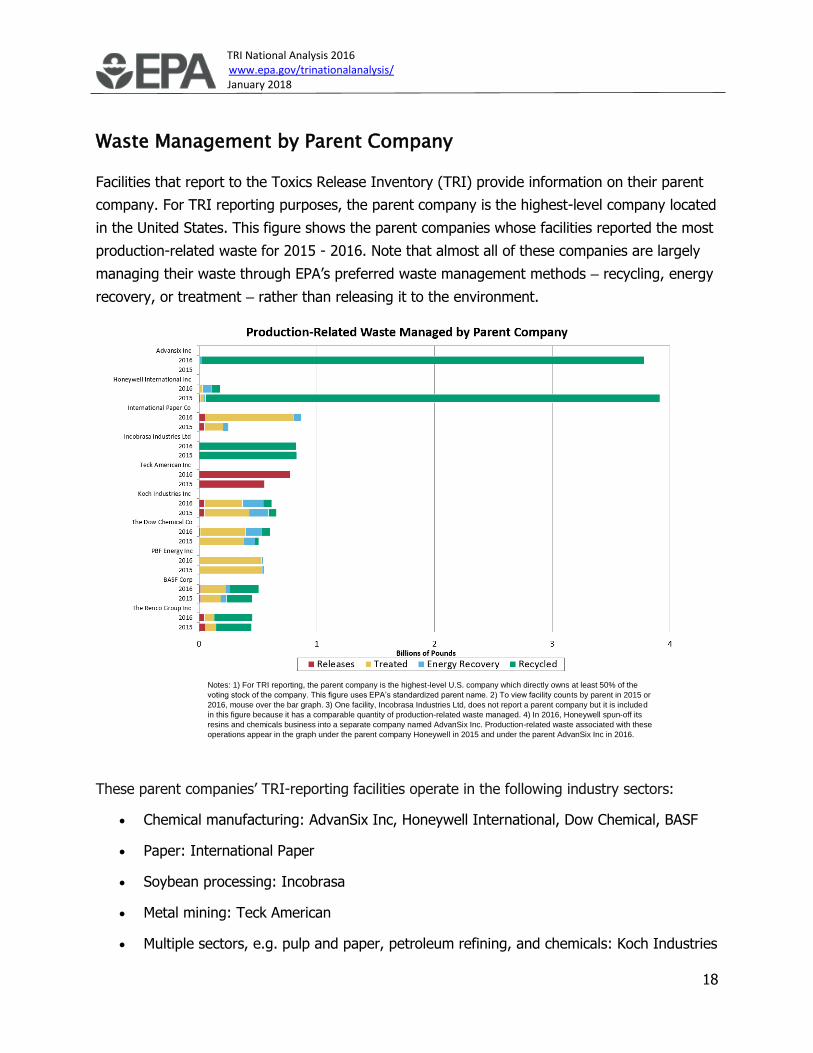
Waste Management by Parent Company
Facilities that report to the Toxics Release Inventory (TRI) provide information on their parent
company. For TRI reporting purposes, the parent company is the highest-level company located
in the United States. This figure shows the parent companies whose facilities reported the most
production-related waste for 2015 - 2016. Note that almost all of these companies are largely
managing their waste through EPA’s preferred waste management methods – recycling, energy
recovery, or treatment – rather than releasing it to the environment.
These parent companies’ TRI-reporting facilities operate in the following industry sectors:
• Chemical manufacturing: AdvanSix Inc, Honeywell International, Dow Chemical, BASF
• Paper: International Paper
• Soybean processing: Incobrasa
• Metal mining: Teck American
• Multiple sectors, e.g. pulp and paper, petroleum refining, and chemicals: Koch Industries
Notes: 1) For TRI reporting, the parent company is the highest-level U.S. company which directly owns at least 50% of the
voting stock of the company. This figure uses EPA’s standardized parent name. 2) To view facility counts by parent in 2015 or
2016, mouse over the bar graph. 3) One facility, Incobrasa Industries Ltd, does not report a parent company but it is included
in this figure because it has a comparable quantity of production-related waste managed. 4) In 2016, Honeywell spun-off its
resins and chemicals business into a separate company named AdvanSix Inc. Production-related waste associated with these
operations appear in the graph under the parent company Honeywell in 2015 and under the parent AdvanSix Inc in 2016.
TRI National Analysis 2016 www.epa.gov/trinationalanalysis/ January 2018
19
• Petroleum refining: PBF Energy
• Metal Smelting: The Renco Group
The quantity reported by AdvanSix for 2016 can be ascribed primarily to cumene recycling at a
facility that was owned by Honeywell International in 2015. This facility uses cumene as a
feedstock to manufacture phenol, a widely used TRI-covered chemical that is produced in very
large quantities. This facility is among the largest manufacturers of phenol in North America and
has implemented a number of steps to increase its recovery and recycling of cumene.
Most of these top parent companies reported implementing one or more new source reduction
activities in 2016. Some of these companies also reported additional (optional) information to
TRI about their pollution prevention or waste management activities.
Examples of additional pollution prevention-related information for 2016:
• An International Paper facility implemented a comprehensive chemical screening
program for new products purchased or used on the site to help minimize or eliminate
the use of lead and other PBTs when suitable alternatives are available. [Click to view
facility details in the Pollution Prevention (P2) Tool]
• A Dow Chemical facility instituted a clearinghouse to exchange materials that would
otherwise be discarded and utilizes a program to allow employees to take product that
would otherwise be discarded to minimize the release of diisocyanates. [Click to view
facility details in the P2 Tool]
To conduct a similar type of parent company comparison for a given sector, chemical, or
geographic location, use the TRI P2 Search Tool.
TRI National Analysis 2016 www.epa.gov/trinationalanalysis/ January 2018
20
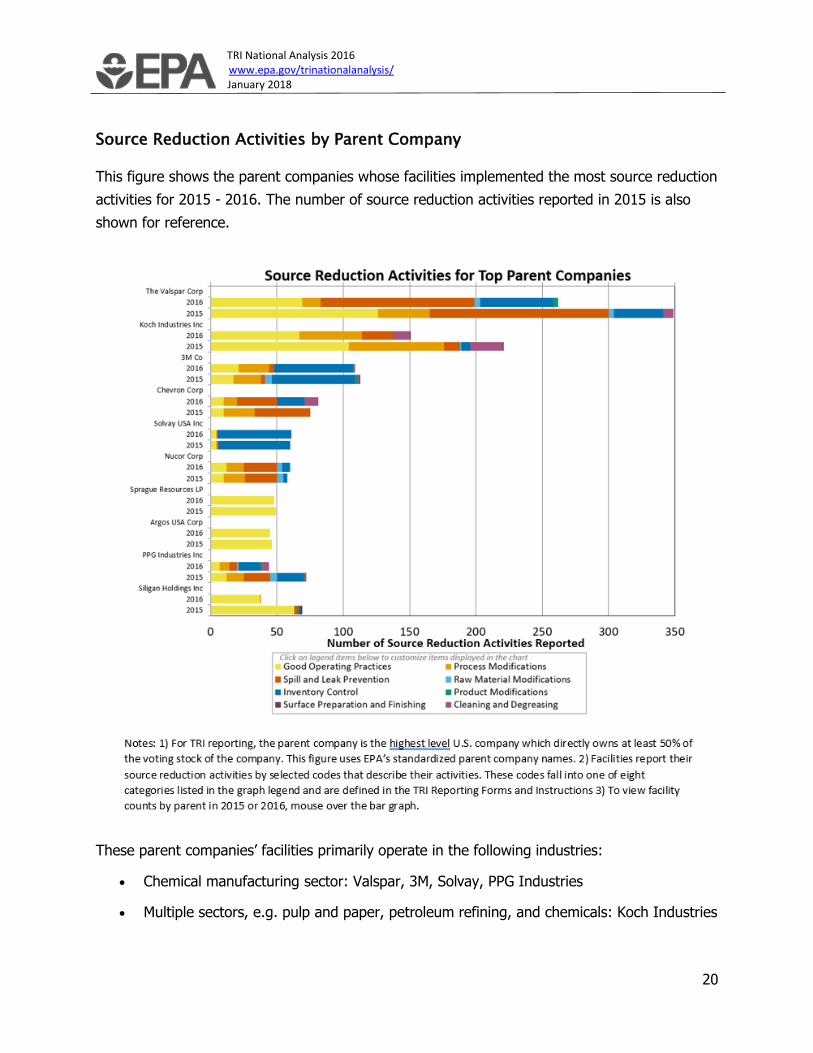
Source Reduction Activities by Parent Company
This figure shows the parent companies whose facilities implemented the most source reduction
activities for 2015 - 2016. The number of source reduction activities reported in 2015 is also
shown for reference.
These parent companies’ facilities primarily operate in the following industries:
• Chemical manufacturing sector: Valspar, 3M, Solvay, PPG Industries
• Multiple sectors, e.g. pulp and paper, petroleum refining, and chemicals: Koch Industries
TRI National Analysis 2016 www.epa.gov/trinationalanalysis/ January 2018
21
• Multiple petroleum-related sectors, e.g. petroleum refining, bulk petroleum, chemicals:
Chevron
• Steel manufacturing: Nucor
• Bulk petroleum industry (store and distribute crude petroleum and petroleum products):
Sprague Resources
• Cement manufacturing: Argos
• Metal containers: Silgan Holdings
Good operating practices, such as improving maintenance scheduling and installation of quality
monitoring systems, are the most commonly reported types of source reduction activities for
these parent companies. Spill and leak prevention and process modifications are also commonly
reported.
Some of these parent companies submitted additional text to EPA with their TRI reports
describing their pollution prevention or waste management activities.
Examples of additional pollution prevention-related information for 2016:
• A 3M facility reduced releases of numerous chemicals by sequencing changeovers to
reduce the need to perform a clean-up. This reduces the amount of cleaning solution
used in the processes as well as waste generated. More processes in the plant have
started using this technique. [Click to view facility details in the Pollution Prevention (P2)
Tool]
• A Koch Industries paperboard facility modified a recovery boiler from bark burning to
natural gas and no longer burns bark at the facility. [Click to view facility details in the
P2 Tool]
• PPG Industries chemists are reformulating products to eliminate lead. The process will
take multiple years as customers will need to approve the changes. [Click to view facility
details in the P2 Tool]
You can find P2 activities reported by a specific parent company and compare facilities’ waste
management methods and trends for any TRI chemical by using the TRI P2 Search Tool.
TRI National Analysis 2016 www.epa.gov/trinationalanalysis/ January 2018
22
Transfers Off-site for Waste Management
Toxics Release Inventory (TRI) facilities report the quantities of chemicals that they transfer off-
site for waste management. Chemicals may be sent off-site for treatment, recycling, energy
recover, or disposal. Use the interactive tool to explore where TRI chemicals in waste were sent
in 2016, and explore off-site transfers for any chemical or sector of interest.