pollution prevention guidance and tools for potws
TRANSCRIPT
A P R I L 2 0 0 5
Pollution Prevention Guidanceand Tools for POTWs
A Collaborative Product of Bay Area Clean Water Agencies,Bay Area Pollution Prevention Group, and San FranciscoRegional Water Quality Control Board
L A R R Y
W A L K E R
ASSOCIATES
Prepared by:
LARRY WALKER ASSOCIATES

Table of Contents 1. Introduction.................................................................................................................. 1 2. Elements of a successful program .............................................................................. 3 3. Intended audience....................................................................................................... 4 4. How to use this document ........................................................................................... 4 5. Pollutants with complex issues.................................................................................... 5 6. Steps to developing successful programs ................................................................... 6
Identify the Issue.......................................................................................................... 6 Identify and Assess Influent Sources of Pollutants ...................................................... 7 Evaluate Controllability ................................................................................................ 9 Identify and Prioritize Pollution Prevention Strategies ............................................... 11 Establish a Goal......................................................................................................... 13 Implement The Program ............................................................................................ 14 Evaluate Program Effectiveness................................................................................ 16 Modify The Program .................................................................................................. 16
7. Next Steps................................................................................................................. 18 8. Available Resources.................................................................................................. 18
General P2 Information.............................................................................................. 18 Pollutant profiles and uses......................................................................................... 19 Effectiveness Measurement ...................................................................................... 19 Discussion Groups..................................................................................................... 19
References.................................................................................................................... 20 Appendix A.............................................................................Pollution Prevention Menus Appendix B.................................. Using a Quantitative Approach to Source Identification

Glossary of Acronyms and Terms
Acronyms AMSA: Association of Metropolitan Sewerage Agencies
BACWA: Bay Area Clean Water Agencies BAPPG: Bay Area Pollution Prevention Group
Cu: Copper FOG: Fats, Oils & Grease gpd: Gallons per day Hg: Mercury
mgd: Million gallons per day NPDES: National Pollutant Discharge Elimination System
P2: Pollution Prevention POTW: Publicly Owned Treatment Works
ug/L: Micrograms per liter, or parts per billion Terms
Pollutant: The chemical or compound that adversely impacts water quality. Source: The physical location or item that produces or expels the pollutant.
Pollution Prevention: Any action that causes a net reduction in the use or generation of a toxic pollutant that is discharged into water. Does not include actions that merely shift a pollutant in wastewater from one environmental medium to another environmental medium, unless clear environmental benefits of such an approach are identified.
Effectiveness: A measure of the overall success of a program. If the program is effective, it is successful at reducing pollutant levels in a reasonable way.
Cost-Effectiveness: A measure of the financial success of a program. If the program is cost-effective, it is successful at reducing pollutant levels without unreasonable expenditure of funds. The amount of pollutant reduction can determine the cost-effectiveness.
Mass Balance Closure: Closure indicates that the sum of the estimated or measured loads from various sources is equal to the total known influent load. Lack of closure indicates that the sum of the loads from various sources is greater than or less than the total known influent load.
Ubiquitous: Everywhere, ever-present, found in everything.

Acknowledgements This guidance document was developed through a collaborative effort of the Bay Area Clean Water Agencies, the San Francisco Bay Regional Water Quality Control Board, and the San Francisco Bay Area Pollution Prevention Group. The following people participated in the Steering Committee that guided this effort: Larry Bahr, Fairfield Suisun Sewer District Phil Bobel, Palo Alto Regional Water Quality Control Plant Bruce Frisbey, City of San Jose Ben Horenstein, East Bay Municipal Utility District Melody LaBella, Central Contra Costa Sanitary District Steve Medbery, San Francisco Public Utilities Commission Linda Rao, San Francisco Bay Regional Water Quality Control Board Randy Schmidt, Central Contra Costa Sanitary District Gayle Tupper, East Bay Municipal Utility District

Page 1
P2 Guidance & Tools 4/1/05
1. INTRODUCTION As pollution prevention (P2) plays an increasing role in source control programs, wastewater agency/POTW program managers are continually faced with the need to create new program elements to address an array of pollutant issues. This document was developed as a guidance document to assist P2 program managers and their staffs as they develop new programs and enhance existing programs. It is intended to provide guidance at the various stages of a wastewater agency’s/POTW’s P2 program both with respect to addressing pollutant issues commonly encountered by wastewater agencies and to work with emerging pollutants and pollutants with complex issues. Because each agency has a unique set of characteristics, issues, and resources, the guidance is intended to provide a range of options that will allow managers to develop the most effective programs for their agency and service area. To guide this effort, a San Francisco Bay Regional Water Quality Control Board (RWQCB or Regional Board) Resolution, developed jointly by the Bay Area Clean Water Agencies (BACWA), the Bay Area Pollution Prevention Group (BAPPG), and the Regional Board, provided that a steering committee be set up not only to develop tools (i.e. menus) but also to establish guiding principles that will shape and focus collaborative Bay Area P2 efforts undertaken over the long-term. These guiding principles are intended to provide a framework for creating tools and program guidance to assist publicly owned treatment works (POTWs) in the development of excellent, effective programs. The following guiding principles were adopted by the Regional Board in Board Resolution R2-2003-0096 :
a. Promote activities designed and coordinated on a region-wide or watershed basis to achieve more cost-effective, powerful, and consistent results.
b. Promote cross-program and cross-media perspectives/approaches where appropriate.
c. Encourage Bay Area POTWs to continue their roles of P2 leadership, creativity, and excellence and to recognize their successes.
d. Ensure balance between environmental (e.g., receiving water quality) benefit and cost effectiveness.
e. Provide flexibility to develop P2 programs that reflect regional and service area differences and current and historic pollution prevention efforts.
f. Achieve program accountability by defining levels of expectation and assessing program performance. Peer reviews, self-audits, and other formats will be considered as tools for these assessments.
g. Consider POTW sizes and resources when developing expectations. h. Provide flexibility to balance among source identification studies, pollutant-
specific and non-pollutant specific P2 to implement the most cost-effective approach for each pollutant.
i. Provide flexibility to measure impacts of a program over an adequate time period to acknowledge short term benefits that result from immediate actions such as product replacement and long term benefits that result from behavior change of the target audience.

Page 2
P2 Guidance & Tools 4/1/05
j. Incorporate adaptive management in a manner that allows POTWs to adjust the frequency, add, modify or sunset program elements as circumstances dictate.
k. Preserve voluntary aspects of current program components within structure of regulatory requirements.
2. BACKGROUND Pollution Prevention (P2) is a strategy to keep pollutants from reaching the environment, thereby maintaining or improving the quality of our air and water. Several of the nation’s leading industries say “Pollution Prevention pays”, viewing it as a sustainable business practice. Increasingly, the nation is coming to understand P2's value—as an environmental strategy, as a sustainable business practice, as a fundamental principle for our society. Likewise, P2 can serve as a useful vehicle to “reinvent” government and its approaches to protect public resources and health. Good pollution prevention programs require a balance between society’s priorities, finite resources, and environmental benefit. The San Francisco Bay area has some of the most proactive Pollution Prevention programs in the nation. For more than a decade, Bay Area POTWs have developed and implemented P2 Programs that have reached far beyond federally mandated programs that focus primarily on large industries. P2 Programs have reached out to almost 27,000 businesses in the Bay Area to reduce or eliminate pollutants, such as copper, nickel, silver, and perchloroethylene, from entering the sanitary sewer and ultimately the San Francisco Bay and its tributaries. Some of these businesses include vehicle repair facilities, plumbers, medical offices, dentists, dry cleaners, machine shops, printers, photo processors, and restaurants. Residents have received information on pollution prevention alternatives such as Integrated Pest Management, less-toxic household cleaners, alternatives to copper-based root killers, and water pollution prevention. Numerous POTWs have excellent school outreach programs to teach the next generation to make environmentally responsible decisions. In addition, through the BAPPG, POTWs have worked together on several successful regional projects. Some of these projects include (1) the administrative ban - by the Department of Pesticide Control - of copper-based root killers and tributyltin cooling tower additives, (2) Our Water, Our World Integrated Pest Management Store Partnerships, (3) a presentation entitled Responsible Environmental Dentistry that has been presented to Bay Area dental associations, (4) inspection check-list and outreach materials for dental offices, (5) radio commercials containing water pollution prevention messages in Spanish for the Bay Area Latino community, and (6) publication of several nationwide reviews of literature and pollution prevention programs related to commercial and residential sources of wastewater and stormwater pollution prevention. To maintain the Region’s excellent record, and jointly face new challenges, BACWA and the Regional Board launched a new initiative by Board Resolution R2-2003-0096 in October of 2003 to work together to develop P2 guidance and tools for new and/or

Page 3
P2 Guidance & Tools 4/1/05
existing Bay Area POTWs. The effort will span long and short term goals and will face scientific and policy issues as needed. The guiding principles, outlined in the resolution and listed above, are intended to guide the collaborative effort between participating agencies. They form the basis for developing the menus of pollution prevention options (found in Appendix A) and the program development guidelines included in this document. A Pollution Prevention Steering Committee comprising POTW and Regional Board representatives was formed to guide this project and ensure it is consistent with the guiding principles. The first product/goal of the Pollution Prevention Steering committee was to develop menus of pollutant-specific pollution prevention options for implementation at Bay Area POTWs and provide guidelines for using the menus to develop successful programs that meet NPDES permit requirements and take into account agency size, resources, and service area characteristics. The menus contained herein, however, are by no means exhaustive, and serve only as tools to help POTW P2 program coordinators get started, identify resources, and find out what other programs have done to reduce pollutant discharges. To keep the menus useful over the long-term, as more pollution prevention information becomes available, they should be updated to reflect new information. While program needs for some pollutants will be served by menus of options, pollutants with limited influent source information, no obvious influent sources or other complex issues will require the consideration of special factors. Therefore, guidelines for developing programs to address these more complex issues are also provided. In summary, this document provides overall program guidance for the P2 manager, menus as a tool, and guidance on how to apply them. Program Guidance for developing new or expanding existing successful pollution prevention programs are found below in the following sections.
Elements of a successful program Intended audience How to use this document Pollutants with complex issues Steps to develop a successful program
2. ELEMENTS OF A SUCCESSFUL PROGRAM In general, a pollution prevention program involves characterizing your service area in order to identify major sources of pollutants in the influent, and then educating the public and businesses in the service area to create an awareness of where pollutants of concern come from and how they can be eliminated or reduced. California Regional Water Quality Control Board Resolution R2-2003-0096 (from section 13263.3 of the California Water Code) defines a pollution prevention program as containing the following elements:
1. Estimates of all the sources of a pollutant contributing to the pollutant’s influent loading.

Page 4
P2 Guidance & Tools 4/1/05
2. Analysis of methods to prevent the discharge of pollutants from the identified sources.
3. Estimate of load reductions that may be achieved through implementation of the methods identified in item 2.
4. A plan for monitoring the results of the pollution prevention program. 5. A description of the tasks, cost, and time required to investigate and
implement various methods. 6. A statement of the POTW’s short-term and long-term pollution prevention
goals and strategies. 7. Description of the POTW’s existing pollution prevention programs. 8. Analysis of any adverse environmental impacts resulting from the proposed
pollution prevention program. 9. Cost-benefit analysis to implement the pollution prevention program.
A successful pollution prevention program is one that carefully plans ahead. Steps for developing a pollution prevention program with measurable results are described below. 3. INTENDED AUDIENCE This document was intended to be used by the water pollution professional to aid both new and long-time program managers in their decision making processes regarding P2. For the new program manager, it may be daunting to decide the first steps to take in tackling a pollutant, to decide the best approach to address a given pollutant in a particular region or service area. For the long-time program manager looking to improve an existing program or move in a new direction, this guidance can extend the range of options and perhaps identify different approaches that may be useful. For both types of program managers, the P2 menus will facilitate a survey of actions taken by other programs throughout the Bay area, provide a list of resources for reference, and serve as a program resource leading to other more experienced P2 programs. In addition, regulators and POTWs alike should be able to use this document to assess reasonable expectations for programs based on resources, agency philosophies, and service area characteristics. This document will also provide tools to assess the universe of actions taken throughout the Bay, and how the POTWS judge the success of those actions. 4. HOW TO USE THIS DOCUMENT Pollution prevention (P2) programs are developed in response to a need to reduce discharges or remove a constituent from the waste stream. Often, programs are developed on a pollutant-specific basis. Therefore, menus have been created that are useful for pollutant-specific P2. Depending on a variety of factors, programs may also be developed targeting a category of pollutants (e.g., pesticides) or targeting general awareness of water pollution. Programs developed for these situations will have some differences from a pollutant-specific program. Finally, for some pollutants, information is limited or there are other complex issues. The course of action in this case may be very different than a pollutant-specific P2 program.

Page 5
P2 Guidance & Tools 4/1/05
The following tools were developed to assist POTWs in developing effective water pollution prevention programs.
General guidelines for P2 program development – these guidelines are described in a stepwise fashion in the section “Steps to developing successful programs.”
Pollutant-specific menus for copper, mercury, FOG (fats, oils, and grease), and pesticides – These specific menus are found in Appendix A and were chosen to represent the range of typical pollutant issues. In addition, the copper menu may serve as a starting point for working with other metals, and mercury serves as another example of a constituent with clearly identifiable pollutant sources. The FOG menu is an example of working with a constituent that has impacts other than on treatment plant effluent, and the pesticides menu serves as an example of working with a class of related compounds with similar sources and pollution prevention options. When to use the menus will be discussed in the section “Steps to developing successful programs.”
Guidelines for working with pollutants with complex issues – An overview of working with this type of pollutant is provided in the section “Pollutants with complex issues.” Then information on working with these types of pollutants is also included in each of the steps in the section “Steps to developing successful programs.”
To use the document, it is recommended that you first figure out where you are in the process of developing a program and go to that section to obtain guidance and ideas on what to do next. For example, you may know what your program’s issue is (i.e., pollutant of concern) and what the most likely source is. The next step is to determine the most effective pollution prevention options for your situation. Simply go to the step “identifying and prioritizing pollution prevention strategies” in the section “Steps to developing successful programs.” The information provided in this step should provide you with the ideas and basic background that will allow you to choose pollution prevention options. 5. POLLUTANTS WITH COMPLEX ISSUES Some constituents will have complicating factors, and using the standard steps described below of identifying sources and corresponding pollution prevention options may not be feasible. Certain pollutants are ubiquitous, such as bis(2-ethylhexyl)phthalate or dioxins. Bis(2-ethylhexyl)phthalate appears to be a laboratory contaminant, making it difficult to determine how much is actually in the influent, or where it is coming from. “Dioxin” describes a group of chemicals that are highly persistent in the environment. These chemicals are formed as (unintentional) by-products of many industrial processes involving chlorine such as waste incineration, chemical and pesticide manufacturing and pulp and paper bleaching. The major source of dioxin in the environment comes from waste-burning incinerators of various sorts and also from backyard burn-barrels [Ejnet.org, 2004]. Dioxins enter the water most likely through air deposition. Therefore, wastewater sources of dioxins are difficult to identify. Another example of a complicated pollutant is dieldrin because it is banned in the United States, but is still used in tropical countries for the control of tse tse flies and

Page 6
P2 Guidance & Tools 4/1/05
termites [EIP, 1997]. Dieldrin found today is likely due to atmospheric deposition of dieldrin used in other countries as well as the import of foods and materials manufactured in parts of the world that still use this pesticide. In addition, pesticide residues on historically treated soils and materials (i.e., buildings previously treated for termites) may be released today. In some cases, people may possess aldrin and dieldrin that was purchased before the bans in 1974 (banned all uses except termite control) and 1987 (banned use for termite control) [U.S. DOH, 2002]. As dieldrin has already been banned in the United States, there is little pollution prevention that can be performed. However, in situations like this, performing outreach to collect and dispose of aldrin and dieldrin purchased before the bans is a possible pollution prevention measure. Additionally, some constituents like cyanide are often not present, or present in low concentrations, in the influent. Pollution prevention for these types of constituents in influent would not be a feasible endeavor. Approaches targeting further research or treatment process evaluation would be necessary. Working with these issues may require innovative approaches or acknowledging the limitations of pollution prevention. In some cases, additional research may be needed, as in the case of evaluating laboratory procedures for bis-2-ethylhexyl phthalates or conducting research to determine how a constituent may be formed (like cyanide) as a result of a treatment process. How these issues manifest themselves at different steps in the process will be discussed as applicable in each of the steps in the next section “Steps to developing successful programs.” 6. STEPS TO DEVELOPING SUCCESSFUL PROGRAMS As discussed above, planning will be important to developing a program that will accomplish your agency’s pollution prevention goals. Key steps include:
• Identify pollutants of concern • Identify and assess influent sources of pollutants • Evaluate controllability of influent sources of pollutants • Identify and prioritize pollution prevention strategies • Establish a goal for specific strategies or actions • Establish effectiveness measures (task-specific and program-specific) • Implement the program • Evaluate program effectiveness • Modify the program
Application of the basic steps to developing a pollutant-specific P2 program are presented in the rest of this document. Identify Pollutants of Concern The first step in the planning process is to identify the issue to be resolved. For most wastewater programs, this means identifying pollutants of concern based on several

Page 7
P2 Guidance & Tools 4/1/05
factors including permit limits that are difficult to meet, the potential for the discharge to cause or contribute to the exceedance of a water quality objective, or some other adverse environmental condition. It is possible that a group of related pollutants may be identified as a concern (e.g., polynuclear aromatic hydrocarbons(PAHs), pesticides, etc.) or that the identified pollutant is one of a group of related compounds. Identifying these relationships or groups may be useful for future planning. For example, developing a program to address chlorinated pesticides or banned pesticides as a group rather than working with pesticides such as dieldrin, aldrin or DDT individually may be more effective in the long term. Any complicating issues should also be identified, like those pollutants unlikely to have influent sources, ubiquitous pollutants, or where more information is needed. Identify and Assess Influent Sources of Pollutants The next step in the pollution prevention process is to identify the influent sources, their significance, and the potential for controllability. The first approach would be to refer to the menus in Appendix A if the pollutant is one of the subject pollutants or a related pollutant (i.e., the copper menu may be useful for other metals too). The P2 menus in Appendix A provide information on sources under the headings, Potential Sources and Existing Resources. The menu headings for evaluating sources are described in more detail below.
Potential Sources In the menus, influent sources are broken up into relevant categories including: • Residential • Environmental • Commercial • Industrial • Stormwater • Agriculture For pesticides, information is also provided, where available, when a source pertains solely to one type of pesticide (i.e., diazinon). In the “Potential Source” column, influent sources have an asterisk (*) if they are frequently targeted by other agencies. The menus can be used to select sources by reviewing the lists of potential sources and comparing them to the types of businesses and activities in your service area. It is possible that certain business types will stand out as having some larger businesses in that category with respect to size or number of employees, or as having an unusually large number of businesses in a particular

Page 8
P2 Guidance & Tools 4/1/05
category, or perhaps as having been problematic in the past. Another way to use the menus to select potential sources would be to consider those sources as denoted with an asterisk (*) that have been targeted as large sources by other agencies.
Existing Resources The existing resources heading ranks the amount of information available on each identified source. A ranking of “Low” indicates there is little information available, while a ranking of “High” indicates that other agencies have worked with this source and, therefore, there is a considerable amount of information available for that particular source. Refer to Section 8, Available Resources, to find the information available for a certain source. It is also a good idea to consult with the BAPPG and the other list serves that are identified in Section 8. These list serves are also a good place to ask about sources of pollutants for which information is not readily available.
The menus identify some influent sources and provide information on which sources may be significant. For constituents other than those identified in the P2 menus, it is possible to assess influent sources using some of the techniques described below. Influent sources in a service area can be identified by: • Reviewing collection system monitoring data to quantify pollutant loads
associated with service area activities, • Conducting a literature review (or using the attached menus) to identify
probable influent sources and wastewater pollutant concentrations associated with these sources,
• Review internet sites or handbooks that describe the uses of a chemical (the ASTDR site is one useful place to look),
• Conducting a business inventory to determine where businesses are located in the service area that may be contributing pollutants to the influent,
• Reviewing water account data to determine relative flows associated with each influent source category,
• Using above information to determine if a quantitative approach to identifying influent sources is necessary.
• Using the above information to estimate load contributions from different influent sources, if necessary.
While source identification efforts may help determine the influent sources with the highest concentrations of pollutants of concern, it may be beneficial to calculate loadings from each source (concentration multiplied by flow), as a high concentration with a low flow may produce a lower pollutant load then a source with a low concentration and high flow. A simple approach to assessing influent sources is to use information from other agencies. However, if that information is not available or you suspect your community

Page 9
P2 Guidance & Tools 4/1/05
may have unique characteristics, the best approach involves an analysis of your local area. Many studies have been performed that attempt to identify sources of pollutants from commercial, residential and industrial activities. In addition, research has been conducted on the effectiveness of pollution prevention programs. This information is available from various reports and Internet sites. Some resources are listed in Section 8 (Available Resources). In most cases, data obtained can be averaged to obtain representative pollutant concentrations and source flow data when local information is not available. In addition to commercial, industrial and residential sources, stormwater inflow and septage waste may also be considered. Wastewater characteristic data can be used to estimate loadings, where available (Appendix B). If no outside information exists, it may be worthwhile to perform trunkline/collection system monitoring for pollutants of concern. By choosing lines to monitor that are solely from residential, industrial, and commercial areas, you can begin to narrow in on potential sources of pollutants. Additionally, data collected from local limits monitoring, or other studies performed in your service area can all be useful for estimating influent sources. An alternative to developing load estimates and gathering local data is to look at model studies that may be available. For instance, the City of Palo Alto discusses many source identification study efforts on their website (http://www.city.palo-alto.ca.us/cleanbay/). Similarly, a study on mercury sources performed by the Association of Metropolitan Sewerage Agencies (AMSA) is available on the internet for other agencies to review (http://www.amsa-cleanwater.org/pubs/). Internet searches for pollutants of concern are simple, cheap, and may reveal other reports that can be used to identify sources, and ideas for control efforts. Evaluate Controllability of Influent Sources of Pollutants. Once influent sources are identified, evaluating the controllability of the source by the local agency is the next step in pollution prevention assessment. Some pollutant discharges are the result of activities at local businesses or industries. In these cases, the agency has the legal authority to require that businesses make changes to reduce the pollutant discharge. The local agency may also choose to work with businesses on a voluntary basis to make changes. Some pollutant discharges may be generated by residential activities. The local agency has the ability to educate the public and provide incentives to encourage the public to make behavior changes. These pollutant sources are considered to be directly controllable by the local agency. On the other hand, a pollutant may be entering the environment through air or other media not controllable by a wastewater agency, (i.e. dioxin). Reduction of pollutant discharges in this case would be considered uncontrollable by the agency. While the reduction of discharges in this case may be uncontrollable, the local agency’s P2 program may have a goal of increasing awareness,which is controllable.

Page 10
P2 Guidance & Tools 4/1/05
Sources that are not under direct control of the local agency (i.e commercial products, pollutants conveyed through atmospheric deposition) may require further research or alternative approaches. Means of addressing these include the ban or modification of a commercial product, or partnering with another regulatory agency or business organization that has more direct control over the pollutant source. The controllability of the source will influence your ability to develop an effective pollution prevention program or, at the very least, the type of P2 program you develop. For example, for a consumer product that is beyond the agency’s control to eliminate, a manager’s goal may be to create awareness and attempt change purchasing practices in their service area. In some cases, the source may be truly uncontrollable such as natural sources or human waste.. In some cases, there may be public outreach that could be conducted, although this may not accomplish significant discharge reductions, or may only result in measurable reductions over a longer time frame.. The P2 menus in Appendix A do not identify directly whether a source is controllable. However, in the column, Pollution Prevention Strategies, the strategies listed are based on the controllability of that source by a local agency. For directly controllable sources, regulatory options (e.g., permits) will be one of the categories of options listed. Other controllable sources that rely on voluntary strategies will have those types of options listed. In addition, certain sources are identified as uncontrollable- by the local agency working alone. In addition, as noted previously, the sources are grouped into categories. In general, the industrial and commercial sources listed will be more controllable and the residential sources will be less controllable or only controllable through voluntary approaches. Environmental sources may be largely uncontrollable but may lend themselves to approaches based on partnering opportunities with other environmental agencies. Industrial and commercial activities are the most likely to be controllable because it is likely that the agency staff have existing relationships with many of the businesses and industries in your service area and these businesses will be familiar with environmental regulations. In addition, it is likely that the agency has legal authority over most businesses in its service area. An agency’s ability to work successfully with these sources will be enhanced by identifying partnering opportunities either with applicable trade or professional organizations or by identifying other government agencies that may work with the identified businesses. Some information on partnering opportunities is provided in the menus under the column called Partnering Opportunities. Controllability of residential sources will be possible in many cases but more difficult in that, in most cases, you will have to rely on voluntary actions by the general public, or the benefits may take longer to see. Challenges in this area include; successful education, developing alternatives to use and disposal of a product, and changing behaviors. One extremely effective pollutant control strategy is a product ban. In this case, the controllability will rely on identifying the appropriate partnerships to approach something on a regional or state-wide basis.

Page 11
P2 Guidance & Tools 4/1/05
For sources that are outside the agency’s jurisdiction, it may make sense to explore partnering opportunities. An example of this may be if the water supply is a source. In this case, partnering opportunities with the water purveyor could be explored. For certain sources listed in the P2 Menus, Appendix A, partnering opportunities are identified. Therefore, referring to this column in the menus may provide a starting point for generating ideas for working with sources that are outside your agency’s jurisdiction. Identify and Prioritize Pollution Prevention Strategies Once the relative contributions of sources and their controllability have been assessed, strategies can be identified for the most significant, controllable sources. Selection of P2 strategies can be based on the experiences of other communities with similar pollutant sources. Which strategies are best will depend on your agency’s resources, regulatory requirements, what you have experience with, and what works best for the targeted audience. Decisions regarding pollution prevention strategies are based on cost effectiveness, effectiveness at reducing influent load, and applicability to the service area. Assessment of cost along with an evaluation of wastewater and environmental P2 benefit should provide information on the overall cost effectiveness for each strategy. There are many different definitions of “effectiveness” and all are important to consider when choosing pollution prevention strategies. Questions to ask regarding strategies are:
How much will this cost us? How much reduction of the pollutant will we see in the influent? In the effluent? How many people will this message reach? How willing will people be to implement these strategies? How will this work for us logistically?
The goals you set for your program will also influence which strategies you select. Some strategies (e.g., public outreach) will be very effective at increasing awareness but may not result in short term, measurable reductions in influent. If the goal of your program is to educate residents regarding a particular issue, then public outreach would be considered an effective strategy. Setting goals for your program are discussed further in the next section. The following headings in the P2 menus in Appendix A can be used to identify and assess pollution prevention strategies.
Pollution Prevention Strategies For copper, mercury, FOG, and pesticides, the menus list some strategies that can be used for pollution prevention. For each source or group of sources listed in the Potential Sources column of the menus there will be at least one corresponding strategy listed in the Pollution Prevention Strategies column. These strategies are primarily the specific action or practice that you would like

Page 12
P2 Guidance & Tools 4/1/05
the target audience to use to reduce pollutant discharges. Many of these strategies will be applicable to other pollutants. For instance, many metals have sources similar to copper, so the copper menu can be used as a starting point for a P2 program for other metals of concern. Implementation Options For each P2 strategy there are approaches to implementing the strategy listed in the column called Implementation Options. How you choose to motivate your target audience to adopt the P2 strategy will impact the success of your program. Implementation options for strategies for businesses include inspections, working with trade groups, recognition or incentive programs, workshops, or permitting. Some commercial and industrial controls are very similar to the business controls. Residential implementation options include some different strategies from the businesses, such as public outreach and education, public service announcements, movie theater advertisements, school programs, newspaper articles, and highway billboards (to name a few). Many environmental and stormwater implementation options are similar to residential implementation options. Cost and Resources Needed This column is intended to provide information on how resource intensive a strategy is, and strategies are rated on a scale of 1 to 5. If a strategy is considered inexpensive to implement and/or requires minimal additional time of staff, the strategy is rated as a 1. If it is considered to be very expensive or require a large amount of staff time, the strategy is rated as a 5. The rankings for this column and the Wastewater P2 Benefit and Environmental P2 Benefit were based on input from several wastewater agencies who have used or evaluated the strategies. Wastewater P2 Benefit This column is intended to provide information on how effective the strategy is in addressing wastewater issues. A strategy with a high wastewater P2 benefit targets a discharge that goes directly to the sanitary sewer and is effective in either directly reducing the quantity of that discharge or in increasing awareness or motivating the behavior change that will ultimately result in the reduction of the discharge. For example, a strategy encouraging vehicle service facilities to seal their floor drains targets wastewater discharges and is potentially effective in reducing wastewater metals discharges. This strategy would be considered to have a high wastewater P2 benefit. An outreach strategy that increases plumbers understanding of the connection between copper pipe corrosion and water pollution would also be considered to have a high wastewater P2 benefit even though it may not result in immediate copper discharge reductions. A fluorescent tube collection program does not target a source associated with a wastewater discharge and would therefore be considered to have a low wastewater P2 benefit. The strategies are rated on a scale of 1 to 5. If the strategy targets wastewater discharges and is considered highly effective in

Page 13
P2 Guidance & Tools 4/1/05
reducing discharges or in increasing awareness of the issues with the discharge or in changing behavior, the strategy is rated as a 5. If the strategy is not very effective or does not address a wastewater discharge, the strategy is rated as a 1.
Other Environmental Benefit This column is intended to provide information on how effective the strategy is in providing benefit to other environmental media. For example, the fluorescent tube collection program from the previous example would have the benefit of removing mercury from the environment. Outreach programs targeting brake pad wear are effective in creating awareness of a stormwater discharge. This would have a high environmental benefit even though the benefit to wastewater is low. The strategies are rated on a scale of 1 to 5. If the strategy is considered to be highly effective in providing a non-wastewater environmental benefit,it was rated as a 5. If it was determined to have little benefit outside of wastewater reductions, it was rated as a 1.
Cost effectiveness, potential for influent reductions, and availability of information on strategies are good ways to evaluate P2 strategies. In looking at the P2 menus, it may be clear that certain strategies seem feasible for your particular service area. Additionally, for pollutants not found in the menus, but with the same source (e.g. hospitals), the same strategies and implementation options identified in the menus can often be used. For constituents that are not in the influent or that have limited information, the first step may be further research and source monitoring to gather more information before assessing P2 strategies. Establish a Goal for Specific Strategies or Actions Identifying significant sources and selecting approaches to reducing discharges from these sources are the key steps to designing a P2 program. The other essential step that will help to make your program successful is to establish a goal for your program. This will help to focus your P2 efforts. In establishing a goal it is helpful to have a baseline or starting point. Depending on what are you hoping to achieve, a baseline may be the percent of your service area that is aware of an issue or the number of businesses that are employing a certain practice. Baselines may also be starting influent pollutant concentrations or discharge concentrations from the source. Setting short-term and long-term goals for pollutant reduction will help to estimate how much pollution prevention is necessary. Whether the goal is to meet a permit limit, to achieve an overall percent reduction in the influent or effluent or to simply achieve some rate of compliance or residential behavioral change, it is important to define a target for the program. Once a goal is established, it will be useful in identifying the applicable effectiveness measurement tool.

Page 14
P2 Guidance & Tools 4/1/05
The goals set should be realistic. Information on what you can hope to achieve by implementing a P2 option can be based on results of previous actions in your community. Awareness increase after a public education campaign, change in sales patterns or increases in compliance rates for businesses may have been measured in the past in your community. If not, what you can expect to achieve may be based on the experiences of other communities. Some resources on measurement are listed in Section 8 of this Report, Available Resources. Reviewing the Cost & Resouces Needed, Wastewater P2 Benefit and Other Environmental Benefit columns in the menus in Appendix A will give you a sense of how effective your selected strategies and implementation options may be. This may be helpful in setting a realistic goal. However, in general, goal setting will be very community specific and, therefore, is best tailored to an individual service area’s needs rather than relying too heavily on outside sources (or pressures) to determine what your program can realistically achieve. Establish Effectiveness Measures Once strategies have been selected and goals set, effectiveness measurement must be determined. It is essential that effectiveness measurement is considered during the planning phases not after the program is underway or has been completed. It allows the agency to incorporate measurement tools into the planned activities and make a small addition that will yield valuable information. For example, while planning a program the agency staff may add in some simple record keeping or include one or two extra questions during inspections that will facilitate program evaluation. Effectiveness measurement may be carried out before, during and after program implementation. Selecting the best measurement tool will depend on whether you evaluating options during the planning stages of a program or if you are tracking progress during program implementation or if you are evaluating the changes resulting from a completed program. The goals you set will also help to identify the right evaluation tool. Effectiveness measurement tools are provided in the menus for copper, mercury, FOG, and pesticides. A separate Effectiveness Determination Menu is found after the main menu for each constituent. The first two columns list source and implementation option. In the “Effectiveness Measurement Options” column, recommendations are provided corresponding to each implementation option selected. These ideas in the Effectiveness Measurement Options column can be used to evaluate how well a strategy is working, and to receive feedback to fine-tune efforts for further pollution prevention. To select a particular measure will depend on the specific goal of your program and your agency’s resources. If your goal is to reduce influent levels of the pollutant, then monitoring would be the effectiveness measure. If the goal is an intermediate step like increasing the rate of BMP implementation, then the effectiveness measure would be to evaluate compliance rates through site visits.

Page 15
P2 Guidance & Tools 4/1/05
A few examples of effectiveness tools may be counting the number of thermometers turned in, the number of coupons used for car washes, or by surveying consumers to see if they recall seeing outreach materials. These examples are related to evaluating outreach programs for residential sources. For commercial and industrial sources, evaluation may be better measured by compliance rates or increase in properly implemented practices at a facility or discharge reductions at the facility. Implement The Program At this point in the process, you should have identified the most significant sources and the P2 strategies and implementation options that work best for your program and service area. These elements along with the goals you hope to achieve will describe your program. The next step is to begin implementing the program and determining which strategies to focus on first. Strategies that are determined to be the most effective with respect to potential for discharge reductions are a good starting point, unless they are cost prohibitive. Also, strategies that are easy and inexpensive to implement are good to consider even if they are only expected to be moderately effective. Deciding how many controls to implement at one time may include a look at how much money and time is available in the short and long-term. If limited funds are available, you may want to implement the most cost-effective strategies first. Future planning could then include setting aside resources for further reduction efforts. Using the P2 menus to develop an implementation plan is described below.
Implementation Options Implementation options are intended to describe how pollution prevention strategies will be communicated to the target audience. For example, a strategy to reduce amalgam discharges from dentists may be to dispose of traps and filters properly. The implementation options are the approaches to disseminating this information and motivating dentist to adopt this practice. Specific implementation options may be to mail brochures, conduct site visits or conduct workshops. Implementation options for the identified pollution prevention strategies are listed in the P2 menus to correspond to P2 strategies.
Regional or Local Implementation In the Regional/Local column, options for implementation are categorized as being regional, local or either. Certain options lend themselves to being implemented by several agencies simultaneously especially when a unified message will increase the probability of it being effective. In this case, regional implement may provide opportunities to reach a larger audience with minimal additional effort. Other options may only apply to your service area so local implementation is warranted. Local implementation is most effective when there is a localized problem that can be addressed by catering to a smaller audience. When “either” local or regional pollution prevention can be effective, it is up to each agency to decide whether they can address the problem in their immediate vicinity, or if they would be better suited to team up with other agencies.
Page 16
P2 Guidance & Tools 4/1/05
Partnering Opportunities Opportunities for partnering with stormwater and cross-media efforts are also indicated in the P2 menus. Partnering with groups can help to share costs and ideas. Cross-media efforts could include working with other public agencies as indicated in the menus such as air pollution groups, or soil remediation groups. Other partnering opportunities may exist with trade or professional organizations associated with the targeted source.
Evaluate Program Effectiveness As noted above, effectiveness measurement is carried out before, during, and after a program is conducted. Evaluation tools are important for measuring aspects of the program that are of most interest to the agency. The effectiveness measurement options listed in the Effectiveness Determination pages of the menus are related to evaluating specific program elements. Selecting these measures was discussed above. Looking at the overall effectiveness of a program may require combining information obtained from a variety of measurement tools (e.g., survey results in combination with number of items turned in or phone calls received or in combination with changes in sales of certain products, environmental measures). When possible, it is useful to measure overall program effectiveness through changes in influent or effluent levels of pollutants. Another approach, when possible, is to demonstrate the success of a P2 program by estimating the amount of pollutants successfully collected- and not discharged- to the waterworks, storm drains, or environment. Additional resources for ideas on measurement are found in Section 8 of this report. Modify the Program Based on the effectiveness evaluation, pollution prevention programs can be modified to improve upon areas that did not accomplish goals, by ramping up efforts that proved to be very effective, discontinuing efforts that may no longer be productive, or shifting priorities to make more effective use of resources. Certain P2 strategies are one-time actions and once they are completed, no future action may be warranted. Once certain strategies are fully implemented, less resources may be needed to maintain them allowing resources to be shifted to address new issues. Other promising strategies may be worth expanding upon. In addition, new pollutant issues arise that require attention and shifting priorities may result in a need to shift resources. Possible results of effectiveness measurement include:
Strategy Not Effective, Goal Not Achieved If this is the result of your evaluation then the questions to ask are: Could this strategy be implemented better? Is there another strategy that may work better?
Page 17
P2 Guidance & Tools 4/1/05
When sources have been identified, but control measures are not achieving desired results, it is important to reassess your strategies perhaps selecting other strategies or modifying the selected strategy. It may also be that a strategy was effective initially and achieved significant increases in awareness or discharge reductions but that the response may have leveled off. This may not mean the strategy is no longer effective but that it has accomplished as much as can reasonably be expected. You may choose to continue implementing the strategy but at a lower level of effort that allows the effort to be maintained or to discontinue the strategy in favor of a new approach. If it is determined additional results are unlikey from actions targeting a particular source, it may be worthwhile to determine if there is another source to investigate.
Strategy Effective, Goal Not Achieved If this is the result of your evaluation then the questions to ask are: Is there another source to work with that may achieve more reductions? Is there a limit as to how much reduction is possible (and has already been achieved)? When have we done a reasonable and rational amount of P2? At some point, it may be necessary to assess the effectiveness of continuing a particular pollution prevention strategy. If the goal of the strategy was discharge reductions, an analysis of influent and effluent data can be a useful tool for assessing whether a reduction in the influent (due to P2) will result in a reduction in the effluent. Influent versus effluent data plots can be a useful tool for this evaluation. However, changes in attitude and behavior of people in the service area are successful results even if there is no reduction in the influent or effluent. Evaluation of the goal may also be in order if a strategy achieved significant results. It may be worthwhile to compare your results with those of other effective P2 programs to determine if your goal was realistic. For example, if your goal is a 75% reduction in influent levels of a pollutant, it would be impossible to achieve that goal by targeting a source that only accounts for 60% of the influent loading. Raising awareness of 50% of the residential audience in your service area may be a difficult goal to achieve through public outreach. If that were your goal, it would be worthwhile to investigate approaches that would enhance a general awareness campaign. Examples include offering financial incentives, partnering with other agencies to expand your program and increase the impact of your message or increasing the time frame over which the change is expected.
Goal Achieved
If this is the result of your evaluation then the questions to ask are: What actions need to be taken to maintain reduction? What is the next goal (new pollutant)? In some cases, P2 may achieve the goals that were set. If a goal is achieved then thought should be given to the steps necessary and level of effort required to maintain the accomplishments. Once a goal is accomplished the opportunity presents itself to shift resources to address other issues and/or additional pollutants of concern. It may be that awareness has been raised to a realistic level and it is time to pursue behavior change or discharge reduction if appropriate. In some cases changing awareness may

Page 18
P2 Guidance & Tools 4/1/05
be all that is available with respect to certain source or that you have achieved the level of change that is possible for this source. At this point, the decision would need to be made as to whether more work on a certain source or pollutant is still warranted. With the continual emergence of new pollutants and new issues it is important to have the flexibility in your program to de-emphasize certain issues in order to allocate resources to more pressing concerns. This is particularly true in the situation where significant results have been achieved through a range of actions conducted over a long time period. Reducing resources to a maintenance level in order to move on to new challenges may be the best approach. 7. NEXT STEPS It is important to periodically update your records with new information regarding sources of your pollutants of concern. As discussed above, as strategies are implemented you may reach a point where you have achieved all you can from that strategy. It then becomes imperative to adapt strategies, or add new ones, to meet your pollution prevention goals. Periodic re-evaluation of program goals and resources will help to keep your program on-track and effective. 8. AVAILABLE RESOURCES There are several websites with information that is useful for developing and implementing P2 programs. Some of these sites are listed below. In addition, at the end of Appendix A, there are lists of reports and other documents that are associated with copper, mercury, FOG, and pesticides pollution prevention and source identification activities. General P2 Information City of Palo Alto: http://www.city.palo-alto.ca.us/cleanbay/ - On the publications page are source identification studies, pollution prevention plans and sample materials for a range of constituents including metals, dioxins, pesticides, and mercury. Association of Metropolitan Sewerage Agencies: http://www.amsa-cleanwater.org/pubs/ EJnet.org: Web Resources for Environmental Justice Activists. http://www.EJnet.org/ INFORM http://www.informinc.org Department of Toxics Substances Control Pollution Prevention Page http://www.dtsc.ca.gov/PollutionPrevention/index.html EPA Region 9 Pollution Prevention http://www.epa.gov/region09/p2/

Page 19
P2 Guidance & Tools 4/1/05
Pollution Prevention Resource Exchange http://www.p2rx.org/ - This site and the regional sites that follow all contain information on a variety of sources and pollutants and other P2 topics. Regional P2 websites reachable from Pollution Prevention Resource Exchange
Great Lakes Regional Pollution Prevention Roundtable Topic Hubs http://www.glrppr.org/hubs/ Peaks to Prairies Pollution Prevention Information Center http://peakstoprairies.org/ Waste Reduction Resource Center P2 Documents http://wrrc.p2pays.org/p2documents.asp Western Regional Pollution Prevention Network http://www.westp2net.org/ Pacific Northwest Pollution Prevention Resource Center http://www.pprc.org/ Southwest Network for Zero Waste http://www.zerowastenetwork.org/
Pollutant profiles and uses US Department of Health and Human Services, Public Health Service, Agency for Toxic Substances and Disease Registry. http://www.atsdr.cdc.gov/toxpro2.html Effectiveness Measurement PPRC topic hub for Environmental Measurement Table of Contents http://www.pprc.org/hubs/toc.cfm?hub=1000&subsec=7&nav=7 Water Environment Research Foundation. Tools to Measure Source Control Program Effectivenes. Project 98-WSM-2. 2000. (available through www.werf.org) Water Environment Research Foundation. Controlling Pollution at Its Source: Wastewater and Stormwater Demonstration Project. Project 98-WSM-2. 2001. (available through www.werf.org) Discussion Groups These groups are good places to post questions or review their archives for previous discussions Bay Area Pollution Prevention Group
Post message: [email protected]

Page 20
P2 Guidance & Tools 4/1/05
Subscribe: [email protected] California Water Environment Association Pretreatment, Pollution Prevention & Stormwater Committee
Post message: [email protected] Subscribe: [email protected]
Pretreatment Coordinators
Post message: [email protected] Subscribe: [email protected]
REFERENCES US Department of Health and Human Services, Public Health Service, Agency for Toxic Substances and Disease Registry. Toxicological Profile for Aldrin and Dieldrin. September 2002. http://www.atsdr.cdc.gov/toxprofiles/tp1.html EJnet.org: Web Resources for Environmental Justice Activists. Dioxin Homepage. 2002. http://www.EJnet.org/dioxin/ EIP Associates. Organochlorine Pesticides Source Identification. Prepared for Palo Alto Regional Water Quality Control Plant. October 1997. http://www.city.palo-alto.ca.us/cleanbay/pestpubs.html#Pesticides

Pollution Prevention Menus
A P P E N D I X A

POTENTIAL SOURCE EXISTING RESOURCES
PARTNERING OPPORTUNITIES
POLLUTION PREVENTION STRATEGIES IMPLEMENTATION OPTIONS REGIONAL/
LOCAL
Cost & Resources Needed (1)
Wastewater P2 Benefit (2)
Other Environ-mental
Benefit (3)
Notes
IndustrialIndustries using copper containing chemicalsCooling towers* High Alternative chemicals Recognition program Either 2.4 3.6 2.8Boilers Low Incentive program Either 2.8 3.2 2.8Boat manufacturers Low Merit certificates Either 2.3 3.0 2.7Power generators Low Multilingual brochures Either 3.0 2.5 2.3Semiconductors Low Workshops Local 4.0 3.8 2.7
Process optimization Workshops Local 3.3 3.0 3.0Product banning Legislative Regional 3.3 4.0 3.0
Industries with stormwater pollution potentialAirports Low Stormwater BMPs Provide handbook Either 2.0 1.0 3.5Waste haulers (brake pads) Moderate Reduce vehicle use Workshops Either 3.7 1.7 4.0
Carpooling Local 2.0 1.7 3.3Posters Either 2.3 1.7 3.7
Industries that may discharge copper
Industrial laundries Moderate Graywater systems Incentive program Either 2.8 2.5 2.7Clothes dryers might benefit too.
Metal finishers Moderate Pretreatment Monitoring Local 3.0 4.2 3.8Food processors Moderate BMPs Provide handbook Either 2.8 3.0 3.2Clothes dyers Low Workshops 3.3 3.0 3.3Scrap metal recyclers Low Recognition program Either 2.3 3.3 3.3Soap manufacturers Low Site inspections 2.0 4.0 4.0Coil coaters Low Merit certificates Either 2.3 3.3 3.3Electroplaters Moderate Discharge limits Permit requirement Local 1.8 4.3 3.5Mirror manufacturers Low Copper P2 Permit requirement Either 1.3 4.3 3.7Metals manufacturers Moderate Zero discharge Floor drain sealing Local 1.3 5.0 4.0
Site inspections Local 1.7 4.7 4.0Monitoring Local 2.3 4.7 4.0
Copper Pollution Prevention Menu
* Frequently targeted source(1) 1 = low cost, staff time, 5 = hi cost, staff time(2) 1=low ww benefit, 5 = hi ww benefit(3) 1=low non-ww environmental benefit, 5 = hi non-ww environmental benefit
Cu P2 MenuApriil 1, 2005
1

POTENTIAL SOURCE EXISTING RESOURCES
PARTNERING OPPORTUNITIES
POLLUTION PREVENTION STRATEGIES IMPLEMENTATION OPTIONS REGIONAL/
LOCAL
Cost & Resources Needed (1)
Wastewater P2 Benefit (2)
Other Environ-mental
Benefit (3)
Notes
Copper Pollution Prevention Menu
CommercialVehicle service* High BMPs Provide handbook Either 2.2 2.6 2.3
Site inspections Local 2.2 3.2 3.0Recognition program Either 2.0 2.2 2.5Voluntary programs Either 1.8 1.8 2.0Technical workshops Local 3.0 2.2 2.5Trade Association workshops Regional 2.8 2.6 2.5
Self audits Provide inspection form Either 1.6 1.8 1.8Discharge limits Permit requirement Local 2.2 3.4 3.3Zero discharge Floor drain sealing Local 2.0 4.0 2.8
Site inspections Local 2.0 3.2 2.8Recognition program Either 2.2 2.6 2.3Monitoring Local 2.8 2.8 2.0If exceedance, resample at facility's expense Local 1.8 3.6 2.8
Discharge limits Permit requirement Local 1.8 3.3 2.8Copper P2 Permit requirement Either 1.8 3.5 2.5Reduce vehicle use Newspaper articles Either 2.5 1.5 3.3
Multilingual brochures Either 2.8 1.3 2.5Public event participation Local 2.5 1.5 2.8School programs/events Local 2.0 1.3 2.5Newsletters Either 2.3 1.8 3.0
Vehicle washing* High Interceptor requirements Permit requirement Local 2.4 4.0 3.5BMPs Provide handbook Either 2.0 2.2 2.6
Vehicle fleets (brake pads) Moderate
Brake pad partnership Reduce vehicle use Work with fleet managers Local 2.3 2.5 3.0
BMPs Provide handbook Either 2.3 1.8 2.8Printers* High Use alternate inks Permit requirement Local 2.5 2.8 3.5
Recognition program Either 2.5 2.0 2.8Incentive program Either 3.0 2.0 2.8Multilingual brochures Either 2.5 1.8 2.5Posters in stores Either 2.5 1.8 2.5Workshops Local 3.0 2.0 2.8
Zero discharge Permit requirement Local 2.0 3.0 3.3Floor drain sealing Local 1.8 3.0 3.3Site inspections Local 1.5 2.5 2.8Recognition program Either 2.0 2.0 2.3Monitoring Local 3.3 1.8 2.0
* Frequently targeted source(1) 1 = low cost, staff time, 5 = hi cost, staff time(2) 1=low ww benefit, 5 = hi ww benefit(3) 1=low non-ww environmental benefit, 5 = hi non-ww environmental benefit
Cu P2 MenuApriil 1, 2005
2

POTENTIAL SOURCE EXISTING RESOURCES
PARTNERING OPPORTUNITIES
POLLUTION PREVENTION STRATEGIES IMPLEMENTATION OPTIONS REGIONAL/
LOCAL
Cost & Resources Needed (1)
Wastewater P2 Benefit (2)
Other Environ-mental
Benefit (3)
Notes
Copper Pollution Prevention Menu
Machine shops High Zero discharge Floor drain sealing Local 1.8 3.0 2.8Site inspections Local 2.2 2.7 2.6Recognition program Either 2.0 2.3 2.8
Laundries High Pretreatment Permit requirement Local 2.0 3.4 3.0Recognition program Either 2.3 2.0 2.3
Graywater systems Incentive program Either 2.8 2.8 2.8Recognition program Either 2.8 2.5 2.5
Carpet cleaners High BMPs Provide handbook Either 2.5 1.8 2.0
Clean techniques Educate customers to request Either 2.0 2.0 2.3Posters in stores Either 2.8 1.8 2.0Multilingual brochures Either 2.8 1.8 2.0
Reduce cleaning frequency
Educate homeowners to remove shoes Either 2.5 1.8 2.3Newspaper notices Either 3.0 1.0 1.8School programs/events Local 2.8 1.3 2.0
Food service/ Restaurants High BMPs Recognition program Either 2.4 1.8 2.0Medical service Low Provide handbook Either 2.0 1.8 2.0Plumbers* High Local unions Green Business Program Regional 1.8 2.0 2.0Wineries Moderate Pretreatment Provide drain filters Local 2.7 3.0 2.0Laboratories Moderate Zero discharge Floor drain sealing Local 1.8 3.5 2.0
Radiator repair* Moderate Recognition program Either 2.0 2.5 1.7
Radiator shops should be closed loop with no discharge.
Monitoring Local 3.0 3.0 1.7Businesses using copper containing chemicalsCooling towers* High Alternative chemicals Merit certificates Either 2.2 3.0 3.3Swimming pools* Moderate Recognition program Either 2.3 2.5 2.7Boatyard (marine paint) Low Incentive program Either 2.3 2.5 2.7Ceramic painting Low Multilingual brochures Either 2.8 2.3 2.7Surface cleaners* Moderate Posters in stores Either 2.3 2.3 2.7
BMPs Workshops Local 3.0 2.3 2.3Provide handbook Either 2.5 2.0 2.3
Businesses with stormwater pollution potentialBus yards Low Stormwater BMPs Provide handbook Either 2.4 1.0 1.8Corporation yards Low Stormwater Treatment Plant tours Local 2.2 1.2 2.0Schools Low Source identification Site inspections Local 2.8 1.0 2.0
Monitoring Local 3.3 1.0 2.0
* Frequently targeted source(1) 1 = low cost, staff time, 5 = hi cost, staff time(2) 1=low ww benefit, 5 = hi ww benefit(3) 1=low non-ww environmental benefit, 5 = hi non-ww environmental benefit
Cu P2 MenuApriil 1, 2005
3

POTENTIAL SOURCE EXISTING RESOURCES
PARTNERING OPPORTUNITIES
POLLUTION PREVENTION STRATEGIES IMPLEMENTATION OPTIONS REGIONAL/
LOCAL
Cost & Resources Needed (1)
Wastewater P2 Benefit (2)
Other Environ-mental
Benefit (3)
Notes
Copper Pollution Prevention Menu
ResidentialVehicle washing* Moderate Wash on lawn Newspaper articles Either 2.2 1.4 2.3
Multilingual brochures Either 3.0 1.5 2.3Public event participation Local 2.5 1.5 2.3School programs/events Local 2.3 1.5 2.3Newsletters Either 2.0 1.5 2.3
Driveway replacement porous Workshops Local 3.5 1.5 2.7
Incentive program Either 3.0 1.5 2.7Local Car Washes Use commercial wash Bill inserts Either 1.2 1.2 2.5
Coupons for car washes Local 2.8 1.0 2.7
Vehicle home repair Low BMPs Workshops Local 3.0 1.3 2.0Workshop attendance is usually low.
Free bus service to workshops Local 3.0 1.3 2.0Point of sale work with stores Local 3.0 1.5 2.0Posters in auto parts stores Either 2.8 1.0 2.0
Products containing copperFor pools/spas Moderate Alternative chemicals Multilingual brochures Either 2.8 1.8 2.3
Posters in stores Either 2.3 1.8 2.3Work with stores Either 2.5 2.3 2.3
Root control CuSO4* Moderate Product banned Legislative Regional 3.0 3.0 3.0Remind plumbers & hardware stores of ban Multilingual brochures Either 2.8 2.3 3.0Root control product collection Posters in stores Either 3.3 2.0 2.0
Fungicide CuSO4 Low Alternative chemicals Work with stores Either 2.6 1.4 2.5Pesticides CuSO4 Low School programs/events Local 2.8 1.0 2.5Nonpesticide CuSO4 Low Telephone, mail Local 3.2 1.4 2.5
Collect at local facility Local 4.0 1.8 2.7Free bus service to dropoff Local 3.5 1.3 2.7
Other household products Low HHW collection Collect at local facility Local 2.4 2.2 3.3
Newspaper notices Local 2.0 1.4 3.3Recycling programs School programs/events Local 3.0 1.3 3.0
Public event participation Local 2.3 1.5 3.0Multilingual brochures Either 2.8 1.3 3.0Treatment Plant tours Local 2.8 1.5 3.0
* Frequently targeted source(1) 1 = low cost, staff time, 5 = hi cost, staff time(2) 1=low ww benefit, 5 = hi ww benefit(3) 1=low non-ww environmental benefit, 5 = hi non-ww environmental benefit
Cu P2 MenuApriil 1, 2005
4

POTENTIAL SOURCE EXISTING RESOURCES
PARTNERING OPPORTUNITIES
POLLUTION PREVENTION STRATEGIES IMPLEMENTATION OPTIONS REGIONAL/
LOCAL
Cost & Resources Needed (1)
Wastewater P2 Benefit (2)
Other Environ-mental
Benefit (3)
Notes
Copper Pollution Prevention Menu
Illegal dumping Moderate Stormwater Alternate disposal Bill inserts Either 2.0 1.2 2.8Newspaper notices Either 2.5 1.0 2.0
Neighborhood watch program Public meetings Local 2.8 1.0 2.3
Hobbyists Low Alternative chemicals Availability of alternative Either 2.5 2.0 1.7
Electronic etching LowProper waste management School programs/events Local 2.8 1.3 1.7
Ceramic painting Low Job fair participation Local 2.8 1.5 1.7Jewelry making Low Workshops Local 3.0 1.5 1.7
Public event participation Local 3.0 1.5 1.7Free bus service to events Local 3.5 1.3 1.7Multilingual brochures Either 3.3 1.3 1.7Posters in stores Either 3.3 1.3 1.7Work with stores Local 3.3 1.8 1.7Web page Either 3.0 1.3 1.7
Human waste Low Uncontrollable 1.0 1.0 1.0Laundry graywater* Moderate Graywater systems Incentive program Local 3.3 2.0 2.0
Food waste LowCompost instead of garbage disposal Web page Either 2.0 1.8 1.0
Workshops Local 2.8 2.2 1.5Posters in stores Either 2.6 1.6 1.0Free composting bins Local 3.6 2.2 1.3
* Frequently targeted source(1) 1 = low cost, staff time, 5 = hi cost, staff time(2) 1=low ww benefit, 5 = hi ww benefit(3) 1=low non-ww environmental benefit, 5 = hi non-ww environmental benefit
Cu P2 MenuApriil 1, 2005
5

POTENTIAL SOURCE EXISTING RESOURCES
PARTNERING OPPORTUNITIES
POLLUTION PREVENTION STRATEGIES IMPLEMENTATION OPTIONS REGIONAL/
LOCAL
Cost & Resources Needed (1)
Wastewater P2 Benefit (2)
Other Environ-mental
Benefit (3)
Notes
Copper Pollution Prevention Menu
EnvironmentalCorrosion*
High Water purveyer Copper rule changes Legislative Regional 3.6 3.8 1.7Assess pH Monitoring Local 2.0 3.2 1.5Source identification Monitoring Local 3.3 3.5 1.7
Adjust pHChemical or physical adjustment Regional 2.5 3.8 2.3
Plumbing BMPs Install BMPs Either 2.5 3.3 1.7Modify lead and copper rule Legislative Regional 3.8 3.5 1.7Champion Regional Approach 3.3 3.0 1.7Product substitution (nonCu pipe) Educate plumbers Either 3.0 3.3 1.3BMPs Workshops Local 3.5 3.0 1.3
Water supplyAlgaecide CuSO4* Moderate Local Alternative chemicals Availability of alternative Local 1.8 3.8 3.0
Work with water purveyors Local 1.8 3.5 3.0Atmospheric depositionTailpipe emissions Moderate Air Quality Reduce vehicle use Multilingual brochures Either 2.3 1.3 3.3
Management Posters in stores Either 2.5 1.3 3.3District Carpooling Local 2.0 1.3 3.3
Newspaper articles Either 2.5 1.3 3.3School programs/events Local 2.5 1.3 3.3
Refine emissions requirements Permit requirement Regional 3.8 1.3 3.3
Stormwater
Brake pad wear HighBrake pad partnership Source identification Monitoring Either 3.5 1.0 2.0
Construction site runoff Moderate Discharge limits Permit requirement Local 1.8 1.0 3.3
Infiltration/Inflow* Low StormwaterAlternative brake pad material Work with fleet managers Local 2.4 1.2 3.5
Parking lot runoff Moderate Reduce vehicle use Work with fleet managers Local 2.0 1.3 3.3Architectural Cu ornaments Low BMPs Install BMPs Local 2.0 1.0 3.3
Roof runoff: residential ModerateBuilding requirements for Cu Legislative Regional 3.3 1.0 3.3
Roof runoff: commercial Moderate Provide handbook Either 2.8 1.0 3.3Multilingual brochures Either 2.8 1.0 3.3Posters in stores Either 2.8 1.0 3.3Newspaper articles Either 2.5 1.0 3.3
* Frequently targeted source(1) 1 = low cost, staff time, 5 = hi cost, staff time(2) 1=low ww benefit, 5 = hi ww benefit(3) 1=low non-ww environmental benefit, 5 = hi non-ww environmental benefit
Cu P2 MenuApriil 1, 2005
6

SOURCE EXAMPLES IMPLEMENTATION OPTION EXAMPLES
SOME EFFECTIVENESS MEASUREMENT OPTIONS
Hobbyists Availability of alternative materials Number of locations where alternatives are availableSurvey regarding use of alternatives
Algaecide CuSO4
Availability of alternative chemicals Survey to determine the extent of alternative chemical use
Residential Bill inserts Recognition survey of bill insertsBrake pad wear Carpooling Survey to determine the extent of carpool
useCorrosion Chemical or physical adjustment Influent load change or reduction after
adjustmentHousehold hazardous waste
Collect at local facility Quantity of chemical collected and survey intentions of future alternative use
Vehicle washing Coupons for car washes Number of coupons turned in
Carpet cleaning Educate customers to request clean techniques
Number of requests for clean techniques
Carpet cleaning Educate homeowners to remove shoes Survey to determine shoe-removal practice changes due to education
Corrosion Educate plumbers Percent Cu pipe removed from plumbing system
Commercial Floor drain sealing Number of businesses that switch to zero discharge
Household hazardous waste
Free bus service to dropoff Number using the bus service
Residential Free bus service to workshops Number using the bus serviceFood waste Free composting bins Number distributed and survey to determine
number in useCommercial Green Business Program Number participating in the programCommercial If exceedance, resample at facility's
expenseNumber of exceedances
Commercial and residential
Incentive program Number participating in the program
Stormwater Install BMPs Number of best management practices (BMP) installed
Corrosion Install BMPs Number of BMPs installed, measure influent load change or reduction after installation
Residential Education at job fairs Survey of educational impact on job fair participants
Commercial, corrosion, stormwater
Legislative Has legislature passed? Measure change or reduction of influent load
Commercial Merit certificates Number of certificates issuedCommercial & stormwater
Monitoring Measure influent load change or reduction
Measure the pH level
Copper Pollution Prevention Effectiveness Determination Menu
Copper Effectiveness menu Page 1 of 4 4/1/2005

SOURCE EXAMPLES IMPLEMENTATION OPTION EXAMPLES
SOME EFFECTIVENESS MEASUREMENT OPTIONS
Number of sources identified through monitoring program
Commercial & residential
Multilingual brochures Survey to determine the impact of the brochures
Copper Effectiveness menu Page 2 of 4 4/1/2005

SOURCE EXAMPLES IMPLEMENTATION OPTION EXAMPLES
SOME EFFECTIVENESS MEASUREMENT OPTIONS
Commercial & residential
Newsletters Monitor the response or feedback to the newsletters
Commercial & residential
Newspaper articles Monitor the response or feedback to the newsletters
Commercial & residential
Newspaper notices Survey to determine the impact of the notices
Industrial & commercial
Permit requirement Number of industries and commercial businesses in compliance with their permits
Residential Point of sale work with stores Number of stores participating, survey to determine the number of clients affected
Industrial Posters Survey to determine the impact of the posters
Residential Posters in auto parts stores Survey to determine the impact of the posters
Commercial & residential
Posters in stores Survey to determine the impact of the posters
Wineries Provide drain filters Number of filters installedIndustrial, commercial, stormwater
Provide handbook Number of BMPs in use
Vehicle service Provide inspection form Observe trends in completed inspection forms
Residential Public event participation Number participating in the eventResidential Public meetings Number participating in the meeting
Recognition program Number participating in the programSurvey the reduction in chemical use due to the program
Residential School programs/events Quiz scores indicate new knowledge acquiredTeacher evaluations of the program
Site inspections Number requiring follow-up inspections or other workNumber of sources identified and controlled
Vehicle service Technical workshops Quiz scores indicate new knowledge acquired
Cu chemicals Telephone, mail Survey to determine the impact of the phone calls and mailings
Vehicle service Trade Association workshops Number participating in the workshopsResidential Treatment Plant tours Quiz scores indicate new knowledge
acquiredVehicle service Voluntary programs Number participating in voluntary programs
Residential Web page Survey to determine the impact of the web page
Brake pad wear Work with fleet managers Measure the percent reduction in vehicle hoursMeasure the reduction in vehicle mileage
Cu chemicals Work with stores to reduce chemical use and sale
Number of stores and store employees participating
Industrial & commercial
Industrial & commercial
Copper Effectiveness menu Page 3 of 4 4/1/2005

SOURCE EXAMPLES IMPLEMENTATION OPTION EXAMPLES
SOME EFFECTIVENESS MEASUREMENT OPTIONS
Corrosion Work with water purveyors Track changes or reductions in water corrosivity
Industrial, commercial, residential, corrosion
Workshops Number participating in the workshops
Survey to determine behavioral changes due to workshopsMeasure the percent reduction in vehicle hoursMeasure influent load changes or reduction
Quiz scores indicate new knowledge acquired
Copper Effectiveness menu Page 4 of 4 4/1/2005

POTENTIAL SOURCE EXISTING RESOURCES
PARTNERING OPPORTUNITIES
POLLUTION PREVENTION STRATEGIES
IMPLEMENTATION OPTIONS
REGIONAL/LOCAL
Cost & Resources Needed (1)
Wastewater P2 Benefit
(2)
Other Environ-mental
Benefit (3)
Notes
IndustrialManufacturing
Caustic soda: mercury cell* Low BMPs Include requirements in permits Local 2.5 3.0 4.5
Electronics industries Low Cease production of product 3.0 1.0 2.5Electroplaters Moderate Phase out use 3.0 1.3 2.5Adhesives / sealants Low Pretreatment
Cement manufacturing Low National mercury labeling requirement Legislative Regional 3.5 3.0 4.5
Glass products Low Recycling Recognition program Either 1.7 1.7 3.0
Lime manufacturing Low Alternative production methods
Incentive programs for industries Either 3.5 3.0 4.5
Mercury compounds production Low Use alternative materials Industry outreach / education Either 2.0 2.5 4.5
Iron & steel manufacturing Moderate Establish a spill response plan Workshops Local 2.5 2.0 4.0
Paper manufacturing Moderate Proper disposal 2.3 1.7 3.0
Secondary mercury production Low Inventory 4.0
Bookbinding LowPlating and polishing Low 2.0 1.0 2.5Pulp mills Moderate 2.0 1.0 2.5Thermal power generation Low
Mercury Pollution Prevention Menu
* Frequently targeted source(1) 1=low cost, staff time 5=hi cost, staff time(2) 1= low ww beneft, 5=hi ww benefit(3) 1=low non-ww environmental benefit, 5=hi non-ww environmental benefit
Hg P2 MenuApril 1, 2005
1

POTENTIAL SOURCE EXISTING RESOURCES
PARTNERING OPPORTUNITIES
POLLUTION PREVENTION STRATEGIES
IMPLEMENTATION OPTIONS
REGIONAL/LOCAL
Cost & Resources Needed (1)
Wastewater P2 Benefit
(2)
Other Environ-mental
Benefit (3)
Notes
Mercury Pollution Prevention Menu
Chemicals
Alkalies and chlorine* Moderate Alternative production methods
Include requirements in permits Local 1.5 3.0 4.5
Laboratories Moderate Improve operation efficiency 1.7 1.0 2.0Industrial laundries High Modify processes 1.7 1.0 2.0
Acid mine drainage Moderate Alternative feedstock chemicals
Boiler chemicals Moderate PretreatmentChemical manufacturing Low BMPs 1.5 1.0 2.5Copper ores Low Safe recycling or disposal
Ferric chloride Low Alternative materials Incentive programs for industries Either 3.5 3.0 4.5
Fungicides for seeds and turf Moderate Cease production of product Recognition program Either 2.0 2.0 4.0
Industrial chemicals Low Clean wastewater system, remove Hg
Industry outreach / education Either 2.0 2.5 4.0
Pesticides High Establish a spill response plan Workshops Local 2.0 1.7 3.0
Polymers Low National mercury labeling requirement 2.0 1.7 3.0
Potassium hydroxide Low Practice sound management 2.0 1.7 3.0
Preservatives Moderate 1.5 1.0 2.5Sodium bisulfate Low 1.5 1.0 2.5Sodium hydroxide Low 1.5 1.0 2.5Sodium hypochlorite Low 1.5 1.0 2.5Sulfuric acid Low 1.5 1.0 2.5Wastewater treatment defoamants Moderate 1.7 1.7 2.5
Wastewater treatment polymers Moderate 1.7 1.7 2.5
Boilers (electric utility) ModerateBoilers (non-utility) ModerateCooling towers High 2.5 1.0 2.5Photofinishing labs High 2.0 1.0 2.0
* Frequently targeted source(1) 1=low cost, staff time 5=hi cost, staff time(2) 1= low ww beneft, 5=hi ww benefit(3) 1=low non-ww environmental benefit, 5=hi non-ww environmental benefit
Hg P2 MenuApril 1, 2005
2

POTENTIAL SOURCE EXISTING RESOURCES
PARTNERING OPPORTUNITIES
POLLUTION PREVENTION STRATEGIES
IMPLEMENTATION OPTIONS
REGIONAL/LOCAL
Cost & Resources Needed (1)
Wastewater P2 Benefit
(2)
Other Environ-mental
Benefit (3)
Notes
Mercury Pollution Prevention Menu
Combustion
Fuel / gasoline burning Moderate Air pollution Pretreatment Include requirements in permits Local 2.0 1.0 3.7
Coal combustion Moderate Air pollution Reduce levels of Hg in products incinerated 2.3 1.0 3.3
Crematories Low BMPs Industry outreach / education Either 2.0 1.0 4.7 Not a wastewater
source.
Incinerators (hazardous waste, medical waste, municipal waste) High Air pollution Discourage burning of treated
wood 2.5 1.0 5.0
ProductionSemiconductors High Alternative materials Product bans Regional 3.3 2.3 2.7
Fireworks Low Conventional controls to lower Hg emissions
Work with manufacturers Regional 3.0 3.5
Metal finishing Moderate Alternative production methods 2.7 1.0 2.7
Proper equipment disposal Industry outreach / education Either 2.0 1.0 3.0
* Frequently targeted source(1) 1=low cost, staff time 5=hi cost, staff time(2) 1= low ww beneft, 5=hi ww benefit(3) 1=low non-ww environmental benefit, 5=hi non-ww environmental benefit
Hg P2 MenuApril 1, 2005
3

POTENTIAL SOURCE EXISTING RESOURCES
PARTNERING OPPORTUNITIES
POLLUTION PREVENTION STRATEGIES
IMPLEMENTATION OPTIONS
REGIONAL/LOCAL
Cost & Resources Needed (1)
Wastewater P2 Benefit
(2)
Other Environ-mental
Benefit (3)
Notes
Mercury Pollution Prevention Menu
CommercialDentists* High CDA Amalgam management Business outreach Either 2.1 2.8 2.2
Local Amalgam separators Workshops Either 2.3 3.0 2.2
Dental Societies Clean wastewater system, remove Hg Certifications Local 2.2 3.5 2.3
Permit requirement Local 2.2 2.8 2.0
Recognition program Either 2.4 2.3 1.5
Laboratories Moderate Ban hazardous items Legislative Regional 2.3 2.3 2.2
Educational facility Moderate Install and maintain drain traps Business outreach Either 2.3 2.3 2.0
Medical/hospital* High DTSC HELP program
Remove mercury containing items Workshops Either 2.6 2.6 2.0
Certifications Local 2.7 3.0 3.0Laundries Moderate Install graywater system Incentive program Either 2.3 2.0 1.7Switches High Proper equipment disposal Workshops Local 1.6 2.0 2.8
Veterinary clinics Moderate Remove mercury containing items Recognition program Local 2.0 2.3 2.0
Clean wastewater system, remove Hg 1.5 1.5 2.0
Alternative materials 1.5 1.5 2.0Recycle bulk mercury 1.3 2.0 2.3Proper equipment disposal 2.0 2.5 2.3
Vehicle service facilities High Clean wastewater system, remove Hg Business outreach Either 2.6 2.0 2.3
Alternative materials Workshops Either 2.2 1.4 1.8Proper equipment disposal Certifications Local 2.0 1.4 1.8Sweep floors before washing Permit requirement Local 1.6 2.0 2.5
Recognition program Either 1.8 1.7 2.3
Sidewalk / street power washing High Stormwater Sweep streets/sidewalks before washing
Educate City employees Local 1.6 1.2 2.2
BMPs
* Frequently targeted source(1) 1=low cost, staff time 5=hi cost, staff time(2) 1= low ww beneft, 5=hi ww benefit(3) 1=low non-ww environmental benefit, 5=hi non-ww environmental benefit
Hg P2 MenuApril 1, 2005
4

POTENTIAL SOURCE EXISTING RESOURCES
PARTNERING OPPORTUNITIES
POLLUTION PREVENTION STRATEGIES
IMPLEMENTATION OPTIONS
REGIONAL/LOCAL
Cost & Resources Needed (1)
Wastewater P2 Benefit
(2)
Other Environ-mental
Benefit (3)
Notes
Mercury Pollution Prevention Menu
Portable toilets Low Alternative chemicals Business outreach Either 1.5 2.5 3.0
Septage haulers Low Clean wastewater system, remove Hg Recognition program Either 1.8 1.5 2.0
Sewer flushing LowLong-term source control to lower concentrations in the environment
Incentive program Either 2.5 2.0 2.3
Sewerage systems Low Alternative materials Workshops Local 2.0 1.7 2.3Automobiles (switches, lamps, batteries) Low Proper equipment disposal 1.7 1.7 2.3
Batteries Moderate Alternative production methods Certifications Local 1.8 2.6 3.3
Electricity measurement instruments Low Permit requirement Local 1.3 2.3 3.3
Gauges Low Ban hazardous items Legislative Regional 2.0 2.6 3.0Pottery glaze Moderate 1.5 1.0 2.0Kaolin & ball clay Moderate 1.5 1.0 2.0Latex paint Moderate 1.5 1.5 2.5Office machines Low 1.5 1.5 2.5Pharmaceutical products Low 1.5 1.5 2.5Plastics products Low 1.5 1.5 2.5Printing ink Moderate 1.7 1.3 2.0Rubber products Moderate 1.7 1.3 2.0Small arms ammunition Low 1.3 1.3 2.0Sphygiometers Low 1.5 1.5 2.5Thermostats Moderate 1.3 2.0 2.7Wood products Low 1.5 1.5 2.5Scrap dealers Low 1.5 1.5 2.5
* Frequently targeted source(1) 1=low cost, staff time 5=hi cost, staff time(2) 1= low ww beneft, 5=hi ww benefit(3) 1=low non-ww environmental benefit, 5=hi non-ww environmental benefit
Hg P2 MenuApril 1, 2005
5

POTENTIAL SOURCE EXISTING RESOURCES
PARTNERING OPPORTUNITIES
POLLUTION PREVENTION STRATEGIES
IMPLEMENTATION OPTIONS
REGIONAL/LOCAL
Cost & Resources Needed (1)
Wastewater P2 Benefit
(2)
Other Environ-mental
Benefit (3)
Notes
Mercury Pollution Prevention Menu
ResidentialHousehold Products
Fluorescent light tubes High Local HHW Programs Ban Hg thermometers Legislative Regional 3.2 2.2 2.8
An airborne source, but not a significant source to POTWs. An opportunity to address a somewhat significant controllable source and a good opportunity from a collaborative viewpoint. 2006 disposal ban.
Thermometers* High Other Local agencies Alternative materials Public outreach /
education Either 2.4 2.1 2.5
Contact lens solutions High Promote non-Hg thermometers Coupons Local 2.3 2.3 3.3
Deodorant Low Practice energy efficiencyImplement thermometer exchange program
Local 2.0 2.7 3.7
Food coloring Low Point-of-sale brochures Local 2.3 2.3 3.3
Carburetor tuning kit Low Proper disposal of old/broken items
Household hazardous waste program
Either 2.3 2.7 3.7
Mouthwash Low 1.0 1.5 3.0Perfumes, cosmetics Low 1.0 1.5 3.0Toilet paper Low 1.0 1.5 3.0Toothpaste Low 1.0 1.5 3.0Paint Low 1.0 1.5 3.0DentalDental fillings High Uncontrollable 1.3 1.3 1.0Human wastes (amalgam)* Low 1.0 1.0 1.0Cleaning Products
Cleaners Low Alternative materials Public outreach / education Either 1.8 2.2 2.5
Dish detergent Low Product removal Outreach to stores Either 2.0 2.0 2.3
Dishwater detergent Low Cease production of product Outreach to manufacturers Regional 2.0 2.3 2.7
Drain cleaners Low 1.7 1.3 1.5Laundry detergent Low 1.7 1.3 1.5Shampoo Low 1.7 1.3 1.0Shaving cream Low 1.7 1.3 1.0Soaps Low 1.7 1.3 1.0Bleach Low 1.7 1.3 1.0
* Frequently targeted source(1) 1=low cost, staff time 5=hi cost, staff time(2) 1= low ww beneft, 5=hi ww benefit(3) 1=low non-ww environmental benefit, 5=hi non-ww environmental benefit
Hg P2 MenuApril 1, 2005
6

POTENTIAL SOURCE EXISTING RESOURCES
PARTNERING OPPORTUNITIES
POLLUTION PREVENTION STRATEGIES
IMPLEMENTATION OPTIONS
REGIONAL/LOCAL
Cost & Resources Needed (1)
Wastewater P2 Benefit
(2)
Other Environ-mental
Benefit (3)
Notes
Mercury Pollution Prevention Menu
Food Products
Canned tuna/meat ModerateLong-term source control to lower concentrations in the environment
Public outreach / education Either 2.7 1.3 2.7
Eggs Low 2.0 1.5 3.0Condiments Low 2.0 1.5 3.0Foodwaste Low 2.0 1.5 3.0Fresh fruit & vegetables Low 2.0 1.5 3.0Fresh seafood & meats Moderate 2.0 1.5 3.0Frozen & canned vegetables Low 2.0 1.5 3.0Fruit juice Low 2.0 1.5 3.0Rice Low 2.0 1.5 3.0Salt Low 2.0 1.5 3.0Soft drinks and mixes Low 2.0 1.5 3.0Sugar Low 2.0 1.5 3.0Non-dairy creamer Low 2.0 1.5 3.0Other
Electric lamp breakage Moderate Proper disposal of old/broken items
Public outreach / education Either 2.0 1.3 2.7
Laundry graywater ModerateLong-term source control to lower concentrations in the environment
Either 2.3 2.0 2.0
Graywater system Incentive program 2.0 2.0 2.0
Electricity consumption Low PG&E, local utilities Practice energy efficiency 1.7 1.3 2.7
Human wastes (dietary intake) Low Uncontrollable 1.7 1.3 1.3
Motor oil leakage Low Minimize and/or contain leaks Public outreach / education Either 2.8 1.8 1.8
Athletic shoes, lighted ModerateHousehold hazardous waste program
2.5 1.0 1.0
Novelty items Low 2.5 1.0 1.0Used motor oil Moderate 2.0 1.0 1.0Chemistry sets, older toys and games Low 2.0 1.0 1.0
* Frequently targeted source(1) 1=low cost, staff time 5=hi cost, staff time(2) 1= low ww beneft, 5=hi ww benefit(3) 1=low non-ww environmental benefit, 5=hi non-ww environmental benefit
Hg P2 MenuApril 1, 2005
7

POTENTIAL SOURCE EXISTING RESOURCES
PARTNERING OPPORTUNITIES
POLLUTION PREVENTION STRATEGIES
IMPLEMENTATION OPTIONS
REGIONAL/LOCAL
Cost & Resources Needed (1)
Wastewater P2 Benefit
(2)
Other Environ-mental
Benefit (3)
Notes
Mercury Pollution Prevention Menu
Environmental
Atmospheric deposition Moderate Air pollutionLong-term source control to lower concentrations in the environment
Public outreach / education Regional 2.7 1.0 3.7
Natural erosion and reservoir spills Low 1.0 1.0 1.0
Volcanoes Low Uncontrollable 1.0 1.0 1.0 DTSC estimates 40% from volcanism.
Water supply Low Water purveyers 1.0 1.0 1.0
Forest fires Low 1.0 1.0 1.0StormwaterConstruction erosion Moderate Stormwater BMPs Permit requirement Local 1.7 1.3 2.7
Sediment erosion ModerateLong-term source control to lower concentrations in the environment
Public outreach / education Either 2.7 1.7 3.0
Stormwater runoff High Stormwater 3.3 1.0 2.7
* Frequently targeted source(1) 1=low cost, staff time 5=hi cost, staff time(2) 1= low ww beneft, 5=hi ww benefit(3) 1=low non-ww environmental benefit, 5=hi non-ww environmental benefit
Hg P2 MenuApril 1, 2005
8

SOURCE EXAMPLES IMPLEMENTATION OPTION EXAMPLES
SOME EFFECTIVENESS MEASUREMENT OPTIONS
Commercial Business outreach Compile inventory of products on shelves
Outreach to stores Reduction in salesDentists Dentist education Measure quantity of amalgam recycled
Measure quantity of amalgam usedSurvey dentists on practices usedNumber of amalgam separators installed
Permit dentists Permit complianceMeasure dental waste
Industrial Incentive programs for industries Measure concentrations in products Industry outreach / education Measure concentrations in collection
systemsMeasure concentrations in drainageMeasure concentrations in products Measure concentrations in emissions
Work with manufacturers Measure concentrations in productsIndustrial & commercial
Certifications Best management practice implementation rates
Include requirements in permits Compile inventory of products on shelvesMeasure concentrations in facility dischargesMeasure concentrations in products Measure smokestack emissions
Recognition programs Number participatingOther exchange programs Measure concentrations in collection
systemsPermits Measure concentrations in collection
systemsPermit compliance
Product bans Product removal from inventoryWorkshops Measure concentrations in collection
systemsLaundries Outreach to laundries Measure concentrations in laundry
graywaterManufacturers Outreach to manufacturers Measure concentrations in residential
wastewaterResidential Food advisories Track reported sales
Household hazardous waste program Quantity turned inOutreach to public Measure concentrations in products Point-of-sale brochures Number distributed
Track reported salesPublic outreach / education Survey change in product use
Track reduction in salesResidential & commercial
Coupons Number used
Mercury Pollution Prevention Effectiveness Evaluation Menu
Mercury Effectiveness Evaluation Menu Page 1 of 2 April 1, 2004

SOURCE EXAMPLES IMPLEMENTATION OPTION EXAMPLES
SOME EFFECTIVENESS MEASUREMENT OPTIONS
Implement thermometer exchange program Number of thermometers exchanged
Stormwater Stormwater best management practices Measure concentrations in runoff
Mercury Effectiveness Evaluation Menu Page 2 of 2 April 1, 2004

POTENTIAL SOURCE EXISING RESOURCES
PARTNERING OPPORTUNITIES
POLLUTION PREVENTION STRATEGIES IMPLEMENTATION OPTIONS REGIONAL/
LOCAL
Cost & Resources Needed (1)
Wastewater P2 Benefit
(2)
Other Environ-mental
Benefit (3)
Notes
ResidentialActive PesticidesFood waste Low Alternative products Public outreach / education Either 2.3 1.5 2.7Household pesticides: mothproofing, termites * High Integrated Pest
Management Highway billboards Either 2.7 2.3 3.7
Stored pesticides Low Proper use education Public service announcements Regional 2.3 2.4 3.3
Phase out use Newspaper articles Either 2.0 2.4 3.3
Use flea / tick comb Speakers for community groups Either 2.0 2.4 3.3
Movie theater slides Local 2.0 2.2 3.0School programs Either 2.0 2.2 3.0Master Gardener workshops Regional 2.0 2.6 3.5Public event displays Local 2.0 2.4 3.3Regional recognition program Regional 2.0 2.4 3.3
Cancel registration of chemical Legislative Regional 3.0 2.3 3.0
Banned PesticidesAnt / flea / grub control (diazinon) High Stormwater Public education regarding
alternative Regional recognition program Regional 1.7 1.8 2.7
Flea and tick treatment (lindane) High Local agencies Alternative products Conduct training for City staff Local 1.7 1.5 2.3
Head lice / scabies control (lindane) High Department of Provide disposal options Household hazardous waste
collection Local 2.7 2.3 3.3
Moth control (lindane) High Pesticde Proper disposal education Public event displays Local 1.7 1.8 3.0
Older wool clothing (dieldrin) Low Regulation Use flea / tick comb Education Either 2.3 1.5 2.3
Residential use (diazinon) Moderate Point-of-sale brochures Local 1.7 2.0 3.0Water supply (dieldrin) Low Training programs Local 2.3 2.3 3.3Food waste Low 1.5 1.3 2.5Household pesticide: mothproofing, termites (dieldrin)
High 1.5 1.3 2.5
Human waste Low 1.5 1.3 2.5Stored pesticides Low 1.5 1.3 2.5
Pesticide Pollution Prevention Menu
* Frequently targeted source(1)1=low cost, staff time, 5=high cost,staff time(2)1=low ww benefit, 5=hi ww benefit(3) 1=low non-ww environmental benefit, 5=hi non-ww environmental benefit
Pesticide P2 MenuApril 1, 2004
1
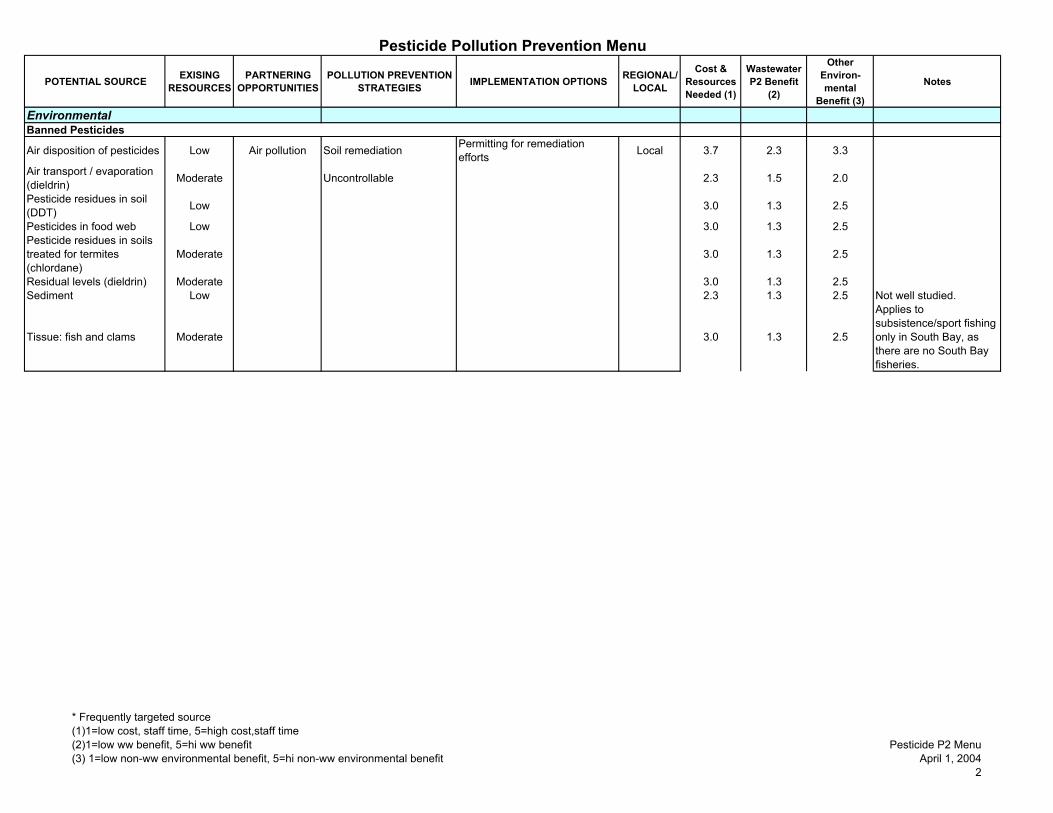
POTENTIAL SOURCE EXISING RESOURCES
PARTNERING OPPORTUNITIES
POLLUTION PREVENTION STRATEGIES IMPLEMENTATION OPTIONS REGIONAL/
LOCAL
Cost & Resources Needed (1)
Wastewater P2 Benefit
(2)
Other Environ-mental
Benefit (3)
Notes
Pesticide Pollution Prevention Menu
EnvironmentalBanned Pesticides
Air disposition of pesticides Low Air pollution Soil remediation Permitting for remediation efforts Local 3.7 2.3 3.3
Air transport / evaporation (dieldrin) Moderate Uncontrollable 2.3 1.5 2.0
Pesticide residues in soil (DDT) Low 3.0 1.3 2.5
Pesticides in food web Low 3.0 1.3 2.5Pesticide residues in soils treated for termites (chlordane)
Moderate 3.0 1.3 2.5
Residual levels (dieldrin) Moderate 3.0 1.3 2.5Sediment Low 2.3 1.3 2.5 Not well studied.
Tissue: fish and clams Moderate 3.0 1.3 2.5
Applies to subsistence/sport fishing only in South Bay, as there are no South Bay fisheries.
* Frequently targeted source(1)1=low cost, staff time, 5=high cost,staff time(2)1=low ww benefit, 5=hi ww benefit(3) 1=low non-ww environmental benefit, 5=hi non-ww environmental benefit
Pesticide P2 MenuApril 1, 2004
2

POTENTIAL SOURCE EXISING RESOURCES
PARTNERING OPPORTUNITIES
POLLUTION PREVENTION STRATEGIES IMPLEMENTATION OPTIONS REGIONAL/
LOCAL
Cost & Resources Needed (1)
Wastewater P2 Benefit
(2)
Other Environ-mental
Benefit (3)
Notes
Pesticide Pollution Prevention Menu
CommercialActive Pesticides
Algicides (tributyltin oxide) High Alternative products Public outreach / education Either 3.3 1.8 2.0
TBT is a de-minimus source banned in the 9 county Bay area for several years.
Apartment buildings (tributyltin) Low Integrated Pest
Management Newsletters 2.7 2.3 3.0
Carpet cleaners (tributyltin oxide) Moderate Proper use education Highway billboards Either 3.3 2.3 3.0
Commercial facilities / pest control (tributyltin oxide)* Moderate Public service announcements Regional 2.7 2.0 2.7
Cooling towers + cooling water additive (tributyltin)* High Newspaper articles Either 2.7 2.0 2.7
Boatyards (tributyltin) Moderate School programs Either 2.7 1.8 2.3Janitorial services (tributyltin) High Speakers for community groups Either 2.7 2.0 2.7
Kennels (diazinon) Moderate Training programs Local 3.3 2.5 3.3
Medical facilities (tributyltin) Low Movie theater slides Local 2.7 1.8 2.3
Office buildings (tributyltin) Public event displays Local 2.7 2.0 2.7
Pest control operators (diazinon)* High Regional recognition program Regional 2.7 2.0 2.7
Pet care / groomers (lindane)* High Phase out use Create annual report of
pesticide use Local 2.5 2.3 3.0
Pet wash center (self-service, diazinon) Moderate Cancel registration of
chemical Legislative Regional 3.0 2.3 3.7
Pharmacies (lindane) Low 2.0 1.3 3.0Schools (tributyltin) Low 2.0 1.3 3.0
Shopping centers (tributyltin) Low 2.0 1.3 3.0
TBT is a de-minimus source banned in the 9 county Bay area for several years.
Structural pest control (diazinon)* High 2.0 1.3 3.0
Supermarkets (tributyltin) Low 2.0 1.3 3.0
* Frequently targeted source(1)1=low cost, staff time, 5=high cost,staff time(2)1=low ww benefit, 5=hi ww benefit(3) 1=low non-ww environmental benefit, 5=hi non-ww environmental benefit
Pesticide P2 MenuApril 1, 2004
3
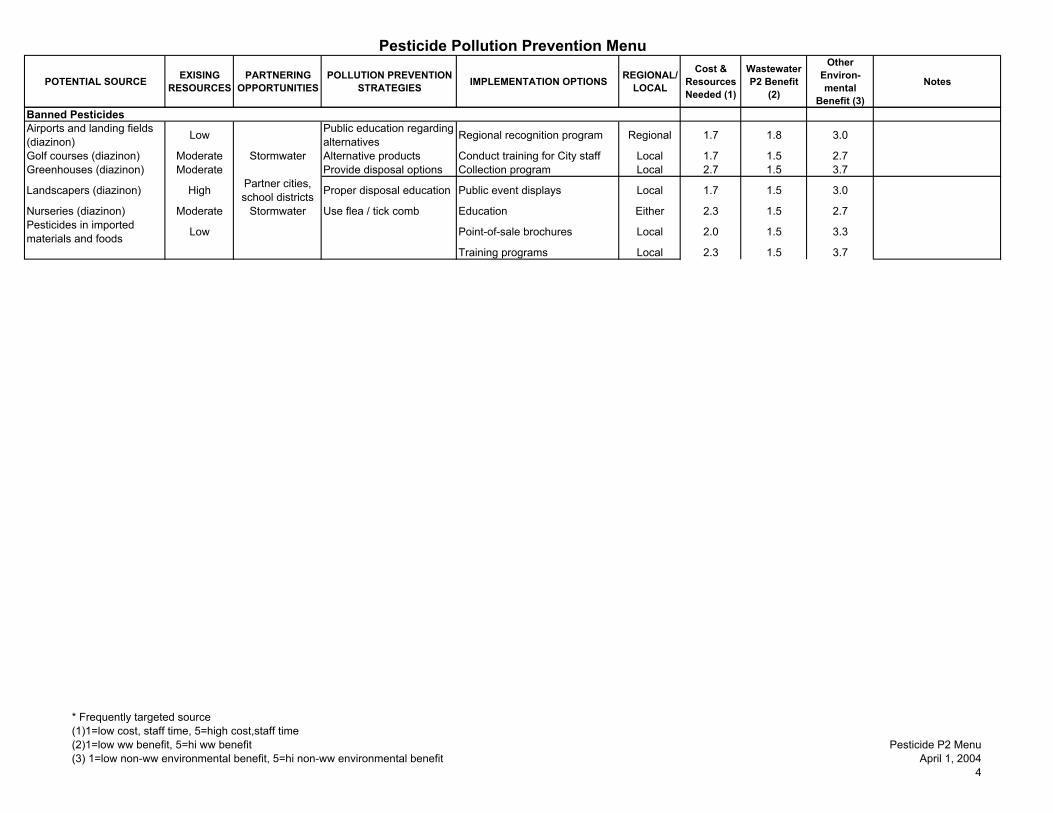
POTENTIAL SOURCE EXISING RESOURCES
PARTNERING OPPORTUNITIES
POLLUTION PREVENTION STRATEGIES IMPLEMENTATION OPTIONS REGIONAL/
LOCAL
Cost & Resources Needed (1)
Wastewater P2 Benefit
(2)
Other Environ-mental
Benefit (3)
Notes
Pesticide Pollution Prevention Menu
Banned PesticidesAirports and landing fields (diazinon) Low Public education regarding
alternatives Regional recognition program Regional 1.7 1.8 3.0
Golf courses (diazinon) Moderate Stormwater Alternative products Conduct training for City staff Local 1.7 1.5 2.7Greenhouses (diazinon) Moderate Provide disposal options Collection program Local 2.7 1.5 3.7
Landscapers (diazinon) High Partner cities, school districts Proper disposal education Public event displays Local 1.7 1.5 3.0
Nurseries (diazinon) Moderate Stormwater Use flea / tick comb Education Either 2.3 1.5 2.7Pesticides in imported materials and foods Low Point-of-sale brochures Local 2.0 1.5 3.3
Training programs Local 2.3 1.5 3.7
* Frequently targeted source(1)1=low cost, staff time, 5=high cost,staff time(2)1=low ww benefit, 5=hi ww benefit(3) 1=low non-ww environmental benefit, 5=hi non-ww environmental benefit
Pesticide P2 MenuApril 1, 2004
4

POTENTIAL SOURCE EXISING RESOURCES
PARTNERING OPPORTUNITIES
POLLUTION PREVENTION STRATEGIES IMPLEMENTATION OPTIONS REGIONAL/
LOCAL
Cost & Resources Needed (1)
Wastewater P2 Benefit
(2)
Other Environ-mental
Benefit (3)
Notes
Pesticide Pollution Prevention Menu
IndustrialActive PesticidesCleaning water Low Alternative products Workshops Local 2.0 2.8 3.3
Cooling towers (tributyltin)* High Phase out use Permit requirement Local 1.3 2.8 3.3
Dairy farm milk handling facility (diazinon) Low Proper use education Public outreach / education Either 2.3 2.0 2.3
Food processing / handling (diazinon) Low Cancel registration of
chemical Legislative Regional 2.7 2.3 3.3
Hazardous waste management High 1.5 1.3 2.5
Landfills High Stormwater 1.5 1.3 2.5Water treatment plant effluent High 1.5 1.3 2.5
Banned Pesticides
Cleaning water Low Public education regarding alternatives Regional recognition program Regional 1.7 1.8 2.0
Hazardous waste management High Alternative products Conduct training for City staff Local 1.7 1.5 1.7
Landfills High Stormwater Proper disposal education Training programs Local 2.7 2.3 2.7
Water treatment plant effluent High Provide disposal options Collection program Local 2.7 2.3 2.7
* Frequently targeted source(1)1=low cost, staff time, 5=high cost,staff time(2)1=low ww benefit, 5=hi ww benefit(3) 1=low non-ww environmental benefit, 5=hi non-ww environmental benefit
Pesticide P2 MenuApril 1, 2004
5

POTENTIAL SOURCE EXISING RESOURCES
PARTNERING OPPORTUNITIES
POLLUTION PREVENTION STRATEGIES IMPLEMENTATION OPTIONS REGIONAL/
LOCAL
Cost & Resources Needed (1)
Wastewater P2 Benefit
(2)
Other Environ-mental
Benefit (3)
Notes
Pesticide Pollution Prevention Menu
ProductsActive Pesticides126 active pesticides / herbicides High Alternative products Workshops Local 2.3 2.3 3.3
Anti-fouling paints (tributyltin) Moderate Phase out use Permit requirement Local 1.7 2.3 3.3
Fungicide (Tributyltin Benzoate) Low Proper use education Public outreach / education Either 2.7 1.5 2.3
Marine paint (Tributyltin Methacrylate) Moderate Cancel registration of
chemical Legislative Regional 2.7 2.3 3.3
Material preservative (Tri-n-butyltin maleate) Low 1.5 1.3 2.5
Paint additive (tributyltin oxide) Low 1.5 1.3 2.5
Toilet bowl cleaner (tributyltin oxide) Low 1.5 1.3 2.5
Wood preservative (tributyltin oxide) Low 1.5 1.3 2.5
Wood protective treatment (diazinon) Low 1.5 1.3 2.5
Banned PesticidesSoil & turf insect control (diazinon) Moderate Alternative products Education Either 2.3 1.5 2.3
Regional recognition program Regional 1.7 1.5 2.7Provide disposal options Collection program Local 2.7 1.5 3.3
* Frequently targeted source(1)1=low cost, staff time, 5=high cost,staff time(2)1=low ww benefit, 5=hi ww benefit(3) 1=low non-ww environmental benefit, 5=hi non-ww environmental benefit
Pesticide P2 MenuApril 1, 2004
6

POTENTIAL SOURCE EXISING RESOURCES
PARTNERING OPPORTUNITIES
POLLUTION PREVENTION STRATEGIES IMPLEMENTATION OPTIONS REGIONAL/
LOCAL
Cost & Resources Needed (1)
Wastewater P2 Benefit
(2)
Other Environ-mental
Benefit (3)
Notes
Pesticide Pollution Prevention Menu
StormwaterBanned PesticidesStorm water inflow (dieldrin)* Moderate Stormwater BMPs Permit stormwater discharges Local 1.7 1.5 3.0
* Frequently targeted source(1)1=low cost, staff time, 5=high cost,staff time(2)1=low ww benefit, 5=hi ww benefit(3) 1=low non-ww environmental benefit, 5=hi non-ww environmental benefit
Pesticide P2 MenuApril 1, 2004
7

POTENTIAL SOURCE EXISING RESOURCES
PARTNERING OPPORTUNITIES
POLLUTION PREVENTION STRATEGIES IMPLEMENTATION OPTIONS REGIONAL/
LOCAL
Cost & Resources Needed (1)
Wastewater P2 Benefit
(2)
Other Environ-mental
Benefit (3)
Notes
Pesticide Pollution Prevention Menu
AgriculturalActive PesticidesAgricultural pesticides* High Stormwater Permit discharge Fines for non-compliance Local 2.0 1.5 2.0Livestock spray (lindane) Moderate Stormwater Phase out use Workshops Local 2.7 1.5 3.0Screwworm & ear tick killer (lindane) Moderate Stormwater Alternative products Public outreach / education Either 3.0 1.5 2.7
Bee farming (diazinon) Moderate Stormwater Proper use education Training programs Local 3.0 1.5 3.7Root and top dip for non-food plants Moderate Stormwater Public service announcements Regional 2.3 1.5 3.0
Newspaper articles Either 2.3 1.5 3.0Public event displays Local 2.3 1.5 3.0
Cancel registration of chemical Legislative Regional 3.3 2.3 3.7
Banned PesticidesAgriculture pesticides (dieldrin) High Stormwater Alternative products Education Either 3.0 1.5 2.7
Corn + citrus pesticide (dieldrin) Moderate Stormwater Regional recognition program Regional 2.3 1.5 3.0
Seed coat (dieldrin) Moderate Stormwater Provide disposal options Collection program Local 3.3 1.5 3.7Tse tse fly & termite spray (dieldrin) Moderate Stormwater 2.5 1.3 3.0
Root and top dip for non-food plants (dieldrin) Moderate Stormwater 2.5 1.3 3.0
* Frequently targeted source(1)1=low cost, staff time, 5=high cost,staff time(2)1=low ww benefit, 5=hi ww benefit(3) 1=low non-ww environmental benefit, 5=hi non-ww environmental benefit
Pesticide P2 MenuApril 1, 2004
8

POTENTIAL SOURCE EXISING RESOURCES
PARTNERING OPPORTUNITIES
POLLUTION PREVENTION STRATEGIES IMPLEMENTATION OPTIONS REGIONAL/
LOCAL
Cost & Resources Needed (1)
Wastewater P2 Benefit
(2)
Other Environ-mental
Benefit (3)
Notes
Pesticide Pollution Prevention Menu
AllActive PesticidesHuman waste (dieldrin) Low Alternative products Public outreach / education Either 1.0 1.0 1.0
Public buildings (diazinon) Low Integrated Pest Management Highway billboards Either 3.0 2.0 3.3
Structural (diazinon) Low Proper use education Public service announcements Regional 2.3 1.8 3.0
Water supply Low Regional Phase out use Newspaper articles Either 2.3 1.8 3.0School programs Either 2.3 1.5 2.7Movie theater slides Local 2.3 1.5 2.7
Speakers for community groups Either 2.3 1.8 3.0
Cancel registration of chemical Legislative Regional 4.5 2.3 5.0
Banned PesticidesHuman waste (dieldrin) Low Alternative products Movie theater slides Local 2.3 1.5 2.7Parks, recreation areas (diazinon) Moderate Stormwater Master Gardener workshops Regional 2.3 2.0 3.3
Water supply Low Regional Point-of-sale brochures Either 2.7 2.0 3.3Provide disposal options Collection program Local 3.3 2.3 3.7
* Frequently targeted source(1)1=low cost, staff time, 5=high cost,staff time(2)1=low ww benefit, 5=hi ww benefit(3) 1=low non-ww environmental benefit, 5=hi non-ww environmental benefit
Pesticide P2 MenuApril 1, 2004
9

SOURCE EXAMPLES IMPLEMENTATION OPTION EXAMPLES
SOME EFFECTIVENESS MEASUREMENT OPTIONS
Quiz scores indicate new knowledge acquiredSurvey to determine changes in pesticide use
Commercial Create annual report of City pesticide use Track trends of pesticide use
Residential, commercial, agricultural
Displays at farmer's markets, community events, and corporate fairs
Survey for recognition and changes in pesticide use
Residential, commercial, all
Highway billboards with education about Integrated Pest Management (IPM) plans
Number of new IPM plans generated
Residential & commercial
Implement regional recognition program Number participating in recognition program
Residential, all Master Gardener workshops Number of people attending the workshops
Residential, commercial, all
Movie theater slides Survey for recognition and changes in pesticide use
Residential, commercial, all
Newspaper articles Survey for recognition and changes in pesticide use
Commercial Newsletters Number of people reached via newsletters
Survey for changes in pesticide useIndustrial Permit pesticides in industrial waste Permit compliance ratesStormwater Permit stormwater discharges Monitor stormwater, track changesEnvironmental Permitting for remediation efforts Monitor runoff, track changes
Phase out use Measure concentration changes in soil, food web, and atmospheric depositionMonitor influent and effluent concentration changes
Industrial Phase out use in industry Monitor collection system concentration changes
Point-of-sale brochures Survey for recognition and changes in pesticide useRequest sales data from hardware stores, track changes in pesticide sales
Every source Public outreach / education Survey for recognition and changes in pesticide use
Residential, commercial, agricultural, all
Public service announcements Survey to determine the effect of the announcements
Agriculture Require phase-out of certain agricultural pesticides, with fines for non-compliance
Inventory the pesticides stored on farms, track changes
School programs Request teacher evaluations of the program
Track changes or reduction in pesticide sales
Residential, commercial, all
Speakers for community groups Track trends in pesticide use
Conduct training for City staff, partner cities, school district staff regarding pest control issues
Pesticide Pollution Prevention Effectiveness Evaluation Menu
Industrial & commercial
Residential, commercial, agricultural, all
Residential, commercial, all
Residential, commercial, all
Pesticide Effectiveness Evaluation menu Page 1 of 2 April 1, 2005

SOURCE EXAMPLES IMPLEMENTATION OPTION EXAMPLES
SOME EFFECTIVENESS MEASUREMENT OPTIONS
Training programs Number of people trained per eventQuiz scores indicate new knowledge acquired
Agriculture Workshops for farmers Survey for changes in pesticide useInventory the pesticides stored on farms, track changes
Industrial Workshops for industries Track changes in industrial wastewater concentrationsNumber of people participating in the workshops
Commercial & agricultural
Pesticide Effectiveness Evaluation menu Page 2 of 2 April 1, 2005

POTENTIAL SOURCE EXISTING RESOURCES
PARTNERING OPPORTUNITIES
POLLUTION PREVENTION STRATEGIES IMPLEMENTATION OPTIONS REGIONAL/
LOCAL
Cost & Resources Needed (1)
Wastewater P2 Benefit (2)
Other Environ-mental
Benefit (3)
Notes
IndustrialFood processors High Interceptors/Traps Installation Local 2.7 4.4 3.0Food production Site inspections Local 3.2 4.0 2.8
Maintenance schedule Local 2.3 4.4 3.0Interceptor/Trap maintenance Posters Either 2.3 3.0 1.7
Workshops Local 2.0 2.7 1.7Site inspections Local 2.8 3.4 2.3
Discharge limits Permit requirement Local 2.2 3.4 2.3Permit records Either 2.2 3.4 2.3
FOG BMPs Provide handbook Either 2.5 2.5 1.3Posters/Outreach Either 2.5 2.5 1.3Newsletters Either 2.5 2.5 2.0Site inspections Local 2.7 3.5 2.3Incentive program Either 2.7 2.7 1.7Recognition program Either 2.0 2.7 1.7
Industrial machinery Low BMPs Provide handbook Either 2.3 2.0 2.0Workshops Local 2.3 2.3 2.3
Zero discharge Floor drain sealing Local 2.3 3.8 4.0Site inspections Local 2.3 3.3 3.0Recognition program Either 2.0 2.3 2.3Monitoring Local 3.0 3.0 3.0Distribute hydrophobic mops Local 3.7 3.0 3.0
Fats, Oils, and Grease Pollution Prevention Menu
* Frequently targeted source(1) 1= low cost, staff time, 5=hi cost, staff time(2) 1 = low ww benefit, 5=hi ww benefit(3) 1=low non-ww environmental benefit, 5=hi non-ww environmental benefit
FOG P2 MenuApril 1, 2005
1

POTENTIAL SOURCE EXISTING RESOURCES
PARTNERING OPPORTUNITIES
POLLUTION PREVENTION STRATEGIES IMPLEMENTATION OPTIONS REGIONAL/
LOCAL
Cost & Resources Needed (1)
Wastewater P2 Benefit (2)
Other Environ-mental
Benefit (3)
Notes
Fats, Oils, and Grease Pollution Prevention Menu
CommercialRestaurants* High Tri-TAC CALFog Interceptors/Traps Installation Local 2.7 3.4 2.5
Workgroup BMP based permits Local 2.8 3.0 3.0California Site inspections Local 3.3 3.5 2.6
Restaurant Interceptor/Trap maintenance Posters Either 2.5 2.5 2.0Association Workshops Local 3.0 3.0 2.3
Site inspections Local 3.1 3.6 2.6Local collection Discharge limits Permit requirement Local 2.5 3.3 2.8
system staff Permit records Local 2.6 3.6 2.8FOG BMPs Provide handbook Either 2.4 2.8 2.0
Posters Either 2.0 2.5 2.0Multi-lingual brochures Either 2.5 2.7 2.0Newsletters Either 3.0 3.0 2.7Site inspections Local 2.9 3.4 2.8Incentive program Either 2.3 2.8 2.3Recognition program Either 2.0 2.8 2.3
Grocery stores Low Interceptors/Traps Installation Local 2.4 3.0 2.3Incentive program Either 2.0 1.8 1.7Maintenance schedule Local 2.7 3.3 2.3
FOG BMPs Posters Either 2.3 1.8 1.3Workshops Local 2.8 2.0 1.7Multi-lingual brochures Either 3.0 2.3 1.3Site inspections Local 3.0 3.2 2.3Recognition program Either 1.7 2.0 1.7
Hospitals Moderate FOG BMPs Posters Either 2.0 2.0 1.5Workshops Local 2.5 2.0 2.0Multi-lingual brochures Either 2.0 2.0 1.5Site inspections Local 3.2 3.4 3.0
Interceptors/Traps Installation Local 2.7 3.3 2.3BMP based permits Local 2.3 2.7 3.0Incentive program Either 2.5 2.0 2.0
Interceptor maintenance Posters Either 2.0 1.7 1.5Workshops Local 3.3 2.0 2.0Site inspections Local 3.2 4.0 3.0
* Frequently targeted source(1) 1= low cost, staff time, 5=hi cost, staff time(2) 1 = low ww benefit, 5=hi ww benefit(3) 1=low non-ww environmental benefit, 5=hi non-ww environmental benefit
FOG P2 MenuApril 1, 2005
2

POTENTIAL SOURCE EXISTING RESOURCES
PARTNERING OPPORTUNITIES
POLLUTION PREVENTION STRATEGIES IMPLEMENTATION OPTIONS REGIONAL/
LOCAL
Cost & Resources Needed (1)
Wastewater P2 Benefit (2)
Other Environ-mental
Benefit (3)
Notes
Fats, Oils, and Grease Pollution Prevention Menu
Schools Moderate FOG BMPs Posters Either 2.3 1.8 1.3School programs/events Local 2.3 1.3 1.3Multi-lingual brochures Either 2.8 1.8 1.3
Interceptors/Traps Installation Local 2.0 2.8 2.3Cleaning Local 1.6 2.4 2.3
Grease bin Installation Local 1.3 2.3 2.3Posters Either 2.3 1.3 1.3School programs/events Local 1.7 1.3 1.3Multi-lingual brochures Either 2.7 1.3 1.3
Moderate Motor oil BMPs Provide handbook Either 2.1 1.3 2.0Site inspections Local 2.0 2.3 2.8Recognition program Either 1.9 2.3 2.3Voluntary programs Either 1.5 1.3 1.7Permit requirement Local 2.4 3.1 3.0
Motor oil recycling Incentive program Either 2.5 2.0 2.3Recognition program Either 1.9 2.0 2.3Posters Either 2.5 1.7 2.0Workshops Local 2.8 1.8 2.2Multi-lingual brochures Either 2.8 2.4 2.2
Zero discharge Floor drain sealing Local 2.3 2.8 3.0Distribute hydrophobic mops Local 3.0 2.3 3.1
Moderate Stormwater Motor oil BMPs Provide handbook Either 2.3 1.7 1.8Permit requirement Local 2.3 3.1 2.8Recognition program Either 2.2 2.0 2.2Incentive program Either 2.3 2.0 2.2Distribute hydrophobic mops Local 3.0 2.7 2.8
Vehicle maintenance Posters Either 2.5 1.7 1.8Workshops Local 2.8 2.8 2.5Multi-lingual brochures Either 2.7 1.8 2.0
Gas stations High Motor oil BMPs Provide handbook Either 2.7 1.3 1.7Permit requirement Local 1.7 2.3 2.7Distribute hydrophobic mops Local 3.3 2.3 2.7
Oil & Grease separator Incentive program Either 2.7 1.7 2.0Regular servicing Local 2.5 3.0 2.7
Vehicle and truck fleets
Vehicle and truck service
* Frequently targeted source(1) 1= low cost, staff time, 5=hi cost, staff time(2) 1 = low ww benefit, 5=hi ww benefit(3) 1=low non-ww environmental benefit, 5=hi non-ww environmental benefit
FOG P2 MenuApril 1, 2005
3

POTENTIAL SOURCE EXISTING RESOURCES
PARTNERING OPPORTUNITIES
POLLUTION PREVENTION STRATEGIES IMPLEMENTATION OPTIONS REGIONAL/
LOCAL
Cost & Resources Needed (1)
Wastewater P2 Benefit (2)
Other Environ-mental
Benefit (3)
Notes
Fats, Oils, and Grease Pollution Prevention Menu
ResidentialSewer line cleaning Sewer line cleaning Local 4.3 3.7 2.3 Assumes agency does it.
Apartments* Moderate Apartment & Education Multi-lingual brochures Either 2.8 2.5 1.3High Density Housing Building Newsletters Local 1.8 2.8 2.0
Managers Work with managers Local 2.5 2.8 1.7Grease bin/Residential collection cans Installation Local 1.8 3.3 2.3
Incentive program Either 2.3 2.3 1.7Grease interceptor Installation Local 2.8 3.0 2.3
Incentive program Either 3.0 1.7 1.7Maintenance Local 2.8 3.0 2.3
Cooking waste* High FOG BMPs Posters/Outreach Either 2.8 2.8 1.3Booths at grocery stores Local 2.5 2.5 1.3Multi-lingual brochures Either 3.0 3.0 1.3Posters at grocery stores Either 3.3 2.5 1.3Educational give-aways Local 3.5 2.5 1.7School programs/events Local 3.0 2.6 1.3
Household FOG collection Local collection facility Local 3.7 2.7 2.3Vehicle oil change Moderate Used oil collection Local collection facility Local 2.8 1.8 3.0
Curbside collection Local 2.3 1.8 3.0Motor oil BMPs Newspaper articles Either 2.3 1.3 2.7
Multi-lingual brochures Either 2.3 1.0 2.3Posters at stores Either 2.3 1.0 2.3
Illegal dumping Moderate Local collection Disincentive program Workshops Local 2.0 1.7 2.7system staff Fines Regional 2.8 2.0 2.7
Newspaper notices Either 2.0 1.0 2.0Vehicle leaks Moderate Stormwater Motor oil BMPs Multi-lingual brochures Either 3.0 1.0 2.0
Posters at stores Either 2.7 1.0 2.0Newspaper articles Either 2.3 1.3 2.3Provide driveway catch traps Local 3.0 1.8 2.0
Hobbyists Low Oil BMPs Multi-lingual brochures Either 2.7 1.3 1.3Posters at stores Either 2.3 1.3 1.3Newspaper articles Either 2.0 1.7 1.7
* Frequently targeted source(1) 1= low cost, staff time, 5=hi cost, staff time(2) 1 = low ww benefit, 5=hi ww benefit(3) 1=low non-ww environmental benefit, 5=hi non-ww environmental benefit
FOG P2 MenuApril 1, 2005
4

Fats, Oils, and Grease Pollution Prevention Effectiveness Determination MenuSOURCE
EXAMPLES IMPLEMENTATION OPTION EXAMPLESSOME EFFECTIVENESS MEASUREMENT
OPTIONSResidential Best management practice (BMP)
installationTrack FOG changes or reduction in sewer lineNumber of BMPs installed
Residential Booths at grocery stores Survey to determine the impact of boothsIndustrial & commercial
Cleaning interceptors/traps Monitor frequency of cleaning
Vehicle oil Curbside collection Quantity of FOG collectedDistribute hydrophobic mops Number of mops distributed
Survey to determine the number of mops used
Residential Educational give-aways Survey to determine effectiveness of give-aways
Industrial, vehicle service
Floor drain sealing Number of businesses that convert to zero discharge
Incentive program Number of interceptors installedNumber participating in the program
Installation of interceptors or BMPs Number of interceptors or BMPs installedMonitor sewers for load changes or reductions
Residential Local collection facility Quantity of FOG collectedCommercial Maintenance records Observe trends in the number of plumber
call-outsMonitoring Number of sources identified through
monitoringTrack changes or reductions in the influent load
Industrial, commercial, residential
Multi-lingual brochures Survey to determine the impact of the brochures
Industrial, commercial, residential
Newsletters Survey to determine the impact of the newsletters
Newspaper articles Survey to determine the impact of the articlesTrack feedback from articles
Illegal dumping Newspaper notices Survey to determine the impact of notices
Industrial & commercial
Permit records Observe historic trends in compliance rate
Industrial & commercial
Permitting Number of industries and commercial businesses in compliance with their permits
Posters Survey to determine number of posters in useTrack changes or reduction in dischargesSurvey to determine the impact of the posters
Residential food FOG
Posters at grocery stores Survey to determine the impact of the posters
Industrial & commercial
Industrial & commercial
Industrial, commercial, residential,
Industrial & commercial
Residential & environmental
Industrial, commercial, residential
FOG Effectiveness Determination menu Page 1 of 3 April 1, 2005

SOURCE EXAMPLES IMPLEMENTATION OPTION EXAMPLES
SOME EFFECTIVENESS MEASUREMENT OPTIONS
Residential vehicle oil
Posters at stores Survey to determine the impact of the posters
Residential vehicle oil
Provide driveway catch traps Number of traps distributed
Survey to determine number of traps in use
Provide BMP handbook Survey to determine number of BMPs in useTrack changes or reduction in discharges
Industrial & commercial
Recognition program Number participating in the program
Industrial & commercial
FOG Effectiveness Determination menu Page 2 of 3 April 1, 2005

POTENTIAL SOURCE EXISTING RESOURCES
PARTNERING OPPORTUNITIES
POLLUTION PREVENTION STRATEGIES IMPLEMENTATION OPTIONS REGIONAL/
LOCAL
Cost & Resources Needed (1)
Wastewater P2 Benefit (2)
Other Environ-mental
Benefit (3)
Notes
Fats, Oils, and Grease Pollution Prevention Menu
EnvironmentalHighway runoff High Stormwater Motor oil BMPs Installation Local 1.0 1.0 1.5
Vehicle maintenance Posters at stores Regional 2.3 1.0 2.0Newspaper articles Regional 2.0 1.3 2.3Workshops Local 2.3 1.3 2.3
Parking lot runoff Moderate Stormwater Motor oil BMPs Installation Local 1.0 1.0 2.0Vehicle maintenance Posters at stores Either 2.3 1.0 2.0
Newspaper articles Either 1.7 1.3 2.3Workshops Local 2.3 1.3 2.3
* Frequently targeted source(1) 1= low cost, staff time, 5=hi cost, staff time(2) 1 = low ww benefit, 5=hi ww benefit(3) 1=low non-ww environmental benefit, 5=hi non-ww environmental benefit
FOG P2 MenuApril 1, 2005
5

SOURCE EXAMPLES IMPLEMENTATION OPTION EXAMPLES
SOME EFFECTIVENESS MEASUREMENT OPTIONS
Commercial & residential
Regular servicing of oil & grease separator
Use service records to determine frequency of service
Residential School programs/events Request teacher evaluations of the program
Industrial, commercial, residential
Sewer line cleaning Observe trends in the number of plumber call-outs
Industrial & commercial
Site inspections Number of BMPs in use
Track changes in the number of illicit dischargesNumber of sites requiring follow-up inspections or other workTrack changes or reductions in the influent load
Industrial & commercial
Voluntary programs Number participating in the programs
Residential Work with apartment managers Survey to determine behavioral changes in apartment residents
Industrial, commercial, residential
Workshops Quiz scores indicate new knowledge acquired
FOG Effectiveness Determination menu Page 3 of 3 April 1, 2005

Feasibility Studies:West County Wastewater DistrictUnion Sanitary DistrictLas Gallinas Valley Sanitary DistrictSewerage Agency of South MarinSan MateoNovato Sanitary DistrictBeniciaFairfield-Suisun Sewer DistrictEast Bay Municipal Utility DistrictDelta Diablo Sanitary DistrictCentral Marin Sanitary AgencyCentral Contra Costa Sanitary DistrictBurlingame
Sonoma Literature ReviewNovato Literature ReviewSonoma Source IdentificationNovato Source IdentificationPollution Prevention Reports:
Union Sanitary DistrictSonoma County Water AgencyDelta Diablo Sanitary DistrictFairfield-Suisun Sewer DistrictNovato Sanitary DistrictDublin San Ramon Services DistrictClean Bay Plan 2002 - PPP for the Regional WQCP and City of Palo Alto
Action Plan: Copper and Nickel Pollution Prevention Activity Investigation at POTWsCopper Step 1 - General Program Design
WERF Woodland Oil and Grease AssessmentBurlingame Feasibility AnalysisUnion Sanitary District Pollution Prevention ReportCity of San Leandro Pollution Prevention/Waste Minimization ProgramEBMUD 2002 Pretreatment and Pollution Prevention ReportBurlingame 2000 Pollution Prevention Report
Copper Pollution Prevention Menu References
Fats, Oils, and Grease Pollution Prevention Menu References
Pollution Prevention Menus References April 1, 2005

Ref Title Author Agency/Organization Date
1 Problem Constituents Discharged from Dental Businesses in the City and County of San Francisco
Barrucci, Dana, Moeller, in cooperation with the San Francisco Dept. Pubic Works, BERM
6-May-88
2 Clean Bay Plan 1998 City of Palo Alto RWQCP
For the East Palo Alto Sanitary District, Los Altos, Los Altos Hills, Mountain
View, Palo Alto, and Stanford1998
3 Memo: 1998 Copper and Mercury Load Calculations Larry Walker Associates: Cooper, A. To Kelly Moran, Palo Alto RWQCP 2-May-95
4 Note To: Daniel Standfree, about the Great Lakes "virtual elimination" program for mercury
EPA Office of Prevention, Pesticides and Toxic Substances:
Darr, J.
Prepared for Daniel Standfree, packet of mercury information developed by EPA's Great Lakes National Program
Office for their "Virtual Elimination" program.
7-Feb-91
5 Mercury Source Identification EIP Associates Prepared for Palo Alto Regional Water Quality Control Plant 12-Aug-93
6 Blueprint for Mercury Elimination: Mercury Reduction Project Guidance for Wastewater Treatment Plants
Funded by the Great Lakes Protection Fund, Great Lakes Pollution
Prevention Centre, and Western Lake Superior
Sanitary District.
Prepared for the Western Lake Superior Sanitary District Feb-93
7 Strategy to Reduce Diazinon Levels in Creeks in the San Francisco Bay Area
Gosselin, S. and Scanlin, J.
Prepared for: The Alameda County Flood Control and Water Conservation
DistrictJul-93
8 A Toxics Reduction Strategy for the Greater Milwaukee AreaGreater Milwaukee Toxics Minimization Task Force (TMTF)
Apr-87
9 1998 Mercury Sources EIP Associates: Johnson, B.
Technical Memorandum to Kelly Moran, Palo Alto RWQCP 22-Apr-95
10 City of Palo Alto Mercury Use EIP Associates: Johnson, B.
Memorandum to Kelly Moran, Palo Alto RWQCP 22-Apr-95
11 Mercury Pollution Prevention Plan Larry Walker Associates Prepared for Palo Alto Regional Water Quality Control Plant Sep-93
Mercury Pollution Prevention Menu References
Pollution Prevention Menus References April 1, 2005
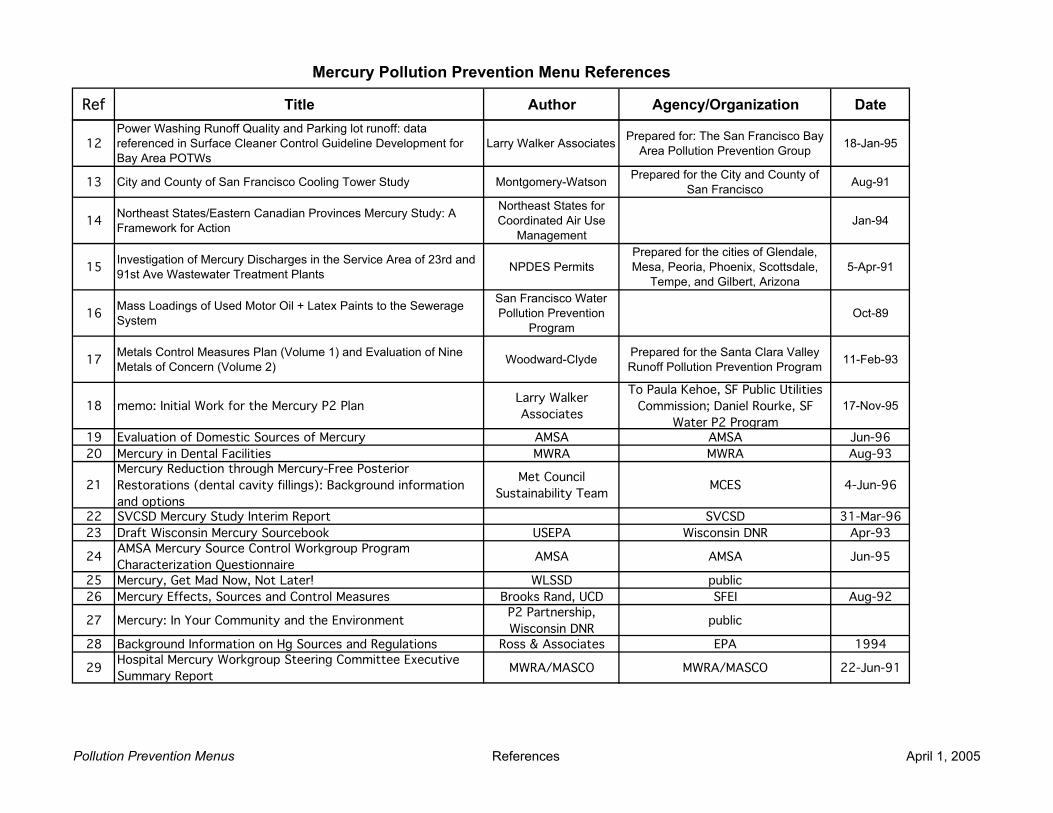
Ref Title Author Agency/Organization Date
Mercury Pollution Prevention Menu References
12Power Washing Runoff Quality and Parking lot runoff: data referenced in Surface Cleaner Control Guideline Development for Bay Area POTWs
Larry Walker Associates Prepared for: The San Francisco Bay Area Pollution Prevention Group 18-Jan-95
13 City and County of San Francisco Cooling Tower Study Montgomery-Watson Prepared for the City and County of San Francisco Aug-91
14 Northeast States/Eastern Canadian Provinces Mercury Study: A Framework for Action
Northeast States for Coordinated Air Use
ManagementJan-94
15 Investigation of Mercury Discharges in the Service Area of 23rd and 91st Ave Wastewater Treatment Plants NPDES Permits
Prepared for the cities of Glendale, Mesa, Peoria, Phoenix, Scottsdale,
Tempe, and Gilbert, Arizona5-Apr-91
16 Mass Loadings of Used Motor Oil + Latex Paints to the Sewerage System
San Francisco Water Pollution Prevention
ProgramOct-89
17 Metals Control Measures Plan (Volume 1) and Evaluation of Nine Metals of Concern (Volume 2) Woodward-Clyde Prepared for the Santa Clara Valley
Runoff Pollution Prevention Program 11-Feb-93
18 memo: Initial Work for the Mercury P2 Plan Larry Walker Associates
To Paula Kehoe, SF Public Utilities Commission; Daniel Rourke, SF
Water P2 Program17-Nov-95
19 Evaluation of Domestic Sources of Mercury AMSA AMSA Jun-9620 Mercury in Dental Facilities MWRA MWRA Aug-93
21Mercury Reduction through Mercury-Free Posterior Restorations (dental cavity fillings): Background information and options
Met Council Sustainability Team
MCES 4-Jun-96
22 SVCSD Mercury Study Interim Report SVCSD 31-Mar-9623 Draft Wisconsin Mercury Sourcebook USEPA Wisconsin DNR Apr-93
24 AMSA Mercury Source Control Workgroup Program Characterization Questionnaire
AMSA AMSA Jun-95
25 Mercury, Get Mad Now, Not Later! WLSSD public26 Mercury Effects, Sources and Control Measures Brooks Rand, UCD SFEI Aug-92
27 Mercury: In Your Community and the Environment P2 Partnership, Wisconsin DNR
public
28 Background Information on Hg Sources and Regulations Ross & Associates EPA 1994
29 Hospital Mercury Workgroup Steering Committee Executive Summary Report
MWRA/MASCO MWRA/MASCO 22-Jun-91
Pollution Prevention Menus References April 1, 2005
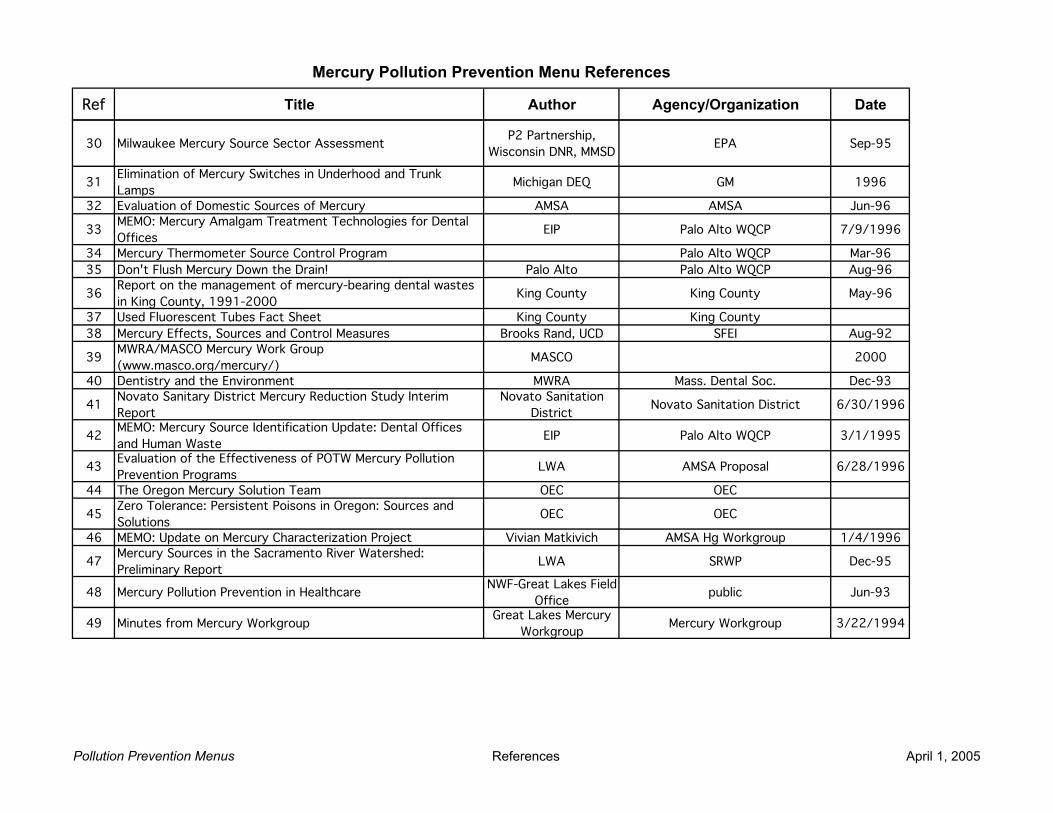
Ref Title Author Agency/Organization Date
Mercury Pollution Prevention Menu References
30 Milwaukee Mercury Source Sector Assessment P2 Partnership, Wisconsin DNR, MMSD
EPA Sep-95
31 Elimination of Mercury Switches in Underhood and Trunk Lamps
Michigan DEQ GM 1996
32 Evaluation of Domestic Sources of Mercury AMSA AMSA Jun-96
33 MEMO: Mercury Amalgam Treatment Technologies for Dental Offices
EIP Palo Alto WQCP 7/9/1996
34 Mercury Thermometer Source Control Program Palo Alto WQCP Mar-9635 Don't Flush Mercury Down the Drain! Palo Alto Palo Alto WQCP Aug-96
36 Report on the management of mercury-bearing dental wastes in King County, 1991-2000
King County King County May-96
37 Used Fluorescent Tubes Fact Sheet King County King County38 Mercury Effects, Sources and Control Measures Brooks Rand, UCD SFEI Aug-92
39 MWRA/MASCO Mercury Work Group (www.masco.org/mercury/)
MASCO 2000
40 Dentistry and the Environment MWRA Mass. Dental Soc. Dec-93
41 Novato Sanitary District Mercury Reduction Study Interim Report
Novato Sanitation District
Novato Sanitation District 6/30/1996
42 MEMO: Mercury Source Identification Update: Dental Offices and Human Waste
EIP Palo Alto WQCP 3/1/1995
43 Evaluation of the Effectiveness of POTW Mercury Pollution Prevention Programs
LWA AMSA Proposal 6/28/1996
44 The Oregon Mercury Solution Team OEC OEC
45 Zero Tolerance: Persistent Poisons in Oregon: Sources and Solutions
OEC OEC
46 MEMO: Update on Mercury Characterization Project Vivian Matkivich AMSA Hg Workgroup 1/4/1996
47 Mercury Sources in the Sacramento River Watershed: Preliminary Report
LWA SRWP Dec-95
48 Mercury Pollution Prevention in Healthcare NWF-Great Lakes Field Office
public Jun-93
49 Minutes from Mercury Workgroup Great Lakes Mercury Workgroup
Mercury Workgroup 3/22/1994
Pollution Prevention Menus References April 1, 2005

Ref Title Author Agency/Organization Date
1Diazinon and Chlorpyrifos in Influent from Residential and Commercial Sources: Final Report (Volume 1 of 2 - Summary Report)
Aqua-Science Submitted to: Central Contra Costa Sanitary District Sep-91
2 RWQCP: Clean Bay Plan 1996 City of Palo Alto For the communities of East Palo Alto, Los Altos, Los Altos Hills, Mountain View, Palo Alto, and Stanford 1996
3 RWQCP: Clean Bay Plan 1998 City of Palo Alto For the East Palo Alto Sanitary District, Los Altos, Los Altos Hills, Mountain View, Palo Alto, and Stanford 1998
4 Outdoor Use of Diazinon and Other Insecticides in Alameda County
Cooper, A. and Scanlin, J.
Prepared for: The Alameda County Flood Control and Water Conservation District Aug-93
5 Diazinon in Urban Areas Cooper, A. RWQCP, City of Palo Alto Jul-92
6 Organochlorine Pesticides Source Identification EIP Associates Prepared for Palo Alto Regional Water Quality Control Plant 27-Oct-93
7 Strategy to Reduce Diazinon Levels in Creeks in the San Francisco Bay Area
Gosselin, S. and Scanlin, J.
Prepared for: The Alameda County Flood Control and Water Conservation District Jul-93
8 Residential and Commercial Source Control to Meet Water Quality Goals
Larry Walker Associates Water Environment Research Foundation 1998
9 Organochlorine Pesticides Pollution Prevention Plan Larry Walker Associates
Prepared for Palo Alto Regional Water Quality Control Plant Sep-93
10 City of Davis Pollution Load Reduction Program, Task 1.1: Background Information for PPP LWA Prepared for the city of Davis 11-Jun-91
11 City of Davis PLRP, Pollution Prevention Program Development LWA Dec-92
Pesticide Pollution Prevention Menu References
Pollution Prevention Menus References April 1, 2005
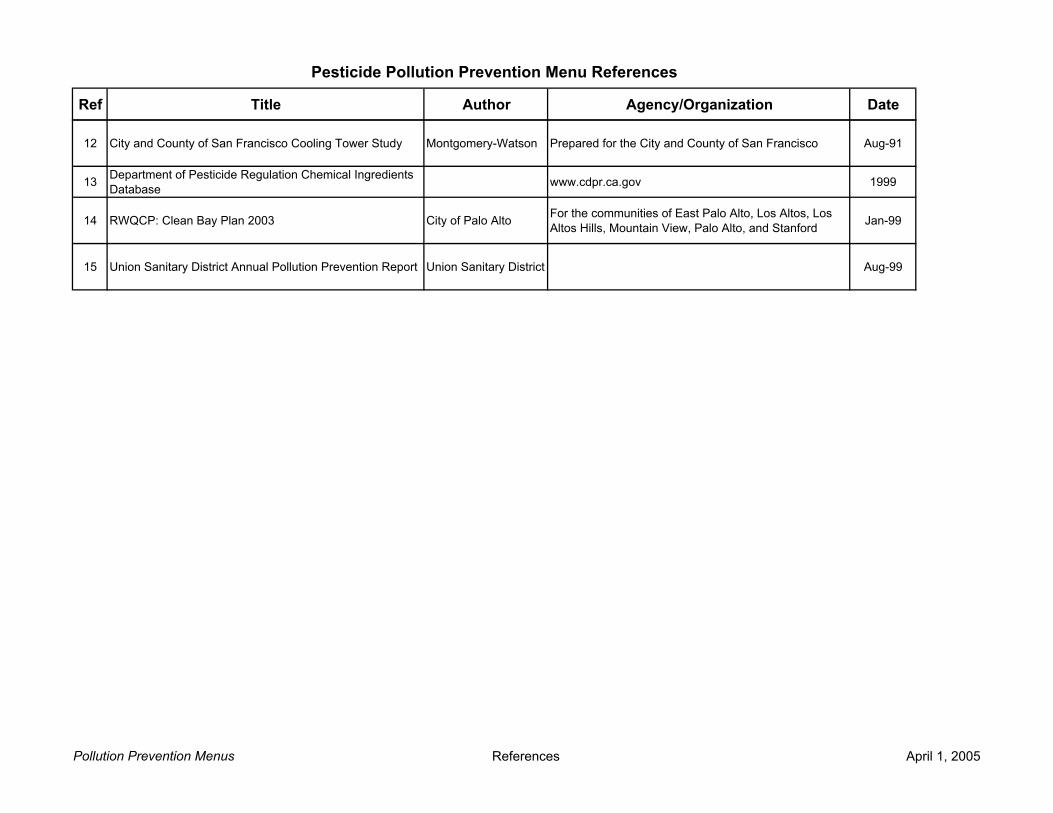
Ref Title Author Agency/Organization Date
Pesticide Pollution Prevention Menu References
12 City and County of San Francisco Cooling Tower Study Montgomery-Watson Prepared for the City and County of San Francisco Aug-91
13 Department of Pesticide Regulation Chemical Ingredients Database www.cdpr.ca.gov 1999
14 RWQCP: Clean Bay Plan 2003 City of Palo Alto For the communities of East Palo Alto, Los Altos, Los Altos Hills, Mountain View, Palo Alto, and Stanford Jan-99
15 Union Sanitary District Annual Pollution Prevention Report Union Sanitary District Aug-99
Pollution Prevention Menus References April 1, 2005

Using a Quantitative Approach toSource Identification
A P P E N D I X B
Appendix B A Quantitative Approach to Source Identification
Wastewater characteristic data can be used to estimate loadings, where available. It may be useful to perform calculation with available data to help assess where the largest reductions of influent sources may be found. For instance, comparing relative influent loads from different sources of a pollutant may make it clear which source is most controllable or most significant.
The average water use per household is often estimated to be 200 gallons per day (gpd), unless study specific data are available. Where water use data for commercial activities is not available, flows can be estimated from literature values. Using concentrations and wastewater flows, loadings for each source type can be calculated. For example, the copper load from carpet cleaners may be calculated as follows∗:
Copper Load from Carpet Cleaners = 330 ug/L/cleaner x 100 gpd/cleaner x 6 carpet cleaners x conversions = 0.749 grams Cu/day
Some loads could be calculated using number of dentists, number of people, or number of households, such as in the following calculation of mercury in human waste*:
Mercury Load from Human Waste (due to amalgam) = 17.2 ug/person/day x 108,000 people x conversions = 1.207 grams Hg/day The overall influent load can be evaluated in 2 ways. The first method sums estimated loads from each individual commercial, industrial, and residential source. The second method uses the average trunkline monitoring results for commercial, industrial, and residential sources as well as flows for these areas to estimate loadings. One approach to calculating your own load reduction estimations includes filling out plant data spreadsheets. In the first step of source loading estimations, information should be collected including number of households, influent/effluent concentrations, and any previous source investigation information. Since commercial and residential activities are similar from community to community, it may also be worthwhile to contact other agencies to see if they have useful source data. Data entered into the plant data spreadsheet are linked to a second spreadsheet, which uses available plant information and source values from previous studies to calculate loadings for each identified source (similar to the calculations described above).
To develop reasonable load reduction calculations, it is helpful to use data that accurately accounts for a majority of the pollutants moving through each plant. Therefore, the degree of mass balance closure should be determined to assess the quality of available data. Factors used to assess the quality of the source load estimations include:
∗ note: data is not steadfast and is only used to show a simulated calcuation

• Number of influent and effluent samples reported • Analytical method and detection limits • Degree of mass balance closure • Availability of all requested information.
However, even if mass balances are found to be less than accurate, load calculations may still help to distinguish between large and small sources. Strategies can be prioritized by determining the potential effectiveness of each control strategy, and the cost to implement the strategy. The effectiveness of the pollution prevention strategies can be estimated on the basis of the level of participation anticipated and the maximum load reduction that may be achieved by the strategy. Effectiveness and cost can then be compared to assess the strategy by taking the product of the participation factor (percent who will participate) and the load factor (amount of pollutant load reduction from a source if there was 100% participation). Effectiveness Rating = Participation Factor * Loading Factor For instance, business outreach to dentists may achieve a loading factor of 90%, but if only 50% of dentists can be expected to participate, the effectiveness rating is only 45%. Similarly, if a residential graywater system can produce a loading factor of 100%, but only 2% of households install the systems, the effectiveness rating is only 2%, and very little overall reduction can be expected. A sensitivity analysis can be conducted to assess the impact of varying pollutant values in the spreadsheets. By varying these values it is possible to get a sense of how influential the numbers used for these sources could be on reduction estimates, pollutant concentrations, compliance, and project costs.