polychaete-assisted sand filters – prawn farm wastewater...
TRANSCRIPT

National Landcare Programme Innovation Grant No. 60945 Technical Report
Polychaete-assisted sand filters – prawn farm wastewater remediation trial. Paul J. Palmer. Department of Primary Industries and Fisheries (DPI&F), Bribie Island Aquaculture Research Centre (BIARC), PO Box 2066 Bribie Island, Queensland, 4507 Australia. Email: [email protected] © The State of Queensland (Department of Employment, Economic Development and Innovation). © The State of Queensland, Department of Primary Industries and Fisheries 2008. Copyright protects this publication. The State of Queensland has no objection to this material being reproduced but asserts its right to be recognised as author of its original material and the right to have its material remain unaltered. Enquiries should be directed to
Commercialisation Unit http://www.dpi.qld.gov.au/77.htm email [email protected] phone the Business Information Centre on 13 25 23 (Queensland residents) or +61 7
3404 6999.

National Landcare Programme Innovation Grant No. 60945 Technical Report
___________________________________________________________________________________ © The State of Queensland, Department of Primary Industries and Fisheries, 2008
1
Polychaete-assisted sand filters – prawn farm wastewater remediation trial Paul J. Palmer
Department of Primary Industries and Fisheries (DPI&F), Bribie Island Aquaculture Research Centre (BIARC), PO Box 2066 Bribie Island, Queensland, 4507 Australia. Email: [email protected] ___________________________________________________________________________________ Table of Contents
Summary ....................................................................................................................4 Introduction................................................................................................................5 Materials and methods ...............................................................................................7 Results......................................................................................................................11
Water volumes and flows.....................................................................................11 Water qualities and nutrients ...............................................................................13 Polychaete biomass production and survival.......................................................22 Polychaete biomass contents................................................................................24
Discussion................................................................................................................28 Conclusion ...............................................................................................................36 Acknowledgments....................................................................................................37 References................................................................................................................37 Appendix..................................................................................................................42
List of Tables Table 1 Particle size characteristics* of medium bedding sand (product code BMS 2000) from
Southern Pacific Sands Pty Ltd.......................................................................................................7 Table 2 Juvenile-density estimates in nursery beds and quantities of nursery sand transferred to each
experimental polychaete sand filter tank.......................................................................................10 Table 3 Total weights of live polychaetes harvested from tanks with different stocking densities.
Means with different superscripts are significantly different (P<0.05).........................................22 Table 4 Weights (g) of live polychaetes harvested from tanks with different stocking densities after
manually grading into smaller (<0.6 g) and larger individuals. Means with different superscripts are significantly different (P<0.05). ..............................................................................................23
Table 5 Survival of polychaetes harvested from tanks with different stocking densities. Means with different superscripts are significantly different (P<0.05). ...........................................................23
Table 6 Total lipid contents (% of dry sample) of graded (small and large) polychaetes harvested from experimental sand filter tanks stocked at different densities. Means with different superscripts are significantly different (P<0.05).....................................................................................................24
Table 7 Mean (± se, n = 3) phospholipid contents (mg g of dry sample) of graded (small and large) polychaetes harvested from experimental sand filter tanks stocked at different densities. Within rows, means with different superscripts are significantly different (P<0.05).
-1
..............................25 Table 8 Mean (± se, n = 3) fatty acid contents (mg g of dry sample) of graded (small and large)
polychaetes harvested from experimental sand filter tanks stocked at high and medium densities. Within rows, means with different superscripts are significantly different (P<0.05).
-1
..................25 Table 9 Mean (± se, n = 6) fatty acid contents (mg g of dry sample) of graded small or large
polychaetes harvested from experimental sand filter tanks. Means within rows are significantly different (P<0.05).
-1
.........................................................................................................................26 Table 10 Mean (± se, n = 6) fatty acid contents (mg g of dry sample) of polychaetes harvested from
experimental sand filter tanks stocked with high or medium densities. Means within rows are significantly different (P<0.05).
-1
....................................................................................................27

National Landcare Programme Innovation Grant No. 60945 Technical Report
___________________________________________________________________________________ © The State of Queensland, Department of Primary Industries and Fisheries, 2008
2
Table 11 Mean (± se, n = 6) amino acid contents (mg g of dry sample) of graded small or large polychaetes harvested from experimental sand filter tanks. Means within rows are significantly different (P<0.05).
-1
.........................................................................................................................28 Table A 1 Source pond water qualities at the farm - samples taken off the jetty at depth of about 50 cm
(see Figure 1) ................................................................................................................................42 Table A 2 Source pond water qualities at the farm - samples taken from monk drain at depth of about
50 cm (see Figure 1) .....................................................................................................................42 Table A 3 Timelines for activities and general observations.................................................................43 Table A 4 Numbers of smaller and larger polychaetes harvested from tanks with different stocking
densities and mean percentages of totals harvested. .....................................................................44 Table A 5 Percentages of dry matter for small and large polychaetes harvested from tanks with
different stocking densities. ..........................................................................................................44 Table A 6 Percentages of ash (on dry matter basis) for small and large polychaetes harvested from
tanks with different stocking densities. .........................................................................................44 Table A 7 Gross energy (MJ kg dry matter) for small and large polychaetes harvested from tanks
with different stocking densities.
-1
..................................................................................................44 Table A 8 Percentages of nitrogen (on dry matter basis) for small and large polychaetes harvested from
tanks with different stocking densities. .........................................................................................45 Table A 9 Percentages of phosphorus (on dry matter basis) for small and large polychaetes harvested
from tanks with different stocking densities. ................................................................................45 Table A 10 Phospholipid contents* (mg g of dry sample) of graded (small and large) polychaetes
harvested from experimental sand filter tanks stocked at different densities (PTEA = Phosphatidylethanolamine, PTI = Phosphatidylinositol, PTS = Phosphatidylserine, PTC = Phosphatidylcholine, SM = Sphingomyelin, LPTC = Lyso-Phosphatidylcholine, TPL = Total Phospholipids).
-1
.............................................................................................................................45 Table A 11 Fatty acid* contents** (mg g of dry sample) of graded small (S) and large (L)
polychaetes harvested from experimental sand filter tanks stocked at different densities.
-1
...........46 Table A 12 Amino acid contents (mg g of dry sample) of graded small (S) and large (L) polychaetes
harvested from experimental sand filter tanks stocked at different densities.
-1
...............................47 List of Figures Figure 1 Schematic representation of the experimental polychaete sand filters and controlled water
flows (not to scale)..........................................................................................................................8 Figure 2 Experimental polychaete sand beds at the Bullock Creek Prawn Farm including the tank
drainage system before filling with sand (top left), the positioning of tanks with covers on pond embankment (top right), the inside of a tank during operation (bottom left), and a tank’s drainage water meter and collecting tub for sampling (bottom right)............................................................9
Figure 3 Cumulative volumes of pond water filtered by each sand bed................................................12 Figure 4 Water depths above sand bed surfaces during weekly sampling at 12 noon. Also shown are
days when the bed surface was raked and when pond water supplies were inconsistent and likely to have affected water depths........................................................................................................12
Figure 5 Mean (± se. n = 6) temperatures for inflow, tank and outflow (filtered) waters during weekly sampling at 12 noon (5% LSD between treatments = 0.47)..........................................................14
Figure 6 Mean (± se. n = 6) salinities for inflow, tank and outflow (filtered) waters during weekly sampling at 12 noon (5% LSD between treatments = 0.20)..........................................................15
Figure 7 Mean (± se. n = 6) levels of pH for inflow, tank and outflow (filtered) waters during weekly sampling at 12 noon (5% LSD between treatments = 0.08)..........................................................15
Figure 8 Mean (± se. n = 6) levels of dissolved oxygen for inflow, tank and outflow (filtered) waters during weekly sampling at 12 noon (5% LSD between treatments = 0.50). .................................16
Figure 9 Mean (± se. n = 6) redox potential for inflow, tank and outflow (filtered) waters during weekly sampling at 12 noon (5% LSD between treatments = 15.72). ..........................................16
Figure 10 Mean (± se. n = 6) total suspended solids (TSS) in inflow and outflow (filtered) waters during fortnightly sampling at 12 noon (5% LSD between treatments = 9.68). ...........................17
Figure 11 Mean (± se. n = 6) biological oxygen demand (BOD ) of inflow and outflow (filtered) waters during fortnightly sampling at 12 noon (5% LSD between treatments = 3.97).
5
................17 Figure 12 Mean (± se. n = 6) chlorophyll a (Chla) levels in inflow and outflow (filtered) waters during
fortnightly sampling at 12 noon (5% LSD between treatments = 12.93)......................................18 Figure 13 Mean (± se. n = 6) total nitrogen (TN) levels in inflow and outflow (filtered) waters during
fortnightly sampling at 12 noon (5% LSD between treatments = 1.21)........................................18

National Landcare Programme Innovation Grant No. 60945 Technical Report
___________________________________________________________________________________ © The State of Queensland, Department of Primary Industries and Fisheries, 2008
3
Figure 14 Mean (± se. n = 6) total ammonia (TAN) levels in inflow and outflow (filtered) waters during fortnightly sampling at 12 noon (5% LSD between treatments = 0.79). ...........................19
Figure 15 Mean (± se., n = 6) nitrate + nitrite (NOx) levels in inflow and outflow (filtered) waters during fortnightly sampling at 12 noon (5% LSD between treatments = 0.08). ...........................19
Figure 16 Mean (± se. n = 6) total phosphorus (TP) levels in inflow and outflow (filtered) waters during fortnightly sampling at 12 noon (5% LSD between treatments = 0.10). ...........................20
Figure 17 Mean (± se. n = 6) orthophosphate (PO ) levels in inflow and outflow (filtered) waters during fortnightly sampling at 12 noon (5% LSD between treatments = 0.03).
4
...........................20 Figure 18 Calculated total suspended solids (TSS) and biological oxygen demand (BOD) mass
balances based on mean volumes filtered and differences between inflow and outflow on fortnightly sampling dates.............................................................................................................21
Figure 19 Calculated total nitrogen (TN), total phosphorus (TP) and chlorophyll a (Chl a) mass balances based on mean volumes filtered and differences between inflow and outflow on fortnightly sampling dates.............................................................................................................21
Figure 20 Pictures of some of the larger harvested specimens of this polychaete species en mass (left) and as individuals (right)...............................................................................................................23
Figure 21 Pictures of a naturally occurring seaweed (Enteromorpha sp.) growing vigorously in pond wastewater after polychaete sand bed treatment. ..........................................................................35
Figure A 1 Rates of inflow measured for each tank prior to regular readjustment to 640 - 650 mL 10 s
.
-
1 ....................................................................................................................................................48 Figure A 2 Daily volumes of pond water filtered by each sand bed. Data were generated by dividing
weekly increments to cumulative totals (see Fig. 4) by 7. ............................................................48 Figure A 3 Temperatures of the inflow, tank and outflow (filtered) waters for each sand filter during
weekly sampling at 12 noon..........................................................................................................49 Figure A 4 Salinities of the inflow, tank and outflow (filtered) waters for each sand filter during
weekly sampling at 12 noon..........................................................................................................50 Figure A 5 Levels of pH for the inflow, tank and outflow (filtered) waters for each sand filter during
weekly sampling at 12 noon..........................................................................................................51 Figure A 6 Levels of dissolved oxygen for the inflow, tank and outflow (filtered) waters for each sand
filter during weekly sampling at 12 noon. ....................................................................................52 Figure A 7 Reduction/oxidation potential (redox) for the inflow, tank and outflow (filtered) waters for
each sand filter during weekly sampling at 12 noon.....................................................................53 Figure A 8 Total suspended solids (TSS) in inflow and outflow (filtered) waters for each sand filter
during fortnightly sampling at 12 noon.........................................................................................54 Figure A 9 Biological oxygen demand (BOD ) of inflow and outflow (filtered) waters for each sand
filter during fortnightly sampling at 12 noon.5
...............................................................................55 Figure A 10 Chlorophyll a (Chla) levels in inflow and outflow (filtered) waters for each sand filter
during fortnightly sampling at 12 noon.........................................................................................56 Figure A 11 Total nitrogen (TN) levels in inflow and outflow (filtered) waters for each sand filter
during fortnightly sampling at 12 noon.........................................................................................57 Figure A 12 Total ammonia (TAN) levels in inflow and outflow (filtered) waters for each sand filter
during fortnightly sampling at 12 noon.........................................................................................58 Figure A 13 Nitrate + Nitrite (NOx) levels in inflow and outflow (filtered) waters for each sand filter
during fortnightly sampling at 12 noon.........................................................................................59 Figure A 14 Total phosphorus (TP) levels in inflow and outflow (filtered) waters for each sand filter
during fortnightly sampling at 12 noon.........................................................................................60 Figure A 15 Orthophosphate (PO ) levels in inflow and outflow (filtered) waters for each sand filter
during fortnightly sampling at 12 noon.4
........................................................................................61

National Landcare Programme Innovation Grant No. 60945 Technical Report
___________________________________________________________________________________ © The State of Queensland, Department of Primary Industries and Fisheries, 2008
4
Summary Medium bedding sand which is commonly available in coastal sedimentary deposits, and a marine polychaete-worm species from Moreton Bay recently classified as Perinereis helleri (Nereididae), were deployed in a simple low-maintenance sand filter design that potentially has application at large scale. Previous work had shown that this physical and biological combination can provide a new option for saline wastewater treatment, since the worms help to prevent sand filter blocking with organic debris and offer a profitable by-product. To test the application of this new concept in a commercial environment, six 1.84 m2 Polychaete-assisted sand filters were experimentally tested for their ability to treat wastewater from a semi-intensive prawn culture pond. Polychaetes produced exclusively on the waste nutrients that collected in these gravity-driven sand filters were assessed for their production levels and nutritional contents. Water parameters studied included temperature, salinity, pH, dissolved oxygen (DO), oxidation/ reduction potential (redox), suspended solids, chlorophyll a, biological oxygen demand (BOD), and common forms of nitrogen and phosphorus. Pond water which had percolated through the sand bed had significantly lower pH, DO and redox levels compared with inflow water. Suspended solids and chlorophyll a levels were consistently more than halved by the process. Reductions in BOD appeared dependant on regular subsurface flows. Only marginal reductions in total nitrogen and phosphorus were documented, but their forms were altered in a potentially useful way: dissolved forms (ammonia and orthophosphate) were generated by the process, and this remineralisation also seemed to be accentuated by intermittent flow patterns. Flow rates of approximately 1,500 L m-2 d-1 were achieved suggesting that a 1 ha polychaete bed of this nature could similarly treat the discharge from a 10 ha semi-intensive prawn farm. Sixteen weeks after stocking sand beds with one-month-old P. helleri, over 3.6 kg of polychaete biomass (wet weight) was recovered from the trial. Production on a sand bed area basis was 328 g m-2. Similar (P>0.05) overall biomass production was found for the two stocking densities tested (2000 and 6000 m-2; n = 3), but survival was lower and more worms were graded as small (<0.6 g) when produced at the higher density (28.2 ± 1.5 % and approx. 88 %, respectively) compared with the lower density (46.8 ± 4.4 % and approx. 76 %, respectively). When considered on a weight for weight basis, about half of the worm biomass produced was generally suitable for use as bait. The nutritional contents of the worms harvested were analysed for different stocking densities and graded sizes. These factors did not significantly affect their percentages of dry matter (DM) (18.23 ± 0.57 %), ash (19.77 ± 0.80 % of DM) or gross energy 19.39 ± 0.29 MJ kg-1 DM) (n = 12). Although stocking density did not affect the worms’ nitrogen and phosphorus contents, small worms had a higher mean proportion of nitrogen and phosphorus (10.57 ± 0.17 % and 0.70 ± 0.01 % of DM, respectively) than large worms (9.99 ± 0.12 % and 0.65 ± 0.01 % of DM, respectively) (n = 6). More lipid was present in large worms grown at the medium density (11.20 ± 0.19 %) compared with the high density (9.50 ± 0.31 %) and less was generally found in small worms (7.1-7.6 % of DM). Mean cholesterol and total phospholipid levels were 5.24
National Landcare Programme Innovation Grant No. 60945 Technical Report
___________________________________________________________________________________ © The State of Queensland, Department of Primary Industries and Fisheries, 2008
5
± 0.15 mg g-1 and 13.66 ± 2.15 mg g-1 DM, respectively (n = 12). Of the specific phospholipids tested, phosphatidyl-serine or sphingomyelin were below detection limits (<0.05 mg g-1), whilst mean levels of phosphatidyl-ethanolamine, phosphatidyl-inositol, phosphatidyl-choline and lysophosphatidyl-choline were 6.89 ± 1.09, 0.89 ± 0.26, 4.04 ± 1.17 and 1.84 ± 0.37 mg g-1, respectively (n = 12). Culture density generally had a more pronounced effect on phospholipid contents than did size of worms. By contrast, worm size had a more pronounced effect on total fatty acid contents, with large worms containing significantly higher (P<0.001) levels on a DM basis (46.88 ± 2.46 mg g-1) than smaller worms (27.76 ± 1.28 mg g-1). A very broad range of fatty acids were detected with palmitic acid being the most heavily represented class (up to 14.23 ± 0.49 mg g-1 DM or 27.28 ± 0.22 % of total fatty acids). Other heavily represented classes included stearic acid (7.4-8.8 %), vaccenic acid (6.8-7.8 %), arachidonic acid (3.5-4.4 %), eicosapentaenoic acid (9.9-13.8 %) and docosenoic acid (5.7-7.0 %). Stocking density did not affect (P>0.05) the levels of amino acids present in polychaete DM, but there was generally less of each amino acid tested on a weight per weight basis in large worms than in small worms. This difference was significant (P<0.05) for the most heavily represented classes being glutamic acid (73-77 mg g-1), aspartic acid (50-54 mg g-1), and glycine (46-53 mg g-1). These results demonstrate how this polychaete species can be planted and sorted at harvest according to various strategies aimed at providing biomass with specific physical and nutritional qualities for different uses.
Introduction The abatement of nutrients entering waterways is a difficult issue that all developing countries face in protecting the diversity and health of their natural aquatic ecosystems. Whilst many non-point anthropogenic sources like agricultural and domestic runoff can represent a large portion of the total nutrient loading in estuaries worldwide (Gordon, 2007; Whitall et al., 2007), they are typically very difficult to address and generally require social and systems management changes. On the other hand, point sources provide opportunities for the design of nutrient collection and mitigation schemes that have economic or intrinsic benefits and provide incentives for businesses and enterprises to place greater values on previously wasted nutrients. The potential for environmental damage from nutrients in aquaculture discharge is also well recognised and many researchers around the world are involved with developing new technologies to reduce the environmental footprint of intensive systems (Folke et al., 1998; Crab et al., 2007). Contingent on this work are the indirect potential benefits they may provide in identifying ways to deal with other non-point nutrient sources that are increasingly entering estuaries, since the enriched aquatic ecosystems in aquaculture farms provide a relevant model for the study of any eutrophication control or intensive nutrient stripping mechanism. Coastal semi-intensive prawn farms commonly operating on flow-through methodologies provide this model for brackish waters. Typically, such farms exchange large volumes (5-30 %) of water in production ponds on a daily basis (Vigneswaran et al., 1999). Up to 27 % of the nitrogen and 10 % of the phosphorus in these systems are typically wasted in effluent waters (Funge-Smith and Briggs, 1998). In addition, on-farm accumulation of

National Landcare Programme Innovation Grant No. 60945 Technical Report
___________________________________________________________________________________ © The State of Queensland, Department of Primary Industries and Fisheries, 2008
6
wasted nutrients occurs in various forms, which include organic sludge, algal and bacterial biomass (Brune et al., 2003), and incidental plants (eg: macrophytes like Enteromorpha sp: Cohen and Fong, 2006) and animals (eg: various gastropods and arthropods, and encrusting organisms like barnacles, Balanus sp., and tube worms, Polydora sp: Fujioka et al, 2007). These non target species coexist with the target crop and prosper from available resources, but are presently of limited economic value to farmers and can become problematic with overpopulation. A far better approach would be to increasingly direct unutilised nutrient resources towards more controlled organisms which may be intrinsically valuable and offer functional advantages in the farming system. Several species of segmented marine worms (Phylum: Annelida; Class: Polychaeta) have been documented growing in prawn farm environments in uncontrolled ways (eg: Notomastus sp. (Capitellidae) and Perinereis sp. (Nereididae): Meksumpun and Meksumpun, 1999; Perinereis sp: Fujioka et al, 2007), and sand filters are commonly used to treat waters in domestic (Campos et al., 2002) and aquaculture systems (Vigneswaran et al., 1999; Palacios and Timmons, 2001). Preliminary studies (DPI&F unpublished data) had demonstrated that these two concepts could be combined in a controlled way to sequester nutrients that would otherwise be wasted in prawn pond discharge waters, but before investing further in this pursuit there was a need to test the concept in a commercial environment. Most appropriately, this commercial testing environment would expose the proposed system to the typically variable and sometimes harsh climatic and environmental conditions of a prawn farm, where silt from earthen ponds and naturally occurring organisms would have a chance to impact on the system’s efficacy. Several species of polychaetes are also now being intensively cultured around the world for fishing bait, feed resources and several potential uses in aquaculture (Olive et al., 2002; Costa et al., 2003). Some recent authors in this area have suggested the use of local species to avoid unnecessary introductions that may result in environmental problems (Costa et al., 2006; Scaps, 2003). Most of these operations have focused on various species from the family Nereididae, which have proved amenable to intensive culture conditions (eg: Perinereis nuntia: Poltana et al., 2007) and been shown able to synthesize essential fatty acids necessary for the balanced nutrition of marine fish and prawns (Olive, 1999; Costa et al., 2000). Our challenge in the present work was to favourably treat prawn pond effluent and simultaneously grow a profitable crop of marine worms using only waste nutrients. The objectives of this study were to 1) assess the wastewater remediation properties of Polychaete sand filtration beds at a commercial prawn farm; 2) document the survival and production levels of one local inter-tidal polychaete species from the family Nereididae (Perinereis helleri) when stocked in such filtration beds at two densities; and, 3) assess their potential suitability for fishing bait and document their nutritional contents for potential use as prawn or fish feeds.

National Landcare Programme Innovation Grant No. 60945 Technical Report
___________________________________________________________________________________ © The State of Queensland, Department of Primary Industries and Fisheries, 2008
7
Materials and methods Six experimental polychaete sand filter beds were implemented at the Bullock Creek Prawn Farm at Donnybrook in South East Queensland during the 2007 production season. Each sand bed was constructed on the bottom of a round flat-bottomed 2000-L high-density polyethylene (HDPE) tank to a depth of approximately 200 mm with 400 L (dry volume) of sand. These tanks had an average diameter of 1550 mm (mid water column), but were 1530 mm in diameter at the sands surface, giving each sand bed a surface area of 1.84 m2. The sand used (Table 1) was medium bedding sand commonly used in the construction industry and reliably available in large volumes at reasonable cost ($AUD22 tonne-1 at the time of the study). Slotted corrugated HDPE pipe with a diameter of 60 mm formed the subsurface drainage under each sand bed. This drainage pipe was wrapped in 4-5 layers of 90 % shade cloth to prevent sand infiltrating the drainage systems. Table 1 Particle size characteristics* of medium bedding sand (product code BMS 2000) from Southern Pacific Sands Pty Ltd.
Sieve size (mm)
Medium sand (% retained in series)
Medium sand (% passing)
4.750 0.0 100 2.360 0.1 99.9 1.180 4.5 95.4 0.600 18.8 76.6 0.300 57.8 18.8 0.150 18.3 0.5 0.075 0.4 0.1
<0.075 (Pan) 0.1 - * Modified from commercial product data sheet. Figure 1 provides a schematic view of the experimental system. Water from the monk drain of a semi-intensive Penaeus monodon culture pond (see Tables A 1 and A 2 in Appendix) was pumped intermittently to a manifold of 25 mm HDPE supply pipes. A main-pressure relief valve in line after the manifold allowed simultaneous adjustments to tank supplies, and valves at the end of each supply pipe provided finer adjustments to equalise flows to each tank. Flows to each tank were regularly adjusted to targeted flow rates. Unused water passing through the pressure relief valve was recirculated back to the culture pond and sand-filtered and overflow waters were piped to the farm’s settlement pond. The targeted rate of pond-water supply to each tank was based on a farm design incorporating 1 ha of sand bed for every 10 ha of culture ponds. Assuming a 10% daily exchange rate for culture ponds with an average depth of 1.5 m, each 1 m2 of sand bed would therefore need to treat 1500 L d-1. Since each experimental sand bed had a surface area of ~1.84 m2, each would therefore need to treat 2760 L d-1 for scaled commercial relevance. This water delivery rate was provided during two 6-h periods (9 am – 3 pm & 9 pm – 3 am) through a simple timer controlling the supply pump. This simulated a tidal system and generally allowed the beds to drain completely between pumping periods.

National Landcare Programme Innovation Grant No. 60945 Technical Report
___________________________________________________________________________________ © The State of Queensland, Department of Primary Industries and Fisheries, 2008
8
The targeted inflow rate for each tank was therefore 3.83 L min-1, which was estimated during routine management by repeatedly measuring the flow being delivered every 10 s. In practice, flows were regularly adjusted to just over 640 mL 10 s-1 (640 - 650 mL). Volumes of filtered drainage water were cumulatively measured with flow meters (BIL DN 25 mm, 16 Bar, 50ºC, to 0.0001 m3) fitted to the tank outlet, and drainage flows were restricted immediately following these meters with smaller pipe fittings (9 mm inside diameter). Small tubs (approx 10 L) collected this drainage water and provided a mechanism for sample collection and testing in clean 1 L plastic beakers. Each tank was covered with plastic solar weave to prevent rainfall entering the tanks, and these were vented at the top of the conical structure to allow the exit of sun-heated air. Figure 2 provides a series of photos showing different components of the experimental tank setup at the farm.
Prawn production pond
Monk drain
Pump Main pressure relief valve
Tank supply manifold
Farm settlement pond
Legend Valved supply pipes Overflow pipes Filtered water sampling tubs and pipes
Experimental polychaete sand filters 1- 6
Jetty
6
1
2
3
4
5
Figure 1 Schematic representation of the experimental polychaete sand filters and controlled water flows (not to scale). Pond water supply to each sand bed began the day before stocking with polychaete juveniles (11th January 2007). During this short pre-stocking period, flow rates were approximately 50% greater than those later targeted, so that the entirety of each sand

National Landcare Programme Innovation Grant No. 60945 Technical Report
___________________________________________________________________________________ © The State of Queensland, Department of Primary Industries and Fisheries, 2008
9
bed was pre-soaked with pond water. Beds were drained completely immediately prior to stocking. A full record of the timelines for trial operation is provided in the Appendix (Table A 3). All six experimental sand beds were stocked with one-month-old laboratory-reared mangrove worms from Moreton Bay in South East Qld (identified as Perinereis helleri by C. Glasby from Hutchings et al., 1991). Tanks 2, 4, and 6 were stocked on 12th January and tanks 1, 3 and 5 were stocked on 13th January. Stocking estimates were based on the transfer of a predetermined volume of sand from nursery beds for which the population densities of juveniles present had been estimated. These nursery estimates were undertaken on two consecutive days immediately prior to transfers. They consisted of stratified (surface, mid depth and lower depth) samples of sand (5 mL) taken from both sides of a central plane with a small spoon, and involved counting the number of juveniles in each sample under a low powered binocular microscope. The targeted stocking rates in applying this procedure (Table 2) were approximately 6,000 juveniles m-2 for filters 1, 3 and 5 (10,945 per tank), and 2,000 juveniles m-2 for filters 2, 4 and 6 (3,680 per tank). A degree of imprecision was associated with these high and medium stocking estimates, but they were assumed to be accurate to later derive survival estimates after harvest.
Figure 2 Experimental polychaete sand beds at the Bullock Creek Prawn Farm including the tank drainage system before filling with sand (top left), the positioning of tanks with covers on pond embankment (top right), the inside of a tank during operation (bottom left), and a tank’s drainage water meter and collecting tub for sampling (bottom right).

National Landcare Programme Innovation Grant No. 60945 Technical Report
___________________________________________________________________________________ © The State of Queensland, Department of Primary Industries and Fisheries, 2008
10
Stocking involved gently spreading the prescribed amount of nursery sand over a small area (approx. 0.1m2) of the damp bed surface. The inflow water was then brought on-line according to the normal operating conditions of the system (ie: on for 6 h, off for 6 h). Table 2 Juvenile-density estimates in nursery beds and quantities of nursery sand transferred to each experimental polychaete sand filter tank.
1st sample series* (juveniles in 5 mL)
2nd sample series* (juveniles in 5 mL)
Nursery sand transferred
Nursery tank
Upper Mid Lower Upper Mid Lower
Mean ± se
density (mL-1)
Filter tank
Volume (mL)**
A 26 23 29 31 7 10 22 21 10 18 7 5 3.48 ± 0.65 1, 3 & 5 3142 B 7 16 4 8 7 2 10 2 1 2 4 7 1.17 ± 0.30 2 3154 C 21 32 5 8 2 11 9 3 4 2 7 4 1.80 ± 0.63 4 2044 D 22 13 4 5 1 3 10 13 2 6 1 5 1.42 ± 0.45 6 2598
* Two replicates taken from upper, mid- and lower sand depths ** Volume estimates added to the nearest 10 mL. Water qualities, including temperature (ºC), salinity (g L-1), dissolved oxygen (DO, mg L-1), pH, and reduction/oxidation potential (redox, mV) were measured in situ using a hand held YSI 556 Multi Probe System. These parameters were measured on a weekly basis at 12 noon at the inflow and filtered discharge/outlet points and in the water column for each tank, as well as in the supply pond in the monk drain and off the jetty (when water depths permitted). Water samples for nutrient analyses were collected over a four month period on a fortnightly basis from the 18 January 2007. They were taken between 12 noon and 1 pm from the intake points and filtered discharge collection tubs for each tank (see Figure 2). Samples were immediately stored on ice and all were transported to the BIARC laboratory for processing within 2 h. Parameters tested included total nitrogen (TN), total phosphorus (TP), total ammonia nitrogen (TAN), oxides of ammonia (NO2
+ NO3 = NOx), orthophosphate (PO4), total suspended solids (TSS), chlorophyll a (Chla) and 5-day biological oxygen demand (BOD), using the standard methods described by APHA (1989). Nutrient analyses were performed with a Lachat QC8000 Flow Injection Analyser using methods described in the instrument manufacturer’s methods (QuickChem Methods, Zellweger Analytics Inc. Milwaukee WI 53218). Chla was studied using glass fibre filters (47 mm) with spectrophotometric determination using the trichromatic method. BOD determinations were undertaken using the Oxidirect® respirometric BOD measurement system from Lovibond, Germany. Statistical analyses were undertaken using GenStat (2007). For all water quality and nutrient parameters tested, repeated measures analyses of variance (ANOVA) were performed. This was done, firstly to determine if the effect of worm density was significant in the treated (outflow) water, and if not, data for all tanks were pooled for comparisons of inflow, in-tank and outflow levels using a split-plot analysis. Mass balance estimates were calculated by adding the sequential mean differences between inflow and outflow concentrations multiplied by volumes filtered at discrete sampling occasions. These were corrected for net removal on a square metre of sand basis. Polychaetes that survived and grew in the worm beds were harvested over one week at the beginning of May 2007, in the 16th week after stocking juveniles. These were

National Landcare Programme Innovation Grant No. 60945 Technical Report
___________________________________________________________________________________ © The State of Queensland, Department of Primary Industries and Fisheries, 2008
11
separated from the sand in 2 mm sieves. After removing sandy residues and silt-laden mucus, the worms from each tank were visually sorted into two size classes, namely (1) bait-sized individuals (≥ 0.6 g), and (2) those too small for easy use as fishing bait (< 0.6 g). The number of individuals in each of these groups was tallied to provide total survival estimates and proportional size-related production assessments. After a purging period of 3-4 h, each group was weighed on bulk after allowing free water to drain through a fine capture net for 20 s. Groups were then frozen in a -80ºC freezer in a thin flattened layer within sealed plastic bags. Weights and survival percentages were subjected to one-way ANOVA using the tank as the experimental unit. The balance of small verses medium worms was tested using a Chi-square test on the contingency table of counts. Each group was later assessed in terms of their proximate analysis including moisture, fat, ash, gross energy, nitrogen, phosphorus, lipid, cholesterol, phospholipid, and fatty and amino acid contents. These data were subjected to ANOVA. In all analyses, protected least significance difference testing (LSD) was conducted between means.
Results
Water volumes and flows A total of 1,788,376 L of pond water was filtered during the trial. For at least the first half of the experiment, pond water delivery rates to each tank remained very consistent on a daily and weekly basis with few operational difficulties experienced. The cumulative volumes of pond water filtered by each sand bed (Figure 3) demonstrate the consistent ability of this water treatment method to handle the nominated commercially relevant water treatment rates (1,500 L m-2 d-1 or 2,760 L tank-1 d-1). Towards the end of the trial, a few difficulties developed in getting consistent flows (640 - 650 mL 10 s-1) delivered into the tanks (see Figure A 1), and this resulted in targeted inflows falling slightly short of the target on several occasions (see Figure A 2). These water supply difficulties and other bed management activities are described in Figure 4 along with the depths of water which prevailed in tanks during the sampling events. There was no clear evidence of worm density consistently affecting water depth in the tanks. Initially, pond water passed freely through each bed, merely wetting the sand and filling most of the pore space. However, after about one week free water began to accumulate over the sand beds when the inflows were operating. The surfaces of all beds were raked for the first time after three weeks of operation when the water depths above beds were rising to 300 mm or more. This rapidly improved percolation rates so that all tanks continued to fully drain between inflow periods. Surface raking was again performed on later occasions when it was observed that beds had not fully drained between inflow periods (see Figure 4 and Table A 3 for details). By the end of February, the worm’s activities in clearing phytoplankton from the leading surface layers of the filter were clearly visible, and this effect was most obvious in the area where the nursery-sand carrying the seed-worms had been deposited. Surface raking was not undertaken thereafter.

National Landcare Programme Innovation Grant No. 60945 Technical Report
___________________________________________________________________________________ © The State of Queensland, Department of Primary Industries and Fisheries, 2008
12
0
50
100
150
200
250
300
350
400
12/0
1/07
26/0
1/07
9/02
/07
23/0
2/07
9/03
/07
23/0
3/07
6/04
/07
20/0
4/07
Date
Cu
mm
ula
tive
fi
lter
ed w
ater
(x
1000
L)
Tank 1
Tank 2
Tank 3
Tank 4
Tank 5
Tank 6
Figure 3 Cumulative volumes of pond water filtered by each sand bed. Although all tanks were equipped with overflows, this generally only occurred on a few occasions when inflows had climbed above prescribed rates. Over the final month of operation however, all tanks began to fail to drain completely between inflow periods. The volumes of water which built above the sand beds during this time (see Figure 4) acted as a reservoir which mitigated flows so that relatively consistent volumes of pond water continued to be filtered by the sand beds on a daily basis during this time (see Figure 3).
0
100
200
300
400
500
600
700
800
12/0
1/07
26/0
1/07
9/02
/07
23/0
2/07
9/03
/07
23/0
3/07
6/04
/07
20/0
4/07
Date
Wat
er d
epth
ab
ove
san
d
surf
ace
(mm
)
Tank 1
Tank 2
Tank 3
Tank 4
Tank 5
Tank 6
Surf. rake
Water supp.
Figure 4 Water depths above sand bed surfaces during weekly sampling at 12 noon. Also shown are days when the bed surface was raked and when pond water supplies were inconsistent and likely to have affected water depths.

National Landcare Programme Innovation Grant No. 60945 Technical Report
___________________________________________________________________________________ © The State of Queensland, Department of Primary Industries and Fisheries, 2008
13
Water qualities and nutrients The qualities of water flowing into the experimental tank system (inflow) varied with different pond management activities (see Tables A1, A2 and A3). Most notably, inflows after the 15th March were taken from the prawn pond after it had been almost completely harvested of prawn stock, and refilled to approximately 30 % of its original volume. This greatly reduced the phytoplankton bloom being delivered to tanks and also occasionally affected different aspects of the way the sand filters were operated. For example, on the night preceding the 29th March sampling date, the pump failed so that sand beds remained dry all night, and this may have particular relevance to effects seen on that date for some parameters including ammonia and orthophosphate (discussed later). Additionally, from the 10th April, inflows were sourced from the farms supply pond due to the need to fully harvest and empty the prawn pond. This again dramatically changed the nature of water being treated by the experimental system (also discussed later with relevant water quality parameters). Water qualities were also typically affected by the prevailing weather conditions. Several particularly cold periods occurred during the 2006/07 summer season, causing water temperatures to vary uncharacteristically from one week to the next. This coupled with very limited rainfall early in the season, which caused relatively high initial salinities (up to 41 ppt. at the beginning of February at this farm), meant that prawn production levels were generally low at this farm and across the industry. However these relatively harsh environmental conditions conveniently challenged the polychaete-based water treatment system. The pH, DO and redox levels measured in the supplying prawn pond, and the prevailing green chlorophyte phytoplankton blooms mixed with varying levels of yellow/brown diatoms, were typical of effluents generated in subtropical semi-intensive prawn farming environments. The tank inflow water just after stocking the juvenile polychaetes (12th & 14th Jan) had a temperature range of 29 to 31 ºC, a salinity range of 39.0 to 39.2 ppt., a pH range of 8.1 to 8.3, and a DO range of 7.9 to 8.0 (see Appendix). Weekly data from the 18th January to the 26th April are presented in the Figures that follow. No differences (P>0.05) were found between tanks with different densities of worms for any water quality or nutrient parameter (ie. temperature, salinity, pH, DO, redox, TSS, BOD, Chla, TN, NOx, TAN, TP or PO4). This allowed the pooling of data from the medium and high density tanks to simply study the effects of the worm assisted sand filters (total of six replicates) on pond water qualities and nutrients as it passed through the treatment system. Data for each separate tank are presented in Figures A 3 through to Figure A 15. For all parameters, except NOx, the effect of the tank on inflow levels, and/or the effect of the sand bed, differed significantly (P<0.05) over time. This effect of time can be expected since most parameters that were measured are heavily affected by the weather, either directly as in the case of ambient temperatures and sun strength affecting water temperatures, or indirectly through conditions which stimulate algal bloom developments and other biological processes which in turn mediate parameter changes. Time had by far the most dominant effect on water temperatures and salinities. The highest temperatures recorded during the trial occurred in the first 2 weeks after

National Landcare Programme Innovation Grant No. 60945 Technical Report
___________________________________________________________________________________ © The State of Queensland, Department of Primary Industries and Fisheries, 2008
14
stocking and this peaked on the 25th Jan at 34.9ºC (tank water temperature). Water salinity also peaked at 40.4 ppt around this time. Cold snaps each month caused low points within a slowly declining temperature regime for the remainder of the experiment/season, whereas salinities returned to more reasonable levels with some moderate rainfall between mid-February and mid-March. The lowest temperature of 25.2ºC was recorded in the outflow on the 12th April, and the lowest salinity of 29.2 ppt. was recorded in the inflow on the 15th March. On most occasions the temperature of water in the tank was significantly higher than that of the inflow and outflow (Figure 5). Since sampling was undertaken during the hottest part of the day (noon), the sun-generated heat contained in the air under the tank covers, and the insulative properties of the sand, undoubtedly affected these results. There was no consistent pattern of salinity effects from the tanks and sand filters (Figure 6). The increasing pH levels of the tank inflows over time reflected the typical pattern of an increasing algal bloom in a prawn pond as the nutrient levels rise with stock feeding levels. Both the tank and sand bed treatments had a pronounced effect on water pH. On all but 2 sampling occasions the pH of water in the tank was significantly higher than the inflow, and the outflow was significantly lower than the inflow (Figure 7). Outflow pH levels remained comparatively stable and more neutral during the entire time that the system was operating with prawn pond water (up to 29th March). After this time the source was changed to the farm reservoir pond which had a much lower pH, thereby also depressing outflow levels.
20
22
24
26
28
30
32
34
36
18/0
1/07
1/02
/07
15/0
2/07
1/03
/07
15/0
3/07
29/0
3/07
12/0
4/07
26/0
4/07
Date
Wa
ter
tem
pe
ratu
re (
ºC)
Inflow
Tank
Outflow
Figure 5 Mean (± se. n = 6) temperatures for inflow, tank and outflow (filtered) waters during weekly sampling at 12 noon (5% LSD between treatments = 0.47). The DO levels of inflows were generally depressed by the delivery system. This was probably caused by a build-up of biofilms on the inside of delivery pipes where flow rates were relatively slow allowing lengthy contact times. Compared with the pond proper, DO levels were also reduced in the monk drain where the suction point for the delivery system was situated (see Tables A 1 and A 2). This was not unexpected due

National Landcare Programme Innovation Grant No. 60945 Technical Report
___________________________________________________________________________________ © The State of Queensland, Department of Primary Industries and Fisheries, 2008
15
d a
to lower light and more limited water exchange inside the monk structure, and it was particularly pronounced before the 1st February when there had previously been limited discharge from the pond to clear settled debris, which also most likely hahigh demand for oxygen.
28
30
32
34
36
38
40
18/0
1/07
1/02
/07
15/0
2/07
1/03
/07
15/0
3/07
29/0
3/07
12/0
4/07
26/0
4/07
Date
Wa
ter
sa
linit
y (
g L
-1)
Inflow
Tank
Outflow
Figure 6 Mean (± se. n = 6) salinities for inflow, tank and outflow (filtered)
.20). waters during weekly sampling at 12 noon (5% LSD between treatments = 0
6
6.5
7
7.5
8
8.5
9
9.5
18/0
1/07
1/02
/07
15/0
2/07
1/03
/07
15/0
3/07
29/0
3/07
12/0
4/07
26/0
4/07
Date
Wa
ter
pH
Inflow
Tank
Outflow
Figure 7 Mean (± se. n = 6) levels of pH for inflow, tank and outflow (filtered)
).
O levels in the tank’s water tended to reflect more closely the levels in the pond and
d
waters during weekly sampling at 12 noon (5% LSD between treatments = 0.08 Don most occasions were significantly higher than the inflow. Most noticeable was the highly significant effect of the sand bed on water percolating through it, whereby almost all dissolved oxygen was consistently stripped (Figure 8). Not surprisingly,from March onwards the outflow water had an anoxic (hydrogen sulphide) smell an

National Landcare Programme Innovation Grant No. 60945 Technical Report
___________________________________________________________________________________ © The State of Queensland, Department of Primary Industries and Fisheries, 2008
16
portions of the sediment turned black. The development of this reducing environment was also evident in the redox potential results (Figure 9). Again the sand bed had a pronounced affect causing extremely low readings after only one week of operation.
-10123456789
10
18/0
1/07
1/02
/07
15/0
2/07
1/03
/07
15/0
3/07
29/0
3/07
12/0
4/07
26/0
4/07
Date
Dis
solv
ed o
xyg
en
(mg
L-1)
Inflow
Tank
Outflow
Figure 8 Mean (± se. n = 6) levels of dissolved oxygen for inflow, tank and
een outflow (filtered) waters during weekly sampling at 12 noon (5% LSD betwtreatments = 0.50).
-400-350-300-250-200-150-100
-500
50100150
18/0
1/07
1/02
/07
15/0
2/07
1/03
/07
15/0
3/07
29/0
3/07
12/0
4/07
26/0
4/07
Date
Wa
ter
red
ox
(m
V)
Inflow
Tank
Outflow
Figure 9 Mean (± se. n = 6) redox potential for inflow, tank and outflow
lthough the effect of the sand bed on suspended solids varied significantly over
at of inflow levels (30.7 mg L ).
(filtered) waters during weekly sampling at 12 noon (5% LSD between treatments = 15.72). Atime, it had a far more pronounced affect compared with time, with outflow levelsconsistently significantly lower than inflow levels (Figure 10). The overall mean outflow TSS level for all 8 sampling times (11.3 mg L-1) was well under half of th
-1

National Landcare Programme Innovation Grant No. 60945 Technical Report
___________________________________________________________________________________ © The State of Queensland, Department of Primary Industries and Fisheries, 2008
17
0.00
10.00
20.00
30.00
40.00
50.00
60.00
18/0
1/07
1/02
/07
15/0
2/07
1/03
/07
15/0
3/07
29/0
3/07
12/0
4/07
26/0
4/07
Date
TS
S (
mg
L-1
)
Inflow
Outflow
Figure 10 Mean (± se. n = 6) total suspended solids (TSS) in inflow and outflow (filtered) waters during fortnightly sampling at 12 noon (5% LSD between
ere engaged in the regular treatment of prawn pond water, OD levels were consistently reduced (Figure 11), and this was by significant
as
treatments = 9.68). Whilst the sand beds wB(P<0.05) levels for all but one sampling occasion (15/03/07). However, on the daythat the water supply was interrupted the night before, the BOD of the outflow wsignificantly higher then the inflow. When the beds were operating with the lower (P<0.05) BOD water from the reservoir pond, no effect on BOD was apparent.
0.00
10.00
20.00
30.00
40.00
18/0
1/07
1/02
/07
15/0
2/07
1/03
/07
15/0
3/07
29/0
3/07
12/0
4/07
26/0
4/07
Date
BO
D5
(m
g L
-1)
Inflow
Outflow
Figure 11 Mean (± se. n = 6) biological oxygen demand (BOD5) of inflow and outflow (filtered) waters during fortnightly sampling at 12 noon (5% LSD
hla levels was highly significant (P<0.01), with onsistent reductions when pond water rich in phytoplankton was being treated
between treatments = 3.97). The effect of the sand bed on Cc
National Landcare Programme Innovation Grant No. 60945 Technical Report
___________________________________________________________________________________ © The State of Queensland, Department of Primary Industries and Fisheries, 2008
18
lts), e
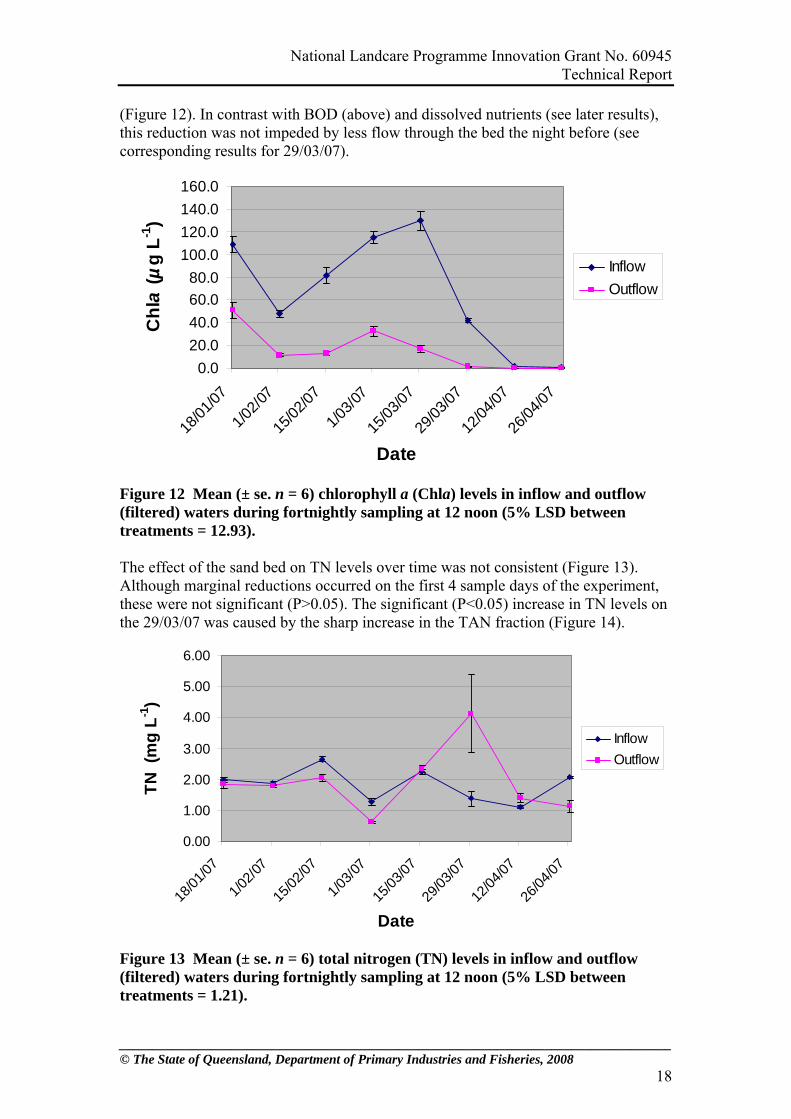
(Figure 12). In contrast with BOD (above) and dissolved nutrients (see later resuthis reduction was not impeded by less flow through the bed the night before (secorresponding results for 29/03/07).
0.0
20.0
40.0
60.0
80.0
100.0
120.0
140.0
160.0
18/0
1/07
1/02
/07
15/0
2/07
1/03
/07
15/0
3/07
29/0
3/07
12/0
4/07
26/0
4/07
Date
Ch
la (
µg
L-1
)
Inflow
Outflow
Figure 12 Mean (± se. n = 6) chlorophyll a (Chla) levels in inflow and outflow (filtered) waters during fortnightly sampling at 12 noon (5% LSD between
bed on TN levels over time was not consistent (Figure 13). lthough marginal reductions occurred on the first 4 sample days of the experiment,
on
treatments = 12.93). The effect of the sand Athese were not significant (P>0.05). The significant (P<0.05) increase in TN levelsthe 29/03/07 was caused by the sharp increase in the TAN fraction (Figure 14).
0.00
1.00
2.00
3.00
4.00
5.00
6.00
18/0
1/07
1/02
/07
15/0
2/07
1/03
/07
15/0
3/07
29/0
3/07
12/0
4/07
26/0
4/07
Date
TN
(m
g L
-1)
Inflow
Outflow
Figure 13 Mean (± se. n = 6) total nitrogen (TN) levels in inflow and outflow (filtered) waters during fortnightly sampling at 12 noon (5% LSD between treatments = 1.21).

National Landcare Programme Innovation Grant No. 60945 Technical Report
___________________________________________________________________________________ © The State of Queensland, Department of Primary Industries and Fisheries, 2008
19
, and
Regarding other common forms of nitrogen, analyses suggested at sand beds did not effect NOx levels during the trial (P>0.05). This was despite a
On most occasions the levels of TAN in the outflow were higher than in the inflowbut these differences were only statistically significant (P<0.05) on the 15/03/0729/03/07 (Figure 14).thsignificant (P<0.05) rise in levels on the last sampling occasion (Figure 15).
0.00
1.00
2.00
3.00
4.00
5.00
-1)
18/0
1/07
1/02
/07
15/0
2/07
1/03
/07
15/0
3/07
29/0
3/07
12/0
4/07
26/0
4/07
Date
TA
N (
mg
L
Inflow
Outflow
Figure 14 Mean (± se. n = 6) total ammonia (TAN) levels in inflow and outflow (filtered) waters during fortnightly sampling at 12 noon (5% LSD between treatments = 0.79).
0.00
0.10
0.20
0.30
0.40
0.50
-1)
18/0
1/07
1/02
/07
15/0
2/07
1/03
/07
15/0
3/07
29/0
3/07
12/0
4/07
26/0
4/07
Date
NO
x (
mg
L
Inflow
Outflow
Figure 15 Mean (± se., n = 6) nitrate + nitrite (NOx) levels in inflow and outflow (filtered) waters during fortnightly sampling at 12 noon (5% LSD between treatments = 0.08).
that low levels were marginally lower than inflow levels on the first
ve sampling occasions, but these differences were not significant (P>0.05). As with the results for TN, TP was heavily impacted by dissolved forms, particularly after
The effect of the sand bed on TP levels (Figure 16) also fluctuated significantly (P<0.01) during the experiment, but the effect of time was more pronounced thanof the sand bed. Outffi

National Landcare Programme Innovation Grant No. 60945 Technical Report
___________________________________________________________________________________ © The State of Queensland, Department of Primary Industries and Fisheries, 2008
20
PO4
disruption of the water supply the night before the 29/03/07 samples were taken.levels in the sand bed-discharge peaked on that day (Figure 17). Continuous remineralisation of phosphorus was evidenced by the significant (P<0.05) differencesbetween inflow and outflow PO4 levels over several earlier weeks.
0.00
0.20
0.40
0.60
0.80
-1)
18/0
1/07
1/02
/07
15/0
2/07
1/03
/07
15/0
3/07
29/0
3/07
12/0
4/07
26/0
4/07
Date
TP
(m
g L
Inflow
Outflow
Figure 16 Mean (± se. n = 6) total phosphorus (TP) levels in inflow and outflow (filtered) waters during fortnightly sampling at 12 noon (5% LSD between treatments = 0.10).
0.00
0.10
0.20
0.30
0.40
)
18/0
1/07
1/02
/07
15/0
2/07
1/03
/07
15/0
3/07
29/0
3/07
12/0
4/07
26/0
4/07
Date
PO
4 (m
g L
-1
Inflow
Outflow
Figure 17 Mean (± se. n = 6) orthophosphate (PO4) levels in inflow and outflow (filtered) waters during fortnightly sampling at 12 noon (5% LSD between treatments = 0.03). Mass balance calculations demonstrated the continual interception of suspended
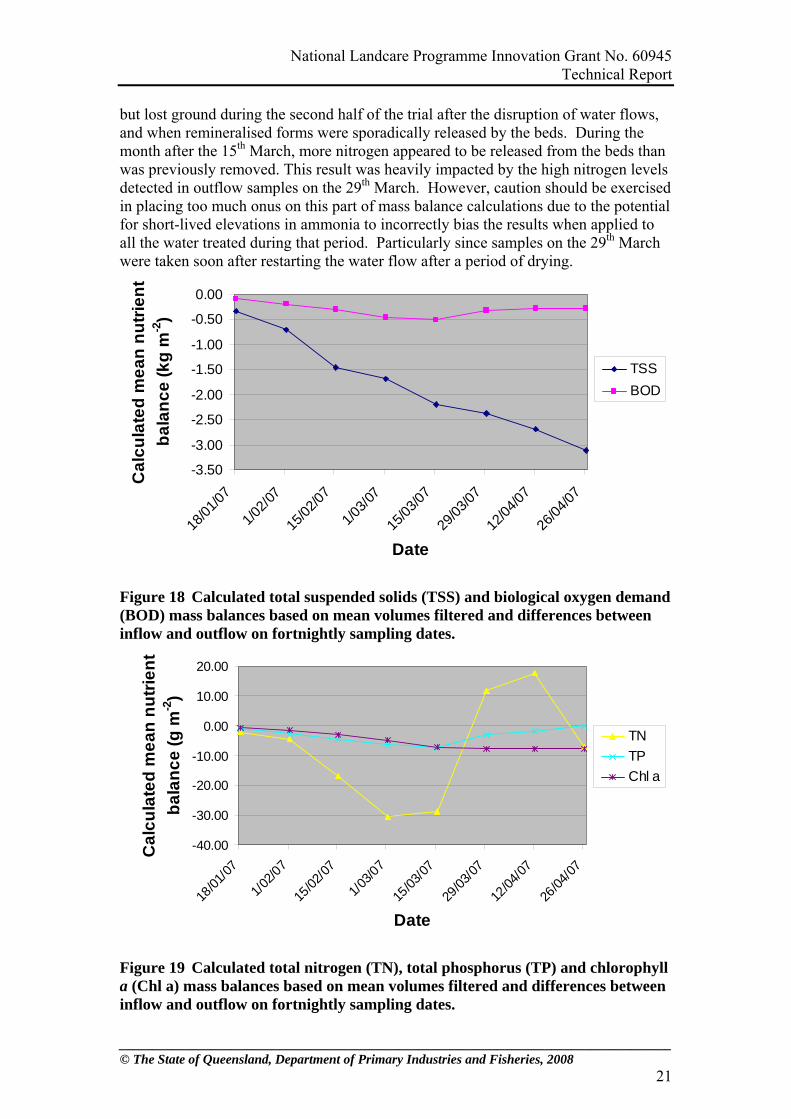
f
r nutrients also had compounding removals for several weeks
solids (Figure 18) and chlorophyll a (Figure 19) from pond water, where by the end othe trial 3.12 kg and 7.88 g had been removed by each square metre of sand bed,respectively. The othe
National Landcare Programme Innovation Grant No. 60945 Technical Report
___________________________________________________________________________________ © The State of Queensland, Department of Primary Industries and Fisheries, 2008
21
ut lost ground during the second half of the trial after the disruption of water flows,
vels d l
band when remineralised forms were sporadically released by the beds. During themonth after the 15th March, more nitrogen appeared to be released from the beds than was previously removed. This result was heavily impacted by the high nitrogen ledetected in outflow samples on the 29th March. However, caution should be exercisein placing too much onus on this part of mass balance calculations due to the potentiafor short-lived elevations in ammonia to incorrectly bias the results when applied toall the water treated during that period. Particularly since samples on the 29th March were taken soon after restarting the water flow after a period of drying.
-3.50
-3.00
-2.50
-2.00
-1.50
-1.00
-0.50
0.00
an
nu
trie
nt
g m
-2)
TSS
18/0
1/07
1/02
/07
15/0
2/07
1/03
/07
15/0
3/07
29/0
3/07
12/0
4/07
26/0
4/07
Date
Ca
lcu
late
d m
e
ba
lan
ce
(k
BOD
Figure 18 Calculated total suspended solids (TSS) and biological oxygen demand (BOD) mass balances based on mean volumes filtered and differences between inflow and outflow on fortnightly sampling dates.
-40.00
-30.00
-20.00
-10.00
0.00
10.00
an
nu
trie
g m
-2)
20.00
18/0
1/07
1/02
/07
15/0
2/07
1/03
/07
15/0
3/07
29/0
3/07
12/0
4/07
26/0
4/07
Date
Ca
lcu
late
d m
en
t
ba
lan
ce
(
TN
TP
Chl a
Figure 19 Calculated total nitrogen (TN), total phosphorus (TP) and chlorophyll a (Chl a) mass balances based on mean volumes filtered and differences between inflow and outflow on fortnightly sampling dates.
National Landcare Programme Innovation Grant No. 60945 Technical Report
___________________________________________________________________________________ © The State of Queensland, Department of Primary Industries and Fisheries, 2008
22
Polychaete biomass production and survival The sizes of worm juveniles when stocked (one month old) were very small (approx. 5 mm long), and their transparent nature at this stage makes them almost impossible to detect with the naked eye whilst they are ranging freely in the substrate. However, after about three weeks their colour darkens and they generally grow to a length of 10 to 20 mm, making them easily detectable in subsamples of sand taken from beds. At that stage in the present trial they were particularly prevalent in subsamples taken from the area where the nursery sand carrying the seed-worms had been deposited. One month after stocking, small worm holes began to appear in the surfaces of the beds. These became enlarged and easily discernible at low tide after the second month. Nine weeks after stocking many larger worm holes were apparent in beds 4, 5 and 6, lots of smaller holes were apparent in bed 3, and somewhat fewer variable sized holes were apparent in beds 1 and 2. These observations provided a general guide to the biomass and sizes of worms that were growing in particular beds, as evidenced by the
st number of small sized worms (Tank 3) had a large number of small holes. The presence of larger holes indicated the presence of a significant number of larger worms, although this was at times obscured by mound building activities on the surface, presumably from sand excavated from the network of burrows and being deposited on the sand surface at particular points. A total of 3,623.7 g of worm biomass was recovered from the trial at harvest. Similar (P>0.05) wet weights were harvested from tanks that were previously stocked at different rates (Table 3), with the higher stocking densities only producing a marginally higher production level (346 g m-2) compared with the medium stocking density (311 g m-2). The overall mean production level of worm biomass during the 4-month trial was 328 g m-2 (604 g per tank). Table 3 Total weights of live polychaetes harvested from tanks with different stocking densities. Means with different superscripts are significantly different (P<0.05). Stocking density Tank Total weight (g) Mean ± se
harvest results collected after 15 weeks of culture in the sand filters (Tables 3 and 4). For example, the tank with the lowest total harvested biomass (Tank 2) had fewer apparent holes, and the tank which produced the highe
High
1 3 5
620.0 674.4 614.6
636.3a ± 19.1
Medium
2 4 6
504.0 621.0 589.7
571.6a ± 35.0
After visually grading harvested worms into smaller and larger specimens, the high density tanks on average yielded significantly higher (P<0.05) weights of small worms, and the medium density tanks yielded significantly higher weights of large worms (Table 4). This equated with 63 % and 42 % of worm biomass from the high and medium density tanks, respectively, that were generally too small for easy use as bait.

National Landcare Programme Innovation Grant No. 60945 Technical Report
___________________________________________________________________________________ © The State of Queensland, Department of Primary Industries and Fisheries, 2008
23
Table 4 Weights (g) of live polychaetes harvested from tanks with different 0.6 g) and larger stocking densities after manually grading into smaller (<
individuals. Means with different superscripts are significantly different (P<0.05). Stocking density
Tank Small Large Small Mean ± se
Large Mean ± se
High
1 3 5
364.0 465.5 373.8
256.0 208.9 240.8
401.1c ± 32.3
235.2a ± 13.9
Medium
2 4
257.0 232.2
247.0 388.8 240.8
6 233.3 356.4 .9
ab ± 8.1 330.7bc ± 42
The mean survival of worms in the high density tanks was significantly lower (P<0.05) than in the medium density tanks (Table 5). In terms of the numbers of worms in the different size grades, both stocking densities produced more small worms than large ones. The mean percentage of large worms in tanks stocked at medium densities was 23.7 %, which was significantly (P<0.01) higher than 11.6 % for tanks stocked with high densities (see Table A 4). Figure 20 provides pictures othe large graded size class of this polychaete species. Table 5 Survival of polychaetes harvested from tanks with different stocking densities. Means with different superscripts are significantly different (P<0.05).Stocking Tank Stocking Number Survival Mean ± se
f
ensity estimate harvested (%) % Survival d High
1 3 5
10,945 10,945 10,945
3,306 3,190 2,763
30.2 29.1 25.2
28.2a ± 1.5
Medium
2 4 6
3,680 3,680 3,680
1,406 1,940 1,822
38.2 52.7
46.8
49.5
b ± 4.4
Figure 20 Pictures of some of the larger harvested specimens of this polychaete species en mass (left) and as individuals (right).
National Landcare Programme Innovation Grant No. 60945 Technical Report
___________________________________________________________________________________ © The State of Queensland, Department of Primary Industries and Fisheries, 2008
24
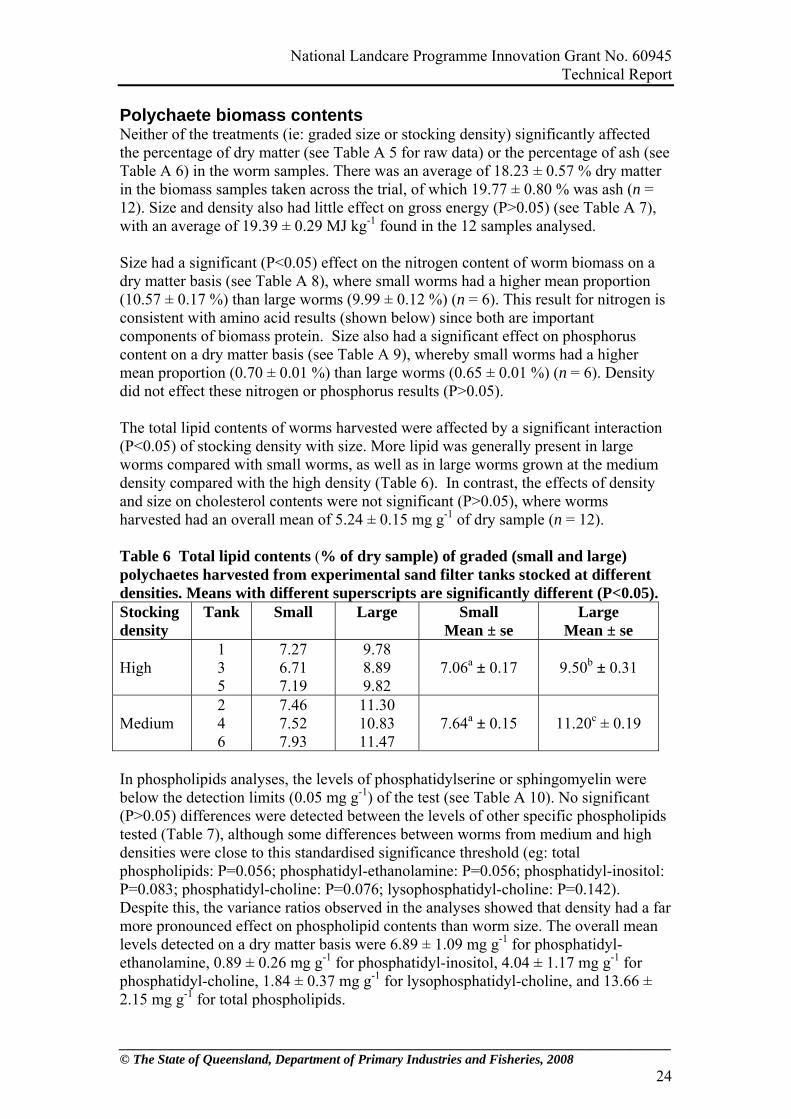
cted ash (see
in the worm samples. There was an average of 18.23 ± 0.57 % dry matter a les taken across the trial, of which 19.77 ± 0.80 % was ash (n =
and density also had little effect on gross .05) (s 7), ith an averag f 19.39 MJ k d in the 12 samples analysed.
Size had a sign ant (P effect nitrogen co ent of worm biomry matter basi ee Ta ), whe l worms had a higher mean proportion
.17 % than la rms (9 .12 % res is consistent with amino ac lts (sh low) since th are important omponents of biomass protein. Size also had a significant effect on phosphorus
er ty
worms grown at the medium ensity compared with the high density (Table 6). In contrast, the effects of density
Total lipid c of dry sample) of graded (small and large) olychaetes ha ested perim sand filter tanks stocked at different
ies. Mea with t sup ts are icantly <0.05). Stocking
ensity Tank Small all
± se Large
Polychaete biomass contents Neither of the treatments (ie: graded size or stocking density) significantly affethe percentage of dry matter (see Table A 5 for raw data) or the percentage of Table A 6)in the biom12). Size
ss samp energy (P>0 ee Table A
w e o ± 0.29 g-1 foun
ific <0.05) on the nt ass on a d s (s ble A 8 re smal(10.57 ± 0 ) rge wo .99 ± 0 ) (n = 6). This ult for nitrogen
id resu own be boccontent on a dry matter basis (see Table A 9), whereby small worms had a highmean proportion (0.70 ± 0.01 %) than large worms (0.65 ± 0.01 %) (n = 6). Densidid not effect these nitrogen or phosphorus results (P>0.05). The total lipid contents of worms harvested were affected by a significant interaction(P<0.05) of stocking density with size. More lipid was generally present in large worms compared with small worms, as well as in largedand size on cholesterol contents were not significant (P>0.05), where worms harvested had an overall mean of 5.24 ± 0.15 mg g-1 of dry sample (n = 12). Table 6 ontents (%p rv from ex ental densit ns differen erscrip signif different (P
dLarge Sm
Mean Mean ± se High
5 7.19 9.82 7 0.17
9.50 ± 0.31
1 3
7.27 6.71
9.78 8.89
.06a ± b
Medium
2 4 6
7.46 7.52 7.93
11.30 10.83 11.47
7.64a ± 0.15
11.20c ± 0.19
In phospholipids analyses, the levels of phosphatidylserine or sphingomyelin were below the detection limits (0.05 mg g-1) of the test (see Table A 10). No significant (P>0.05) differences were detected between the levels of other specific phospholipids tested (Table 7), although some differences between worms from medium and high densities were close to this standardised significance threshold (eg: total phospholipids: P=0.056; phosphatidyl-ethanolamine: P=0.056; phosphatidyl-inositol: P=0.083; phosphatidyl-choline: P=0.076; lysophosphatidyl-choline: P=0.142). Despite this, the variance ratios observed in the analyses showed that density had a far
ore pronounced effect on phospholipi ontents than worm size. The overall mean -1
osphatidyl-choline, and 13.66 ± 2.15 mg g-1 for total phospholipids.
m d clevels detected on a dry matter basis were 6.89 ± 1.09 mg g for phosphatidyl-ethanolamine, 0.89 ± 0.26 mg g-1 for phosphatidyl-inositol, 4.04 ± 1.17 mg g-1 for phosphatidyl-choline, 1.84 ± 0.37 mg g-1 for lysoph
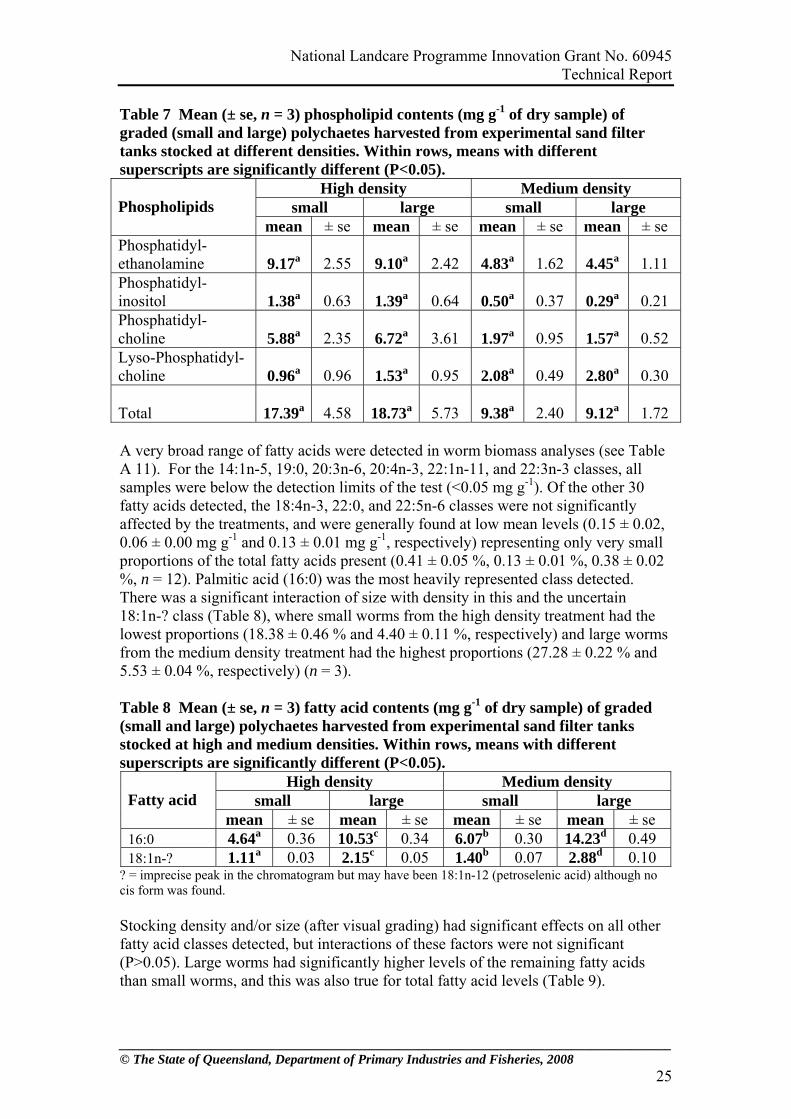
National Landcare Programme Innovation Grant No. 60945 Technical Report
___________________________________________________________________________________ © The State of Queensland, Department of Primary Industries and Fisheries, 2008
25
pid contents (mg g-1 of dry sample) of Table 7 Mean (± se, n = 3) phospholigraded (small and large) polychaetes harvested from experimental sand filter tanks stocked at different densities. Within rows, means with different superscripts are significantly different (P<0.05).
High density Medium density small large small large
Phospholipids
mean ± se mean ± se mean ± se mean ± se Phosphatidyl-
ethanolamine 9.17a 2.55 9.10a 2.42 4.83a 1.62 4.45a 1.11Phosphatidyl- inositol
1.38a
0.63
1.39a
0.64
0.50a
0.37
0.29a
0.21
Phosphatidyl- choline
5.88a
2.35
6.72a
3.61
1.97a
0.95 1.57
a 0.52
Lyso-Phosphatidyl- choline
0.96a
0.96
1.53a
0.95
2.08a
0.49
2.80a 0.30
Total 17.39a 4.58 18.73a 5.73 9.38a
2.40
9.12a
1.72
A very broad range of fatty acids were detected in worm biomass analyses (see TaA 11). For the 14:1n-5, 19:0, 20:3n-6, 20:4n-3, 22:1n-11, and 22:3n-3 classes, all samples were below the detection limits of the test (<0.05 mg g
ble
tly ± 0.02,
.06 ± 0.00 mg g-1 and 0.13 ± 0.01 mg g-1, respectively) representing only very small 0.02
ss 8), mall from the high density treatment had the oportions (18.38 ± 0.46 % and 4.40 ± 0.11 %, respectively) and large worms
om the mediu ent ha highest pro rtions (27.28 ± 0.22 % and 0.04 %, pective = 3).
able 8 Mean se, n = 3) fatty acid contents (mg g-1 of dry sample) of graded
d lar polyc harve om e andstocked at hig nd me densit thin rows, means with different
perscripts are significantly different (P<0.05).
-1). Of the other 30 fatty acids detected, the 18:4n-3, 22:0, and 22:5n-6 classes were not significanaffected by the treatments, and were generally found at low mean levels (0.150proportions of the total fatty acids present (0.41 ± 0.05 %, 0.13 ± 0.01 %, 0.38 ± %, n = 12). Palmitic acid (16:0) was the most heavily represented class detected. There was a significant interaction of size with density in this and the uncertain 18:1n-? clalowest pr
(Table where s worms
fr m density treatm d the po5.53 ± res ly) (n
T (±(small an ge) haetes sted fr xperimental s filter tanks
h a dium ies. Wisu
High density Medium density small large small large
Fatty acid
mean ± se mean ± se mean ± se mean ± se 16:0 4.64a 0.36 10.53c 0.34 6.07b 0.30 14.23d 0.49 18:1n-? 1.11a 0.03 2.15c 0.05 1.40b 0.07 2.88d 0.10
? = imprecise peak in the chromatogram but may have been 18:1n-12 (petroselenic acid) although no cis form was found. Stocking density and/or size (after visual grading) had significant effects on all other fatty acid classes detected, but interactions of these factors were not significant(P>0.05). Large worms had significantly higher levels of the remaining fatty acids than small worms, and this was also true for total fatty acid levels (Table 9).
National Landcare Programme Innovation Grant No. 60945 Technical Report
___________________________________________________________________________________ © The State of Queensland, Department of Primary Industries and Fisheries, 2008
26
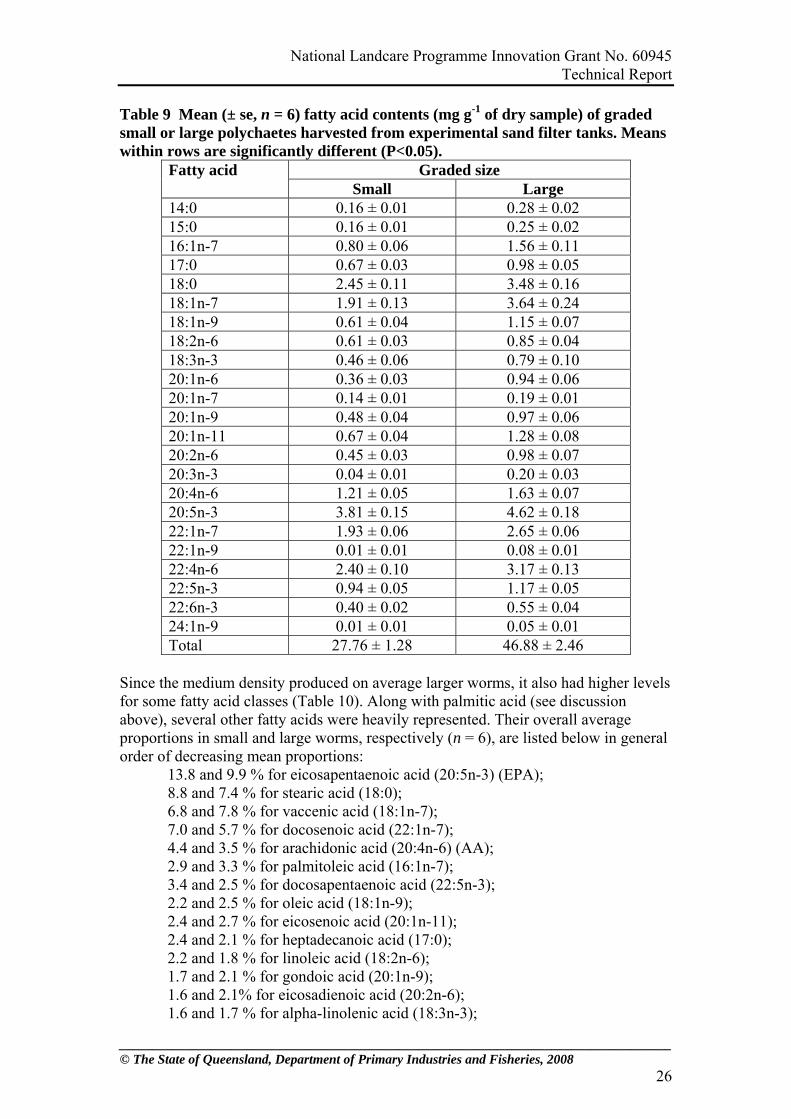
ed ns
ed size
Table 9 Mean (± se, n = 6) fatty acid contents (mg g-1 of dry sample) of gradsmall or large polychaetes harvested from experimental sand filter tanks. Meawithin rows are significantly different (P<0.05).
GradFatty acid Small Large
14:0 0.16 ± 0.0 0.02 1 0.28 ± 15:0 ± 25 20.16 0.01 0. ± 0.0 16:1n-7 .80 ± 0 6 1.56 ± 0.11 0 .017:0 0.67 ± 98 5 0.03 0. ± 0.018:0 2.45 ± 0 1 3.48 ± 0.16 .118:1n-7 1.91 ± 0.13 3.64 ± 0.24 18:1n-9 .61 ± 0 4 1.15 ± 0.07 0 .018:2n-6 0.61 ± 0.03 0.85 ± 0.04 18:3n-3 0.46 ± 0.06 0.79 ± 0.10 20:1n-6 0.36 ± 0.03 0.94 ± 0.06 20:1n-7 .14 ± 0 10 .0 0.19 ± 0.01 20:1n-9 0.48 ± 0.04 0.97 ± 0.06 20:1n-11 0.67 ± 0.04 1.28 ± 0.08 20:2n-6 0.45 ± 0.03 0.98 ± 0.07 20:3n-3 0.04 ± 0.01 0.20 ± 0.03 20:4n-6 1.21 ± 0.05 1.63 ± 0.07 20:5n-3 3.81 ± 0.15 4.62 ± 0.18 22:1n-7 1.93 ± 0.06 2.65 ± 0.06 22:1n-9 0.01 ± 0.01 0.08 ± 0.01 22:4n-6 2.40 ± 0.10 3.17 ± 0.13 22:5n-3 0.94 ± 0.05 1.17 ± 0.05 22:6n-3 0.40 ± 0.02 0.55 ± 0.04 24:1n-9 0.01 ± 0.01 0.05 ± 0.01 Total 27.76 ± 1.28 46.88 ± 2.46
ince the medium density produced on average S larger worms, it also had higher levels
eral
:5n-3) d 7.4 %
7.0 and 5 r n (2 7).4 and 3 r do d ( 6)
2.2 and 2.5 % for oleic acid (18:1n-9);
1.6 and 2.1% for eicosadienoic acid (20:2n-6); 1.6 and 1.7 % for alpha-linolenic acid (18:3n-3);
for some fatty acid classes (Table 10). Along with palmitic acid (see discussion above), several other fatty acids were heavily represented. Their overall average proportions in small and large worms, respectively (n = 6), are listed below in genorder of decreasing mean proportions:
13.8 and 9.9 % for oic acid (20 eicosapentaenaric acid (1
(EPA); 8.8 an6.8 and 7.8 % for vaccenic acid (18:1n-7);
for ste 8:0);
.7 % fo docose oic acidn
2:1n- ; 4 .5 % fo arachi ic aci 20:4n- (AA);2.9 and 3.3 % for palmitoleic acid (16:1n-7); 3.4 and 2.5 % for docosapentaenoic acid (22:5n-3);
2.4 and 2.7 % for eicosenoic acid (20:1n-11); 2.4 and 2.1 % for heptadecanoic acid (17:0); 2.2 and 1.8 % for linoleic acid (18:2n-6); 1.7 and 2.1 % for gondoic acid (20:1n-9);

National Landcare Programme Innovation Grant No. 60945 Technical Report
___________________________________________________________________________________ © The State of Queensland, Department of Primary Industries and Fisheries, 2008
27
r for small (3.0 : 9.5 : 1) and large (3.0 : 8 s, differing only in the EPA Table 10 Mean (± se, n = 6) fatty acid contents (mg g-1 of dry sample) of polychaetes harvested from experimental sand filter tank ith high or medium densities. Means within gnificantly di .05).
ocking densit
1.3 and 2.0 % for eicosenoic acid (20:1n-6); 1.4 and 1.2% for docosahexaenoic acid (22:6n-3) (DHA).
The AA : EPA : DHA ratios were somewhat simila.4 : 1) worm content.
s stocked w rows are si fferent (P<0
St y Fatty acid High Medium
14:0 0.19 ± 0.02 0.25 ± 0.03 16:1n-7 1.01 ± 0.14 1.36 ± 0.19 17:0 0.76 ± 0.06 0.89 ± 0.08 18:0 2.69 ± 0.19 3.25 ± 0.27 18:1n-7 2.39 ± 0.32 3.17 ± 0.44 18:1n-9 0.77 ± 0.11 0.99 ± 0.14 20:0 0.06 ± 0.00 0.08 ± 0.00 20:1n-6 0.57 ± 0.11 0.72 ± 0.15 20:1n-7 0.14 ± 0.01 0.18 ± 0.01 20:1n-9 0.62 ± 0.09 0.83 ± 0.13 20:1n-11 0.85 ± 0.11 1.09 ± 0.16 20:2n-6 0.62 ± 0.10 0.81 ± 0.14 20:3n-3 0.08 ± 0.03 0.16 ± 0.04 20:4n-6 1.32 ± 0.08 1.52 ± 0.11 22:1n-7 2.20 ± 0.13 2.38 ± 0.19 22:6n-3 0.42 ± 0.03 0.52 ± 0.04 24:0 0.04 ± 0.01 0.08 ± 0.01 Total 33.40 ± 3.42 41.24 ± 4.93
he most heavily represented amino acids found in the polychaete biomass were
For those amino acids not shown in Table 11, the ove elow in decreas
Tglutamic acid, aspartic acid and glycine. The levels of these and three other amino acids were significantly affected (P<0.05) by graded size, but none were affected(P>0.05) by stocking density. In general there were lower concentrations of each amino acid tested in large worms than in small worms, and for those listed in Table 11 this difference was significant (P<0.05).
rall mean (± se, n = 12) levels (on a dry matter basis) are listed bing order: 37.59 ± 0.67 mg g-1 arginine; 36.35 ± 0.49 mg g-1 leucine; 29.70 ± 0.44 mg g-1 proline; 23.73 ± 0.30 mg g-1 threonine; 23.19 ± 0.34 mg g-1 valine; 21.77 ± 0.30 mg g-1 serine; 20.66 ± 0.29 mg g-1 isoleucine; 19.20 ± 0.36 mg g-1 phenylalanine; 17.26 ± 0.32 mg g-1 tyrosine; 9.08 ± 0.88 mg g-1 methionine; 6.05 ± 0.15 mg g-1 tryptophan; 5.67 ± 0.46 mg g-1 cystine.

National Landcare Programme Innovation Grant No. 60945 Technical Report
___________________________________________________________________________________ © The State of Queensland, Department of Primary Industries and Fisheries, 2008
28
Table mg g-1 of dry sample) of graded small o lter tanks. Means
ze
11 Mean (± se, n = 6) amino acid contents (r large polychaetes harvested from experimental sand fi
within rows are significantly different (P<0.05). Graded siAmino acid
Small Large Glutamic acid 77.23 ± 1.03 72.57 ± 1.27 Aspartic acid 53.70 ± 0.74 50.36 ± 1.01 Glycine 52.62 ± 0.63 45.69 ± 0.64 Alanine 37.84 ± 0.6 49 ± 0.71 0 34.Lysine 32.11 ± 0.66 29.30 ± 0.54 Histidine 12.26 ± 0.36 11.10 ± 0.28
Discussion In the e a research group he Woods Ho phic Institut reference to the p e of detrital fo integrated polyculture systems and methods er treatment ( 1972, 1975; Tenore 74). Their work i ater enriched with nutrients from treated sewage effluent. The mari kton which pr re channe arious constructe s for seafood production and nutrient assimil lve molluscs (o ms), polychae d other invertebrates (amphipods) domin nthic components which complemented fish and s that were also nt sinks. The loped were ecologically stable, were productive of a diverse array of useful organisms, and almost completely removed inorg from waters Unfortunately since then, large sc re systems ha veloped as intensive monocultures. These ty d unbalance that result in
w utilisation of nutrient inputs. Intensive shrimp farms that use the flow-through nds
gs,
of
duction (eg. see Neori et al., 2000; 2004; 2007; Jones e Avnimelech, 2007 and Crab et al., 2007), few are inte s to make use of their inherent productivities at large sc ition of the significant nutrients that are wasted in this z ge. Animals which can grow in this zone, like Polych rtion of wasted nutrient to create additional profit. They m the farm environment by improving pond bottom ents (Chareo in the decomposition and convers ble nutrients for improved plant productivity, just as
arly 70’s, working at t le Oceanograion made otential valu od chains in
for wastewat Ryther et al.,et al., 19 nvolved seaw
ne phytoplan oliferated welled into v d ecosystemation. Biva ysters and cla te worms, an
ated in the be seaweed used as nutrie models deve
anic nitrogen discharged.
ale aquacultu ve mainly depically involve d ecosystems
lomodel are an example, where relatively low percentages of nutrients applied to poare assimilated by stock (eg: 18-27% of N and 10-15% of P: Funge-Smith and Brig1998; 22 % of N: Preston et al.,n 2000). This creates what is widely considered unacceptable ecological footprints (Folke et al., 1998) and involves inefficient usenatural marine resources (Deutsch et al., 2007). Although several innovative groups around the world are striving to create more efficient, commercially relevant, zero exchange or recirculation systems for environmentally friendly seafoods pro
;t al., 2002; Brune et al., 2003grating benthic detrital systemale. This is despite wide recogn
ludone as settled material and saeta, can make use of this poay also improve the condition of soil structures and promoting oxidation of reduced sulphides in sedim
ral they aidnpanich et al., 1994). In geneion of organic matter into availa
earthworms do in horticulture.

National Landcare Programme Innovation Grant No. 60945 Technical Report
___________________________________________________________________________________ © The State of Queensland, Department of Primary Industries and Fisheries, 2008
29
terest in this work is their application to broad-scale sand filtration beds. al inter-tidal species from the family Nereididae were pre screened for this use in pilot work at BIARC 06 using s fish- and pra tewaters. Both polychaete species demons roduction lev 00 g per m2 in sand beds, and functi d to reduce for prolong on (DPI&F unp As demonstrated in the present study, this for er treatment can ate reduction and phosph icant reduction ll and suspe d
gnific sion of particulate base
ind this new form of brackish water treatment lies in the burrowing grow
d
ies
a silt
freely, we did not find evidence of the
his
in
tinually expending energy to evacuate sand
DPI&F are currently leading research efforts in Australia to stimulate the wide-spread uptake of polychaete technologies for the increased profitability and sustainability of tropical marine aquaculture systems. Of particular in
Two subtropicviously
in 2005 and 20 emi-intensive wn-pond wastrated yearly p els of about 4
filtration onally appeare sand clogging ed filtrati ublished data).m of wat provide moder s of nitrogen orus, signifant conver
s in chlorophyd nutrients into dissolved form
nded solids, ans. si
The principle behand feeding activities of the worms in the sand, and their ability to survive and on the deposited organic material. They appear to help maintain flow through the sanfilter whilst organic debris (algae and particulate matter) that is trapped by the sand directly and/or indirectly becomes their food. The worm biomass production levels are sufficiently valuable to fund these low-maintenance water remediation activiton a broad scale (sand bed construction, stocking with worm juveniles and worm biomass harvest), since the live worms produced are suitable for lucrative bait markets and their proximal and fatty acid analyses suggest they are also valuable for use as marine broodstock conditioning and maturation diets (for fish and crustaceans). To build on these encouraging preliminary results at BIARC, there was a need toepeat the work in a commercial farm environment. Particularly since the extrr
loading in wastewaters from earthen ponds (BIARC has fully lined ponds) had the potential to block the sand filter beds, thus limiting water filtration efficiencies, and possibly affect the growth and nutritional content of the polychaetes produced. To assess the potential for these limitations, the Bullock Creek Prawn Farm at Donnybrook in South East Queensland was selected. It has operated for many years with earthen ponds and therefore generates challenging conditions in this regard. Despite our previous work which showed that higher worm densities facilitated the assage of water through the sand substrate morep
this effect in the present farm trial. However, the reason for this could be that bothmedium and higher densities used were sufficient to provide this desired effect. Twas certainly apparent towards the end of the trial when all sand beds were devoid of surface fouling and were obviously being grazed regularly by the inhabiting worms. These species are known to emerge from their burrows at night and when water levelsover the substrate are low, when they graze clean all surfaces that they can access. Their ingestion of organic-rich sediments, and deposition of faecal mounds on the surface, acts to turn over or renew surface sediments on a regular basis (active bioturbation). In general the size of hole in the surface of the bed indicates the size of the worms that are present, and this is evidence of their surface foraging activities whilst partially remaining in their burrows. The mound building that was apparent all tanks in this trial suggested that the populations were in some respects coordinating their sand deposition on the beds’ surfaces. This may be an adaptation
hich helps adjacent animals from conw

National Landcare Programme Innovation Grant No. 60945 Technical Report
___________________________________________________________________________________ © The State of Queensland, Department of Primary Industries and Fisheries, 2008
30
n
This is ll back
to pore space after being physically resuspended in overlying water. Of course, this
in
bove design operation needed during heavy rainfall. Although sand depths of 600
P (~
e nt are
ever e availability and cost of bulk sand supplies guided selection of a grade that allowed
nage pipes.
complexity to the bed construction phase. Several textile materials wrapped around
deposited in their burrow by their neighbours, and to ensure that some access to the surface remains, even when worm densities are high. Our previous (as yet unpublished) work has also shown that this surface activity is insufficient to keep the surface clean when the worms are young and when their populations are underdeveloped. Surface blocking then occurs, and particularly whethere are heavy organic loads such as coarse diatoms being deposited on the sand. It generally takes several weeks for worm populations to reach a critical level ofbiomass to provide an effective surface cleansing effect. If flow rates through the sand (filtration rates) are insufficient to meet the farms needs in the meantime, it is nevertheless possible to provide the temporary remedy of raking the surface. best undertaken when the bed is dry, so that fine silts do not immediately fainbiological sand-cleansing effect can be overloaded at any time with excessive suspended matter, so it is important in the operation of this type of system to integratea range of effluent treatment systems, and to regulate the flow. As demonstrated in this study, this could involve the normal deposition of the heaviest suspended solids the middle of prawn ponds, with effluent to be treated by sand beds drawn in a metered fashion from monk drains around the periphery of ponds. Many of the design principles of sand filters proposed for filtration of domesticstormwater (WSUD, 2006) serve as comparisons with this application. Both applications require provision of overflow capacity that is oversized to account for amm are typically proposed for these “Water Sensitive Urban Design” sand filters (WSUDSF) and that this depth has been found effective in removing TSS, TN and T(CRCCH, 2005), a much smaller effective sand depth was used in the present work 200 mm total and 140 mm above the under-drain pipe) to minimise the cost of sand. This would be particularly important when applying this method at large scale. Sincthe nature of particle sizes that are to be intercepted from mariculture effluemuch smaller (eg: microalgae down to 1 µm) than in stormwater, finer filter media was also necessary. This reduced the pore size and the water infiltration rate, howthreasonable hydraulic conductivity and removed most small algae species. Assuming that this particular sand product had an approximate bulk density of 1.4 tonnes m-3, and that each m2 of bed had 0.2 m3 (200 mm deep) of sand, each m2 of bed used 0.28 tonnes of sand. At a cost of $A22 tonne-1 (excluding delivery costs and bulk handlingdiscounts) sand in the beds at larger scale would cost in the order of $A600 per 100 m-2. This cost of sand is relatively low considering the potential quantities of polychaetes (approx. 33 kg based on present demonstrated average) coupled with their high value, as well as the wastewater remediation properties that the bed would simultaneously offer. Another significant difference between the way WSUDSF are proposed to operate and that of the present study, are in the ways the beds are constructed and the filtersoperate. In WSUDSF a fine gravel drainage layer over the perforated pipe system helps prevent the finer filtration media from entering and blocking the draiHowever this approach is unsuitable in polychaete sand filters because this course material would block sieves used to harvest the worms, and would add unnecessary

National Landcare Programme Innovation Grant No. 60945 Technical Report
___________________________________________________________________________________ © The State of Queensland, Department of Primary Industries and Fisheries, 2008
31
nd in the bed. These include 3-5 yers of shade cloth, light geofabric (eg: Biddum by Geofabric Pty Ltd), and
low)
ary
ch
ch
water through e sand, filtration rates increase with head pressure above the mass of sand
id not practical
r in this theoretical equation is the hydraulic conductivity of the -1
e
the perforated pipes have provided adequate protection of drainage lines in this and our previous work which has used a single grade of salacommercial ag-pipe gauze, and several other commercial products are available andwould likely be suitable. Additionally, rather than using Darcy’s equation (see beto predict the maximum percolation rates possible through the sand filter, and then ensuring that the capacity of the under-drains is greater than this Qmax, filtration rates in our work have been restricted by the under-sizing of drain outlets. This primchoke in the system has been gauged to provide reasonable flow based on a 1:10 treatment area to production pond basis, and is designed to help prevent too musuction pressure developing which places pressure on the textile material protecting drainage pipe perforations. In general we have also tried to use pipe protecting material that has a pore size much greater than the largest particles which travel through the sand filter, so that it is the sand rather than this textile material whibecomes the secondary choke in the system. One of several mediating factors which affect filtration rate is the depth of water which builds over the sand filter as inflow exceeds drainage rates. Since the Polychaete filtration system is based on gravity driven percolation ofth(identified as hmax in Darcy’s equation below). In the present study, this factor dremain constant due to the regular tidal simulation, but this pattern of use hasapplication in mitigating variable flows from the production ponds at a prawn farm, particularly if the sand filter is built on the bottom of sedimentation ponds which receive intermittent (eg: daily) flows from the farm.
nother variable facto
Darcy’s equation
Qmax = k . A . (hmax + d) / d where, Qmax is the maximum infiltration rate (m3 /s)
k is the hydraulic conductivity of the soil filter (m / s) A is the surface area of the sand filter (m2) hmax is the depth of pondage above the sand filter (m) d is the depth of the filter media (m)
Asand filter (k). This can generally vary for different grades of sand from 1 mm s to0.1 mm s-1 (WSUD, 2006), and Palacios and Timmons (2001) have provided modifications to Darcy’s equation which account for TSS loading. However, in the present work the drainage pipe outflow restrictors prevented filtration rates from ever achieving their maximum flows. As the relatively high loading of silt and organic debris clogged the pore space in the sand beds, k was undoubtedly reduced until the polychaetes’ activities on the surface became significant. Furthermore, maximum daily filtration rates were not routinely achieved in the present experiment because th

National Landcare Programme Innovation Grant No. 60945 Technical Report
___________________________________________________________________________________ © The State of Queensland, Department of Primary Industries and Fisheries, 2008
32
d
trate the
d-1 f
ge is
nable exchange rate for intensive prawn ulture ponds (5-10 % d : Funge-Smith and Briggs, 1998; 5-30 % d-1: Vigneswaran et
s in
t n, an approach of flowthrough
nd treated release could prove better from a farming perspective, particularly since new phytoplankton seeds from adjacent natural waters are often useful for pond manage tion rates can cause excessive salinities when waters are conti during dry seasons. The cobed was not surprising given that san used for this purpose in municipal water treatm lications (Vigneswaran et al., 1999). In practical termin the surface layers o water infiltration mainly occurs with prolonged use (Palacios and TQueensland EPA poli marine prawn farms to 12 kg hadischarge event (Qld E load gives an average concentration of 8 mg L
ecessary each day. By comparison, the overall mean for the outflow TSS for al
h
6-hourly inflow patterns applied generally allowed sand beds to drain completely anremain dry for a period of time on a regular basis. The reasoning behind this was to provide this intertidal polychaete with more natural conditions, and to demonsflexibilities of the filtration beds in terms of effectively treating wastewaters that are supplied on an intermittent basis. Future research will investigate whether this tidal simulation is necessary for the growth of this polychaete species, so that daily treatment rates can be increased via continuous filtration if necessary. The present study sought to set a water handling rate for sand beds of 1,500 L m-2
(2,760 L tank-1 d-1), which generally was successfully adhered to for the majority othe trial (refer to Figures 3 and A 2) given the water supply failings and other relatedcomplications which prevailed during later periods of the experiment. This nominal amount was based on a 10 % daily exchange rate for culture ponds with an averadepth of 1.5 m and assuming 1 ha of sand bed for every 10 ha of culture ponds. Thwater exchange rate, by all accounts is a reaso
-1cal., 1999). The percentage of farm area accounted for by sand beds in this design (ie. 10 %) is well under the areas currently required in government licensing arrangementQueensland for settlement/treatment ponds (ie. 30% of farm area). This potentially allows for additional infrastructures (eg: seaweed culture beds, see below) which could be integrated with these sand-based water treatment measures for further nutrient recovery and removal from waste streams prior to release back to adjacenwaterways. Rather than complete on-farm recirculatioa
ment options, and since high evaporanually recirculated on farms
nsistent significant removal of suspended solids from pond waters by the sand d filtration has long been
ent (Campos et al., 2002) and various aquaculture apps suspended solids are mainly captured
f sand filters, and this is where resistance to immons, 2001). Currently,
cy restricts discharge of suspended solids from existing-1 d-1, with a maximum of 75 mg L-1 for any isolated
PA, 2008). This total allowable daily-1 if we assume (as above) that 10 % pond exchange is
n l eight sampling times in the study was 11.3 mg L-1, which is only slightly higher than this calculated mean discharge level, and not significantly higher using the 5 % LSD value derived for comparisons of treatments in the analysis (9.7 mg L-1). Thus, in terms of TSS, the method offers existing prawn farmers the ability to adequately remediate wastewaters according to current EPA standards. Chlorophyll a and BOD levels are not specified in the current EPA standards althougthese parameters were previously limited by licence conditions. Several years ago, before the present solids- and nutrient-load based system evolved, Chla was generally

National Landcare Programme Innovation Grant No. 60945 Technical Report
___________________________________________________________________________________ © The State of Queensland, Department of Primary Industries and Fisheries, 2008
33
nd ercolating
rough them, and this effect was more pronounced during the middle part of the day
t
its w
ival ly be
rge standards quire pH levels to be between 6.5 and 9.0, and this upper limit is often exceeded in
les.
disease
hese
water could protect atural environments or recirculated aquaculture ecosystems from amplified disease
limited to a maximum of 40 µg L-1 and 5-day BOD to a maximum of 10 mg L-1. The sand bed filtrate easily complied with these previous Chla limits, but exceeded the previous BOD limits. The effect of the experimental system on water temperatures was largely due to the tank covers which trapped solar radiation to heat water within the tanks. The sabeds then appeared to provide a degree of insulation to cool the water pthwhen the sun was at it hottest. Elevated temperatures (within natural ranges) have previously been shown to increase the sediment mixing and bioturbation of some polychaetes (Ouellette et al., 2004), so it is likely that an optimal temperature range exists which stimulates the surface activity and desirable cleansing actions of differenspecies at the sand bed’s surface. Perinereis helleri was shown in this study to tolerate temperatures up to 34.9ºC, and though its lower tolerances were not approached during this summertime study, they are not likely to be challenged in this regard in any coastal areas of Queensland, or indeed anywhere that tropical prawns are cultured. Similarly, salinities of 40.4 ppt. were tolerated by this species, and this is likely not upper salinity limit. Nereid polychaetes are also well known for their relatively losalinity tolerances, since they have been found to inhabit areas in close proximity to freshwater springs (Zipperle and Reise, 2005). These are important points for survin prawn farming environments which can regularly and sometimes quite severeaffected by evaporation and precipitation. The system also appears to offer a particularly effective way of tempering the pH fluctuations in discharge waters from prawn ponds, whereby outflow pH levels remained relatively stable and more neutral compared with climbing inflow levels as the stock biomass in the prawn production pond increased. EPA dischareeutrophic ponds supporting a strong algal bloom. Although dissolved oxygen levels inbed filtrate were below the EPA minimum of 4 mg L-1, this could easily be rectified with simple methods of aeration (eg: gravity driven ripples or open flow in channels). The treatment of pond waters in these types of sand beds may further offer several biosecurity advantages for mariculture systems by helping to break disease cycPrimarily, most organisms which could carry these diseases are screened out with the fine particulate matter being trapped in the sand, so that biological vectors fortransfer would be greatly reduced. Polychaetes, anaerobic bacteria and protozoans associated with their burrows would be the most likely organisms to leak from tsystems. These are already very common in all estuaries and indeed in most aquaculture systems where sludge accumulates, so could not generally present additional risks to the health of receiving waters. Furthermore, very few organisms can withstand the temporarily hostile conditions created by stripping of all oxygen and combining the very low redox potential with the presence of sulphide rich sediments. Therefore, this form of in-line treatment of pond-nlevels in intensive operations.

National Landcare Programme Innovation Grant No. 60945 Technical Report
___________________________________________________________________________________ © The State of Queensland, Department of Primary Industries and Fisheries, 2008
34
mposition of settled organic materials. Expansion of
naerobic/aerobic interfaces in the sediment increases the biological productivity of
of
.
utes) of
007) recently highlighted the rapid oxidation of sulphide in the
oundary layers between anaerobic and aerobic sediments, where patches of white
1981) and/or those utilising the sulphur fter its transition to an oxidised form. Interestingly, this sulphur-rich gel is also likely
is ic
ading of 1.0 kg ha d with a maximum level of 3.0 mg L for nitrogen, and 0.15
hen it n the
t is
and ed
e night before.
The polychaete burrowing activities in substrate adds further to the general health of ecosystems by oxygenating otherwise anaerobic sediments, which leads to a greaterdegree of aerobic decoasubstrates and the diversity of benthic organisms it can produce. Such increased biological diversity can add directly to natural food chains within recirculated aquaculture systems and thus further improve nutrient use efficiencies. Conversionwaste carbon into benthic food organisms that are used by the target crop (eg: prawns)will reduce the accumulation and development of reduced organic materials (eg: sulphides) and will also reduce the release of greenhouse gases like carbon dioxide Low levels of sulphide (up to 0.3 mg L-1) have been measured from time to time in this type of anaerobic discharge when samples are meticulously collected immediately after release from the sand bed. However, after a very short period (a few minexposure to dissolved oxygen (eg: by simply adding to an open water body), it is either volatised or converted to sulphate, loosing its smell and potential toxic effect. Neori et al. (2belemental sulphur were often visible. In the present system, this white material also typically forms in the immediate stream of water discharging from the sand beds, where the odour of hydrogen sulphide indicates the existence of anaerobic sedimentswithin. However, this white material is generally combined with a bacterial slime or gel, which is likely associated with the bacteria involved in this sulphur deposition (eg: Beggiatoa sp., Nelson and Castenholz,ato constantly form on the insides of the worms burrows, and probably provides, or the base of, an important food source for inhabiting polychaetes and other benthorganisms (Reise, 1981), as it is in areas directly adjacent to deep ocean hydrothermalvents (Van Dover and Lutz, 2004). Regarding the removal of nitrogen and phosphorus from prawn pond water, the results were disappointing compared with previous results in smaller systems and over shorter time frames. The EPA standards for existing farms relate to an average
-1 -1 -1lokg ha-1 d-1 with a maximum level of 0.4 mg L-1 for phosphorus (Qld EPA 2008). These total allowable daily loads give average concentrations of 0.67 mg L-1 of nitrogen and 0.1 mg L-1 of phosphorus if we assume (as above) that 10 % pond exchange is necessary each day. The sand filtrates generally had levels below these maxima but higher than the operational averages. Mass balance calculations showedthat portions of these nutrients were effectively captured by the process for several weeks, but this collective benefit was lost during the second part of the trial wappeared that the majority of nitrogen and phosphorus which had accumulated ibed was released. It was not possible to determine if this result was more an artefacof the way water flows and sampling times were managed during the trial, or if this an unavoidable function of nutrient accumulation followed by remineralisation release. But most likely, our samples taken on the 29th March, detected a short-livpulse of ammonia and orthophosphate which had accumulated in the sand bed duringthe period of limited flushing th

National Landcare Programme Innovation Grant No. 60945 Technical Report
___________________________________________________________________________________ © The State of Queensland, Department of Primary Industries and Fisheries, 2008
35
farms. r
sing
ischarge stream of polychaete sand filters (see Figure 21). Even without the ’s
ha
and s
However, the significant conversion of these nutrients into dissolved forms (availablefor plant uptake) suggests that integrated macrophyte production systems could be designed for further water polishing and diversification of product on prawnThis would be particularly useful if sand beds could be effectively managed to delivea pulse of concentrated dissolved nutrients to such macrophyte systems. Several factors which have previously created difficulties for seaweed culture systems uraw prawn pond water (eg: suspended solids: Jones et al., 2002; phytoplankton and herbivorous invertebrates like amphipods: Palmer, 2005) are also effectively reduced by this sand filtration process. Preliminary work at BIARC has demonstrated the potential to grow very pure cultures of several naturally occurring seaweeds in the dassociated production and potential profitability of polychaete biomass, the sand bedfunction of water clearing and break down of particulate organic matter to provide stabilised and available nutrient sources, creates major opportunities for new businesses and seafood products in the future. For example, the dried Enteromorpsp. that has been grown at BIARC using this system has been shown to have useful protein and gross energy contents (22.8-25.9 % and 11 MJ kg-1, respectively),along with the polychaetes (also grown using waste nutrients) have been proposed auseful feed ingredients that could attain organic certification in the future (Slattery and Palmer, 2007).
Figure 21 Pictures of a naturally occurring seaweed (Enteromorpha sp.) growinvigorously in pond wastewater after polychaete sand bed treatment. The polychaete species used in this study (Perinereis helleri) can be viewed as asuitable proxy for a range of locally available species that could similarly be usethis type of application in different parts of the world. However, there are likely to bemany species which can equally or better utilise the growth conditions created. For example, although Meksumpun and Meksumpun (1999) documented naturally occurring Perinereis sp. in shrimp ponds in Thailand, other species (eg: Notomastus sp.) were more prevalent in, and were suggested as more suitable for controlling the organic enrichment of those sediments. Of particular importance in this pursuit is the economic value and potential commercial uses of the selected species, since the potential scale of production made possible by the simple low maintenance techniqudescribed herein, could offer the means to address the over-harvesting of wild populations that is occurring for exploited polychaetes around the world (see Scaps, 2003; 2004).
g
d for
es

National Landcare Programme Innovation Grant No. 60945 Technical Report
___________________________________________________________________________________ © The State of Queensland, Department of Primary Industries and Fisheries, 2008
36
n at
s, and
ed high
ile cking methods that were applied. Furthermore, the similarities of
verall production levels at the two densities suggest that a carrying capacity exists for a given amount of sand that is receiving a consistent organic loading. Along with the documented differences in polychaete biomass contents at different sizes and densities, these findings may allow managers in the future to select for particular products that may be more suitable for specific uses. These factors add further confidence to the imminent commercialisation phase of these technologies in Australia
Conclusion This project sought to begin investigations into the commercial application of beneficial production technologies for this new Class of animal in tropical Australia.
n existing ariculture operations like semi-intensive prawn farms. The first step in this
t
rients produced by the process reduced its potential to remove gnificant amounts of nitrogen and phosphorus on its own. However, this combined
with solids and phytoplankton removal sets up particularly suitable conditions for the
These points are particularly relevant in light of some of the most recent work with a very similar species (Perinereis nuntia) in Thailand. Poltana et al. (2007) have recently documented this species’ artificial production specifically for feeding to shrimp broodstock. Cultured population were screened for known prawn pathogens as they grew towards production levels of 3-4 kg m2 over five months (stocked as nectochaetes at 6,000 m2). This is ten times the production levels achieved in the present study, but this was also as the result of feeding the bed with fish meal up to three times per day. In Australia, where labour costs are higher, and where nutrient releases from mariculture enterprises are more heavily scrutinised, their productiomore extensive levels using waste nutrients is likely to be preferred. Their on-farmproduction would avoid the dangers of disease introductions from wild sourceensure their extended availability and freshness for feeding to prawn broodstock. P.helleri’s survival and production levels in the present study, and demonstratvalues as bait and high quality feed, appear sufficient to drive their economical implementation in the wastewater treatment methods that are documented. Althoughstocking levels in this study were assumed to be somewhat imprecise, due to the gregarious nature of juveniles in the nursery beds, the numbers recovered from replicate grow-out beds were surprisingly consistent adding confidence to the juvenenumeration and stoo
It was anticipated that profitability and sustainability could be improved by integrating polychaete production and wastewater treatment systems withimintegration was to understand what effects the proposed system could have on wastewater. Results show how a 1 ha sand bed can treat wastewater from a 10 ha prawn farm using 10 % pond water exchanges rates each day. Suspended solids and chlorophyll a can be reduced to environmentally acceptable levels in one pass of a polychaete sand filter. Unlike the currently used settlement ponds, this can be a continuous treatment process that does not require settlement time delays, and it onlyuses 10 % rather than 30 % of farm area. Although this style of water treatment system could easily be overloaded with silt or algae which clog the filtration bed, its operation in conjunction with a normally circulating pond with monk drain outlepositioned on the periphery, affords it effective continuous operation for a full prawn cropping cycle. Dissolved nutsi

National Landcare Programme Innovation Grant No. 60945 Technical Report
___________________________________________________________________________________ © The State of Queensland, Department of Primary Industries and Fisheries, 2008
37
to
s pplemental feeds).
a
a .
g
to
and f brackish waters in estuaries that receive uncontrollable nutrients from
ther anthropogenic sources.
search
e author
e
r k
Standard Methods for the examination of water and wastewater, L.S. lesceri, A.E. Greenberg, and R.R. Trussell, (Editors). Port City Press: Washington.
integration of seaweed culture systems in the discharge. It also produces a commercially useful by-product, namely polychaetes suitable for various uses. This study shows how profitability would be enhanced directly by adding the economic value of marine worm biomass produced from waste nutrients to aquaculture businesses. It also shows how mariculture operations may be able to improve their nutrient abatement activities and expand in an environmentally responsible way. These developments also offer several other sustainability aspects natural resource managers, including reduced pressures on wild bait worm stocks and a reduction in the associated habitat disturbances of the natural environment. They offer potentially self-funding water treatment methods and provide by-products that can alternatively be internalised within the operation (eg: worms produced for use asu Without changing the presently accepted 70 % production to 30 % treatment areratio, an idealised farm design in the future which takes the present results and discussion into consideration may practically look towards up to 10 % of farm arecommitted to discharge collection and volume mitigation in settlement channelsThese settlement channels could then supply metered pre-settled wastewater to Polychaete sand beds occupying a further 10 % of farm area, which then feed sand filtered water enriched in dissolved nutrients to seaweed culture beds in the remainin10 % of treatment/farm area. This design not only holds potential to improve water treatment activities so that the environmental footprint of intensive mariculture operations is reduced, but it would also significantly diversify the produce and addfarm productivity and profitability. This broad scale approach to treating pond mariculture effluent could also find application in the nutrient collection from,treatment oo
Acknowledgments This research was jointly supported by the Queensland Government’s Department of Primary Industries and Fisheries (DPI&F) through their State Aquaculture reprogramme, and the Australian Government’s Department of Agriculture, Fisheries Forestry through their National Landcare Programme - Project No. 60945. Thwishes to thank Richard Thaggard, Catriona Morrison, Daniel J. Willett, Mick Markey, Kelli Anderson and Mahdi Green for technical support at BIARC and in thfield. Also thanks to DPI&F’s Avis Houlihan from Innovative Food Technologies, and Ian Brock, Adam Pytko and Peter Martin from the Animal Research Institute fobiomass analyses. Special thanks to Peter Spindler and Judy Butler of the BullocCreek Prawn Farm for fostering this work.
References APHA - American Public Health Association. 1989. Total suspended solids dried at 103-105OC. In: Cp. 2-75.

National Landcare Programme Innovation Grant No. 60945 Technical Report
___________________________________________________________________________________ © The State of Queensland, Department of Primary Industries and Fisheries, 2008
38
ischarge
.
p. 1. Marine Pollution Bulletin. 28 (5): 314-318.
420.
file
rab, R., Avnimelech, Y., Defoirdt, T., Bossier, P., Verstraete, W. 2007. Nitrogen removal techniques in aquaculture for a sustainable production. Aquaculture 270: 1-
,
Troell, M. 1998. The ecological footprint Ecological Applications 8 (S):
ith, S.J., Briggs, M.R.P. 1998. Nutrient budgets in intensive shrimp ponds: plications for sustainability. Aquaculture 164: 117-133.
Avnimelech, Y. 2007. Feeding with microbial flocs by tilapia in minimal dbio-flocs technology ponds. Aquaculture 264: 140-147. Brune, D.E., Schwartz, G., Eversole, A.G., Collier, J.A., Schwedler, T.E. 2003Intensification of pond aquaculture and high rate photosynthetic systems. Aquacultural Engineering 28: 65-86. Campos, L.C., Su, M. F. J., Graham, N. J. D.,Smith, S. R. 2002. Biomass development in slow sand filters. Water Research 36: 4543-4551. Chareonpanicha, C., Tsutsumib, H., Montania, S. 1994. Efficiency of the decomposition of organic matter, loaded on the sediment, as a result of the biological activity of Capitella s Cohen, R.A., Fong, P. 2006. Using opportunistic green macroalgae as indicators ofnitrogen supply and sources to estuaries. Ecological Applications 16 (4): 1405-1 Costa, F.E.P., Narciso L. Fonseca, L. C. 2000. Growth, survival and fatty acid proof Nereis diversicolor (O.F. Muller, 1776) fed on six different diets Bulletin of Marine Science 67: 337-343 Costa, P.F.E., Passos, A.M., Da Fonseca, L.C. 2003. Polychaetes and their potential use in aquaculture. World Aquaculture September: 41-43. Costa, F.E.P., Gil, J., Passos, A.M., Pereira, P., Melo, P., Batista, F., Cancela daFonseca, L. 2006. The market features of imported non-indigenous polychaetes in Portugal and consequent ecological concerns. Scientia Marina 70 (3): 787-792. C
14. CRCCH (Cooperative Research Centre for Catchment Hydrology), 2005. Model for urban stormwater improvement conceptualisation (MUSIC) user manual. Version 3.0Melbourne. Deutsch, L., Gräslund, S., Folke, C., Troell, M., Huitric, M., Kautsky, N., Lebel, L. 2007. Feeding aquaculture growth through globalization: Exploitation of marine ecosystems for fishmeal. Global Environmental Change 17 (2): 238-249. Folke, C., Kautsky, N. Berg, H. Jansson A. oncept for sustainable seafood production: a review. c
63-71. Fujioka, Y., Shimoda, T., Srithong, C. 2007. Diversity and community structure of macrobenthic fauna in shrimp aquaculture ponds of the Gulf of Thailand. Japan Agricultural Research Quarterly 41 (2): 163-172.
unge-SmFim

National Landcare Programme Innovation Grant No. 60945 Technical Report
___________________________________________________________________________________ © The State of Queensland, Department of Primary Industries and Fisheries, 2008
39
Edition. VSN International td., Oxford.
socio-r Reef catchments. Hydrobiologia 591 (1): 25-
3.
ta, Nereididae) om Australia, with redescriptions of six additional species. Records of the
ndition of ysters and macroalgae used as biological filters of shrimp pond effluent. Aquaculture
eksumpun, C., Meksumpun, S. 1999. Polychaete-sediment relations in Rayong,
. 1981. Organic nutrition of Beggiatoa sp. Journal of acteriology 147 (1): 236-247.
tegrated system for culture f fish, seaweed and abalone. Aquaculture 186: 279-291.
te of e art emphasizing seaweed biofiltration in modern mariculture. Aquaculture 231:
ri, A., Krom, M.D., Rijn, J.v. 2007. Biogeochemical processes in intensive zero-ffluent marine fish culture with recirculating aerobic and anaerobic biofilters.
. 1999. Polychaete aquaculture and polychaete science: a mutual ynergism. Hydrobiologia 402: 175-183.
eds. In:
quaculture Europe 2001. Book of Abstracts European Aquaculture Society Special
e, D., Desrosiers, G., Gagne, J.-P., Gilbert, F., Poggiale, J.-C., Blier, P.U., tora, G. 2004. Effects of temperature on in vitro sediment reworking processes by a
GenStat. 2007. GenStat for Windows, Release 9.1, NinthL Gordon, I.J. 2007. Linking land to ocean: Feedbacks in the management ofecological systems in the Great Barrie3 Hutchings, P.A., Reid, A., Wilson, R.S. 1991. Perinereis (PolychaefrAustralian Museum 43 (3): 241-274. Jones, A.B., Preston, N.P., Dennison, W.C. 2002. The efficiency and cooResearch 33: 1-19. MThailand. Environmental Pollution 105: 447-456. Nelson, D.C., Castenholz, R.WB Neori, A., Shpigel, M., Ben-Ezra, D. 2000. A sustainable ino Neori, A., Chopin, T., Troell, M., Buschmann, A.H., Kraemer, G.P., Halling, C., Shpigel, M., Yarish, C. 2004. Integrated aquaculture: rationale, evolution and stath361-391. NeoeJournal of Experimental Marine Biology and Ecology 349 (2): 235-247. Olive, P.J.Ws Olive, P.J.W., Craig, S., Cowin, P. B. D., Islam, M. D., Rutherford, G. 2002. Theculture of Poltychaeta as a contribution to sustainable production of aquafeAPublication. OuellettSgallery biodiffusor, the polychaete Neanthes virens. Marine Ecology Progress Serie266: 185-193.
s
alacios, G.L., Timmons, M.B. 2001. Determining design parameters for recovery of Paquaculture wastewater using sand beds. Aquacultural Engineering 24: 289-299.

National Landcare Programme Innovation Grant No. 60945 Technical Report
___________________________________________________________________________________ © The State of Queensland, Department of Primary Industries and Fisheries, 2008
40
almer, P. J. (Ed.) 2005. Wastewater remediation options for prawn farms –
tries and Fisheries Project Rep. No. QO04018. ISSN 0727-6273. 93 p.
yachumnarnkul, B. 2007. Culture and development of the polychaete Perinereis f. nuntia. Invertebrate Reproduction and Development 50 (1): 13-20.
, P. on, origin and treatment. Fisheries Research &
evelopment Corporation: Technical Report No. 95/162. p. 1-71.
onal Policy, Version 1: Approved 04/03 (Current at January 008). http://www.epa.qld.gov.au/publications?id=675
PAquaculture Industry Development Initiative 2002-04. Queensland Department of Primary Indus Poltana, P., Lerkitkul, T., Pongtippatee-Taweepreda, P., Asuvapongpattana, S., Wongprasert, K., Sriurairatana, S., Chavadej, J., Sobhon, P., Olive, P.J.W., Withc Preston, N., Jackson, C., Thompson, P., Austin, M., Burford, M., Rothlisberg2000. Prawn farm effluent: compositiD Qld EPA. 2008. Licensing wastewater releases from existing marine prawn farms in Queensland. Operati2
e polychaete burrows. Marine cology Progress Series 6: 329-333.
enore, K. R., Huguenin, J. E. 1972. Controlled utrophication - Increasing food production from the sea by recycling human wastes.
yther, J.H., Goldman, J. C., Gifford, C. E., Huguenin, J. E., Wing, A. S., Clarner, J.
003. The exploitation and aquaculture of marine polychaetes. Bulletin de la ociete Zoologique de France 128 (1-2): 21-33.
e de
tems. t Corporation Final Report. RIRDC Project
o. DAQ-336A. ISBN RIRDC to assign; ISSN 1440-6845. 144 p.
an Dover, C.L., Lutz, R.A. 2004. Experimental ecology at deep-sea hydrothermal 2):
., Ngo, H. H., Wee, K. L. 1999. Effluent recycle and waste inimisation in prawn farm effluent. Journal of Cleaner Production 7: 121-126.
Reise, K. 1981. Gnathostomulida abundant alonsidE Ryther, J.H., Dunstan, W. M., TeBioScience 22 (3) (March): 144-152. RP., Williams, L. D., Lapointe, B. E. 1975. Physical models of integrated waste recycling - marine polyculture systems. Aquaculture 5: 163-177. Scaps, P. 2S Scaps, P. 2004. Commercial trade in Annelids. Bulletin de la Societe ZoologiquFrance 129 (1-2): 37-48. Slattery, S.L., Palmer, P.J. 2007. Growing organic prawns in inland saline sysRural Industry Research and DevelopmenN Tenore, K.R., Browne, M. G., Chesney, E. J. Jr. 1974. Polyspecies aquaculture systems: The detrital trophic level. Journal of Marine Research 32: 425-432 Vvents: A perspective. Journal of Experimental Marine Biology and Ecology 300 (1-273-307. Vigneswaran, Sm

National Landcare Programme Innovation Grant No. 60945 Technical Report
___________________________________________________________________________________ © The State of Queensland, Department of Primary Industries and Fisheries, 2008
41
th
Whitall, D., Bricker, S., Ferreira, J., Nobre, A.M., Simas, T., Silva, M. 2007. Assessment of eutrophication in estuaries: Pressure-state-response and nitrogen source apportionment. Environmental Management 40 (4): 678-690. WSUD, 2006. Water sensitive urban design: Technical design guidelines for SouEast Queensland. Version 1 June 2006. Chapter 8 Sand filters: 1-31. http://www.healthywaterways.org/FileLibrary/8_sand_filter.pdf Zipperle, A., Reise, K. 2005. Freshwater springs on intertidal sand flats cause a switch
. in dominance among polychaete worms. Journal of Sea Research 54 (2): 143-150

National Landcare Programme Innovation Grant No. 60945 Technical Report
___________________________________________________________________________________ © The State of Queensland, Department of Primary Industries and Fisheries, 2008
42
m comments
Appendix Table A 1 Source pond water qualities at the farm - samples taken off the jetty at depth of about 50 cm (see Figure 1)
Date Time Temp Sal pH DO Redox Algal bloo12 Jan 3.00 pm 29.0 39.2 8.3 8.0 Green bloom 18 Jan 12 noon - - - - - Greeny-brown bloom 25 Jan
1:00 pm
31.5
40.3
7.7
5.0
-25
Some vertical stratification in pond (paddle wheels off until 2 pm), greeny- brown bloom, dull
weather, changing algae with bloom die off apparent
26 Jan 2:00 pm - - 7.6 5.0 - Very pale green bloom 29 Jan 8:00 am - - - - - Green bloom looking more healthy 1 Feb 12 noon 30.7 41.0 7.9 5.3 69 Greeny-brown bloom 8 Feb 12 noon 28.4 37.8 8.1 6.7 80 Green bloom
15 Feb 12 noon 26.4 36.3 8.0 7.2 48 Green bloom 22 Feb
12 noon
27.0
34.6
8.1
6.9
61
Dull green bloom with pale silt from rain
1 Mar
12 noon
28.6
34.1
8.4
8.9
-19
Dull green bloom with pale silt from rain
8 Mar
12 noon
28.5
32.5
8.5
11.1
-15
Dull green bloom with pale silt from rain
15 Mar 12 noon 22 Mar 12 noon
Readings not possible due to low pond level Browny-green bloom
Table A 2 Source pond water qualities at the farm - samples taken from monk drain at depth of about 50 cm (see Figure 1)
Date Time Temp Sal pH DO Redox Water control comments 25 Jan
1:00pm
30.9
40.3
7.6
3.0
-59
No discharge through monk causing reduced DO
1 Feb
12 noon
30.8
41.0
7.9
5.2
71
Discharge has reduced build-up of organic matter so that DO is not depressed.
8 Feb 12 noon 28.4 37.7 8.1 6.8 81 15 Feb 12 noon 26.4 36.3 8.0 7.2 49 22 Feb
12 noon
27.1
34.5
8.0
6.6
59
Pond level approx 200 ml lower due to partial harvest
1 Mar 12 noon 28.7 34.1 8.4 8.7 -21 8 Mar 12 noon 28.2 32.4 8.5 10.3 -17
15 Mar
12 noon
27.4
29.2
8.7
9.9
-5
Pond level to about 10 % of total volume due to harvest
16 Mar - - - - - -
Pond refilled to approx 30% of total volume
22 Mar 12 noon 28.8 31.8 8.9 9.9 -121 29 Mar 12 noon 27.3 34.1 9.0 9.3 -117 5 Apr 12 noon 27.4 37.0 - 7.1 -88
12 Apr 12 noon 24.5 36.7 7.7 5.1 -16 no bloom 19 Apr 12 noon 26.6 37.0 7.5 4.1 -23 no bloom

National Landcare Programme Innovation Grant No. 60945 Technical Report
___________________________________________________________________________________ © The State of Queensland, Department of Primary Industries and Fisheries, 2008
43
Table A 3 Timelines for activities and general observations. Activity / observation Date
11 Jan Pond water running freely through all sand beds. 12 Jan Tanks 2, 4 & 6 stocked with Polychaetes. Water qualities in tanks measured at 6 pm. 13 Jan Tanks 1, 3 & 5 stocked with Polychaetes. 14 Jan Water qualities in tanks measured at 12 noon. 18 Jan W alit ks sur d nt takenater qu ies in tan mea ed an nutrie samples at 12 noon. 25 Jan W litie nk ur 12 n. Water lev er later in day. ater qua s in ta s meas ed at noo els getting high29 Jan Tanks 2, 3 & 6 ining re freely; algae on water anddra mo sand surfaces. 1 Feb
A till ng . J ile s fo in tanks easured d nutri sam es taken at 12 n on.
ll tanks s draini freely uven worm und beds of all tanks. Water qualities in m an ent pl o
3 Feb Surfaces of all sand beds anks) gently raked. (all t5 Feb All t s draini fully between schedul water pplyank ng ed su periods. 8 Feb Tank 1 & 4 no ully dra d bet een water supp per asured at noon. s t f ine w ly iods. Water qualities me
12 Feb
T 4 no ully dr ing er om 9 -3p ked (water still o 1 & 4, ie. wet- ; w er bac on at 9 .
anks 1 & t f ain - wat off fr am m - surface of all tanks raver beds rake) at k pm
15 Feb
W litie nk ur d nt s les 1 & 4 o g, o pm er s ling ove
ater qua s in ta s meas ed an nutrie amp taken at 12 noon. Tanks verflowin all flow ff @ 1 aft amp and rnight.
16 Feb A ry- , w pp ck 9 all beds d racked ater su ly ba on @ m. 18 Feb A rain lly s ule ows rmll beds d ing fu before ched d infl . Wo holes apparent in all tanks. 22 Feb All b ds fully d ining be re sc duled flows; tanks west. Water qualities
m at n ll s th rget o l rget. e ra fo he in 2 & 6 the lo
easured oon. A inflow lower an ta due t ower pond level - increased to ta24 Feb Tank 2 & 4 no raining ully b re sc uled i ows y left off for daytime
p eri rfac be ) r @ s t d f efo hed nfl ; water suppl
umping p od; su es of ds 2 & 4 (only aked 1 pm. 1 M r ll tanks fully d ning. q lities in tanks m r ient samples taken at 12
n k a
A rai Water ua easu ed and nutr
oon. Tan 5 intake readjusted. 5 Mar A u ning except tank 5. ll tanks f lly drai8 Mar Water qualities in tanks measured at 12 noon. Inflows were too high so were reduced.
10 Mar
Pump off till 11.30 am due to harvest; all fully drained except tank 5; sand surface of tank 5 raked whilst submerged (wet-rake).
15 Mar
Water qualities in tanks measured and nutrient samples taken at 12 noon. Inflows were too l(due to lower pond level) so were increased to target.
ow
17 Mar Pump off till 11.30 am due to prawn harvest. 1 P ov ue ss m e st8 Mar ump off ernight d to lo of pu p prim - prawn uck in foot valve. 19 Mar
N ully ing w ly able to d of supply pi og valv ll l u and i ows
o tanks f drain . Inflo s high vari due ebris dislodging from inside reset at target. pes d cl an gi g n es a - ines fl s d he nfl
2 1 d fu0 Mar Only tank raining lly. 21 Mar Only ank 1 drai ing fully t n . 22 Water s ur 12 n. In s lo rget due to prawns blocking
– cl an at target. Mar
qualities infoot valve
tankeared
md reset
eas ed at n oo fl wo wer than ta
26 Mar No tanks fully ing ule ow drain before sched d infl29 Mar
Water supply ov io ght to f alvappa n be 5 & any le les in 3; ank 1; fewer
rge in . S a w he led. Water qualities in tanks d s a oon
failed er prev us ni due oot v e failure. Lots of large worm holes fewer smaller holes in trent i
small & ladsholes
4, 6;tank 2
m smaltarted
r hom inflo
as scbed
dumeasured an nutrient sample taken t 12 n .
5 Apr
No tanks drai om . W r q es in ks mover owing.
ning c pletely ate ualiti tan easured at 12 noon. Tanks 4 & 5 fl
10 Apr Wat upply ch ged to rvoi pond er s an rese r 12 pr
A A s mu ighe ta and all tank rfl alities in tanks
d s on w educed to target. ll ow
measured aninfl c h
nutrienth r
sample than r t
taken atge s e
. Infloov owing. Water qu
12 no s r19 Apr Water qualitie nk ur 12 n. s in ta s meas ed at noo24 Apr Pump failed - um allenew p p inst d. 25 Apr Intakes highly ble – all ad to target. varia justed26 Apr Water qualitie nk ur d nt s es noon. s in ta s meas ed an nutrie ampl taken at 1230 Apr Harvested tank 1 1 May Harvested tanks 2 & 3 2 May Harvested tanks 4 & 5 3 May Harvested tank 6

National Landcare Programme Innovation Grant No. 60945 Technical Report
___________________________________________________________________________________ © The State of Queensland, Department of Primary Industries and Fisheries, 2008
44
ted from tanks with different stocking densities and mean als harvested.
n
Table A 4 Numbers of smaller and larger polychaetes harves percentages of tot
Stocki g Tank Small Large density
Mean ± se % Small
Mean ± se % Large
High
1 2,895 411 3 2,893 297 88.3 ± 1.2 11.7 ± 1.2 5 2,395 368
Medium
4
6 1,439 1,358
501 464
76.7 ± 2.4 23.3 ± 2.4 2 1,145 261
fro taTable A 5 Percentages of dry matter for small and large polychaetes harvested
nks with different stocking densities. mStocking density Tank Small Large High
1 20.1 3 19.8 16.3 5 17.9 18.5
19.8
Medium 4
6 18.6 14.5
18.0 2 20.0 20.1
15.2 Table A
an
6 Percentages of ash (on dry matter basis) for small and large polych etes harvested from tanks with different stocking densities.
g density Tank Sto kic Small Large High
1 21.7 23.3
21.5 3 5 17.9 1
22.5 8.2
Medium
16.8 18.4 15.2
2 4
23.5 17.5
20.7
6 Table A 7 Gross energy (MJ kg-1 dry matter) for small and large polychaetes
tSto kinharves ed from tanks with different stocking densities.
g density Tank Small Large c
5 19.52 20.13 High
1 18.20 18.97 3 18.06 18.62
Medium 4 19.87
0.04 20.28 21
2
6 2
18.05 19.65
.26

National Landcare Programme Innovation Grant No. 60945 Technical Report
___________________________________________________________________________________ © The State of Queensland, Department of Primary Industries and Fisheries, 2008
45
e Sma
Table A 8 Percentages of nitrogen (on dry matter basis) for small and large polychaetes harvested from tanks with different stocking densities. Stocking d nsity Tank ll Large High
1 10.510.42 10.8
9.77 3 5
1
2
9.91
10.12
edium 9.86 10.93 10.8
9.5610.20 M
2 4 6 9
10.35
able A 9 Percentages of phosphorus (on dry matter basis) for small and large
all Large
Tpolychaetes harvested from tanks with different stocking densities. Stocking density Tank Sm High
1 3 5
0.70 0.69 0.71
0.66 0.64 0.66
edium M
2 4 6
0.66 0.73 0.71
0.62 0.67 0.62
able A 10 Phospholipid contents* (mg g-1 of dry sample) of graded (small and d at
tol, PT osphatidylse TC = Phospha line, SM Sphingomyelin, LPTC = so-Phosphatidylcholine, TPL = Tota
holipids). Density Tank Worm s PTEA PTI S PTC SM TPL
Tlarge) polychaetes harvested from experimental sand filter tanks stockedifferent densities (PTEA = Phosphatidylethanolamine, PTI = Phosphatidylinosi S = Ph rine, P tidylcho= Ly l Phosp
ize PT LPTC
Small 11.05 1.82 7.87 - 20.73- 0.00High 1 Large 13.44 2.54 13.74 - 29.72- 0.00
Small 8.00 1.23 - 3.85 - 1.10 14.18Medium 2 Large 6.49 0.70 - 2.60 - 2.38 12.17
Small 12.35 2.18 - 8.57 - 0.00 23.10High 3 Large 8.76 1.28 - 4.72 - 1.31 16.06
Sm 2.67 0.2 1.22 - 6.74 all 8 - 2.56 Medium 4 Large 4.20 0.1 1.24 - 8.99 8 - 3.38
Small 4.12 0.1 1.20 - 8.34 3 - 2.89 High 5 Large 5.09 0.3 1.71 - 10.425 - 3.27
Small 3.82 0.0 0.83 - 7.23 0 - 2.59 Medium 6 Large 2.68 0.0 0.89 - 6.21 0 - 2.65
* “-” indicates <0.05 mg g-1

National Landcare Programme Innovation Grant No. 60945 Technical Report
___________________________________________________________________________________ © The State of Queensland, Department of Primary Industries and Fisheries, 2008
46
and stocked at
. High d ity Medium de
Table A 11 Fatty acid* contents** (mg g-1 of dry sample) of graded small (S)large (L) polychaetes harvested from experimental sand filter tanksdifferent densities
ens nsity Tank 1 Tank 3 Tank 5 nk 2 Tank 4 Tank 6 Ta
Fatty
S L S L S L S L S L S L acid 14:0 0.16 0.24 0.10 0.23 0.16 0.26 0.16 0.29 0.20 0.34 0.19 0.33 14:1n-5 - - - - - - - - - - - - 15:0 0.14 0.22 0.15 0.26 0.16 0.22 0.15 0.23 0.20 0.32 0.18 0.26 16:0 4.69 10.19 3.99 10.19 5.23 11.22 6.03 13.58 5.57 13.92 6.62 15.18 16:1n-7 0.72 1.30 0.54 1.25 0.76 1.48 1.00 1.84 0.83 1.72 0.95 1.80 17:0 0.59 0.87 0.58 0.92 0.68 0.90 0.65 0.95 0.79 1.16 0.73 1.08 18:0 2.25 3.16 2.05 2.99 2.40 3.27 2.51 3.81 2.65 3.64 2.86 4.01 18:1n-? 1.10 2.08 1.05 2.13 1.16 2.25 1.33 2.76 1.32 2.81 1.54 3.07 18:1n-7 1.59 2.96 1.48 3.12 1.81 3.35 2.03 3.86 2.23 4.29 2.32 4.28 18:1n-9 0.55 1.02 0.44 0.91 0.56 1.12 0.78 1.43 0.64 1.19 0.67 1.24 18:2n-6 0.57 0.79 0.51 0.72 0.67 0.91 0.66 0.92 0.59 0.94 0.80 0.68 18:3n-3 0.36 0.62 0.26 0.52 0.55 0.80 0.69 1.20 0.38 0.67 0.51 0.91 18:4n-3 0.10 0.12 0.05 0.08 0.16 0.21 0.22 0.30 0.09 0.13 0.15 0.22 19:0 - - - - - - - - - - - - 20:0 0.06 0.06 0.05 0.06 0.07 0.08 0.07 0.08 0.07 0.08 0.08 0.09 20:1n-6? 0.31 0.82 0.24 0.75 0.37 0.95 0.49 1.17 0.32 0.93 0.40 0.99 20:1n-7 0.11 0.16 0.10 0.17 0.15 0.18 0.12 0.18 0.17 0.22 0.17 0.21 20:1n-9 0.44 0.86 0.32 0.76 0.43 0.88 0.60 1.13 0.48 1.04 0.58 1.15 20:1n-11 0.58 1.06 0.60 1.15 0.61 1.11 0.63 1.31 0.74 1.44 0.85 1.58 20:2n-6 0.39 0.81 0.33 0.79 0.43 0.95 0.52 1.13 0.44 1.01 0.56 1.19 20:3n-3 - 0.13 - 0.14 0.05 0.16 0.08 0.31 0.05 0.18 0.07 0.26 20:3n-6 - - - - - - - - - - - - 20:4n-3 - - - - - - - - - - - - 20:4n-6 1.07 1.45 1.06 1.42 1.27 1.61 1.25 1.75 1.23 1.65 1.37 1.86 20:5n-3 3.83 4.43 3.33 4.35 3.79 4.15 3.41 4.42 4.36 5.22 4.15 5.16 22:0 - - - - 0.05 0.06 0.05 0.07 - - - 0.06 22:1n-7? 1.87 2.52 1.78 2.49 1.97 2.56 1.75 2.65 2.08 2.80 2.13 2.86 22:1n-9 - 0.07 - 0.06 - 0.07 - 0.09 - 0.08 0.05 0.10 22:1n-11 - - - - - - - - - - - - 22:3n-3 - - - - - - - - - - - - 22:4n-6 2. 94 2.98 2.54 3 24 2. 2.28 3.06 2.37 2.94 2.11 .31 2.88 3.77 22:5n-3 1.01 1.19 0.90 1.23 0.88 1.00 0.74 1.02 1.07 1.30 1.04 1.30 22:5n-6 0.09 0.12 .15 0.1 0.13 0.14 0.1 4 0.11 0 0.13 0.15 1 8 0.1 0.15 22:6n-3 0.33 0.45 .52 0.4 0.7 5 0.34 0 0.38 0.49 1 0.53 0.48 1 0.4 0.56 24:0 0.06 0.07 - - 0.0 0.06 0.0 9 0.06 0.08 7 0.10 8 0.0 0.09 24:1n-9 0.05 0.06 - - 0.06 - 0.0 - - 0.05 6 - 0.06 TOTAL 25.30 40.83 0.57 28. 50.27 29.86 51.3 50 22.79 4 27.42 43.47 70 4 32. 54.77
* icates so uncert ardin c tty a ide ** “-” g g
“?” ind indicates <0.05 m
me ainty reg g the spe ific fa cid ntified-1

National Landcare Programme Innovation Grant No. 60945 Technical Report
___________________________________________________________________________________ © The State of Queensland, Department of Primary Industries and Fisheries, 2008
47
y y
Table A 12 Amino acid contents (mg g-1 of dry sample) of graded small (S) and large (L) polychaetes harvested from experimental sand filter tanks stocked at different densities.
High densit Medium densitTank 1 3 5 2 4 6 Tank Tank Tank Tank Tank Amino acid
S L S L S L S L S L S L Alanine 0 3 9 0 6 6 9 0 3 2 7 4 39.0 34.6 35.7 33.6 37.8 35.8 36.2 31.5 38.8 35.0 39.2 36.3Arginine .00 .44 .72 .00 .15 .47 .80 .02 .29 .71 .53 .94 38 34 38 36 36 35 35 36 42 38 40 38Aspartic acid 1 8 6 7 2 5 0 8 2 5 2 5 56.4 51.0 51.0 50.0 52.9 51.5 53.2 45.6 53.9 50.9 54.7 52.8Cy 1 6 4 7 3 5 7 9 1 7 3 3 stine 5.1 2.2 6.5 3.0 6.7 5.9 5.2 5.6 7.0 7.6 5.9 6.8Glutamic id 2 8 2 4 0 9 6 7 9 9 1 4 ac 80.8 72.6 74.5 71.7 74.7 72.9 76.0 67.3 78.6 73.6 78.6 76.9G 2 9 8 8 5 4 6 6 6 5 5 6 lycine 54.6 46.6 52.0 46.0 51.9 46.6 50.9 43.4 54.4 47.2 51.6 44.0Histidine 7 8 8 9 9 7 3 8 9 2 8 9 11.5 9.7 12.2 11.0 12.5 11.4 10.9 11.0 13.3 11.7 12.7 11.4Is 1 0 1 3 3 6 2 5 9 3 5 5 oleucine 20.7 19.5 20.5 20.3 20.9 20.4 19.4 19.3 22.0 20.6 22.3 21.6Le 7 1 1 9 1 5 2 9 6 6 1 6 ucine 37.0 34.5 36.2 35.4 36.4 35.5 34.9 33.6 38.9 36.2 39.0 38.0Ly 1 6 8 3 2 5 7 8 5 3 5 7 sine 32.1 28.4 31.9 29.7 32.2 29.1 29.1 27.2 33.8 30.1 33.3 31.0M 7 9 7 0 1 4 8 5 3 6 3 4 ethionine 7.6 2.8 10.0 4.4 10.5 10.2 7.7 8.3 12.2 13.2 10.6 10.9Ph ne 5 1 1 6 5 8 3 0 5 0 3 4 enylalani 19.3 16.8 19.0 18.6 19.7 18.9 18.2 17.8 21.4 19.6 20.6 20.1Pr 7 4 7 8 1 6 7 7 3 0 8 9 oline 31.0 28.1 28.4 28.1 31.0 31.4 28.5 27.9 30.7 28.6 32.1 29.9Serine .37 .23 .79 .90 .74 .29 .25 .46 .87 .80 .97 .54 22 20 21 20 21 21 21 20 23 21 22 22Threonine 6 9 9 9 5 9 2 0 0 7 1 7 23.8 22.1 23.3 23.0 24.0 23.6 22.6 22.5 25.5 24.1 25.1 24.5Tr 9 4 7 4 5 5 5 8 8 7 7 3 yptophan 5.4 5.7 6.5 5.9 6.6 6.2 6.0 5.1 6.6 5.8 5.5 6.6Ty 8 1 9 9 1 7 0 3 0 6 6 0 rosine 17.2 15.7 17.0 16.7 17.9 16.9 16.1 15.7 19.5 17.8 18.3 17.8V 8 0 1 3 8 6 1 2 4 5 2 4 aline 23.7 21.7 22.9 22.3 23.9 22.8 22.4 21.2 24.9 23.0 24.9 24.1

National Landcare Programme Innovation Grant No. 60945 Technical Report
___________________________________________________________________________________ © The State of Queensland, Department of Primary Industries and Fisheries, 2008
48
01002
flo 0
3000
5060700800900
1/01
/07
0
4at
000
10001100
s-1
)
1
7
25/0
1/0
8/02
/07
22 2 / 0
t
L
/02/
07
8/0
23/
07
/ 503
/07
019
/4/07
4/07
Da e
Inw
re
(m
10 Tank 1
Tank 2
Tank 3
Tank 4
Tank 5
Tank 6
Figure A 1 s f t r la
me 6
Rate of in low measured for each ank p ior to regu r readjust nt to 40 - 650 mL 10 s-1.
00.5
11.5
22.5
33.5
44.5
5
25/0
1/07
8/02
/07
22/0
2/07
8/03
/07
22/0
3/07
5/04
/07
19/0
4/07
Date
Dai
ly f
ilte
red
wat
er(x
100
0 L
)
Tank 1
Tank 2
Tank 3
Tank 4
Tank 5
Tank 6
Figure A 2 Daily volumes of pond water filtered by each sand bed. Data were generated by dividing weekly increments to cumulative totals (see Fig. 4) by 7.
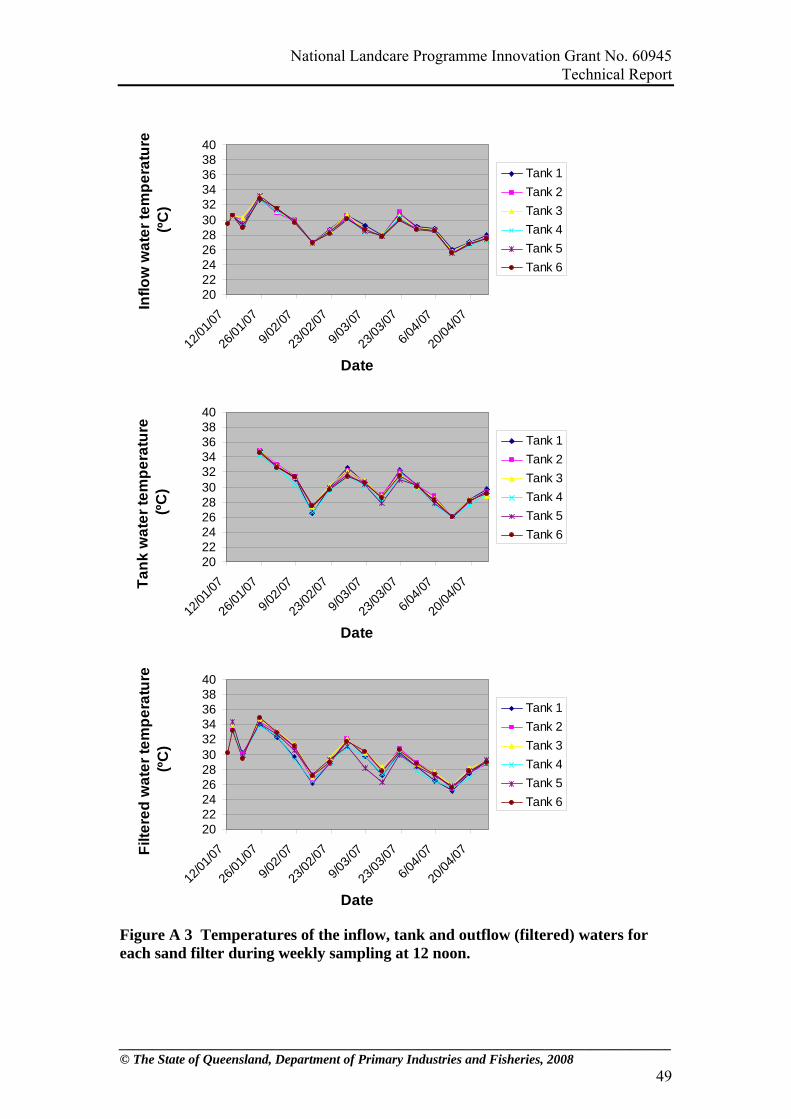
National Landcare Programme Innovation Grant No. 60945 Technical Report
___________________________________________________________________________________ © The State of Queensland, Department of Primary Industries and Fisheries, 2008
49
2022242628303234363840
12/0
1/07
26/0
1/07
9/02
/07
23/0
2/07
9/03
/07
23/0
3/07
6/04
/07
20/0
4/07
Date
Infl
ow
wa
ter
tem
pe
ratu
re
(ºC
)Tank 1
Tank 2
Tank 3
Tank 4
Tank 5
Tank 6
2022242628303234363840
e
12/0
1/07
26/0
1/07
9/02
/07
23/0
2/07
9/03
/07
23/0
3/07
6/04
/07
20/0
4/07
Date
Ta
nk
wa
ter
tem
pe
ratu
r(º
C)
Tank 1
Tank 2
Tank 3
Tank 4
Tank 5
Tank 6
2022242628
ed
wa
te (º
303234363840
12/0
1/07
26/0
1/07
9/02
/07
23/0
2/07
9/03
/07
23/0
3/07
6/04
/07
20/0
4/07
Date
Filt
er
r te
mp
era
ture
C
)
Tank 1
Tank 2
Tank 3
Tank 4
Tank 5
Tank 6
Figure A 3 Temperatures of the inflow, tank and outflow (filtered) waters for each sand filter during weekly sampling at 12 noon.

National Landcare Programme Innovation Grant No. 60945 Technical Report
___________________________________________________________________________________ © The State of Queensland, Department of Primary Industries and Fisheries, 2008
50
05
1015202530354045
12/0
1/07
26/0
1/07
9/02
/07
23/0
2/07
9/03
/07
23/0
3/07
6/04
/07
20/0
4/07
Date
Infl
ow
sa
linit
y
(g L
-1)
Tank 1
Tank 2
Tank 3
Tank 4
Tank 5
Tank 6
05
1015202530354045
12/0
1/07
26/0
1/07
9/02
/07
23/0
2/07
9/03
/07
23/0
3/07
6/04
/07
20/0
4/07
Date
Ta
nk
wa
ter
sa
linit
y (
g L
-1) Tank 1
Tank 2
Tank 3
Tank 4
Tank 5
Tank 6
05
1015202530354045
12/0
1/07
26/0
1/07
9/02
/07
23/0
2/07
9/03
/07
23/0
3/07
6/04
/07
20/0
4/07
Date
Filt
ere
d w
ate
r
sa
linit
y (
g L
-1) Tank 1
Tank 2
Tank 3
Tank 4
Tank 5
Tank 6
Figure A 4 Salinities of the inflow, tank and outflow (filtered) waters for each sand filter during weekly sampling at 12 noon.

National Landcare Programme Innovation Grant No. 60945 Technical Report
___________________________________________________________________________________ © The State of Queensland, Department of Primary Industries and Fisheries, 2008
51
6
7
8
9
10
11
12
12/0
1/07
26/0
1/07
9/02
/07
23/0
2/07
9/03
/07
23/0
3/07
6/04
/07
20/0
4/07
Date
Infl
ow
pH
Tank 1
Tank 2
Tank 3
Tank 4
Tank 5
Tank 6
6
7
8
9
10
11
12
12/0
1/07
26/0
1/07
9/02
/07
23/0
2/07
9/03
/07
23/0
3/07
6/04
/07
20/0
4/07
Date
Ta
nk
wa
ter
pH Tank 1
Tank 2
Tank 3
Tank 4
Tank 5
Tank 6
6
7
8
9
10
11
12
12/0
1/07
26/0
1/07
9/02
/07
23/0
2/07
9/03
/07
23/0
3/07
6/04
/07
20/0
4/07
Date
Filt
ere
d w
ate
r p
H
Tank 1
Tank 2
Tank 3
Tank 4
Tank 5
Tank 6
Figure A 5 Levels of pH for the inflow, tank and outflow (filtered) waters for each sand filter during weekly sampling at 12 noon.

National Landcare Programme Innovation Grant No. 60945 Technical Report
___________________________________________________________________________________ © The State of Queensland, Department of Primary Industries and Fisheries, 2008
52
0123456789
10
12/0
1/07
26/0
1/07
9/02
/07
23/0
2/07
9/03
/07
23/0
3/07
6/04
/07
20/0
4/07
Date
Infl
ow
dis
so
lve
d o
xy
ge
n
(mg
L-1
)Tank 1
Tank 2
Tank 3
Tank 4
Tank 5
Tank 6
0123456789
10
12/0
1/07
26/0
1/07
9/02
/07
23/0
2/07
9/03
/07
23/0
3/07
6/04
/07
20/0
4/07
Date
Ta
nk
wa
ter
dis
so
lve
d
ox
yg
en
(m
g L
-1)
Tank 1
Tank 2
Tank 3
Tank 4
Tank 5
Tank 6
0123456789
10
12/0
1/07
26/0
1/07
9/02
/07
23/0
2/07
9/03
/07
23/0
3/07
6/04
/07
20/0
4/07
Date
Filt
ere
d w
ate
r d
iss
olv
ed
ox
yg
en
(m
g L
-1)
Tank 1
Tank 2
Tank 3
Tank 4
Tank 5
Tank 6
Figure A 6 Levels of dissolved oxygen for the inflow, tank and outflow (filtered) waters for each sand filter during weekly sampling at 12 noon.

National Landcare Programme Innovation Grant No. 60945 Technical Report
___________________________________________________________________________________ © The State of Queensland, Department of Primary Industries and Fisheries, 2008
53
-150
-100
-50
0
50
100
150
12/0
1/07
26/0
1/07
9/02
/07
23/0
2/07
9/03
/07
23/0
3/07
6/04
/07
20/0
4/07
Date
Infl
ow
wa
ter
red
ox
(m
V)
Tank 1
Tank 2
Tank 3
Tank 4
Tank 5
Tank 6
-150
-100
-50
0
50
100
150
12/0
1/07
26/0
1/07
9/02
/07
23/0
2/07
9/03
/07
23/0
3/07
6/04
/07
20/0
4/07
Date
Ta
nk
wa
ter
red
ox
(m
V)
Tank 1
Tank 2
Tank 3
Tank 4
Tank 5
Tank 6
-400
-350
-300
-250
-200
-150
-100
-50
0
12/0
1/07
26/0
1/07
9/02
/07
23/0
2/07
9/03
/07
23/0
3/07
6/04
/07
20/0
4/07
Date
Filt
ere
d w
ate
r re
do
x (
mV
)
Tank 1
Tank 2
Tank 3
Tank 4
Tank 5
Tank 6
Figure A 7 Reduction/oxidation potential (redox) for the inflow, tank and outflow (filtered) waters for each sand filter during weekly sampling at 12 noon.

National Landcare Programme Innovation Grant No. 60945 Technical Report
___________________________________________________________________________________ © The State of Queensland, Department of Primary Industries and Fisheries, 2008
54
0
10
20
30
40
50
60
70
80
18/0
1/07
1/02
/07
15/0
2/07
1/03
/07
15/0
3/07
29/0
3/07
12/0
4/07
26/0
4/07
Date
Infl
ow
TS
S (
mg
L-1
)
Tank 1
Tank 2
Tank 3
Tank 4
Tank 5
Tank 6
0
10
20
30
40
50
60
70
80
18/0
1/07
1/02
/07
15/0
2/07
1/03
/07
15/0
3/07
29/0
3/07
12/0
4/07
26/0
4/07
Date
Ou
tflo
w T
SS
(m
g L
-1)
Tank 1
Tank 2
Tank 3
Tank 4
Tank 5
Tank 6
Figure A 8 Total suspended solids (TSS) in inflow and outflow (filtered) waters for each sand filter during fortnightly sampling at 12 noon.
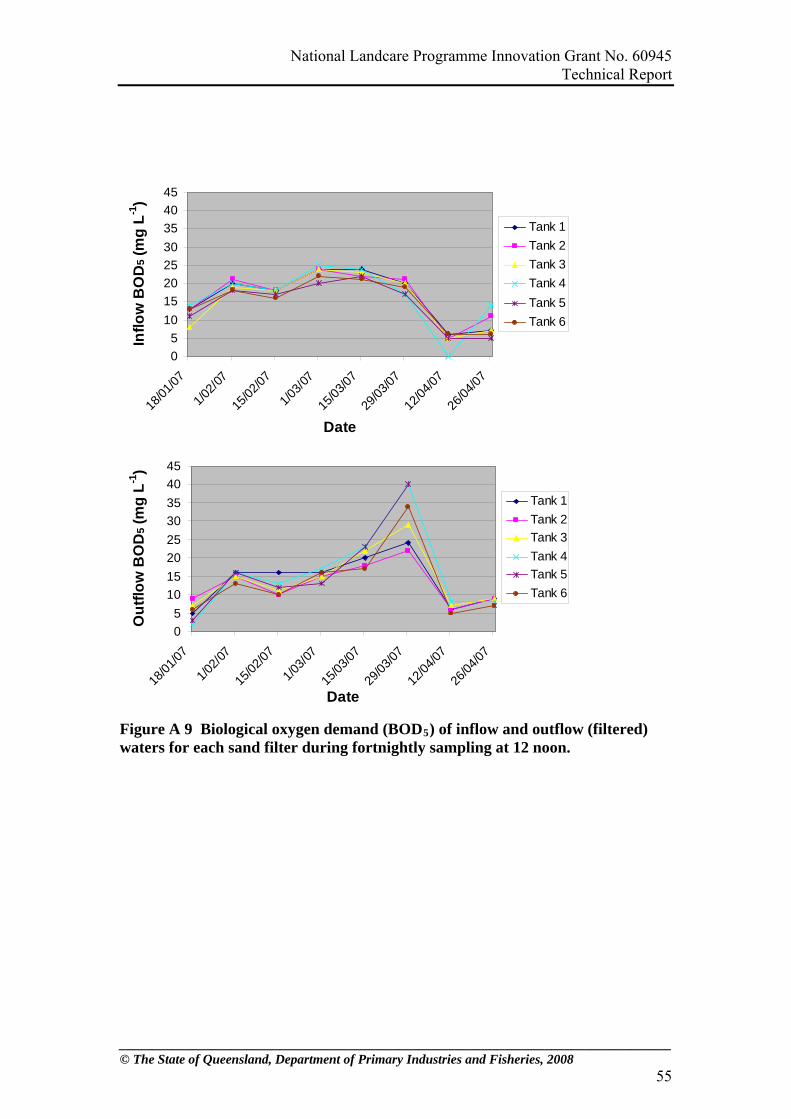
National Landcare Programme Innovation Grant No. 60945 Technical Report
___________________________________________________________________________________ © The State of Queensland, Department of Primary Industries and Fisheries, 2008
55
0
5
10
15
20
25
30
35
40
45
18/0
1/07
1/02
/07
15/0
2/07
1/03
/07
15/0
3/07
29/0
3/07
12/0
4/07
26/0
4/07
Date
Infl
ow
BO
D5
(mg
L-1
)
Tank 1
Tank 2
Tank 3
Tank 4
Tank 5
Tank 6
0
5
10
15
20
25
30
35
40
45
18/0
1/07
1/02
/07
15/0
2/07
1/03
/07
15/0
3/07
29/0
3/07
12/0
4/07
26/0
4/07
Date
Ou
tflo
w B
OD
5 (m
g L
-1)
Tank 1
Tank 2
Tank 3
Tank 4
Tank 5
Tank 6
Figure A 9 Biological oxygen demand (BOD5) of inflow and outflow (filtered) waters for each sand filter during fortnightly sampling at 12 noon.

National Landcare Programme Innovation Grant No. 60945 Technical Report
___________________________________________________________________________________ © The State of Queensland, Department of Primary Industries and Fisheries, 2008
56
0.020.040.060.080.0
100.0120.0140.0160.0180.0
18/0
1/07
1/02
/07
15/0
2/07
1/03
/07
15/0
3/07
29/0
3/07
12/0
4/07
26/0
4/07
Date
Infl
ow
Ch
la (
µg
L-1
)
Tank 1
Tank 2
Tank 3
Tank 4
Tank 5
Tank 6
0.020.040.060.080.0
100.0120.0140.0160.0180.0
18/0
1/07
1/02
/07
15/0
2/07
1/03
/07
15/0
3/07
29/0
3/07
12/0
4/07
26/0
4/07
Date
Ou
tflo
w C
hla
(µ
g L
-1)
Tank 1
Tank 2
Tank 3
Tank 4
Tank 5
Tank 6
Figure A 10 Chlorophyll a (Chla) levels in inflow and outflow (filt ed) waters erfor each sand filter during fortnightly sampling at 12 noon.

National Landcare Programme Innovation Grant No. 60945 Technical Report
___________________________________________________________________________________ © The State of Queensland, Department of Primary Industries and Fisheries, 2008
57
0.001.00
2.003.00
4.005.00
6.007.00
8.009.00
10.00
18/0
1/07
1/02
/07
15/0
2/07
1/03
/07
15/0
3/07
29/0
3/07
12/0
4/07
26/0
4/07
Date
Infl
ow
TN
(m
g L
-1)
Tank 1
Tank 2
Tank 3
Tank 4
Tank 5
Tank 6
0.00
1.002.00
3.00
4.00
5.006.00
7.00
8.009.00
10.00
18/0
1/07
1/02
/07
15/0
2/07
1/03
/07
15/0
3/07
29/0
3/07
12/0
4/07
26/0
4/07
Date
Ou
tflo
w T
N (
mg
L-1
)
Tank 1
Tank 2
Tank 3
Tank 4
Tank 5
Tank 6
Figure A 11 Total nitrogen (TN) levels in inflow and outflow (filtered) waters foeach sand filter during fortnightly sampling at 12 noon.
r

National Landcare Programme Innovation Grant No. 60945 Technical Report
___________________________________________________________________________________ © The State of Queensland, Department of Primary Industries and Fisheries, 2008
58
0.00
1.00
2.00
3.00
4.00
5.00
6.00
7.00
18/0
1/07
1/02
/07
15/0
2/07
1/03
/07
15/0
3/07
29/0
3/07
12/0
4/07
26/0
4/07
Date
Infl
ow
TA
N (
mg
L-1
)
Tank 1
Tank 2
Tank 3
Tank 4
Tank 5
Tank 6
0.00
1.00
2.00
3.00
4.00
5.00
6.00
7.00
18/0
1/07
1/02
/07
15/0
2/07
1/03
/07
15/0
3/07
29/0
3/07
12/0
4/07
26/0
4/07
Date
Ou
tflo
w T
AN
(m
g L
-1)
Tank 1
Tank 2
Tank 3
Tank 4
Tank 5
Tank 6
Figure A 12 Total ammonia (TAN) levels in inflow and outflow (filtered) waters for each sand filter during fortnightly sampling at 12 noon.

National Landcare Programme Innovation Grant No. 60945 Technical Report
___________________________________________________________________________________ © The State of Queensland, Department of Primary Industries and Fisheries, 2008
59
0.00
0.10
0.20
0.30
0.40
0.50
0.60
0.70
18/0
1/07
1/02
/07
15/0
2/07
1/03
/07
15/0
3/07
29/0
3/07
12/0
4/07
26/0
4/07
Date
Infl
ow
NO
x (
mg
L-1
)
Tank 1
Tank 2
Tank 3
Tank 4
Tank 5
Tank 6
0.00
0.10
0.20
0.30
0.40
0.50
0.60
0.70
18/0
1/07
1/02
/07
15/0
2/07
1/03
/07
15/0
3/07
29/0
3/07
12/0
4/07
26/0
4/07
Date
Ou
tflo
w N
Ox
(m
g L
-1)
Tank 1
Tank 2
Tank 3
Tank 4
Tank 5
Tank 6
Figure A 13 Nitrate + Nitrite (NOx) levels in inflow and outflow (filtered) waters for each sand filter during fortnightly sampling at 12 noon.

National Landcare Programme Innovation Grant No. 60945 Technical Report
___________________________________________________________________________________ © The State of Queensland, Department of Primary Industries and Fisheries, 2008
60
0.0
0.1
0.2
0.3
0.4
0.5
0.6
0.7
0.8
0.9
18/0
1/07
1/02
/07
15/0
2/07
1/03
/07
15/0
3/07
29/0
3/07
12/0
4/07
26/0
4/07
Date
Infl
ow
TP
(m
g L
-1) Tank 1
Tank 2
Tank 3
Tank 4
Tank 5
Tank 6
0.0
0.1
0.2
0.3
0.4
0.5
0.6
0.7
0.8
0.9
18/0
1/07
1/02
/07
15/0
2/07
1/03
/07
15/0
3/07
29/0
3/07
12/0
4/07
26/0
4/07
Date
Ou
tflo
w T
P (
mg
L-1
)
Tank 1
Tank 2
Tank 3
Tank 4
Tank 5
Tank 6
Figure A 14 Total phosphorus (TP) levels in inflow and outflow (filtered) waters for each sand filter during fortnightly sampling at 12 noon.

National Landcare Programme Innovation Grant No. 60945 Technical Report
___________________________________________________________________________________ © The State of Queensland, Department of Primary Industries and Fisheries, 2008
61
0.000.050.100.150.200.250.300.350.400.45
18/0
1/07
1/02
/07
15/0
2/07
1/03
/07
15/0
3/07
29/0
3/07
12/0
4/07
26/0
4/07
Date
Infl
ow
PO
4
Tank 1
Tank 2
Tank 3
Tank 4
Tank 5
Tank 6
0.000.050.100.150.200.250.300.350.400.45
18/0
1/07
1/02
/07
15/0
2/07
1/03
/07
15/0
3/07
29/0
3/07
12/0
4/07
26/0
4/07
Date
Ou
tflo
w P
O4 Tank 1
Tank 2
Tank 3
Tank 4
Tank 5
Tank 6
Figure A 15 Orthophosphate (PO4) levels in inflow and outflow (filtered) waters for each sand filter during fortnightly sampling at 12 noon.