polycrystalline diamond films dissertation...
TRANSCRIPT
THERMIONIC ELECTRON
EMISSION PROPERTIES OF NITROGEN-INCORPORATED
POLYCRYSTALLINE DIAMOND FILMS
By
William (Hank) Paxton
Dissertation
Submitted to the Faculty of the
Graduate School of Vanderbilt University
in partial fulfillment of the requirements
for the degree of
DOCTOR OF PHILOSOPHY
in
Electrical Engineering
May, 2013
Nashville, Tennessee
Approved:
Professor Jim L. Davidson
Professor Weng P. Kang
Professor Norman H. Tolk
Professor D. Greg Walker
Professor Mike Alles

ii
To my dearest wife, Megan
To my loving parents, Lucy and Bill Paxton
And
To my sister and her family, Crissy, Todd, and Kate

iii
ACKNOWLEDGMENTS
I am very grateful for my academic advisor, Dr. Jim Davidson for giving me the
opportunity to pursue this research. It would be impossible for me to summarize the vast
amount of insight he has bestowed on me since I began working with him during the
summer prior to my undergraduate senior year at Vanderbilt. The freedom that Dr.
Davidson has awarded me has allowed me to develop into a stronger scientist with the
confidence to solve any problem that may arise. In addition to Dr. Davidson, I am also
highly appreciative of Dr. Weng Poo Kang for his always intuitive advice and
suggestions. His inquisitive approach to the interpretation of results has helped to mold
me into a vigilant researcher devoted to rigorous methodology and collecting the most
accurate results possible. Moreover, I feel that the advice Dr. Kang has given me on
matters outside of research will certainly become increasingly more helpful as I move
forward into my professional career.
I would also like to thank Dr. Norman Tolk, Dr. Greg Walker, and Dr. Mike Alles
for serving on my Ph.D. committee. Over the past several years, Dr. Tolk and I have
developed a strong academic relationship that has allowed me the opportunity to branch
out into other areas of science beyond those discussed in this dissertation. I have also had
the pleasure of collaborating with Dr. Walker on several occasions which I feel has
greatly helped to further my understanding of this research. Though I have not had many
opportunities to work with Dr. Alles directly, the encounters we have had together have
always proven extremely insightful.
iv
I would also like to acknowledge my present and ex-colleagues for their valuable
technical assistance. Particularly, I feel that many of the experiments performed in this
research would not have been possible without the aid of Mick Howell. His ever
astonishing ingenuity has aided me with the design and implementation of many of my
testing apparatuses. I feel that Mick will be a highly useful resource in any endeavor that
I may encounter following the successful completion of my Ph.D.
This work would not have been possible without the financial support from the
TN-SCORE (Tennessee Solar Conversion and Storage using Outreach) program. This
support has not only provided me with a research assistantship and research funding, but
has also afforded me the opportunity to participate in community outreach programs such
as Vanderbilt Student Volunteers for Science. I would further like to recognize The
Graduate School at Vanderbilt whose travel grants have allowed me to present my work
at conferences around the world.
Much of the credit for my success while pursuing my Ph.D. is due to my wife,
Megan. Her role as a fellow Ph.D. student at Vanderbilt (Clinical Psychology) has
enabled her to relate and commiserate with me during the challenges of graduate school
and research. Though always supportive, she has helped to prevent me from becoming
completely consumed with my research. Her love and companionship have helped to
make my journey through graduate school one of the most memorable yet and I look
forward to many more journeys with her.
, Lastly, I would like to thank my family who has always been both supportive
and encouraging during my graduate work. I have been so blessed to have my parents,
Bill and Lucy, my sister, Crissy, my brother-in-law, Todd, and my new niece, Kate, as

v
some of my most influential contacts. I know they are all extremely proud of me and look
forward to what the next chapter of my life has in store.

vi
TABLE OF CONTENTS
Page
DEDICATION _________________________________________________________ ii
ACKNOWLEDGEMENTS _______________________________________________ iii
LIST OF TABLES _______________________________________________________ x
LIST OF FIGURES _____________________________________________________ xi
CHAPTER I. INTRODUCTION ___________________________________________ 1
History of thermionic emission and vacuum devices __________________________ 1
Motivation for energy conversion research __________________________________ 3
Today’s energy climate _______________________________________________ 3
Current large-scale power generation methods _____________________________ 5
Current small-scale power generation methods _____________________________ 6
Renewable power generation technologies ________________________________ 7
Thermionic energy conversion ___________________________________________ 8
Research objectives ____________________________________________________ 9
Organization of this dissertation _________________________________________ 10
CHAPTER II. DIAMOND:GROWTH, PROPERTIES, AND
CHARACTERIZATION ________________________________________________ 12
Diamond background _________________________________________________ 12
Fabrication of diamond films ___________________________________________ 13
Substrate selection and preparation and the nucleation process _______________ 14
Film deposition _____________________________________________________ 17
Characterization of diamond films _______________________________________ 20
Material properties of diamond __________________________________________ 25
Doping of diamond ___________________________________________________ 26
P-type diamond ____________________________________________________ 27
N-type diamond ____________________________________________________ 27
vii
Nitrogen-incorporated diamond films ___________________________________ 28
Hydrogen in diamond _________________________________________________ 29
Electron transport ___________________________________________________ 29
Electron affinity ____________________________________________________ 31
Desorption of hydrogen from diamond __________________________________ 34
Deuterium in diamond _______________________________________________ 38
Applications of diamond _______________________________________________ 39
Diamond as a solid state electronic material ______________________________ 39
Diamond in vacuum microelectronics ___________________________________ 43
Use of diamond in thermionic energy converters __________________________ 47
CHAPTER III. THERMIONIC ENERGY CONVERSION _____________________ 50
Thermionic emission __________________________________________________ 50
Richardson equation derivation ________________________________________ 51
Thermionic energy conversion __________________________________________ 55
Thermionic energy converter design considerations __________________________ 57
Production of thermionic energy converters ________________________________ 61
Current thermionic cathodes ____________________________________________ 62
Metallic cathodes ___________________________________________________ 62
Oxide coated cathodes _______________________________________________ 64
Lanthanum hexaboride cathodes _______________________________________ 65
Overview _________________________________________________________ 65
CHAPTER IV. PROPOSED RESEARCH ___________________________________ 66
Introduction to the proposed research _____________________________________ 66
Fabrication of nitrogen-incorporated diamond thermionic cathodes _____________ 68
Characterization of the thermionic emission from diamond films _______________ 71
Investigation of hydrogen’s influence on thermionic emission __________________ 73
Determination of the activation energy of hydrogen in diamond ________________ 74
Exploration of deuterium as an alternative to hydrogen _______________________ 76
Investigation into the operation of diamond in gaseous environments ____________ 76
CHAPTER V. DEVICE FABRICATION AND TESTING _____________________ 80

viii
Deposition and characterization of diamond films ___________________________ 80
Sample preparation and deposition process _______________________________ 80
Characterization of diamond samples ___________________________________ 82
Testing apparatus _____________________________________________________ 85
Apparatus for testing in vacuum environments ____________________________ 85
Apparatus for testing in gaseous environments ____________________________ 89
Data collection and system control _______________________________________ 94
Current vs. Temperature (CVT) Configuration ____________________________ 96
Isothermal (IT) Configuration _________________________________________ 98
Influence of gaseous species on the thermionic emission from diamond __________ 99
CHAPTER VI. THERMIONIC EMISSION CHARACTERIZATION IN
VACUUM ___________________________________________________________ 101
As-grown nitrogen-incorporated films ___________________________________ 101
Thermionic emission behavior of as-grown samples _______________________ 101
Effect of hydrogen on the thermionic emission from diamond _________________ 105
Characterization technique ___________________________________________ 105
Comparison of as-grown and hydrogenated diamond samples _______________ 106
Analysis of hydrogen’s effects on thermionic emission ____________________ 108
Determination of the optimal hydrogenation procedure ______________________ 111
Influence of temperature on the hydrogenation of diamond _________________ 111
Influence of time on the hydrogenation of diamond _______________________ 115
Influence of microwave power on the hydrogenation of diamond ____________ 118
Effects of varying hydrogenation recipes________________________________ 120
Desorption process of hydrogen in diamond _______________________________ 120
Diamond sample preparation _________________________________________ 122
Isothermal emission behavior of hydrogenated diamond films _______________ 123
Calculation of the activation energy of hydrogen in diamond ________________ 125
Desorption deuterium from diamond ____________________________________ 129
Isothermal emission behavior of deuterated diamond films _________________ 132
Summary of the desorption of deuterium from diamond ____________________ 139
CHAPTER VII. THERMIONIC EMISSION CHARACTERIZATION IN GASEOUS
ENVIRONMENTS ____________________________________________________ 140
Molecular nitrogen __________________________________________________ 140

ix
Behavior of diamond thermionic cathodes in a N2 environment ______________ 141
Methane ___________________________________________________________ 143
Behavior of diamond thermionic cathodes in a CH4 environment_____________ 145
Analysis of the thermioinic emission behavior in CH4 _____________________ 149
Water vapor ________________________________________________________ 153
Behavior of diamond thermionic cathodes in a H2O environment ____________ 154
Analysis of the thermioinic emission behavior in H2O _____________________ 157
Molecular hydrogen __________________________________________________ 162
Behavior of diamond thermionic cathodes in a H2 environment ______________ 163
Analysis of the thermioinic emission response to H2 _______________________ 171
Increased operating temperature in H2 __________________________________ 174
Nitrous Oxide ______________________________________________________ 175
Behavior of diamond thermionic cathodes in a N2O environment ____________ 176
Analysis of the thermioinic emission behavior in N2O _____________________ 180
CHAPTER VIII. CONCLUSION AND RECOMMENDATIONS _______________ 184
Observed effects of hydrogen in diamond _________________________________ 184
Gaseous environment effects on thermionic emission _______________________ 185
Gases that diminish thermionic emission ________________________________ 185
Gases that enhance thermionic emission ________________________________ 186
Potential thermioinic energy conversion performance _______________________ 189
Recommendations for future work ______________________________________ 192
LIST OF PUBLICATIONS _____________________________________________ 194
REFERENCES _______________________________________________________ 195

x
LIST OF TABLES
Table Page
Table 2.1 Comparison of diamond to silicon, boron nitride, and copper ..........................25
Table 2.2 Comparison of the activation energies obtain from diamond films
with differing orientations using various methods. It can be see that most
studies agree that the activation energy of 100 oriented diamond films is
around 1.5eV ......................................................................................................................36
Table 3.1 Description and definition of symbols used in Equations 3.13-15
which describe the three mechanisms of heat loss for a thermionic energy
converter in operation as described by J.H Ingold .............................................................60
Table 3.2 Comparison of tungsten surface contaminant on the work function.................63
Table 3.3 Comparison of the work function values and Richardson constant
values of some commonly use thermionic cathode oxide coatings ...................................64
Table 6.1 Measurements of the bond energy from hydrogen desorption
studies using various experimental approaches ...............................................................128
Table 6.2 Activation energies and pre-exponential factors obtained from
previous deuterium desorption studies .............................................................................136
Table 7.1 A few possible low pressure dissociation channels resulting from
the impact of an electron with a methane molecule .........................................................150
Table 7.2 Qualitative description of the response of the emission current to
the presence of water vapor .............................................................................................158

xi
LIST OF FIGURES
Figure Page
Figure 1.1 Graph of the world energy consumption by fuel type in terms of
million tons of oil equivalence (MTOE) ..............................................................................4
Figure 1.2 Current estimates of world oil production from the year 1900
through 2100 based on a 2006 study by BP. The three peaks represent the
three possible times in which the world will reach peak production. .................................5
Figure 1.3 Flow diagram of the components of a typical coal fueled power
plant beginning with the fuel handling through the energy conversion. .............................6
Figure 2.1 Image of the diamond lattice ...........................................................................12
Figure 2.2 SEM image of diamond crystals forming on a scratched silicon
substrate .............................................................................................................................16
Figure 2.3 Schematic diagram of the biased enhanced diamond growth
processes during the first two hours of deposition presented by Stoner and
colleagues. .........................................................................................................................17
Figure 2.4 Schematic of an (a) HFCVD apparatus and (b) MPCVD apparatus ...............19
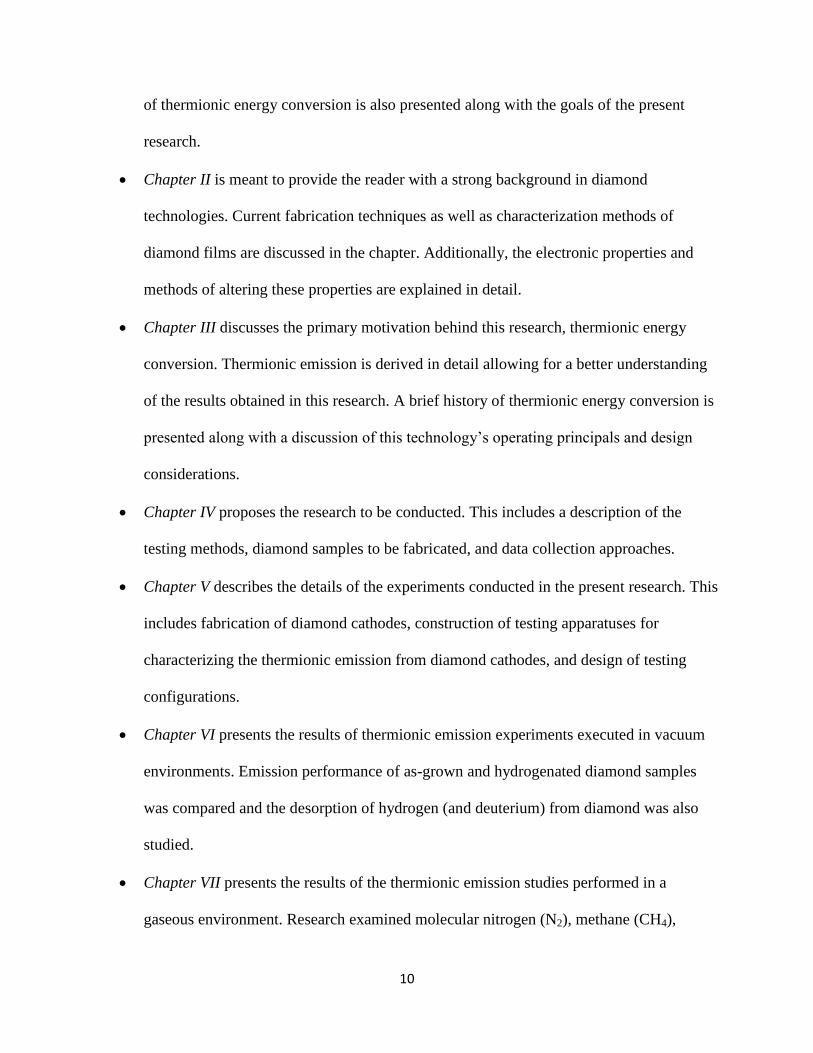
Figure 2.5 General Raman spectra of gem quality diamond excited at
wavelengths of 229.9 nm at room temperature demonstrating the first, second,
and third order Raman peaks .............................................................................................21
Figure 2.6 Typical XRD patterns for diamond samples with (a) (100) surface
facets and (b) (111) surface facets .....................................................................................22
Figure 2.7 SEM spectra of polycrystalline diamond films with (a) (111)
triangular faces, (b) (100) square faces, and (c) cauliflower-like small
crystalline aggregates .........................................................................................................24
Figure 2.8 Current-Voltage curves of the diamond film as grown, annealed,
and hydrogenated from M.I. Landstrass and K.V. Ravi’s 1989 study...............................30
Figure 2.9 Band diagrams of a semiconductor with (a) positive electron
affinity and (b) negative electron affinity. Eg represents the bandgap; Φ, the
work function; Eo, the vacuum level; Ef, the Fermi level; and Ec and Ev, the
conduction and valence band energy levels, respectively. ................................................32
Figure 2.10 Band diagram and corresponding atomic arrangements of a clean,
hydrogenated, and oxygenated diamond surface. ..............................................................34

xii
Figure 2.11 a) Decrease in hydrogenation coverage as a function of anneal
time for various annealing temperatures. b) First order desorption fit of the
data indicating an activation energy of 21 kcal/mol ..........................................................37
Figure 2.12 Scanning electron micrograph of boron doped diamond resistors
patterned via oxygen plasma etching on an aluminum nitride substrate ...........................40
Figure 2.13 Current-voltage characteristics of an all diamond pn diode with
boron and nitrogen as the n- and p-type dopants respectively ...........................................41
Figure 2.14 Fabrication of the vertical diamond field effect transistor by
M.W. Geis ..........................................................................................................................42
Figure 2.15 Inverse capacitance squared vs. bias voltage of the diamond field
effect transistor seen in Figure 2.13. The linear relationship implies the
diamond-SiO2 interface is extremely well behaved ...........................................................42
Figure 2.16 (a) Potential energy of an electron U(x) as a function of distance
from the metallic cathode. Here “-eFx” is the externally applied potential,
“Up” is the total potential well depth, and “-e2/4x” is the image potential. (b)
Band bending as a function of the radius of curvature of a tungsten “needle”
emitter ................................................................................................................................44
Figure 2.17 (a) Scanning electron micrograph of the lateral diamond
microelectronic diode. The cathode and anode are both patterned out of a
single uniformly deposited nanocrytalline diamond film and isolated by SiO2.
(b) Current-voltage characteristics of the device in (a) which is able to achieve
a “turn-on” voltage of 5V ..................................................................................................45
Figure 2.18 Left: Fabrication process for diamond pyramidal cold cathodes.
Right: SEM image of fabricated emitters ........................................................................46
Figure 2.19 (a) Scanning electron micrograph of the diamond triode vacuum
microelectronic device. The cathode here is a diamond pyramid with a tip
radius of curvature on the order of 5 nm and the gate is silicon. SiO2 is used to
insulate the gate from the cathode. (b) Anode current-voltage behavior of the
diamond triode device at different gate voltages. With the gate biased at 20V,
an amplification factor of 250 was achieved .....................................................................47
Figure 2.20 Thermionic emission current vs. cathode temperature of a
nitrogen-incorporated ultra-nanocrystalline diamond films by R. J. Nemanich ................48
Figure 3.1 Energy diagram of “pillbox” problem. The region from “a” to “b”
represents a cavity inside a homogenous crystalline material. The entire
material and the cavity are said to be at a constant uniform temperature. This
diagram neglects space charge effects and assumes that the distance “x” is
large enough such that image potential can also be neglected. ..........................................53

xiii
Figure 3.2 Potential diagram of a thermionic energy converter showing the
increased potential barrier electrons must overcome in order to be emitted into
the vacuum in the presence of a space charge region ........................................................58
Figure 4.1 Thermionic emission results from previous work on a boron-doped
polycrystalline diamond film. It can be seen by the solid line that the emission
current data (points) followed closely with the Richardson equation.
Thermionic emission current obtained from this sample was too low to be
practical due to the high work function of 4.43 eV ...........................................................69
Figure 4.2 Schematic diagram of a typical thermionic testing configuration ...................72
Figure 5.1 Scanning electron micrograph of a diamond sample grown under
the previously described conditions ...................................................................................83
Figure 5.2 Scanning electron micrograph of a sample grown uninterrupted for
less time under the same conditions as the sample in Figure 5.1. Well defined
smooth square faces indicative of 100 orientations can easily be discerned as
well as deteriorated triangular faces suggesting crystals with 111 orientations
are also present. ..................................................................................................................84
Figure 5.3 Raman spectroscopy indicating predominantly diamond (sp3)
composition with minimal graphitic (sp2) content .............................................................85
Figure 5.4 A) Diagram of the electrical feedthrough. B) Photograph of the
mounted sample .................................................................................................................87
Figure 5.5 A) Top view of the vacuum chamber. Note that there is no direct
line of sight between the sample being tested and either the ion gauge or the
ion pump. B) Side view of chamber to demonstrate placement of the sample ..................88
Figure 5.6 Photograph of testing apparatus ......................................................................89
Figure 5.7 Schematic of the testing apparatus for the incorporation of gaseous
species into the vacuum gap ..............................................................................................91
Figure 5.8 Step-by-step process used to prepare the water vessel chamber
used to introduce water vapor into the vacuum chamber. The first two steps
were meant to remove other species that could interfere with results. The
second two steps were meant to allow water vapor to freely enter the chamber. ..............93
Figure 5.9 Schematic of the testing apparatus for the incorporation of species
that are in the liquid state at room temperature into the vacuum gap ................................94
Figure 5.10 Electrical schematic of the thermionic emission testing
configuration. The sample to be tested was resistively heated by a Lambda
power supply (Vsubstrate heater). The anode was biased by a separate high voltage
power supply with the grounds of the two power supplies tied together.

xiv
Electron emission current was monitored by a floating picoammeter in series
with the anode power supply. ............................................................................................95
Figure 5.11 Flow diagram depicting the Labview control loop for the current
vs. temperature tests. ..........................................................................................................97
Figure 6.1 Thermionic emission current behavior of an as-grown diamond
sample as a function of temperature ................................................................................102
Figure 6.2 Richardson plot of the thermionic emission data seen in Figure 6.2.
It is clear that the plot is not linear contrary to what would be expected from
the Richardson equation. Rather there was a distinct transition temperature in
which both the work function and Richardson constant increased. .................................103
Figure 6.3 Comparison of the thermionic emission testing results from Test
#1 and Test #2 of an as-grown sample before hydrogenation. Test #1 was an
as-grown diamond sample and the thermionic emission current was observed
to increase with temperature according to the Richardson equation until
~800oC, upon which the emission current began to decrease. Test #2 was
performed on the same sample after a cool down period. No emission current
above the noise level was observed up to a maximum testing temperature of
800oC. The solid line represents the fit to the Richardson equation of Test #1
data ...................................................................................................................................107
Figure 6.4 Comparison of the thermionic emission testing results from Test
#1, Test #2, and Test #3. The electron emission current from the sample after
hydrogenation was significantly higher than the previous runs. The solid line
represents the fit of Test#3 to the Richardson Equation. .................................................108
Figure 6.5 Visual depiction of the as-grown diamond sample, A) compared
with a hydrogenated sample, B). The as-grown sample was grown in a
methane-starved hydrogen-rich environment resulting in some concentration
of hydrogen on the diamond surface and in the diamond bulk. Exposure of the
sample to a hydrogenation treatment increased both surface and bulk
concentrations resulting in higher emission current levels but little change in
work function. ..................................................................................................................110
Figure 6.6 As-grown thermionic emission current vs. temperature behavior
for Set A. It can be seen that the emission current behavior was similar for
each sample. The discrepancies likely were a result of the polycrystalline
nature of the diamond films .............................................................................................113
Figure 6.7 Comparison of the performance of each sample before and after
hydrogenation from Set A ................................................................................................114

xv
Figure 6.8 Maximum current densities obtained from each film as a function
of temperature at which they were achieved for each hydrogenation treatment
in Set A. It can be seen that the maximum emission current decreased with
increasing temperature until the final temperature of 850oC ...........................................115
Figure 6.9 Emission current density vs. cathode temperature of samples B1,
B2, and B3 hydrogenated for 1, 2, and 4 hours respectively. It can be seen that
increased exposure time not only decreased the maximum emission current
density values slightly but also decreased the temperature at which the
samples achieve their maximum current densities...........................................................116
Figure 6.10 Maximum emission current density values as a function of
temperature at which they were achieved for each hydrogenation treatment. It
can be seen that there was a trend of decreasing thermionic emission
performance as the duration of hydrogenation treatment increased ................................117
Figure 6.11 Emission current density vs. cathode temperature of samples C1,
C2, and C3 hydrogenated at pressures of 550, 700, and 850 Watts,
respectively. It can be seen that increased microwave power had little effect
on emission current ..........................................................................................................119
Figure 6.12 Maximum emission current density values as a function of
temperature at which they were achieved for each hydrogenation treatment. It
can be seen that there microwave power had little influence on maximum
emission current density values .......................................................................................119
Figure 6.13 Normalized emission current for two samples (sample A: 600°C,
650°C, 750°C; sample B: 700°C, 725°C, 775°C) at different operation
temperatures. The small vertical and horizontal lines within each data point
represent the error of the ammeter and the pyrometer respectively .................................124
Figure 6.14 First-order plots of emission current for temperatures between
600oC and 775
oC. Two samples were measured (Sample A: 600
oC, 650
oC,
750 o
C; Sample B: 700 oC, 725
oC, 775
oC). .....................................................................125
Figure 6.15 Arrhenius plot of rate constants obtained in Figure 3. The slope is
equal to –EA, found to be 1.23eV and the y-intercept is equal to ln(ko) found
to be 2.5 x 10³ s
-1...................................................................................................126
Figure 6.16 Morse diagram representing the difference in Zero Point Energies
(ZPE) between hydrogen and deuterium. As deuterium has a higher mass, it
will have a lower vibration energy implying that it will have a larger
activation energy than hydrogen ......................................................................................131
Figure 6.17 Normalized thermionic emission current behaviors as a function
of time ..............................................................................................................................133

xvi
Figure 6.18 First order desorption plot of the normalized isothermal
thermionic emission current behaviors. The linear trend at each temperature
indicates the desorption followed first order kinetic behavior .........................................134
Figure 6.19 Arrhenius plot of the desorption data. The deviation from
linearity at lower temperatures incates tunneling could have played a role in
the desorption mechanism................................................................................................134
Figure 6.20 Generic parabolic potential diagram comparing the classical to
the tunneling desorption mechanism. ..............................................................................135
Figure 6.21 Fit of the k values at each temperature accounting for tunneling ................137
Figure 6.22 Tunneling fit to the hydrogen desorption data from the previous
section ..............................................................................................................................138
Figure 7.1 Isothermal thermionic emission behavior of an as-grown nitrogen-
incorporated diamond cathode in a molecular nitrogen gaseous environment.
It can be clearly seen that nitrogen had a negative effect on the emission
performance from diamond cathodes likely due to the decreased mean-free-
path of electrons traveling from the cathode to the anode ...............................................142
Figure 7.2 Isothermal thermionic emission current behavior of an as-grown
nitrogen-incorporated diamond cathode in the presence of methane gas. Four
runs were performed and each run tested at 600oC, 625
oC, 650
oC, 675
oC, and
700oC. Little effect can be seen in the emission current (blue points) as
methane pressure (red points) increased. Plots for 675oC and 700
oC were not
shown as they exhibited the same behavior as the other temperatures. The
anode voltage was increased from 200V used in Runs 1 and 2 to 400V in Run
3 and 600V in Run 4. Again, no effect was observed with increasing voltage ...............147
Figure 7.3 Isothermal emission current testing of a hydrogenated diamond
sample in the presence of methane gas. A small positive increase in emission
current (blue points) can be seen as the methane pressure (red points) was
introduced into the chamber. Plots for the 675oC and 700
oC runs were not
shown as the variations in emission current were too large to decipher any
significant changes in emission current ...........................................................................148
Figure 7.4 Semi-log plots of the percent of total ionization of the primary
methane dissociation products as a function of pressure. Data has been
digitized from a previous study by G. Drabner and colleagues. ......................................151
Figure 7.5 Semi-log plots of the percent of total ionization of the secondary
methane dissociation products as a function of pressure. Data has been
digitized from a previous study by G. Drabner and colleagues .......................................151

xvii
Figure 7.6 Semi-log plots of the percent of total ionization of the tertiary
methane dissociation products as a function of pressure. Data has been
digitized from a previous study by G. Drabner and colleagues .......................................152
Figure 7.7 Thermionic emission current behaviors of diamond films operating
in a low pressure water vapor environment. The four testing runs shown are
categorized by the temperature at which they were performed and are labeled
accordingly. It can be seen that the emission current increased in the presence
of water vapor at the lower temperatures but increased at higher temperatures ..............157
Figure 7.8 Isothermal emission current behavior of an as-grown diamond film
with hydrogen leaked in for the temperature 600oC, 625
oC, and 650
oC. The
blue data represents the current while the red data represents the pressure in
the chamber. For all graphs, it can clearly be seen that there was an increase in
emission current when the hydrogen pressure was increased in the chamber .................166
Figure 7.9 Isothermal emission current behavior of a hydrogenated diamond
film with hydrogen leaked in for the temperatures 600oC, 625
oC, and 650
oC.
The blue data represents the current while the red data represents the pressure
in the chamber. For all graphs, it can clearly be seen that there was an increase
in emission current when the hydrogen pressure was increased in the chamber .............167
Figure 7.10 Example of the residual plot performed for all data runs which
allowed for direct calculation of the increase in current upon hydrogen being
leaked into the chamber ...................................................................................................168
Figure 7.11 Plot of the emission current increase in the influence of hydrogen
gas as a function of the current before the start of the leak-in (baseline
current). A clear relationship can be seen where the magnitude of increase
increased with baseline current. Two possible trend lines were found to
describe this relationship: linear and power.....................................................................170
Figure 7.12 Plots of the emission current vs. temperature after the third
testing runs for the as-grown (a) and hydrogenated (b) diamond sample........................171
Figure 7.13 Emission current response of the as-grown diamond sample to the
introduction of a low pressure nitrous oxide environment. Graphs a), b), and
c) are the behavior for the four runs performed at 600oC, 625
oC, and 650
oC,
respectively ......................................................................................................................178
Figure 7.14 Emission current behavior of a hydrogenated diamond sample in
the influence of a low pressure nitrous oxide environment. Graphs a), b), and
c) are the behavior for the four runs performed at 600oC, 625
oC, and 650
oC,
respectively ......................................................................................................................180

xviii
Figure 7.15 a) Magnitude of the emission current decrease from baseline
vacuum levels upon exposure of the cathodes to nitrous oxide. b) Percent of
emission current decrease from vacuum levels ...............................................................181
Figure 8.1 Potential output current of an all diamond thermionic energy
converter with molecular hydrogen as the interelectrode gas at a pressure of
5.5µTorr ...........................................................................................................................191
Figure 8.2 Potential output power of an all diamond thermionic energy
converter with molecular hydrogen as the interelectrode gas at a pressure of
5.5µTorr ...........................................................................................................................191

1
CHAPTER I
INTRODUCTION
This chapter is meant to introduce the focus of the present research. A brief history of
thermionic emission is presented along with its potential applications to the field of energy
conversion. Existing power generation technologies are also discussed to emphasize the
motivation behind the present research. Finally, the goals and objectives of the research are
discussed along with an organization of this dissertation.
1.1 History of thermionic emission and vacuum devices
Thermionic emission is a long understood principal that has played a crucial role in not
only the history of electronic devices but also our modern understanding of physics. Though E.
Becquerel is credited with first observing this phenomenon in 1853, little became of his research
until Thomas Edison took interest in the subject in the late 19th
century.[1, 2] While working
with his famed incandescent light bulb, Edison observed that, following extended operation
periods, a dark residue consistently formed on the inside surface of the glass enclosure. Upon
closer examination, Edison noted that there always appeared to be a white strip in the residue in
the plane of the filament.[2] In 1883, after three years of failed attempts to understand the cause
of this white strip, Edison decided to position an additional electrode adjacent to the filament. To
his surprise, current was observed to flow when it was biased positively with respect to the
filament. This finding indicated that it was Becquerel’s thermionic emission that was causing this
nuisance. Edison’s observation led him to file the first patent for what is now known as the
“thermionic diode.”[2, 3]

2
With Edison’s findings coming nearly a decade before the discovery of the electron, the
scientific community struggled to comprehend the effects he was observing. This is clear from
the first paper presented on the effect by E.J. Houston (per Edison’s request) at the International
Electrical Exposition in Philadelphia in 1884.[4] Houston stated:
“The question is, what is the origin of this current? How is it produced? … we cannot
conceive the current as flowing across the vacuous space…I have no theory to propound as to
the origin of this phenomena.”[4]
Though Edison soon abandoned attempts to understand this anomaly, his co-worker and
chief science adviser to the Edison Electric Light Co. of England, Ambrose Flemming, continued
research in this topic.[2] In 1890, Flemming published the first observations of the rectifying
properties of the thermionic diode in his paper titled: On Electric Discharge between Electrodes
at Different Temperatures in Air and in High Vacua.[5] By 1904, Fleming had finally invented
the vacuum tube diode as we know it, closely followed by the invention of the tridode vacuum
tube amplifier by Lee De Forest in 1906, thereby marking the beginning of today’s electronic
industry.[6] Though these vacuum devices have largely been replaced by the semiconductor,
thermionic emitters are still used in many applications including florescent lighting,[7] electron
microscopy,[8] CRT displays,[9] and perhaps most importantly, energy conversion, which is the
focus of the present research.[10]
1.2 Motivation for energy conversion research
Over the past century, the world’s demand for electrical energy has been rapidly
increasing and is projected to continue to rise significantly in the foreseeable future. Despite this
increasing demand, methods used to generate electrical power have remained relatively

3
unchanged. Further, the growing scarcity of fossil fuels illustrates the urgency to utilize
renewable energy sources. The present research explored the use of diamond in a recently
unexplored method for directly converting thermal energy into electrical energy known as
thermionic energy conversion.
1.2.1 Today’s energy climate
A major driving factor in the rapid industrialization of countries like the United States
during the 20th
century was the relatively cheap cost of fossil fuels. Fossil fuels were able to
maintain a relatively low price point for several decades as there were very few other
industrialized nations. Assessing today’s energy climate becomes more difficult as developing
countries such as China and India are experiencing similar rapid industrialization, thereby
drastically increasing the worldwide demand for fuel. To further exacerbate the situation, the
United Nations has predicted that the world’s population will reach nine billion by the year 2050,
with the majority of this growth occurring in developing countries.[11] This population boom,
coupled with the world’s increasing standard of living, paints a dire picture for the world’s future
energy climate.
As depicted in Figure 1.1, the 2009 World Energy Outlook Report states that a large
majority of the world’s power is derived from coal and oil. Both of which are considered non-
renewable resources that many fear will be exhausted in the near future if current predictions
hold.[12]

4
Figure 1.1 Graph of the world energy consumption by fuel type in terms of million tons
of oil equivalence (MTOE)[12]
Accordingly, in 2006, a report was released by British Petroleum (BP) stating that the
total identified or proven world oil reserves was 1,200 billion barrels of oil.[12] Accounting for
the current estimated undiscovered oil reserves, the world is expected to reach its peak oil
production in the next few decades as seen in Figure 1.2.[11]
Figure 1.2 Current estimates of world oil production from the year 1900 through 2100
based on a 2006 study by BP. The three peaks represent the three possible times in which
the world will reach peak production.[11]

5
Though the situation is not as dire as oil, our coal resources are also dwindling. Another
study by BP has estimated that the world’s proven recoverable coal resources are around 909
billion tons which is expected to last for the next 164 years at 2004 consumption use.[11]
Unfortunately the use of coal has increased by an average of 6% from 2002 to 2005. Thus, if this
current trend continues, our coal reserves could be depleted much sooner.[11] Additionally,
many associate coal-fired power plants with extreme negative environmental and health impacts
leading several countries (such as the United States) to adopt policies to limit the use of coal
power generation technologies.[13]
1.2.2 Current large-scale power generation methods
There are currently numerous methods in existence for the generation of electrical power
but few are applicable to meeting the world’s large-scale energy demands. The current
predominate methods involve a complex multistep conversion of thermal into electrical energy
which begins with acquiring a heat source. In the vast majority of plants, this thermal heat source
comes from either the burning of fossil fuels or a controlled nuclear reaction. Thermal energy is
then converted into mechanical energy by a multiphase working fluid. Lastly, the mechanical
energy is converted into electrical energy through large turbines which are then used to drive
generators. This multistep process results in high energy loss which consequently leads to
relatively low operational efficiencies. These mechanical generators require high capital
investments and, due to the effects of wear and corrosion, demand substantial continuing
maintenance.[14, 15] A flow diagram of this process for a typical fossil fuel plant can be seen in
Figure 1.3.

6
Figure 1.3 Flow diagram of the components of a typical coal fueled power plant
beginning with the fuel handling through the energy conversion.[15]
1.2.3 Current small-scale power generation methods
In addition to improved large-scale power generation, the need for new forms of compact
and portable power generation has been driven by explosive growth in microelectronics, space
exploration, and nanotechnology. Traditional energy conversion technologies lack the portability
and energy density demanded by these applications. Often, electrochemical batteries do not
provide sufficient power or energy storage capacity. Other power sources, such as liquid fuels
and radioactive elements, possess high energy density but require a means of efficiently
converting thermal power to electrical form. In all of these applications, the minimization of
moving parts is essential to the deployment of a new generation of small-scale energy conversion
devices.
Compact thermoelectrics can reliably directly convert thermal energy to electrical energy
with no moving parts by utilizing the thermoelectric effect. However, these systems have proven
impractical in most cases due to material limitations such as the inverse relationship between
7
Seebeck coefficient and electrical conductivity.[16] For instance, current state of the art
thermoelectric power generation devices are only able to theoretically achieve efficiencies less
than 20%.[17]
1.3.3 Renewable power generation technologies
There is a current “green” movement throughout the world that is meant to discourage the
use of polluting fossil fuel plants in favor of cleaner, more sustainable energy conversion
technologies. Although they are outside the scope of this paper, a few of the prominent
alternative energy sources will be discussed in order to provide a more complete survey of
current energy production methods.
Among alternative energy technologies, photovoltaics have received the most attention.
A photovoltaic (solar) cell consists of a PN semiconductor junction in which photons excite
electrons into the conduction band. The output voltage is determined by the difference in the
Fermi energies between the n-side and the p-side and the current is proportional to the intensity
of the incident light.[18] Photovoltaics suffer from poor performance as only a fraction of the
solar spectrum can be converted to electricity. For example, for a photovoltaic technology that
can achieve 20% efficiency, the necessary area to provide 1MW of power is roughly equal to
26,000m2 or 6.4 acres.[14]
Another commonly discussed technology is wind power generation. This fairly straight
forward technology harnesses the wind through large propellers which spin and drive a turbine.
In the United States and several other countries, the wind resource is large enough to meet the
country’s entire energy demands.[19] The widespread adoption of wind power generation is
hindered due to the natural variability of wind. In some instances, the wind may reach 20 m/s

8
which allows for large amounts of power to be produced, while in other instances, the wind may
not being blowing at all.[19] The lack of adequate large-scale energy storage methods prevents a
steady amount of electricity from being distributed leading wind power to be only a supplement
to other more reliable energy conversion technologies.
1.4 Thermionic energy conversion
Thermionic energy conversion (TEC) is a technology that has received little attention
over the past few decades for the direct conversion of thermal energy into electrical energy.[20,
21] Not only does TEC provide an efficient stand-alone method for energy conversion but could
also be incorporated into existing power generation technologies to scavenge waste heat and
increase their overall power output capabilities. A thermionic energy converter is based on the
process known as thermionic emission. In this process, a heated material (known as the cathode)
emits electrons with energy exceeding the material’s work function.[22] In a typical two
electrode configuration, these emitted electrons traverse a vacuum gap and are collected by an
anode.
The efficiency of a thermionic energy converter greatly depends on the ability of the
cathode to emit electrons. This dependence is what led many researchers to abandon TEC
research during the latter part of the 20th
century due to materials available at that time. Recent
observations of the electronic properties of diamond, such as its superior electron emission
capabilities, have revived interest in thermionic energy conversion. The present research is meant
to further characterize the thermionic emission capabilities of diamond so that an efficient TEC
device can be realized.

9
1.5 Research objectives
The goal of the present research is to further investigate the thermionic emission
properties of diamond films for use in thermionic energy conversion. As will be discussed later
in this dissertation, a practical thermionic energy converter requires a cathode capable of
efficiently emitting electrons, ergo a cathode that thermionically emits a large amount of current
at relatively low temperatures. In addition to studying the performance of these films, durability
and longevity must also be characterized and maximized.
The objectives of this research are to:
Fabricate diamond thermionic cathodes capable of achieving high levels of thermionic
emission current at temperatures up to 1,000oC;
Design a testing apparatus able to accurately characterize the thermionic emission current
from diamond cathodes;
Investigate potential failure mechanisms of the diamond cathodes that could limit their
implementation into a practical thermionic energy converter;
Identify factors that affect the thermionic emission properties of diamond;
Develop new methods to increase the performance, reliability, and longevity of diamond
thermionic emitters.
1.6 Organization of this dissertation
This dissertation consists of eight chapters organized in the following manner:
Chapter I details the background of thermionic emission and vacuum tube devices. The
necessity of new and more efficient energy conversion methods is discussed and a
summary of a few predominant power generation technologies is provided. An overview
10
of thermionic energy conversion is also presented along with the goals of the present
research.
Chapter II is meant to provide the reader with a strong background in diamond
technologies. Current fabrication techniques as well as characterization methods of
diamond films are discussed in the chapter. Additionally, the electronic properties and
methods of altering these properties are explained in detail.
Chapter III discusses the primary motivation behind this research, thermionic energy
conversion. Thermionic emission is derived in detail allowing for a better understanding
of the results obtained in this research. A brief history of thermionic energy conversion is
presented along with a discussion of this technology’s operating principals and design
considerations.
Chapter IV proposes the research to be conducted. This includes a description of the
testing methods, diamond samples to be fabricated, and data collection approaches.
Chapter V describes the details of the experiments conducted in the present research. This
includes fabrication of diamond cathodes, construction of testing apparatuses for
characterizing the thermionic emission from diamond cathodes, and design of testing
configurations.
Chapter VI presents the results of thermionic emission experiments executed in vacuum
environments. Emission performance of as-grown and hydrogenated diamond samples
was compared and the desorption of hydrogen (and deuterium) from diamond was also
studied.
Chapter VII presents the results of the thermionic emission studies performed in a
gaseous environment. Research examined molecular nitrogen (N2), methane (CH4),
11
molecular hydrogen (H2), water vapor (H2O), and nitrous oxide (N2O) in an effort to
enhance the emission performance of diamond cathodes.
Chapter VIII is written to summarize the conclusions made from the present research,
with recommendations provided for future work that should be explored in this area of
study.

12
CHAPTER II
DIAMOND: GROWTH, PROPERTIES, AND CHARACTERIZTION
2.1 Diamond background
The brilliance and rarity of diamond make it one of the most valuable, and thereby most
sought after naturally occurring materials. Diamond is an allotrope of carbon with each of its
four unpaired valence electrons covalently bonded to its nearest neighbor to form the “Diamond-
Cubic Lattice” consisting of two intersecting Face Centered Cubic lattices (Silicon also takes this
lattice structure).[23] The eight atoms encompassed in each unit cell, together with the small
bond length of 1.54 Å, result in the highest atomic density of any material allowing diamond to
possess many exceptional material properties.
Figure 2.1 Image of the diamond lattice.[23]
Like silicon, diamond has the ability to function as a semiconductor upon substitution of
a portion of the carbon atoms with a dopant atom such as boron.[24] Recent interest in this
material has been spurred by its numerous advantages over other electronic materials such as
high carrier mobility, low dielectric constant, and radiation tolerance to name a few. As a wide

13
bandgap semiconductor, diamond has the capability to potentially function as both an effective
electronic insulator and a reliable electron transport medium. The widespread adoption of this
material has been hindered by the limited success in the fabrication of uniform films. The
following sections will discuss the deposition processes of diamond, methods for characterizing
its material properties, and also several interesting applications for which diamond is currently
being utilized.
2.2 Fabrication of diamond films
The numerous material advantages of diamond have enticed many researchers to examine
it as a potential alternative to silicon in the semiconductor industry. The major obstacle
preventing the widespread use of diamond is the unconventional and often unreliable fabrication
methods. Carbon is unique in that it can take on many different allotropes (i.e. graphite, carbon
nanotubes, Buckminsterfullerenes, etc.) requiring precise deposition conditions in order to form
diamond.[25] Further, a technique to mass produce diamond wafers, such as the Czochralski
method for silicon, has not yet been developed. Current methods for the fabrication of
polycrystalline diamond films consist of a 3-step process: 1) Substrate selection and surface
preparation; 2) Nucleation; and 3) Film deposition. The fabrication of single-crystalline diamond
films, on the other hand, is a much more complex process.
2.2.1 Substrate selection and preparation and the nucleation process
As with many materials, diamond can be grown as single crystalline or polycrystalline.
Single crystalline films are often highly sought for electronic applications due to the long range
uniformity, surface smoothness, and lack of defects. It was previously noted that the unique

14
lattice structure and small lattice constant provides diamond with the highest atomic density of
any known material. Though this high atomic density is responsible for many of diamond’s
favorable material properties, it is also to blame for the current difficulties in the fabrication of
single crystalline diamond. The epitaxial deposition of any single crystalline material requires a
substrate with a similar lattice constant to minimize the strain arising from lattice mismatching
between the two materials. Diamond substrates can be used for homoepitaxial deposition but the
only substrate material with nominal success for the heteroepitaxial deposition of diamond is
cubic boron nitride (c-BN).[26] The lattice structure of c-BN, zincblend, is virtually identical to
the diamond lattice. In addition, the bond length between boron and nitrogen is similar to
diamond allowing for a lattice mismatch between the two materials of only 1.4%.[27] Further, c-
BN has a similar coefficient of thermal expansion to diamond which is necessary due to the high
temperatures required for the synthesis of diamond.
The difficulties of depositing single crystalline diamond have led many researchers to
explore polycrystalline diamond films, permitting a broader range of substrate materials than for
single crystalline deposition. The most commonly utilized substrates for polycrystalline diamond
are carbide forming materials (i.e. Si, Mo, W, etc.) which have much higher nucleation rates
compared to materials which do not form carbides.[27] Nucleation has been observed to
spontaneously occur at defect sites such as dislocations and slips when depositing diamond on
carbide forming substrates which has lead researchers to conclude that nucleation occurs on the
substrate rather than in the gas phase.[28] It has also been observed that such substrates tend to
prevent the formation of graphite, which readily forms in the presence of atomic hydrogen.[28]
When attempting to deposit diamond on non-diamond materials, spontaneous nucleation is often
too slow for practical applications. Numerous techniques have been devised to expedite the

15
growth process and many of these techniques can be combined together to further improve the
results. One such technique that has proven significantly important is substrate preparation.
It was previously mentioned that diamond nucleation tends to occur at defect sites.
Scratching is a commonly used method to artificially introduce these defects allowing for
significant growth enhancements compared to smooth surfaces (see Figure 2.2). [29, 30]
Ultrasonic scratching is one established method to provide uniform substrate scratching. This
process involves first suspending a hard abrasive such as diamond, silicon carbide, or boron
nitride in a methanol or acetone solution. The substrate material is then placed in this slurry and
vibrated ultrasonically for a period of time. The scratched substrates can either be placed directly
into the deposition chamber or be subject to additional preparation techniques to further
expediting the growth process.
Figure 2.2 SEM image of diamond crystals forming on a scratched silicon substrate[31]
Seeding the substrate surfaces with nanodiamond is another common method to enhance
the growth rate of diamond films and often accompanies substrate scratching. Seeding can often
be performed simultaneously with scratching by selecting nanodiamond as the abrasive which
deposits a fraction of the nanodiamond directly into the artificially created defect sites providing

16
localized points for diamond nucleation. As deposition time increases, the size of these particles
increases until they eventually begin to grow together, creating a uniform film. Seeding has also
been shown to produce epitaxial growth of diamond films by orienting nanodiamond seeds on
smooth silicon substrates.[32]
Substrate biasing is also used to accelerate the diamond growth process. Biasing can
often lead to nucleation densities similar to that of scratching but on smooth unabraded surfaces,
often providing improved uniformity and less contamination. A study by B.R. Stoner and
colleagues compared the quality of diamond films deposited on silicon of a scratched and seeded
substrate with a pristine substrate biased at 250 V.[33] Raman analysis of the two films grown
under the same parameters for one hour showed that substrate biasing led to a more uniform film
with higher nucleation densities and a larger number of grain boundaries.[33] B.R. Stoner
proposed a five step description of the growth process with substrate bias consisting of the
following process: (1) absorbed oxygen and amorphous carbon initially present on the substrate
are either etched away or begin to form Si-O and Si-C, respectively with the surface; (2) oxygen
is etched away and carbon “islands” form; (3) carbides reach a critical thickness preventing
further growth, thus providing an excess concentration of carbon on the substrate surface
permitting small clusters favorable to diamond formation; (4) continued biasing promotes
etching of the surface but not of the stable diamond nuclei; and (5) this continues until there is a
complete coverage of the surface with diamond nuclei.[33] This diamond growth process
described by Stoner and colleagues is depicted in Figure 2.3.

17
Figure 2.3 Schematic diagram of the biased enhanced diamond growth processes during
the first two hours of deposition presented by Stoner and colleagues.[33]
2.2.2 Film deposition
The predominant method for diamond deposition, chemical vapor deposition (CVD), uses
a high energy source to break apart gas species which eventually settle on a substrate in a desired
manner. The high energy required for CVD can be derived from a number of sources such as
microwaves, heat, or electrons, to name a few. This section will focus on the two most
commonly used methods for the deposition of diamond: Microwave Plasma-enhanced Chemical
Vapor Deposition (MPCVD) and Hot Filament Chemical Vapor Deposition (HFCVD).
To date, the simplest and most reproducible method for diamond deposition is
HFCVD.[27] In the HFCVD process, a filament or series of filaments is heated to extreme
temperatures often in excess of 2000oC. This intense thermal energy causes gas species to ionize
and dissociate when directed near the filament which eventually reform on the desired substrate.
Metals with a high tolerance to hydrogen, such as tungsten, are the preferred filament materials
due to their increased lifetimes. The simplicity and ability to easily scale to large area deposition
has made this method attractive to many researchers.

18
MPCVD reactors use microwaves, in the 2.45 GHz range, to initiate a plasma which is
formed by the microwave induced oscillation of electrons. These electrons collide with gas
atoms and molecules to generate high ionization fractions.[34] MPCVD reactors produce a very
stable and reproducible environment allowing for long deposition times of hundreds of hours. In
addition, the cost of MPCVD reactors has been drastically reduced over the past 20 years due to
the high availability of microwave power supplies.[27] A diagram of a MPCVD chamber can be
seen in Figure 2.4 (b).
Figure 2.4 Schematic of an (a) HFCVD apparatus and (b) MPCVD apparatus[27]
In each of these processes, deposition conditions play a crucial role in the ability to form
diamond. A notable study by Hayashi and colleagues examined the dependence of substrate
temperature on diamond nucleation rate.[35] In this study, diamond films were deposited via
MPCVD and the substrate temperature monitored with an infrared pyrometer. An external
ellipsometer was used to measure the substrate thickness while under vacuum. Hayashi and
colleagues observed a sharp increase in nucleation density with increasing temperature up to a
(a) (b)

19
temperature around 860oC followed by a slight decline up to the maximum tested temperature of
950oC.[35] This observation implies the existence of an optimal substrate temperature for
promoting diamond nucleation.
In addition to the substrate temperature, gas pressure and composition have been
observed to affect the deposition process. The gases typically involved in the CVD process are
molecular hydrogen and a carbon containing gas (often methane). Semiconducting diamond
requires a third gas such as boron (in the form of trymethylboron) for p-type doping or
phosphorus (in the form of phosphine) for n-type doping.[36] Previous research has shown that
low CH4:H2 mixture ratios (0.1-0.5%) provide high quality diamond crystals with cubo-
octahedral morphology but low nucleation densities.[27, 37] Alternatively, high CH4:H2
mixture ratios (1.2-1.4 %) provide increased nucleation densities and film coverage, but also
higher non-diamond components.[27, 37] Studies have also examined chamber pressure effects
on the growth process and determined that the highest nucleation densities occur at lower
pressures around 5 Torr.[27] It is difficult to present more detail on the influence of deposition
conditions on diamond growth as many of the exact growth parameters for certain diamond
morphologies are not available due to proprietary constraints. Accounting for all of the discussed
factors involved in diamond deposition demonstrates the difficulty of utilizing it as a mass-
produced electronic material.
2.3 Characterization of diamond films
Often the ability to characterize deposited films can be as important as growing the films.
Thus far, several factors have been discussed in this dissertation that affect the growth of
diamond films allowing for countless combinations of structural morphologies (grain size,

20
orientation, graphitic content, etc.), electrical characteristics (carrier concentration, mobility, and
work function), and mechanical properties (hardness, thermal conductivity, refractive index,
etc.). This wide range of variation between diamond films necessitates the ability to accurately
quantify all of these properties.
Perhaps the most widely used method for examining diamond films is Raman
spectroscopy given that it is non-destructive and requires little to no sample preparation.[38]
Raman spectroscopy employs a monochromatic light source to examine the frequency change of
the incident photons upon interaction with a sample. These photons are absorbed by the sample
and reemitted at a shifted frequency providing information on the vibrational, rotational, and
other low frequency transitions of the molecule.[39] Raman spectroscopy is often used for
observation of sp3 and sp2 bonding and also for the determination of crystal size.[38, 40]
Though diamond (sp3) has a relatively large Raman scattering cross section, it is still two orders
of magnitude less than that of graphite (sp2), making this technique much more sensitive to
sensing sp2 bonding over sp3 bonding. Typical Raman spectroscopy measurements only observe
the first order peak at 1332 cm-1
, however, the ideal diamond lattice should reveal a second order
peak in the spectral range from 0 to 2690 cm-1
and a third order peak has been observed at
wavenumbers from 3650 to 3760 cm-1
.[41] A general Raman spectrum of gem quality diamond
at room temperature can be seen below in Figure 2.5.
21
Figure 2.5 General Raman spectra of gem quality diamond excited at wavelengths of
229.9 nm at room temperature demonstrating the first, second, and third order Raman
peaks [41, 42]
X-ray Diffraction (XRD) is also frequently used to characterize the composition of films.
XRD can measure the crystal structure of materials through the diffraction scattering of an
incident X-ray beam. By analyzing the diffraction angles, the spacing between adjacent crystal
planes can be determined and compared to values for known materials.[43] Figure 2.6 presents
the typical XRD peaks for diamond films with (100) and (111) facets.

22
Figure 2.6 Typical XRD patterns for diamond samples with (a) (100) surface facets and
(b) (111) surface facets[34]
A detailed analysis of the chemical bonding and surface species can be obtained through
X-Ray Photoelectron Spectroscopy (XPS). XPS is performed in a high vacuum environment by
irradiating a sample with high energy X-rays causing electrons with sufficient energy to emit
from the sample. Examining the energy distribution of these emitted electrons provides
information on the energy distribution of the electronic states in the material.[44] Similar to XPS,

23
Ultra-violet Photoelectron Spectroscopy (UPS) irradiates a sample with ultra-violet light also
causing electrons to be emitted.[45] This energy distribution obtained from UPS can be used to
determine the work function of a sample.
Microscopy methods are often used to qualitatively observe the structure of diamond
films. Scanning Electron Microscopy (SEM) and Atomic Force Microscopy provide basic
information on the surface morphology and roughness.[23, 46] Because SEM requires a
conducting film for adequate imaging, micron-sized insulating diamond is often unable to be
imaged. Accordingly, Transmission Electron Microscopy (TEM) is another tool which uses high
energy electrons to tunnel through a sample allowing individual atoms to be imaged providing
information on crystal orientation and internal defects.[46]
Figure 2.7 SEM spectra of polycrystalline diamond films with (a) (111) triangular faces,
(b) (100) square faces, and (c) cauliflower-like small crystalline aggregates[47]

24
When dealing with semiconducting diamonds, precise electronic characterization is
desired. Secondary Ion Mass Spectroscopy (SIMS) can help quantify the doping concentration
and species of diamond films.[48] SIMS bombards a sample with high energy ions which in turn
ionizes and ejects atoms from the sample’s surface. These ejected atoms are then analyzed by
their mass to provide information on elemental concentrations. Simple current-voltage and
capacitance-voltage analysis can provide basic information on the electronic properties and can
often be used in place of SIMS when exact carrier concentration values are not required.
2.4 Material properties of diamond
Recent advances in the ability to fabricate diamond films have spurred new research into
the use of diamond as an electronic material. Diamond’s unique combination of superior
electronic and material properties could lead a promising future in the electronics industry.
As previously mentioned, diamond shares its lattice structure with silicon. This structure
is known as face-centered diamond cubic. Similar to face-centered cubic lattices with 8 corner
atoms and 6 face centered atoms, the diamond cubic lattice has four additional atoms forming an
adjacent interpenetrating lattice that is spaced one quarter of a cube diagonal from the
former.[49] The 8 atoms per unit cell encompassed in this structure, coupled with carbon’s
strong chemical bonding, gives diamond the highest atomic density of any material and is
responsible for many of its superior properties.[50] Diamond has the highest hardness, molar
density, thermal conductivity, and sound velocity as well as the lowest compressibility and bulk
modulus of any other known material.[34] A few of diamond’s material properties compared
with other materials can be seen below in Table 2.1.

25
Table 2.1 Comparison of diamond to silicon, boron nitride, and copper
Property Units Diamond Silicon Boron
Nitride Copper
Thermal
Conductivity
W/cm*oC 20 [34] 1.5 [34] 13 [34] 3.8 [34]
Longitudinal
Sound Velocity
m/s 18,000 [34] 7,500 [34] 7,000
[34]
4,760
[34]
Knoop Hardness kg/mm2
5,700-10,400
[34]
940-980
[51]
4,500
[34]
40 [34]
Young's Modulus x1011
dynes/cm2
105 [34] 11.3 [34] 900 [52] 12.8 [34]
Density g/cm3
3.52 [34] 2.42 [34] 2.3 [53] 8.9[34]
2.5 Doping of diamond
Diamond differs from typical semiconductors in that it possess a large bandgap of 5.45eV
compared with silicon at 1.1eV.[50] Acting as a wide bandgap semiconductor, diamond has the
ability to function as both a strong electrical insulator as well as a good conductor with the
incorporation of dopant atoms. However, a major limiting factor preventing the widespread
adoption of diamond as an electronic material is its asymmetric doping problem. For instance,
boron is easily incorporated into the diamond lattice through substitution resulting in p-type
doping. In fact, naturally occurring boron doped diamond is prevalent and are colloquially
referred to as “blue diamonds.” Conversely, n-type doping has proven extremely difficult.[36]
The following sections seek to further elaborate on this asymmetrical doping problem.
The wide bandgap nature of diamond makes the identification of suitable dopant species
a challenging task. Problems also arise after identifying such a species as the substitutional
incorporation of non-carbon atoms has proven challenging. For example, diffusion is a widely
used method for doping typical semiconductors but is extremely difficult in diamond due to its
compact lattice allowing only the diffusion of species smaller than or comparable to carbon at
reasonable temperatures.[36] Further, while ion implantation is also often used for doping other

26
semiconductors, it is problematic in diamond due the metastability of the sp3 bonding of the
carbon in diamond with respect to the stable sp2
bonding configuration of graphite. The crystal
damage associated with ion implantation often converts to graphite upon annealing.[54] As a
result of these difficulties, the prevailing method for doping diamond has proven to be the
incorporation of a dopant species during the growth process.
2.5.1 P-type diamond
It has been mentioned that p-type doping of diamond has proven easier than n-type
doping. The predominate method for achieving p-type conductivity is through the addition of
boron containing species into the deposition gas mixture. Success has been made using gaseous
TriMethylBoron (TMB) as the boron containing species.[55] It has been widely documented
that the acceptor level of substitutional boron in diamond lies at 0.37eV above the valence band
allowing for thermal activation at reasonably low temperatures.[56] Hole motilities exceeding
1000cm2V
-1s
-1 and resistivities less than 10
-2 Ωcm have been reported emphasizing diamond’s
ability to act as a p-type semiconductor.[57]
2.5.2 N-type diamond
Several species have been examined as potential n-type donors in diamond including
nitrogen, phosphorus, and sulfur. Currently, phosphorus stands as the best candidate with a donor
level located at 0.6eV below the conduction band.[36] Though the phosphorus atom is much
larger in size than carbon and has a high equilibrium formation energy, phosphorus
concentrations up to 5*1019
cm-3
have been achieved with electrical activity in the (111)
direction.[36] Sulfur has also been shown to act as a substitutional n-type dopant with marginal

27
success. Regardless of the donor level being positioned favorably at only ~0.37eV below the
conduction band, useful concentration levels (exceeding 1015
cm-3
) have yet to be achieved.[58]
Interestingly, it has been documented that the incorporation of H2S into the deposition gases not
only provides n-type conductivity but also improves the quality of the diamond by reducing
graphitic content.[58] Finally, nitrogen as an n-type dopant in diamond must be discussed as it is
of particular interest to the present research.
2.5.3 Nitrogen-incorporated diamond films
To date, numerous studies have been conducted examining the role of nitrogen on the
electronic properties of diamond. With a -3.4eV formation energy, nitrogen easily enters the
diamond lattice as a substitutional dopant atom making nitrogen doped diamond uncomplicated
to fabricate (relative to other dopant species).[59] Unfortunately, previous research has shown
that substitutional nitrogen doping does not significantly influence the electronic properties of
diamond due to its deep donor level at 1.7eV below the conduction band.[36] However, the
addition and subsequent incorporation of nitrogen during the deposition process promotes defect-
induced energy bands allowing conduction band carrier “hopping”, thus aiding in electron
transport through the material.[60]
In addition to altering the electrical properties of diamond, nitrogen has also been shown
to affect the growth process. The presence of nitrogen in the deposition processes has been
documented to increase the growth rate of diamond films, allowing for uniform film coverage to
be achieved faster.[61] Previous studies have also suggested that the presence of nitrogen in the
grain boundaries leads to enhanced electron transport.[62] The subsequent increase in
conductivity is favorable for electron emission as it provides a higher flux of electrons traveling

28
normal to the diamond surface.[63] Given these benefits which nitrogen offers over other
possible n-type dopants in diamond, the present research chose to utilize nitrogen-incorporated
diamond films.
2.6 Hydrogen in diamond
The numerous effects hydrogen has on the electrical properties of current widely used
semiconductors have sparked recent research into its influence on diamond. For example,
hydrogen has been shown to alter the properties of silicon through the passivation of donors and
acceptors as well as unwanted deep recombination centers such as transition metals.[64]
However, hydrogen’s influence in diamond is much less understood. This is likely due to the
lack of available published research compared to other more prevalent materials such as silicon.
Indeed, while interest in diamond for its electronic properties continues to increase rapidly, much
debate still exists as to the roles hydrogen may play.
2.6.1 Electron Transport
A study published by M.I. Landstrass and K.V. Ravi in 1989 is among the first to note
the influence of hydrogen on the electrical properties of diamond.[65] In their study, diamond
films were grown on silicon wafers via chemical vapor deposition with methane and hydrogen as
the gas species. An electrical contact to the diamond film was made from deposited chromium
and gold. Contact to the silicon was made with sintered aluminum. Current-Voltage
characteristics were obtained first at room temperature from these as-deposited films through the
described contacts. The current-voltage data was then recollected at room temperature following
a thermal anneal at 800oC for one hour in flowing nitrogen. A final current-voltage test was

29
performed after the sample was exposed to a hydrogen plasma at 400oC for one hour.
Examination of the results found in this study (Figure 2.8) demonstrates that the resistivity
greatly increased after the heat treatment, in comparison to the as-grown resistivity. Furthermore,
the resistivity was observed to recover back to its initial state after the hydrogenation
procedure.[65] This study was one of the first to report that hydrogen can positively enhance the
electron transport through diamond films.
Figure 2.8 Current-Voltage curves of the diamond film as grown, annealed, and
hydrogenated from M.I. Landstrass and K.V. Ravi’s 1989 study[65]
In a later follow-up study, the same authors postulated that the resistivity of the
hydrogenated diamond crystals was governed by shallow acceptor levels.[66] Subsequent

30
annealing of the samples removed the hydrogen activating the deep donors, thus pinning the
Fermi level and giving rise to the observed high resistivity. This follow-up study also observed a
nonlinear behavior of the I-V curve from a MPCVD deposited film post heat treatment
suggesting a continuous density of states present in the bandgap.[66] Contrary to these findings,
studies on both dc plasma deposited and natural diamond appear to exhibit discrete energy levels
in the bandgap.[66] To date, it remains unclear what causes these observed differences between
diamond grown via opposing methods.
2.6.2 Electron Affinity
Hydrogen has also been shown to influence the band structure of diamond films, namely
their electron affinity. Previous work by Cui and colleagues examining the effect of hydrogen on
CVD diamond films and subsequent electron emission behavior, concluded that hydrogen
termination decreases the effective barrier for electron emission by lowering the electron
affinity.[67] Further, as previously mentioned, diamond films can demonstrate a negative
electron affinity (NEA) whereby the vacuum level lies below the conduction band minimum.[68-
71] A band diagram of an NEA material is illustrated in Figure 2.9.
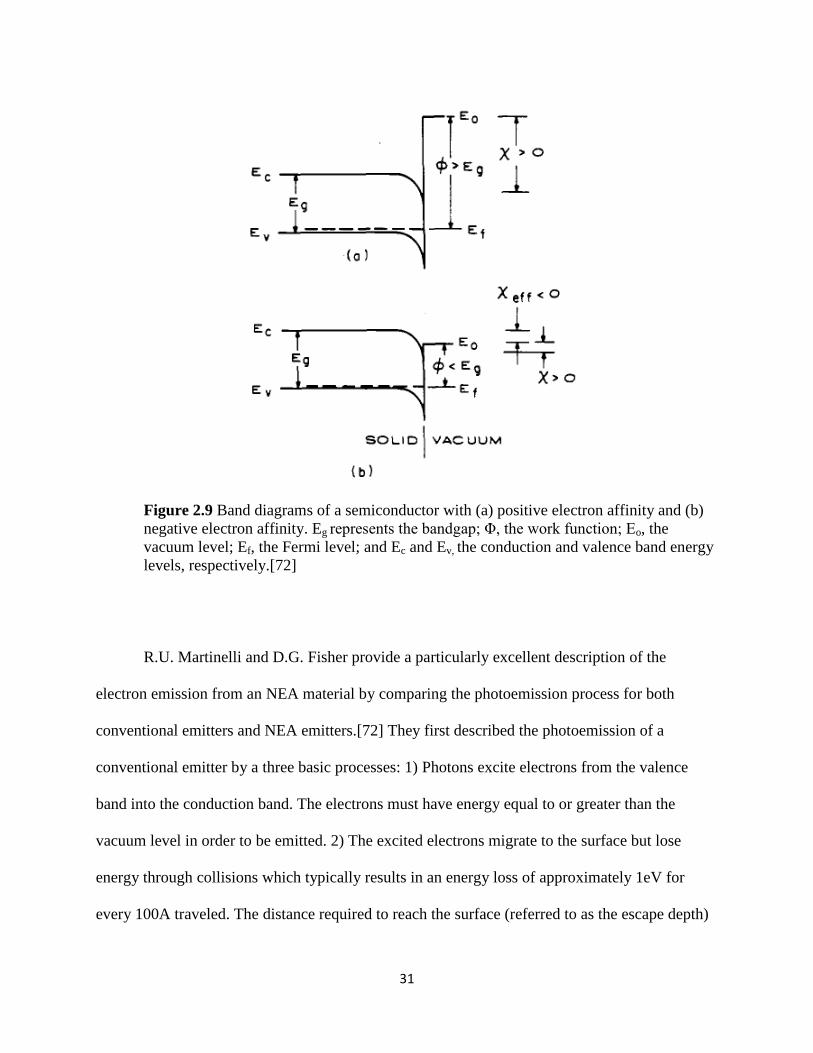
31
Figure 2.9 Band diagrams of a semiconductor with (a) positive electron affinity and (b)
negative electron affinity. Eg represents the bandgap; Φ, the work function; Eo, the
vacuum level; Ef, the Fermi level; and Ec and Ev, the conduction and valence band energy
levels, respectively.[72]
R.U. Martinelli and D.G. Fisher provide a particularly excellent description of the
electron emission from an NEA material by comparing the photoemission process for both
conventional emitters and NEA emitters.[72] They first described the photoemission of a
conventional emitter by a three basic processes: 1) Photons excite electrons from the valence
band into the conduction band. The electrons must have energy equal to or greater than the
vacuum level in order to be emitted. 2) The excited electrons migrate to the surface but lose
energy through collisions which typically results in an energy loss of approximately 1eV for
every 100A traveled. The distance required to reach the surface (referred to as the escape depth)

32
is dependent on the excitation energy of the radiation, the absorption processes, and the energy
dependence of the transport process. 3) Electrons with sufficient energy after the collision losses
are emitted into the vacuum while electrons not meeting this criteria decay to the conduction
band minimum.[72]
According to Martinelli and Fisher, NEA emitters function similarly to conventional
emitters in that excited electrons migrate across to the emitter surface losing energy to collisions.
However for an NEA emitter, the electrons without sufficient energy that decay to the bottom of
the conduction are in thermal equilibrium with the lattice remaining a few kT above the
conduction band minimum. These thermalized conduction band electrons can survive for
relatively long periods of time allowing them to diffuse distances as far as several microns which
are typically quite a few orders of magnitude longer than the escape depths. It is here that the
advantages an NEA emitter has over a conventional emitter can be seen. As the thermalized
electrons diffuse to the NEA surface, they are then able to emit into the vacuum as the vacuum
level lies below the conduction band, thus dramatically increasing the emission efficiency.[72]
Diamond has been shown to be one the few known materials to exhibit negative electron
affinity. In the first published study to suggest this, F.J. Himpsel and colleagues in 1979
examined a (111) oriented single crystal diamond sample by photoemission spectroscopy
whereby emission was observed down to the conduction band minimum indicating a negative
electron affinity.[68] However, it was not until later that this phenomenon was directly attributed
to hydrogen.
The observed NEA of the diamond surface is believed to result from the surface dipole
layer hydrogen introduces.[73] Hydrogen has a lower electronegativity than the corresponding
carbon in diamond resulting in a surface C-H bond that is polarized with a positive charge, δ+, on

33
the H atom. This charge provides a potential step that pulls the vacuum level below the
conduction band minimum by a distance equal to the C-H bond length. Accordingly, adsorbates
with higher electronegativities (such as oxygen) will increase the electron affinity.[73] A visual
depiction of this process is presented in Figure 2.10.
Figure 2.10 Band diagram and corresponding atomic arrangements of a clean,
hydrogenated, and oxygenated diamond surface.[73]
2.6.3 Desorption of hydrogen from diamond
A detailed discussion has been presented demonstrating hydrogen’s ability to influence
the electrical properties of diamond. Though this influence is thought crucial to diamond’s
superior thermionic emission abilities, it also dramatically limits the operating temperatures of
such cathodes. It was previously discussed that the annealing of diamond films leads to an
increased resistivity of diamond films which is observed to recover upon exposure to a hydrogen

34
plasma.[65] It can be deduced from this observation that annealing removes the beneficial effects
of hydrogen. Similar observations have been made in experiments studying the thermionic
electron emission properties of diamond films. Typical experiments characterizing the
thermionic emission properties of a material consist of increasing the temperature in gradual
steps while observing the emission current at each step. Such experiments performed on various
diamond films have all noted a distinct decrease in this emission current beginning around 800oC
with this trend continuing for the subsequent higher temperature steps.[74, 75] This observation
is consistent with previous research describing the isothermal desorption behavior of hydrogen in
diamond.[76] Thus, in order to improve the performance of diamond thermionic emitters, the
hydrogen desorption mechanism must be fully understood.
Several previous studies have attempted to determine the activation energy of hydrogen
in diamond using a wide variety of methods, including direct recoil spectroscopy (DRS), thermal
desorption spectroscopy (TDS), reflection high-energy electron spectroscopy (RHEED), and
electron-stimulated desorption time-of-flight spectroscopy (ESD-TOF), among others. The
hydrogen desorption phenomena can be described by the Polanyi-Wigner equation seen below.
( ) (2.1)
Where: km is the rate constant, m is the formal order; Em, the activation energy; and kom, the pre-
exponential factor.[77] It is clear from Table 2.2 that a large range of hydrogen activation
energies have been obtained for diamond surfaces.

35
Table 2.2 Comparison of the activation energies obtain from diamond films with
differing orientations using various methods. It can be see that most studies agree that the
activation energy of 100 oriented diamond films is around 1.5eV
Diamond Face Ea (eV) Method Reference
001 0.91 RHEED [78]
111 1.25 Change in x [79]
100 3.15 TDS [80]
100 1.48 Theory [81]
100 1.60 ESD-TOF [82]
100 1.47 TPD [83]
100 1.69 Ion Spectroscopy [84]
One notable study by T. Nishimori and colleagues in 1995 measured the time evolution
of the surface hydrogen coverage, θH, via the electron-stimulated desorption yield of H+
ions
with a time-of-flight mass spectrometer.[78] Figure 2.11a shows the time evolution curves
obtained in this study of θH during a thermal annealing at temperatures ranging from 1095oC to
1270oC. By assuming the hydrogen desorption is a first-order reaction, Equation 2.1 can be
rewritten as Equation 2.2.
( )
⁄ (2.2)
Where: kds: the desorption coefficient; t: time; and Cdiff: the hydrogen segregation rate from the
bulk.[78] Nishimori and colleagues then performed a least-squares fit of the data in Figure 2.11a
with respect to Equation 2.2 (seen in Figure 2.11b) to obtain an activation energy, Ea, of 21
kcal/mole for the desorption of hydrogen from diamond.[78]

36
Figure 2.11 a) Decrease in hydrogenation coverage as a function of anneal time for
various annealing temperatures. b) First order desorption fit of the data indicating an
activation energy of 21 kcal/mol[78]
Previous research has suggested that large measured surface hydrogen concentrations
correspond to two hydrogen atoms per surface carbon atom implying a dihydride surface
configuration.[85] Taking this into account, A.V. Hamza and colleagues postulated that the
desorption process consists of the “unimolecular decomposition of two adjacent dihydrides to
form two adjacent monhydrides”.[82] Examination of the large variation in activation energies
for the desorption process of hydrogen in diamond emphasizes the need for further studies.
Indeed, wide-spread utilization of diamond as an electronic material is unlikely without a better
understanding of this process.

37
2.6.4 Deuterium in diamond
Hydrogen has been shown to be responsible for many of the superior electron emission
properties of diamond films. Unfortunately, the relatively low activation energy promotes rapid
desorption of hydrogen at elevated temperatures leading to a temperature ceiling of around
800oC for a diamond thermionic emitter. This relatively low value (when compared to tungsten
which operates in excess of 1500oC) drastically limits the applicability of these films. One
method to combat this problem is through the use of deuterium rather than hydrogen. Deuterium
has the same electrical properties as hydrogen but with twice the atomic mass. It can therefore be
postulated, based on kinetic isotope theory, that more thermal energy will be required to
dissociate the C-H bond than the C-D bond.
A study by Baumann and Nemanich in 1998 examined the surface of diamond films with
photoemission spectroscopy upon exposure to both hydrogen and deuterium plasmas.[86] This
study observed that the negative electron affinity attributed to hydrogen termination could be
removed by annealing a sample at 1100oC. In contrast, deuterium terminated diamond still
exhibited NEA after annealing to 1200oC. It was found that heating of the sample to 1250
oC was
required to completely remove the NEA from the surfaces.[86] These findings demonstrate that
deuterium may be a viable replacement for hydrogen in diamond films. Furthermore, replacing
hydrogen with deuterium could allow for operation at higher temperatures thereby increasing the
overall thermionic emission current able to be extracted from a diamond cathode.
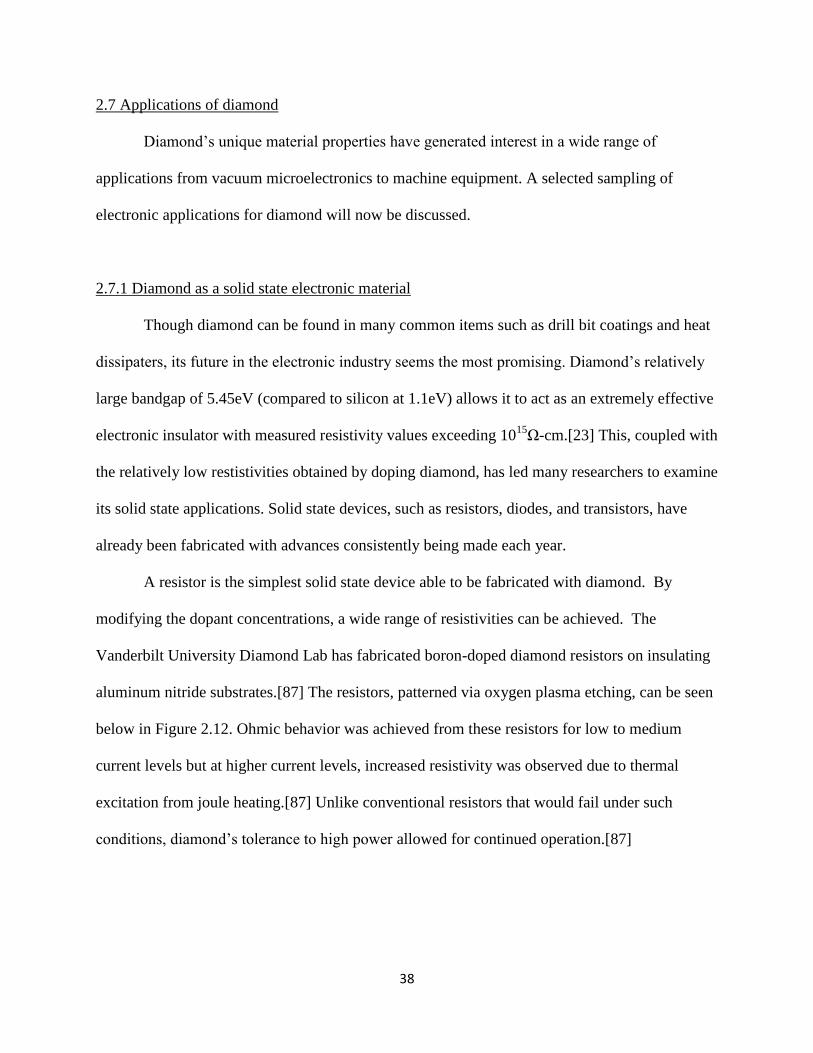
38
2.7 Applications of diamond
Diamond’s unique material properties have generated interest in a wide range of
applications from vacuum microelectronics to machine equipment. A selected sampling of
electronic applications for diamond will now be discussed.
2.7.1 Diamond as a solid state electronic material
Though diamond can be found in many common items such as drill bit coatings and heat
dissipaters, its future in the electronic industry seems the most promising. Diamond’s relatively
large bandgap of 5.45eV (compared to silicon at 1.1eV) allows it to act as an extremely effective
electronic insulator with measured resistivity values exceeding 1015
Ω-cm.[23] This, coupled with
the relatively low restistivities obtained by doping diamond, has led many researchers to examine
its solid state applications. Solid state devices, such as resistors, diodes, and transistors, have
already been fabricated with advances consistently being made each year.
A resistor is the simplest solid state device able to be fabricated with diamond. By
modifying the dopant concentrations, a wide range of resistivities can be achieved. The
Vanderbilt University Diamond Lab has fabricated boron-doped diamond resistors on insulating
aluminum nitride substrates.[87] The resistors, patterned via oxygen plasma etching, can be seen
below in Figure 2.12. Ohmic behavior was achieved from these resistors for low to medium
current levels but at higher current levels, increased resistivity was observed due to thermal
excitation from joule heating.[87] Unlike conventional resistors that would fail under such
conditions, diamond’s tolerance to high power allowed for continued operation.[87]

39
Figure 2.12 Scanning electron micrograph of boron doped diamond resistors patterned
via oxygen plasma etching on an aluminum nitride substrate[87]
The diode is yet another solid state device that has been fabricated with diamond. The
large bandgap of diamond limits the intrinsic carrier concentrations to levels less than 1010
cm-3
at
temperature below 1000oC allowing for a large range of stable predictable operating
temperatures.[88] This, combined with diamond’s extremely high break down field of 107 V/cm,
makes it an ideal candidate for use in a diode.[89] A. Aleksov and colleagues constructed such a
diode with boron and nitrogen as the p- and n-type dopants respectively in 2003. This device
exhibited adequate current rectifying properties with no observable reverse bias break down over
the voltages tested (Figure 2.13).[90] Thus, all diamond diodes could be utilized for future
applications which require operation in harsh environments.
40
Figure 2.13 Current-voltage characteristics of an all diamond pn diode with boron and
nitrogen as the n- and p-type dopants respectively.[90]
In addition to the above devices, solid state diamond transistors have also been
fabricated. One example, by M. W. Geis, was a vertical field effect transistor constructed entirely
from homoepitaxial diamond layers with different boron doping concentrations similar to a
MESFET (metal semiconductor field effect transistor).[91] The gate oxide layer for this device
was SiO2. Figure 2.14 shows the fabrication process of Geis’s device while Figure 2.15 shows
the inverse capacitance squared-bias voltage relationship obtained in his study. Examination of
the inverse capacitance squared vs. bias voltage plot revealed a straight line indicating that the
diamond SiO2 interface is extremely well behaved unlike other semiconductors such as
GaAs.[91] The compatibility of diamond with SiO2 could make future all-diamond integrated
circuits easier to fabricate by utilizing existing oxide deposition methods.

41
Figure 2.14 Fabrication of the vertical diamond field effect transistor by M.W. Geis[91]
Figure 2.15 Inverse capacitance squared vs. bias voltage of the diamond field effect
transistor seen in Figure 2.13. The linear relationship implies the diamond-SiO2 interface
is extremely well behaved[91]
42
In 2009, researchers at the University of Glasgow achieved a major milestone in the
advancement of diamond solid-state electronic devices. It was desired to create a transistor able
to operate in the terahertz range for automotive collision detection. Given that the device would
need to be able to operate in harsh environments, diamond was the ideal candidate.[92] This
research led to the creation of a diamond transistor with a gate length of 50nm.[92] Perhaps in
the future, when silicon transistors reach a scale at which they are physically and financially
impractical to fabricate, diamond may step in to fill the void.
2.7.2 Diamond in vacuum microelectronics
In addition to the many solid state applications previously discussed, diamond has also
become of interest in the reemerging field of vacuum microelectronics. Though vacuum devices
were largely replaced by the semiconductor during the 20th
century, recent advancements in
fabrication technologies have led many researchers to reexamine them. Vacuum microelectronic
devices, such as the diode and triode, offer many advantages over their solid-state counterparts.
For example, in a solid state device, the transport of electrons is largely governed by the
semiconducting material’s electronic properties. However, this is not the case in vacuum devices
as the electrons are transported through a vacuum in which the only limiting factor on their
velocity is the speed of light; thus the problems of crystal imperfections that plague the solid-
state industry are alleviated allowing for less burdensome fabrication processes. The ability to
achieve high electron velocities in vacuum microelectronic devices also allows for much higher
frequency switching than traditional solid-state devices.[93]
The vacuum devices of the early 20th
century required large amounts of power as they
utilized thermionic emission to extract electrons from the inefficient cathodes of the day.

43
Thermionic emission from these inefficient cathodes typically involved heating them to
temperatures in excess of 1,500oC in order to achieve usable current which resulted in large
amounts of wasted power. Current vacuum microelectronic devices are substantially more
efficient as they employ the quantum mechanical tunneling process, known as Fowler-Nordheim
emission. This emission process, often referred to as field emission, occurs at room temperature
when the cathode is exposed to high voltages.[94] Field emission typically requires large
electric fields on the order of 10 MV/cm in order to obtain practical current levels. This high
voltage requirement can be overcome by fabricating cathodes resembling needles with very
sharp radii of curvature creating high local fields at the tip. The band bending that is achieved
through the fabrication of cathodes with sharp tips can be seen in the energy band diagrams in
Figure 2.16.
Figure 2.16 (a) Potential energy of an electron U(x) as a function of distance from the
metallic cathode. Here “-eFx” is the externally applied potential, “Up” is the total
potential well depth, and “-e2/4x” is the image potential. (b) Band bending as a function
of the radius of curvature of a tungsten “needle” emitter.[93]

44
Current research at Vanderbilt University is examining diamond as material for vacuum
microelectronic devices with both vertical and lateral configurations. The lateral configuration is
similar to a two dimensional structure in which the cathode, anode, and emission current all exist
in the same plane. Lateral type rectifying diodes created at Vanderbilt consist of several “finger-
like” cathode emitting tips.[95-97] Both the cathode and the anode are patterned from a
nanocrystalline diamond film deposited on an oxidized SOI wafer using SiO2 as the electrical
insulator between the two.[95-97] This patterning can achieve extremely close cathode-anode
spacings leading to “turn on” fields as low as 5V.[98] A scanning electron micrograph and
current-voltage plots of these devices can be seen in Figure 2.17.
Figure 2.17 (a) Scanning electron micrograph of the lateral diamond microelectronic
diode. The cathode and anode are both patterned out of a single uniformly deposited
nanocrytalline diamond film and isolated by SiO2. (b) Current-voltage characteristics of
the device in (a) which is able to achieve a “turn-on” voltage of 5V.[98]
As earlier mentioned, research at Vanderbilt is also examining diamond vacuum devices
with a vertical configuration. These devices consist of three dimensional pyramid arrays with

45
each pyramid having an extremely sharp radius of curvature on the order of 5nm.[99] In Figure
2.18, the complex fabrication process of these pyramids for use as vacuum diodes can be seen.
Figure 2.18 Left: Fabrication process for diamond pyramidal cold cathodes. Right: SEM
image of fabricated emitters[99-102]
Perhaps the most interesting application of these pyramidal diamond emitters is for use in
vacuum triodes with transistor-like behavior consisting of three electrodes: a cathode, an anode,
and a gate. The gate is biased positively and positioned close to the anode and is meant to extract
electrons from the cathode tip to be collected by the anode. The incorporation of a gate allows
for smaller anode voltages, creating a more practical device. The first device of this type, known
as the “Spindt cathode,” was fabricated in 1968 for use in field emitter displays.[93] The
diamond triodes fabricated at Vanderbilt are similar to the Spindt cathode. Diamond is the
emitter in the Vanderbilt devices, while the gate is fabricated out of silicon (Figure 2.19). Such
devices are able to obtain exceptionally high amplification factors (change of anode voltage over

46
change in gate voltage) on the order of 250 with the gate biased at only 20 V.[98] There is
currently very little research outside of Vanderbilt on the topic of diamond vacuum
micro/nanoelectronic devices but the several advantages this technology has over current solid
state devices could result in its utilization in numerous future applications.
Figure 2.19 (a) Scanning electron micrograph of the diamond triode vacuum
microelectronic device. The cathode here is a diamond pyramid with a tip radius of
curvature on the order of 5 nm and the gate is silicon. SiO2 is used to insulate the gate
from the cathode. (b) Anode current-voltage behavior of the diamond triode device at
different gate voltages. With the gate biased at 20V, an amplification factor of 250 was
achieved[98]
2.7.3 Use of diamond in thermionic energy converters
Given that the focus of this research is to examine the use of diamond as an electrode
material for thermionic energy conversion, it is only fitting that previous research on this topic is
discussed. The exploration of diamond as a vacuum field emitter has gone hand in hand with
investigations into its thermionic emission properties. Several research groups, including the
Vanderbilt Diamond Lab, have shown diamond to be an outstanding thermionic emitter.[103,

47
104] The wide bandgap nature of diamond requires it to be “doped” with other species to obtain
its superior electronic properties. One such study, by R. J. Nemanich at Arizona State University
in 2009, deposited ultra nanocrystalline diamond films on a metallic substrate via MPCVD to
observe the thermionic emission current as a function of temperature.[105] Analysis of the
emission current vs. temperature behavior with respect to the Richardson equation revealed
nitrogen-incorporated ultra nanocrystalline diamond to have a work function of 1.29 eV and
Richardson constant of 0.84 Acm-2
K-2
.[105] The thermionic emission current vs. temperature
plot from this study can be seen below in Figure 2.20. These results were verified by M. Suzuki
and colleagues on similar nitrogen incorporated nanocrystalline diamond films.[74]
Figure 2.20 Thermionic emission current vs. cathode temperature of a nitrogen-
incorporated ultra-nanocrystalline diamond films by R. J. Nemanich[105]

48
A follow-up study by Nemanich studied the thermionic emission from phosphorus doped
diamond films on molybdenum substrates. As Section 2.5.2 outlines, phosphorus acts as a true n-
type dopant in diamond films with a relatively shallow donor level of 0.6 eV below the
conduction band.[36] Thermionic emission testing, performed in the same manner as
Nemanich’s previously discussed experiment, established that phosphorus-doped diamond films
possess a work function and Richardson constant of 1.18 eV and 0.003 A/cm2K
2,
respectively.[106] Though the phosphorus-doped diamond films had a much lower work
function than the nitrogen-incorporated diamond films, the phosphorus-diamond samples were
not able to achieve thermionic emission current levels as high as the nitrogen-diamond samples.
This is due to the extremely low Richardson constant demonstrating that an efficient thermionic
emitter must have both a low work function and a high Richardson constant.
These findings implicate diamond as an efficient electron emitter for thermionic
applications such as thermionic energy conversion. Implementation of diamond into such devices
has been hindered due to its relatively low temperature ceiling around 750oC. All known studies,
including those performed at Vanderbilt, have observed that the emission current begins to
deviate from the equations governing thermionic emission in that it decreases with temperature
rather than continuing to increase exponentially.[74-76] This has often been attributed to
hydrogen desorption which was discussed in more detail in Section 2.6.3. Little research has
been performed to fully understand this mechanism so that diamond based thermionic emitters
can operate at higher temperatures allowing for higher current levels to be achieved.
Accordingly, a better understanding of this mechanism is one of the primary objectives of the
present research.

49
CHAPTER III
THERMIONIC ENERGY CONVERSION
3.1 Thermionic emission
Thermionic emission is a core component of the present research. As previously
mentioned, this phenomenon occurs when thermal energy is imparted to a cathode causing the
emission of electrons. The fundamental equation describing this process is known as the
Richardson equation and is represented in Equation 3.1.
⁄ (3.1)
where J: Cathode thermionic emission current density (A/cm2); A: Cathode Richardson constant
(A/cm2K
2); T: Cathode temperature (K); Φ: Cathode work function (eV); and k: the Boltzmann
Constant (8.617 x 10⁻⁵
eV/K).[22]
This equation is based on thermodynamic and quantum mechanical principles and is the
accepted equation for electron current flow at a boundary over a certain potential barrier. For
thermionic emission, this potential barrier is known as the material’s work function. In addition
to the work function, the Richardson constant is the other material specific parameter in Equation
3.1 which was first derived by Dushman using quantum theory for an ideal metallic emitter to be
120 A/cm2K
2.[107]
A common misconception amongst researchers is that the values of “A” and “Φ” are
constant for a certain material. In reality, there are numerous factors that must be taken into
account which cause these values to have large variability. The following section seeks to
provide a detailed understanding of this process by deriving the Richardson equation.

50
3.1.1 Richardson equation derivation
Though the Richardson equation (Eq. 3.1) appears simple and straightforward at first
glance, its derivation is somewhat complex. Derivation of this fundamental equation is necessary
in order to fully grasp the concepts explored in this research. The derivation presented below
does not follow O.W. Richardson’s original paper in which his namesake equation was originally
presented as he did not initially derive a value for the Richardson constant.[22, 108] It was not
until later that S. Dushman quantified this value (though he did not account for the two possible
spin states of an electron thus he was off by a factor of two).[107] In order to maintain a constant
use of variables, the following derivation follows a manuscript by W.B. Nottingham titled
“Thermionic Emission” unless otherwise stated .[109]
To begin this derivation of the Richardson equation, three fundamental assumptions must
first be made regarding electrons in a material.
1. Inter-electronic forces are neglected. This provides that electrons behave as
particles with three degrees of freedom described by a six-dimensional phase
space (three coordinates and three momentum components)
2. An extension in phase space of h3 is required for each quantum state
3. The Pauli Exclusion Principal must be accounted for which limits the number of
electrons in a given quantum state to two (each with opposite spin)[110]
With these three assumptions in place, the derivation can begin. An expression must first
be made to describe the maximum likelihood of occurrence distribution of electrons in phase
space that is consistent with basic principles of thermodynamics. This equation must account for
the total number of quantum states for a certain system and the two possible spin states of an
electron in each quantum state described by the Pauli Exclusion Principal.[110] Additionally, as

51
we are dealing with electrons, a statistical equation to describe the probability distribution of
electrons in the system should be included which is represented by the Fermi function.
Accounting for these parameters, a maximum likelihood function can be expressed as follows:
⟨ ⟩
⌈
⌉ (3.2)
where ε: electron energy; μ: chemical potential; h: Plank’s constant; k: Boltzmann constant; T:
Temperature; and x, y, z, px, py, pz: the spatial and momentum coordinates, respectively.
The “ε” in Equation 3.2 represents energy and can generally be separated into two terms,
kinetic and potential. The concentration of electrons is contained in the “μ” term, also referred to
as the Fermi Level, and is a function of temperature. The coordinate and momentum grouping
divided by h3 seen in the right-hand side of Equation 3.2 represents the number of quantum states
in this extension and the double occupancy is accounted for in the factor of 2 in front
(Assumption 3). Finally, the bracket term in the right-side of the equation (the Fermi function) is
the probability distribution function of a certain quantum state at energy, ε, being occupied.
A very useful equation for electron transport calculations can be derived from Equation
3.2 known as the “Electron Flow Equation” and can be seen in Equations 3.3 and 3.4.
( ) ( )
(
) (3.3)
and
(3.4)
where N(εx): number of electrons at an energy εx; m: electron mass; and h, μ, k, T, and px: the
same as defined for Equation 3.2.
The Electron Flow Equation (EFE) described in Equations 3.3-4 represents the number of
electrons that cross a unit area in unit time with kinetic energy associated with the positive x
direction of motion over a certain energy range. In other words, the EFE allows for the number

52
of electrons crossing a boundary perpendicular to the x direction to be computed. With the EFE
in place, an equation of electron current can be formulated.
The derivation continues with inspection of the “Pillbox Problem”, which represents a
rectangular cavity positioned inside a homogenous single crystal with every region at a constant
uniform temperature. This special scenario allows for exact calculation of the random currents
arising at the boundaries. For simplicity, space charge effects will be neglected but will be
discussed in later sections. An energy diagram of the “Pillbox Problem” is graphically shown
below in Figure 3.1.
Figure 3.1 Energy diagram of “pillbox” problem. The region from “a” to “b” represents a
cavity inside a homogenous crystalline material. The entire material and the cavity are
said to be at a constant uniform temperature. This diagram neglects space charge effects
and assumes that the distance “x” is large enough such that image potential can also be
neglected.
Figure 3.1 represents the potential energy of an electron as function of distance as it
travels from “A” to “B.” The region from “A” to “a” is the potential in the homogeneous crystal
and is assumed to be uniform. The region from “a” to “b” is the empty cavity region that the

53
electron must traverse and has a potential defined as Wa. As previously noted, space charge is
neglected leaving the dominant force acting on an electron to be the image potential it leaves
behind as it departs the surface. To simplify this case, calculations will be made for the distance
“x” being greater than 10-5
cm, which reduces the image potential to levels that can be neglected.
The EFE can now be used to calculate the number of electrons approaching the interface
at “a” with energies between εx and εx+ d εx. In the absence of any temperature or electric field
gradients, the electron flow must exist in steady-state (thus net flow equal to 0) implying the
current traveling from the left across “a” must equal the current traveling from the right across
“a”. The Fermi level in the crystal “Ef” is located at μs which is referenced here as positive. The
thermal equilibrium condition previously noted allows for the Fermi levels on either side of the
cavity to be at the same energy thus aligned. Using the EFE, the equations for the electron
currents in both directions can be written as:
( )
(
) (3.5)
( )
( ) (3.6)
where Nx,s: electrons flowing from the surface across “a” and Nx,c: electrons flowing from the
cavity across “a”.
The steady-state electron flow provides that Equations 3.5 and 3.6 must be equal
allowing for Equation 3.7 to be realized.
(3.7)
The work function seen in the Richardson equation of the crystal can then be defined
upon inspection of Equation 3.7 and is represented in Equation 3.8.
(3.8)

54
Finally, the Richardson equation can be seen by integrating Equation 3.5 with respect to
εx using limits of integration from Wa to ∞ and using the definition of work function from
Equation 3.8 to arrive at the total electron current that crosses the boundary at “a” from the
surface.
(3.9)
with the Richardson constant A defined as:
⁄ (3.10)
Though, the above derivation proves fairly straight forward, it must be kept in mind that,
at the time the Richardson equation was developed, the physics community was just beginning to
fully understand the structure of the atom. This perhaps explains why so many years passed
between the time Edison first noted his observations of the electron current arising from his light
bulb filaments in the 1880’s and when it was described by Richardson and Dushman in the early
1900’s.[3, 22, 107, 108]
3.2 Thermionic energy conversion
With an understanding of thermionic emission in place, applications in which it can be
utilized can now be discussed. This section seeks to describe in detail one such application,
thermionic energy conversion. There are several possible ways to conceptualize a thermionic
energy converter. One possible conceptualization was presented by R.S. Rasor describing a
thermionic energy converter as a thermodynamic heat engine cycle similar to a modified
Rankine cycle.[111] All heat engines require a working fluid which Rasor portrays as electrons.
The function of the cathode in such a heat engine is to act as an “electron boiler” whiles the
anode functions as the electron condenser. These two components result in an electric pressure
55
(i.e. voltage) difference to produce work. The difference between the heat of vaporization of the
electrons from the emitter and the heat of condensation of the electrons into the collector directly
equals the amount of electrical work produced per electron.[111]
In a more general description, a thermionic energy converter consists of three
components: a cathode, an anode, and the necessary electrical connections between the two. In a
basic thermionic converter, the cathode and anode are separated by a vacuum gap. There exist
other configurations that incorporate gaseous species into this gap to improve performance and
will be discussed later. As thermal energy is imparted to the cathode, electrons with sufficient
energy will thermionically emit from the surface and accelerate through the vacuum gap where
they collect at the anode. The electrons then drive a load as they are cycled back to the cathode
through the electrical connections. Though conceptually simple, there are several factors that
must be considered for an efficient device to be realized.
From the above description, a cathode must be chosen with superior thermionic emission
abilities for use in a thermionic energy converter. Referencing the Richardson equation, this can
be accomplished by having a low work function with a high Richardson constant. Electrons
leaving the cathode must then experience an electromotive force (EMF) to be accelerated
through the vacuum gap. This EMF arises from the work function difference between the
cathode and anode thus requiring an anode with a lower work function than the cathode. As
thermionic emission from the anode must also be accounted for, an anode must be chosen that
acts as a poor thermionic emitter implying a material with a high work function and low
Richardson constant be selected. It can then be seen that two conflicting requirements have been
presented: it is desired to have an anode with a high work function to prevent reverse electron
emission yet the anode must have a lower work function than the cathode to create an EMF to

56
accelerate the electrons across the vacuum gap. G. Medicus and G. Wehner were the first to note
these requirements in 1951.[112] Indeed, these conflicts have proven to be a major design hurdle
for the construction of an efficient thermionic energy converter.
3.3 Thermionic energy converter design considerations
The criteria that must be accounted for when constructing an efficient thermionic energy
converter will now be further elaborated upon. As previously mentioned, a basic thermionic
converter consists of a cathode and an anode separated by a vacuum gap. In the absence of an
applied electric field, the only potential driving electrons through the gap is the work function
difference between the cathode and the anode. As small cathode-anode separation distances are
typically difficult to achieve, the resulting field is often small, permitting the creation of a space
charge region immediately in front of the cathode. P.M. Marchuk first presented an alternate
method of mitigating this space charge by incorporating an ionizing vapor into the vacuum gap
and will be discussed in detail later.[113] The presence of this space charge region requires
electrons to have higher energies than simply the work function in order to be emitted. A band
diagram from a study by J. Ingold, presented in Figure 3.2, helps to clarify this.[21]
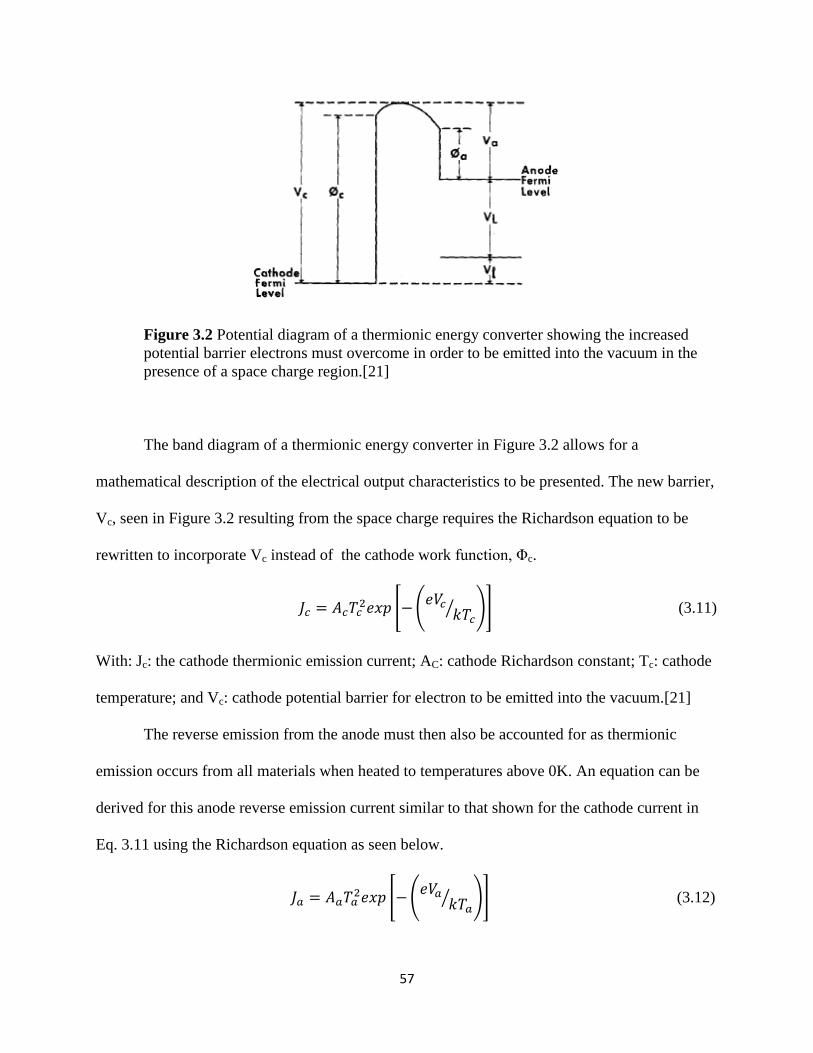
57
Figure 3.2 Potential diagram of a thermionic energy converter showing the increased
potential barrier electrons must overcome in order to be emitted into the vacuum in the
presence of a space charge region.[21]
The band diagram of a thermionic energy converter in Figure 3.2 allows for a
mathematical description of the electrical output characteristics to be presented. The new barrier,
Vc, seen in Figure 3.2 resulting from the space charge requires the Richardson equation to be
rewritten to incorporate Vc instead of the cathode work function, Φc.
[ (
⁄ )] (3.11)
With: Jc: the cathode thermionic emission current; AC: cathode Richardson constant; Tc: cathode
temperature; and Vc: cathode potential barrier for electron to be emitted into the vacuum.[21]
The reverse emission from the anode must then also be accounted for as thermionic
emission occurs from all materials when heated to temperatures above 0K. An equation can be
derived for this anode reverse emission current similar to that shown for the cathode current in
Eq. 3.11 using the Richardson equation as seen below.
[ (
⁄ )] (3.12)

58
Where Ja, Aa, Ta, and Va are defined in the same manner as Equation 3.11 but with respect to the
anode.[21]
To derive the theoretical efficiency and power output capabilities of a thermionic energy
converter it must be assumed that the device is in steady state. That is, the heat input from the
cathode equals the heat loss from the cathode. The heat loss from the cathode is dominated by
three mechanisms: 1) Cooling from the electron emission: Pe; 2) Radiated heat loss from the
cathode: Pr; and 3) Heat conducted away from the cathode through the electrical connections: Pl.
Equations for these three terms (assuming the reverse emission from the anode is negligible)
were derived by J. H. Ingold in 1961 and can be seen below in Equations 3.13-15 with
descriptions of the variables presented in Table 3.1.[21]
( ) (3.13)
( ⁄ ) (
) (3.14)
( ⁄ )( ⁄ )( ⁄ )( )
(
⁄ ) (3.15)
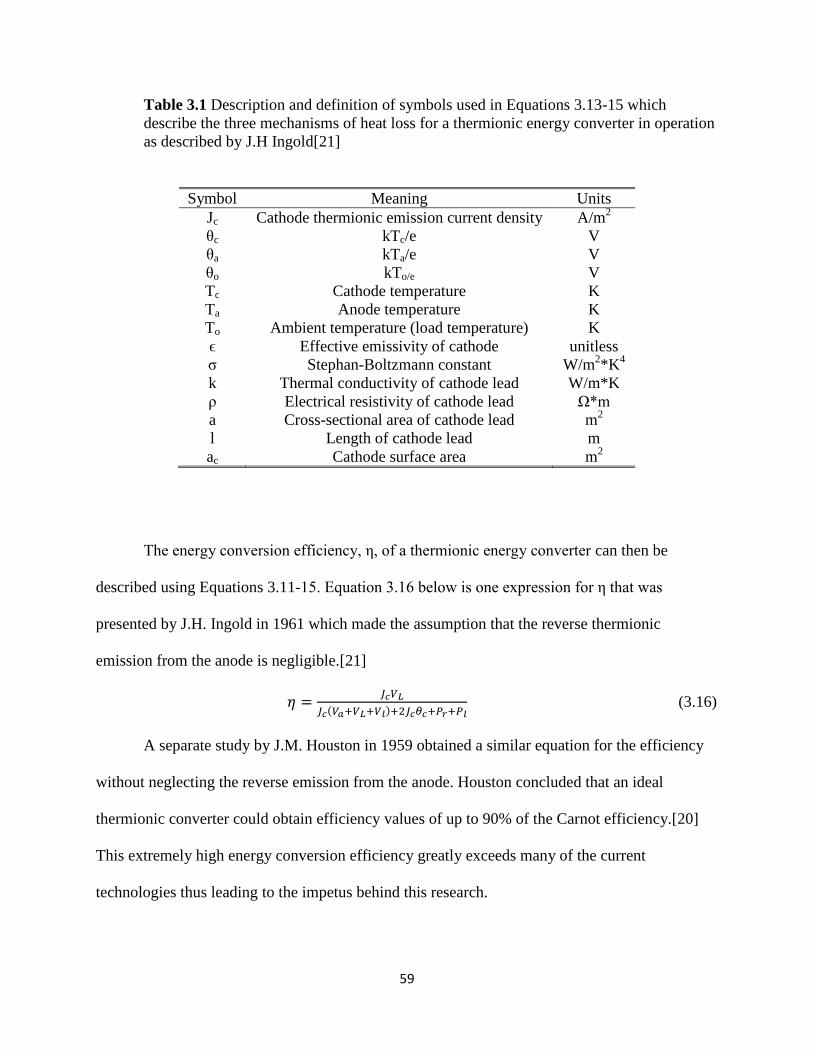
59
Table 3.1 Description and definition of symbols used in Equations 3.13-15 which
describe the three mechanisms of heat loss for a thermionic energy converter in operation
as described by J.H Ingold[21]
Symbol Meaning Units
Jc Cathode thermionic emission current density A/m2
θc kTc/e V
θa kTa/e V
θo kTo/e V
Tc Cathode temperature K
Ta Anode temperature K
To Ambient temperature (load temperature) K
ϵ Effective emissivity of cathode unitless
σ Stephan-Boltzmann constant W/m2*K
4
k Thermal conductivity of cathode lead W/m*K
ρ Electrical resistivity of cathode lead Ω*m
a Cross-sectional area of cathode lead m2
l Length of cathode lead m
ac Cathode surface area m2
The energy conversion efficiency, η, of a thermionic energy converter can then be
described using Equations 3.11-15. Equation 3.16 below is one expression for η that was
presented by J.H. Ingold in 1961 which made the assumption that the reverse thermionic
emission from the anode is negligible.[21]
( ) (3.16)
A separate study by J.M. Houston in 1959 obtained a similar equation for the efficiency
without neglecting the reverse emission from the anode. Houston concluded that an ideal
thermionic converter could obtain efficiency values of up to 90% of the Carnot efficiency.[20]
This extremely high energy conversion efficiency greatly exceeds many of the current
technologies thus leading to the impetus behind this research.
60
3.4 Production thermionic energy converters
Thermionic energy conversion (TEC) is not a new concept. During the early to middle
20th
century both the USA and USSR began intensive research on this technology driven by the
need for compact, reliable, efficient energy conversion methods for space applications. The
design configuration pursued by both countries is known as the “in-pile thermionic
generator.”[111, 114] This configuration utilized the same cylindrical fuel rods used in other
nuclear reactor technologies but employed the cladding around the fuel rod to act as a cathode.
The anode was positioned around the cathode separated by cesium-vapor filled gap cooled by the
reactor’s liquid metal coolant. Another typical variation used for space application consisted of
heating the cathode by the reactor’s liquid metal coolant and using the coldness of space as a
heat sink for the anode.[115]
The first practical TEC device, demonstrated by P.M. Marchuk in the USSR in 1956,
incorporated a cesium vapor into the vacuum gap to mitigate space charge effects.[113, 114]
Although the United States later followed, they eventually abandoned this research for space
applications while the USSR continued to make advancements.[114] Between 1970 and 1984,
the USSR designed and implemented two TOPAZ type in-pile reactor units to power the
COSMOS satellite. The next generation generator, TOPAZ-II, was developed for future missions
to Mars but was never implemented as interested in these missions faded.[115] Regardless, the
Soviet TOPAZ reactors were able to achieve impressive power generation capabilities. A typical
TOPAZ reactor required only around 11 kg of Uranium235
and was able to output 5kW of power
from the 150kW of thermal power generated from the nuclear source.[116] As of 2000, the
Russian Federal space agency that emerged after the fall of the Soviet Union had resumed

61
research on TOPAZ type reactors for deep space mission that could deliver tens to hundreds of
kilowatts for periods of up to 10 years.[116]
Radionuclide thermionic generators were another implementation of thermionic energy
conversion that gained interest during the middle part of the 20th
century. The isomite battery is
one such example of a radionuclide thermionic generator developed by McDonnel Douglas Co.
These fairly small cells, measuring up to 3 cm in height and diameter, operated at relatively low
cathode temperatures leading to poor efficiencies of less than 1%. These low efficiencies
combined with the relatively low output power (1-20mW) led to the eventual abandonment of
this technology.[115]
3.5 Current thermionic cathodes
As seen from the Richardson equation, virtually any material can theoretically function as
a thermionic cathode but certain materials exhibit much higher thermionic emission performance
than others. It has been previously stated that materials with low work functions and high
Richardson constants are the most desired for thermionic applications. The remaining part of this
chapter is devoted to discussing a few of the current technologies in use today.
3.5.1 Metallic cathodes
Typical metallic thermionic emitters utilize metals such as tungsten, tantalum, and
rhenium. The high work function of these materials often requires high operating temperatures in
order to achieve the desired current levels. High temperatures can be advantageous in certain
circumstances as they allow for electronegative contaminating gases to rapidly evaporate
allowing such cathodes to operate in relatively poor vacuum conditions. This property explains

62
why metallic materials are often chosen for use in ionization gauges for pressure
measurement.[117]
Early thermionic applications often utilized bare tungsten emitters; however, the high
temperatures required for such cathodes to achieve practical current densities often resulted in
immense power requirements and created several engineering challenges. Given these reasons,
the use of bare tungsten cathodes was abandoned for use in the vast majority of thermionic
applications in favor of other, better performing materials. Surprisingly, it was later found that by
contaminating a tungsten cathode with electropositive elements such as thorium and cesium, the
work function could be lowered, allowing for increased thermionic emission currents at lower
temperatures than with pure tungsten.[118, 119] Table 3.2, reproduced from a review paper by
R. O. Jenkins, compares the various tungsten contaminants with respect to the work function.
Table 3.2 Comparison of tungsten surface contaminant on the work function[119]
Surface Contaminant Work Function (eV)
Clean 4.54
Ce 2.7
Th 2.7
Ba 1.6
Cs 1.5
As can be seen in Table 3.2, extremely low work functions can be achieved by
contaminating a tungsten emitter. However, the surface contaminant usually evaporates when the
cathode is heated to operating temperatures, thus requiring the contaminant to be constantly
replenished.[119]This constraint limits the applicability of this type of cathode with a few
exceptions. For example, several practical implementations of thermionic energy converters

63
utilize cesium coated tungsten cathodes in which the problem of contaminant evaporation is
solved by the incorporation of cesium vapor into the vacuum gap. This not only provides a
means to replenish the evaporated cesium but also mitigates the space charge problem previously
discussed.[114]
3.5.2 Oxide coated cathodes
In 1904, A. Wehnelt made the discovery that the introduction of an oxide layer on a
metallic emitter could greatly enhance the thermionic emission current. In his experiment,
Wehnelt coated platinum cathodes with various oxides. He found that oxide coatings composed
of rare-earth metals such as barium, strontium, and calcium allowed for large increases in
thermionic emission current at comparatively low temperatures.[120] It is now known that these
observations were due to the extremely low work functions of the oxide cathodes. Table 3.3
shows the work function and Richardson constant of a few commonly used oxides.
Table 3.3 Comparison of the work function values and Richardson constant values of
some commonly use thermionic cathode oxide coatings[120]
Oxide Composition Φ (eV) A (Amps/cm2K
2)
CaO 1.77 129 - 249
SrO 1.27 4.07 - 258
BaO 0.99 2.88 - 272
CaO + SrO + BaO 1.24 0.0083
Though oxide coated cathodes exhibit the desired low work functions and high
Richardson constants, attempts to extract more than ~1 A/cm2 dc current can cause rapid
degradation of the oxide coating. Due to this, oxide coated cathodes are most commonly used in
low power dc or short pulse high power devices.[119]

64
3.5.3 Lanthanum Hexaboride cathodes
Lanthanum hexaboride (LaB6) has become a widely used cathode for precision and state-
of-the-art applications. LaB6 cathodes have the advantage of long operating lifetime, low work
function, and chemical stability at high operating temperatures over other cathodes.[121]
Despite these advantages, the high cost (arising from complex fabrication processes) has limited
the use of LaB6 to high-end applications such as electron microscopy.[122]
3.6 Overview
The topics discussed in the chapter are meant to provide the reader with at least a basic
knowledge of thermionic emission and its application in energy conversion so that the research
presented in the following sections can be better understood. The vast potential of thermionic
energy conversion technology has been outlined such that the motivation of this research can be
appreciated. Though diamond was not examined explicitly in this chapter, the discussions
presented in Chapter II should allow the conclusion to be reached that diamond is perhaps the
most promising material for the creation of a practical thermionic energy converter. The research
presented in the following chapters seeks to further the understanding of diamond for this
purpose.

65
CHAPTER IV
PROPOSED RESEARCH AND APPROACH
The purpose of this research is to study diamond cathodes for use in thermionic emission
applications by exploring various methods to increase the emission current output, stability, and
operational lifetime. This has been achieved by directing research into two main areas. The first
area investigates methods to modify the diamond cathodes to achieve higher emission current
levels at lower temperatures than typical as-grown diamond cathodes. This part of the research
deals with the study, development, and characterization of various hydrogen (and deuterium)
plasma exposures to diamond samples which is thought to beneficially enhance their thermionic
emission properties but has never been quantitatively examined in detail. The second part of the
research investigates operational environment as a means to increase the performance of
diamond cathodes. This is accomplished by observing the response of thermionic emission
current to the introduction of various low pressure gaseous species. The following section
summarizes the significance of this research and presents the approach used to achieve these
goals.
4.1 Introduction to the proposed research
Thermionic energy conversion (TEC) drew a great of deal attention during the mid-20th
century as an efficient means of directly converting thermal energy into electrical energy.[20, 21,
111, 114, 123] However, due to material limitations of the day, the vast potential of this
technology was never reached. TEC is based on the widely understood physical principal of
thermionic emission which describes the thermal emission of electrons from a heated cathode.

66
As a cathode is heated above zero Kelvin, it can be predicted, based on Fermi-Dirac statistics,
that some of the cathode’s electrons will have energies equal to or greater than the cathode’s
work function. The work function is the energy required for an electron to be emitted into the
vacuum. This process can be described by the Richardson equation (Equation 4.1).[22, 109]
⁄ (4.1)
Where: J: Current Density (A/cm2); A: Richardson Constant (A/cm
2K
2); T: Temperature (K); Φ:
work function (eV); and k: Boltzmann constant (8.617 x 10⁻⁵
eV/K). It follows from the
Richardson equation that high thermionic emission current densities can be achieved from a
material with a high Richardson constant and a low work function.
As mentioned earlier, the idea of utilizing this phenomenon for energy conversion is not
new. During the mid-20th
century, a great deal of research went into thermionic energy
converters in an attempt to achieve an efficient means of converting thermal energy into
electricity with limited success. Some approaches did achieve useful output currents of ~ 20
A/cm2 at an output voltage of between 0.5V to 1.5V and operated continuously for 5 or more
years.[111, 114] Unfortunately these devices were handicapped by low operational efficiencies
(~20%) due to material limitations leading many researchers to de-emphasize thermionic
converters in favor of other conversion techniques. At the time of this technology’s peak
interests, the best available materials had work functions between 4 - 5 eV which corresponds to
useable current densities only at temperatures exceeding 2000 °C. Although effective work
functions could be lowered (e.g. by modifying the surface with cesium) these adsorbate
techniques typically do not hold up to high fields or long operation times. Also, the thermal
sources required for the very high operation temperatures of past TEC devices (e.g., nuclear

67
pile), limited this technology to unmanned space operations due to safety considerations.[111,
114]
The preceding sections have presented a detailed background for the proposed research
that will now be discussed. The objective of this research is to explore means to increase the
thermionic emission performance of diamond cathodes for use in thermionic applications. The
primary motivation for this research lies in TEC which has the capability to revolutionize today’s
energy climate by providing one of the most efficient methods of converting thermal energy
directly into electrical energy.[20, 21] Studies have shown that this technology can approach
total energy conversion efficiencies of 90% of the Carnot limit, which is a vast improvement
over current technologies.[20, 21] Impacts of this research could potentially stem beyond TEC
into other applications that utilize thermionic emission including fluorescent lighting, electron
microscopy, and cathode ray tube (CRT) displays, among others. The following sections outline
the tasks performed to accomplish the goals of this research.
4.2 Fabrication of nitrogen-incorporated diamond thermionic cathodes
The proposed research seeks to utilize diamond as the cathode material in a thermionic
energy converter. Intrinsic single crystalline diamond is an extremely poor electrical conductor
with a large bandgap of 5.5eV making it an unsuitable candidate for electronic applications such
as thermionic emission.[50] The electronic properties of diamond can be improved through the
incorporation of certain impurities into the diamond lattice.[36, 56, 58] Further, the use of
polycrystalline diamond has been shown to have enhanced electron transport over single
crystalline diamond.[124] Previous work examining polycrystalline, p-type, boron-doped,
diamond films revealed this type of diamond to be a reliable thermionic electron emitter that

68
closely followed the Richardson equation. However, the emission current at temperatures up to
and exceeding 1,100oC was too low to prove useful in most thermionic applications.[125] In
order to extract more current at lower operating temperatures, this research employs diamonds
with n-type semiconducting behavior.
Figure 4.1 Thermionic emission results from previous work on a boron-doped
polycrystalline diamond film. It can be seen by the solid line that the emission current
data (points) followed closely with the Richardson equation. Thermionic emission current
obtained from this sample was too low to be practical due to the high work function of
4.43 eV.[125]
As discussed in Section 2.5, diamond suffers from an asymmetrical doping complex in
that n-type behavior is much more difficult to achieve than p-type behavior.[36] Among the
possible n-type dopants, sulfur, phosphorus, and nitrogen have garnered the most attention.
Successful incorporation of sulfur and phosphorus into the diamond lattice has been achieved
allowing diamond to behave as a traditional n-type semiconductor while attempts to use nitrogen
have proven more complex.[36, 58] Though nitrogen readily incorporates into the diamond
69
lattice during fabrication, its deep donor level positioned 1.7eV below the conduction band
would typically imply that impractically high temperatures would be required to activate the
nitrogen dopants to achieve n-type behavior.[59, 60] Still, studies have demonstrated that
nitrogen-incorporated diamond can indeed act as a typical semiconductor. It is believed that the
incorporation of nitrogen promotes defect induced energy bands within the bandgap allowing for
conduction band carrier “hopping” which increases electron transport with n-type behavior.[60]
The present research will use nitrogen as the incorporated species in the diamond
thermionic cathodes for several reasons with the primary reason being deposition concerns. It
was mentioned in Section 2.6 that many widely used techniques to dope typical semiconductors
are not favorable with diamond. The most successful and widely used method for doping
diamond is through the incorporation of dopant gases into the chamber during deposition. The
gas species often used for n-type doping, phosphorus and sulfur (in the form of phosphine and
hydrogen sulfide respectively), are both extremely toxic gasses. Conversely, the incorporation of
nitrogen requires only the use of N2 gas which is nontoxic at the amounts used during chemical
vapor deposition. Further, a substantially larger portion of previously reported work has
examined nitrogen as it is the primary defect found in naturally occurring diamond.[126, 127]
A suitable method has been identified for the fabrication of nitrogen-incorporated
diamond samples using Microwave Plasma-enhance Chemical Vapor Deposition (MPCVD). In
this method, the plasma is maintained with hydrogen while methane is fed in as the carbon
source. Dry nitrogen gas is also fed into the chamber in order to make the films nitrogen-
incorporated. As previous studies have demonstrated that graphite has a relatively high work
function, it is desired to deposit samples with minimal graphitic content.[128] This can
accomplished by depositing the films in a “methane starved” environment which has been shown

70
to drastically reduce carbonaceous content other than diamond.[27, 37]The quality of the films
can then be assessed by means of Raman spectroscopy and scanning electron microscopy.
4.3 Characterization of the thermionic emission from diamond films
Multiple methods have been used in the past to characterize a material’s thermionic
emission properties. A common method is through the use of an electron energy analyzer which
provides a spectrum of electrons emitted from the sample.[129] Electron emission can be
stimulated by either thermal energy causing thermionic emission or electromagnetic energy
causing photo emission. By analyzing the spectrum of the emitted electrons, a detailed analysis
of the range of emitted electron energies can be made allowing for highly accurate work function
values to be calculated from the tested sample.[129] Unfortunately, these described methods
using electron energy analyzers have several disadvantages. They are not able to determine the
sample’s total output current as a function of temperature which prevents calculation of the
sample’s Richardson constant. Additionally, electron energy analyzers, for thermionic emission
tests, only allow for measurements to be taken at a single temperature at a time.
Other more practical methods use simpler setups consisting of a heated cathode and
positively biased anode separated by some known distance in a vacuum. Infrared radiation is
often used in such testing apparatuses as it is a non-contact method and can achieve relatively
high temperatures.[74, 105] Being a non-contact method is advantageous as it does not introduce
another circuit into the testing configuration allowing for typical low-side current monitoring and
simple temperature measurements using a thermocouple. This type of testing configuration is
graphically depicted in Figure 4.2.
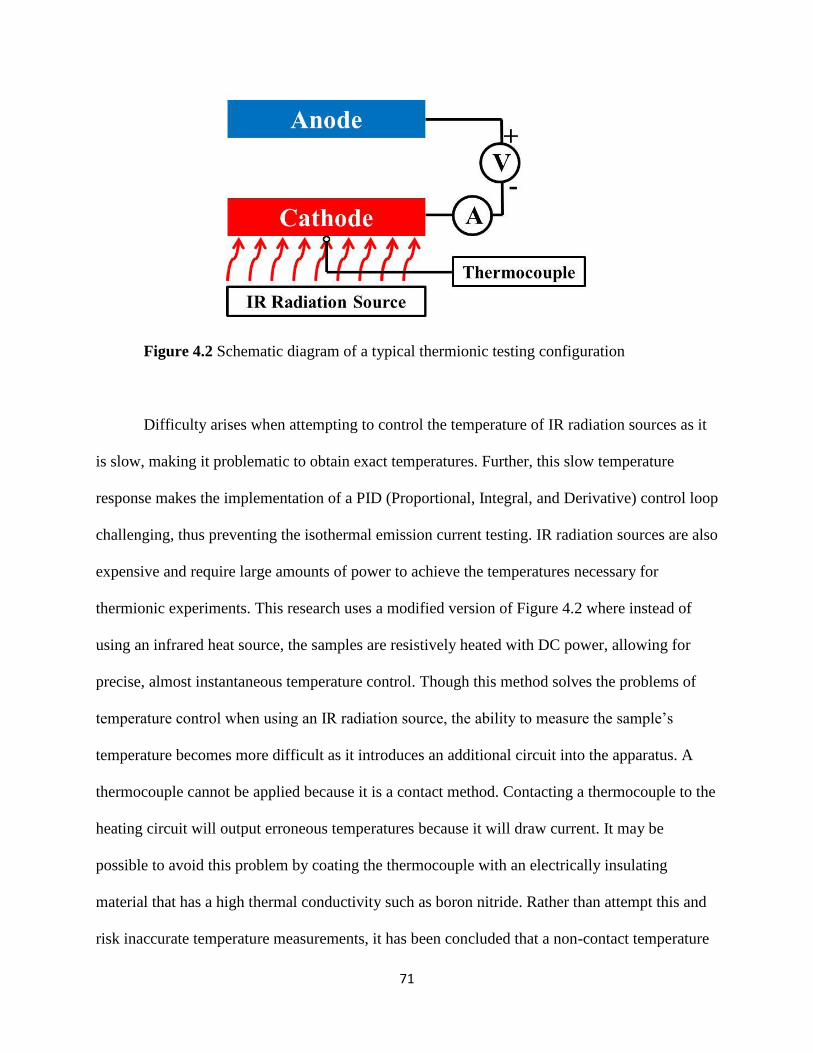
71
Figure 4.2 Schematic diagram of a typical thermionic testing configuration
Difficulty arises when attempting to control the temperature of IR radiation sources as it
is slow, making it problematic to obtain exact temperatures. Further, this slow temperature
response makes the implementation of a PID (Proportional, Integral, and Derivative) control loop
challenging, thus preventing the isothermal emission current testing. IR radiation sources are also
expensive and require large amounts of power to achieve the temperatures necessary for
thermionic experiments. This research uses a modified version of Figure 4.2 where instead of
using an infrared heat source, the samples are resistively heated with DC power, allowing for
precise, almost instantaneous temperature control. Though this method solves the problems of
temperature control when using an IR radiation source, the ability to measure the sample’s
temperature becomes more difficult as it introduces an additional circuit into the apparatus. A
thermocouple cannot be applied because it is a contact method. Contacting a thermocouple to the
heating circuit will output erroneous temperatures because it will draw current. It may be
possible to avoid this problem by coating the thermocouple with an electrically insulating
material that has a high thermal conductivity such as boron nitride. Rather than attempt this and
risk inaccurate temperature measurements, it has been concluded that a non-contact temperature

72
monitoring method such as a pyrometer should be used. The exact testing apparatus will be
discussed in detail in the following chapter.
4.4 Investigation of hydrogen’s influence on thermionic emission
As discussed in detail Chapter II, hydrogen is responsible for many of the enhanced
electronic properties of diamond. It has been widely documented that hydrogenated diamond
films exhibit extremely low to negative electron affinities.[67, 68, 73] Additionally, hydrogen
drastically increases the electron transport in the bulk of the diamond leading to low
resistivities.[65] Both of these effects have the potential to enhance the thermionic emission
capabilities of diamond films. Though many studies have seen hydrogen enhance the thermionic
emission from diamond films, no detailed studies have been made linking the two. This research
examines the hydrogenation process of diamond films in an effort to provide a better
understanding of the mechanism and its effects. This research performs the most detailed study
to date on the topic of hydrogen’s influence on the thermionic emission from diamond films.
Diamond films were deposited via MPCVD in a hydrogen-rich environment as
mentioned above. The as-grown diamond samples were then tested to observe their thermionic
emission properties. The samples were subsequently taken to temperatures exceeding 800oC in to
remove all beneficial effects of the hydrogen from the deposition process. The samples were then
be retested to study their de-hydrogenated thermionic performance. Following the second test,
the samples were placed back into the MPCVD chamber and exposed to various hydrogen
plasma treatments and tested a third time to assess how the exposure affects the emission
properties.
73
The present research also examines the influence of hydrogenation treatment variables
such as plasma power, sample temperature, chamber pressure, and treatment time. For each
variable, 3-4 different hydrogenation treatments were performed, each with a new sample.
4.5 Determination of the activation energy of hydrogen in diamond
Desorption of hydrogen from diamond films has hindered attempts to utilize diamond
thermionic emitters as all beneficial effects appear to completely diminish when the samples are
heated to temperatures exceeding ~ 700oC. In order to address this occurrence, a better
understanding of the desorption process is in order. Numerous studies have attempted to
determine the activation energy of the hydrogen desorption process from diamond with varying
success. All methods currently considered require complex and expensive equipment that
typically only allow for one or two measurements to be made.[78-84] The present research seeks
to further advance understanding beyond previous research by examining the isothermal
emission current behavior of diamond films.
As mentioned earlier, the superior electron emission properties of diamond have been
attributed to the surface hydrogen induced negative electron affinity. It has been proposed that
the negative electron affinity results from a surface dipole layer formed by carbon-hydrogen
bonds which creates a potential drop at the surface.[67, 68, 73] Assuming this is true, the
desorption of a hydrogen atom from a surface site would result in a vacancy with a higher
electron affinity (and also a higher work function) at that site implying a direct correlation
between surface hydrogen concentration and electron emission current.
The assumption that the amount of thermionic emission current is directly proportional to
the amount of hydrogen in the samples is the basis of the next experiment. Diamond films were
74
synthesized via MPCVD and first tested both to characterize their as-grown thermionic emission
properties and also to remove hydrogen present from the deposition processes. The samples were
then re-hydrogenated and placed back into the thermionic testing chamber. The emission current
of the samples was then characterized isothermally. A PID control was constructed and
implemented into the testing apparatus allowing the sample to be heated to and maintain a
desired temperature over an extended period of time. It was initially believed that the emission
current from the samples would decrease over an extended period of time as hydrogen desorption
occurs. This current was then be analyzed with respect to the integrated rate equations to
determine the activation energy of hydrogen in diamond. This experiment was executed for
multiple samples at several different temperatures performing a detailed study of the hydrogen
activation energy in diamond beyond what is presently known.
4.6 Exploration of deuterium as an alternative to hydrogen
The primary objective of this effort is to enhance the performance of diamond cathodes
for use in a thermionic energy converter. As has been shown, the beneficial effects of hydrogen
begin to diminish at temperatures exceeding 700oC. Therefore, alternate species should be
examined that could result in more emission at higher temperatures. Deuterium is one possible
approach as it has similar properties to hydrogen but with twice the mass. This higher mass leads
to the carbon-deuterium bond having a lower vibrational frequency than the carbon-hydrogen
bond, thus requiring more energy to break the carbon-deuterium bond and, in turn, a higher
activation energy. It then follows that a diamond cathode exposed to a deuterium plasma
treatment (deuterated) might be able to emit at higher temperatures than a similar hydrogenated
sample. Due to the high cost of deuterium compared to hydrogen, it would be impractical to

75
substitute deuterium for hydrogen during the deposition process. Rather, gas supplies were
conserved by only performing deuterium treatment on samples grown in the standard hydrogen-
rich, methane-starved environment that had been de-hydrogenated.
4.7 Investigation into the operation of diamond in gaseous environments
Past implementations of thermionic energy converters utilized tungsten cathodes with
cesium gas fed into the cathode-anode gap.[114, 123, 130-133] The cesium served two purposes.
Tungsten has a relatively high work function requiring high temperatures (in excess of 2000oC)
in order to achieve practical thermionic current densities. The work function can be lowered by
“cesiating” the tungsten surface.[114, 123, 130] The effects of the cesium rapidly diminish
during operation as the tungsten outgases when heated to operating temperatures. By
incorporating cesium gas into the interelectrode gap, the cesium in the tungsten could be
constantly replenished allowing for stable operation.[123] In addition to enhancing the surface
chemistry, operation of tungsten cathodes in a cesium vapor environment (rather than a vacuum)
has been shown to favorably affect the electron transport from the cathode to the anode.
The high emission currents required to produce necessary output power levels for TEC
applications often results in space charge effects. Space charge effects are due to the negatively
charged electrons traversing the cathode-anode gap which cancel out a portion of the electric
field between the cathode and anode. More electrons present in the gap equate to more canceling
of the electric field, further suppressing the emission current. This performance limiting effect
can be mitigated (or even eliminated) through the presence of positive cesium ions in the
cathode-anode gap. One method to introduce these ions is through surface ionization. When a
tungsten cathode is heated to temperatures in excess of 1200 oC, I. Langmuir and K.H. Kingdon
76
showed that all cesium atoms that strike it are ionized resulting in positively charged cesium
ions.[123, 134] These positive charges present adjacent to the emitter surface will cancel out the
negative charges of the electrons, reducing the space charge effect. Cesium ions can also be
produced by collision of cesium atoms with the thermionically emitted electrons from the
cathode.[133] In order for ionization to occur, electron temperatures greater than 2500oC are
required.[135] As this study seeks to improve the low temperature (<1000oC) thermionic
emission performance of diamond films, gaseous species must be examined that produce positive
ion products without the excessive heat requirements of cesium.
Hydrogen interaction with the diamond surface has been shown to be somewhat
analogous to the interaction of cesium with tungsten. The exposure of diamond films to
hydrogen plasma treatments creates polarized C-H surface bonds which lower diamond’s
electron affinity to negative levels directly correlating to a lower work function.[73] Thus,
hydrogen containing gaseous species appear to be the most suitable candidates to enhance the
thermionic emission performance of diamond. The next part of this research characterizes five
different gaseous species, three of which are hydrogen containing. It is desired to identify a
gaseous species which could interact similar to cesium which both replenishes the hydrogen
desorbed from the diamond during operation and also mitigates the space charge effects arising
between the cathode and the anode.
Ideally, both the current vs. temperature and isothermal emission current operation of
diamond films in a vacuum environment with the operation in each gaseous species would be
compared. However, this would prove extremely difficult as testing alone is predicted to alter the
emission current due to hydrogen desorption (i.e. testing requires the films to be heated). Further,
the polycrystalline nature of the deposited diamond leads to slight variations between samples

77
implying that each will emit differently making comparisons between samples unsuitable. These
problems were solved by examining the thermionic emission from diamond films in both a
vacuum environment and a gaseous environment in one test. The samples were first isothermally
heated to a desired temperature. The emission current of the sample operating in vacuum was
then taken. After some period of time, a gaseous species was introduced into the chamber and the
change in emission current observed. This testing method allowed for the influence of each gas
on the thermionic emission to be assessed while also eliminating error that could arise from the
other methods previously mentioned.

78
CHAPTER V
DEVICE FABRICATION AND TESTING APPARATUS
This chapter focuses on the two most crucial parts of this research: the deposition of
diamond films as thermionic cathodes and the construction of testing apparatuses capable of
characterizing the thermionic emission properties of such cathodes. The deposition process used
to deposit diamond films for this research is discussed as well as characterization techniques
employed to assess the quality of the films. This chapter also describes in detail the two testing
apparatuses designed for this research. The information within this chapter is essential to fully
comprehending the validity of the studies presented in the subsequent chapters and will be
frequently referenced.
5.1 Deposition and characterization of diamond films
A deposition method was identified for the growth of nitrogen-incorporated
polycrystalline diamond films for use in thermionic emission applications. The method described
below allowed for diamond films with large grain sizes on the order of micrometers with
minimal non-diamond carbonaceous content to be fabricated.
5.1.2 Sample preparation and deposition process
Diamond samples were deposited on molybdenum 125μm molybdenum strips. The
geometry of these substrates (30 mm length x 2 mm width x 125 μm thick) was chosen such that
they could easily be heated to temperatures approaching 1000oC without excessive power
requirements, yet sturdy enough that the fabricated samples could be easily handled.

79
Molybdenum was the substrate material of choice for several reasons. First, it is a material that
readily forms a stable carbide which has been documented to be favorable for diamond growth
and adherence.[27] Second, studies have reported that the molybdenum-diamond interface is
extremely well behaved with ohmic behavior.[105] Finally, molybdenum is more resistant to
hydrogen embrittlement than other materials such as tungsten which allows for straightforward
handling of the sample post-deposition.[28, 136]
The preparation of the molybdenum substrate for deposition began with a mild abrasion
of the substrate’s surface. This step removes surface contaminants allowing for a cleaner surface.
Additionally, this step promotes surface defects sites which have been shown to promote
diamond nucleation during the beginning of the deposition process.[28, 31] Following the
abrasion, the substrates were mechanically nucleated using a nanodiamond paste/methanol
mixture. The nanodiamond particles present in the mixture become embedded in the defects
introduced by the abrasion and act as seeds, thereby expediting the growth process. Excess
nanodiamond paste was wiped off and the samples were then placed in the MPCVD chamber for
deposition. Deposition was performed on four samples concurrently to provide a set by which
the emission current could be compared directly.
The MPCVD chamber was first pumped down to its ultimate pressure of around 2 mTorr.
To ensure all residual air particles were removed, hydrogen was flowed through the chamber for
several minutes. The hydrogen was then turned off and the substrate stage heated to 750oC. The
deposition process then began with the following parameters: 20 Torr chamber pressure, 400
SCCM (standard cubic centimeters) H2, 5 SCCM CH4, and 550 W microwave power. After the
plasma was initiated and observed to be stable, the substrate stage temperature set point was then
changed to 900oC. While the temperature was heating to the new set point, the pressure and
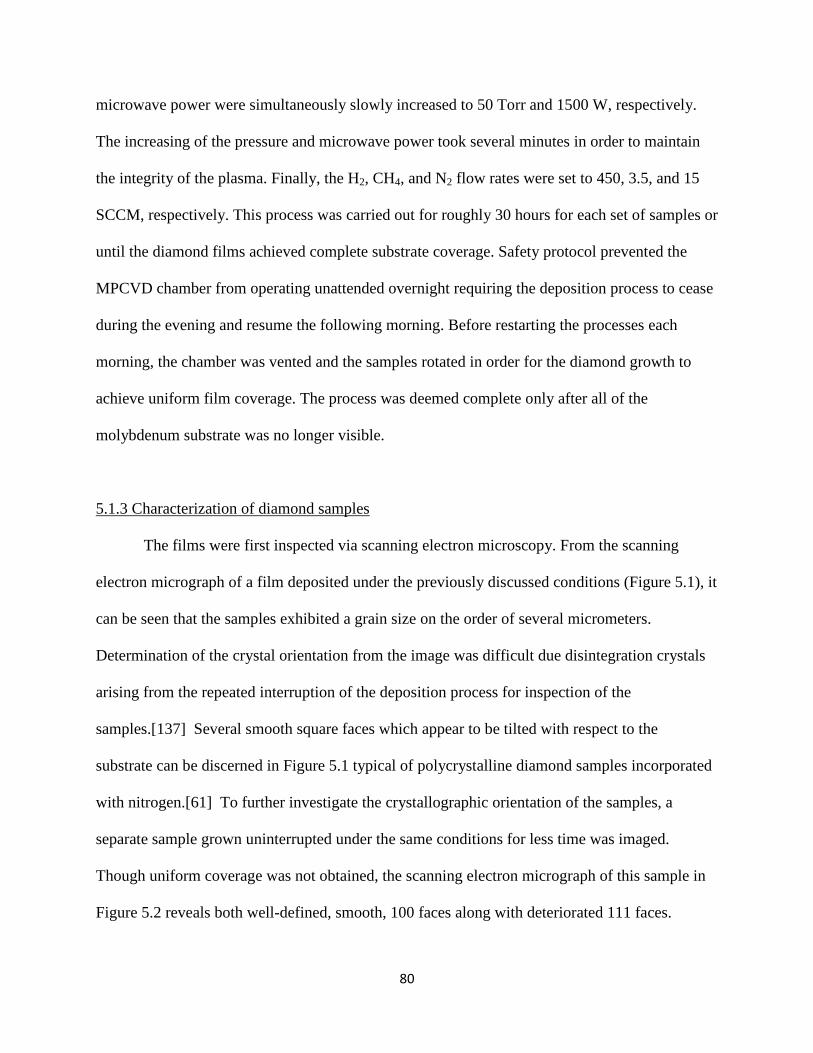
80
microwave power were simultaneously slowly increased to 50 Torr and 1500 W, respectively.
The increasing of the pressure and microwave power took several minutes in order to maintain
the integrity of the plasma. Finally, the H2, CH4, and N2 flow rates were set to 450, 3.5, and 15
SCCM, respectively. This process was carried out for roughly 30 hours for each set of samples or
until the diamond films achieved complete substrate coverage. Safety protocol prevented the
MPCVD chamber from operating unattended overnight requiring the deposition process to cease
during the evening and resume the following morning. Before restarting the processes each
morning, the chamber was vented and the samples rotated in order for the diamond growth to
achieve uniform film coverage. The process was deemed complete only after all of the
molybdenum substrate was no longer visible.
5.1.3 Characterization of diamond samples
The films were first inspected via scanning electron microscopy. From the scanning
electron micrograph of a film deposited under the previously discussed conditions (Figure 5.1), it
can be seen that the samples exhibited a grain size on the order of several micrometers.
Determination of the crystal orientation from the image was difficult due disintegration crystals
arising from the repeated interruption of the deposition process for inspection of the
samples.[137] Several smooth square faces which appear to be tilted with respect to the
substrate can be discerned in Figure 5.1 typical of polycrystalline diamond samples incorporated
with nitrogen.[61] To further investigate the crystallographic orientation of the samples, a
separate sample grown uninterrupted under the same conditions for less time was imaged.
Though uniform coverage was not obtained, the scanning electron micrograph of this sample in
Figure 5.2 reveals both well-defined, smooth, 100 faces along with deteriorated 111 faces.

81
Figure 5.1 Scanning electron micrograph of a diamond sample grown under the
previously described conditions
Figure 5.2 Scanning electron micrograph of a sample grown uninterrupted for less time
under the same conditions as the sample in Figure 5.1. Well defined smooth square faces
indicative of 100 orientations can easily be discerned as well as deteriorated triangular
faces suggesting crystals with 111 orientations are also present.

82
Raman Spectroscopy measurements were also performed on a diamond sample post
deposition by Dr. Arnold Burger at Fisk University. As mentioned in Section 2.3, Raman
spectroscopy is a non-destructive characterization technique that provides information on the
vibrational, rotational, and other low frequency transitions of the molecule.[39] Analysis of
these results (Figure 5.3) demonstrated a strong diamond (sp3) response at 1334 cm
-1 and with a
small graphite (sp2) response around 1580 cm
-1. Because this technique has been shown to be
much more sensitive to graphite over diamond,[40] it can be concluded that these nitrogen-
incorporated diamond samples are predominately diamond with little graphitic content.
Figure 5.3 Raman spectroscopy indicating predominantly diamond (sp3) composition
with minimal graphitic (sp2) content

83
5.2 Testing apparatus
A reliable, efficient, and inexpensive method for characterizing the thermionic emission
properties from the above diamond films was designed. Two testing chambers were constructed
employing this method, each chamber for different types of experiments.
5.2.1 Apparatus for testing in vacuum environments
The thermionic emission behavior of nitrogen-incorporated diamond films was examined
in both vacuum and gaseous environments. Vacuum environment testing, required for all
hydrogenation and desorption studies (presented in Chapter VI), was performed in a custom built
vacuum chamber capable of evacuating to pressures on the order of 1x10⁻⁸
Torr. The body of this
testing apparatus consisted of a six-way cross with flange sizes of 6 inches to which the sample
holder, viewport, turbo molecular pump, ion gauge, and ion pump all attached.
A sample holder was constructed out of a three pronged copper high power feed-through.
Two of these prongs were meant to physically hold the sample while the third (which is
electrically isolated from the other two) functioned as the anode. Brass wire connectors were
fitted over both of the holder prongs to provide a means to secure the diamond samples which
are grown on thin strips of molybdenum as described in Section 5.1. The method used for
heating these samples consisted of applying DC power which created heating gradients
throughout the sample with the hottest part being the middle. A glass aperture was employed to
prevent emission current from sites other than those of interest and also to allow for accurate
determination of the emission area so that emission current densities could be calculated. The
below figure is a photograph of a mounted sample in this configuration.

84
Figure 5.4 A) Diagram of the electrical feedthrough. B) Photograph of the mounted
sample
The temperature of the sample was monitored with an Omega non-contact dual color
pyrometer positioned externally from the chamber. The pyrometer was able to observe the
sample through a six inch viewport positioned normal to the sample. As this temperature
measurement method requires detailed knowledge of the sample’s emissivity, the pyrometer
measured the back side of the sample, which was simply the molybdenum substrate, rather than
the front diamond side. (Molybdenum has a well-documented emissivity which allowed for the
pyrometer to be easily calibrated)

85
The primary pumping mechanism for this chamber was a Duniway ion pump that was
activated after the chamber had been pumped down to a pressure of around 1x10⁻⁶
Torr by means
of a turbo molecular pump stand. The pressure was measured with a Bayard Alpert style ion
gauge tube. As both the ion pump and ion gauge operate on the principal of electron emission,
both are prone to emitting stray electrons. To avoid these stray electrons from interfering with
device testing, both were positioned without a direct line of sight to the sample (see Figs. 5.5-
5.6).
Figure 5.5 A) Top view of the vacuum chamber. Note that there is no direct line of sight
between the sample being tested and either the ion gauge or the ion pump. B) Side view
of chamber to demonstrate placement of the sample
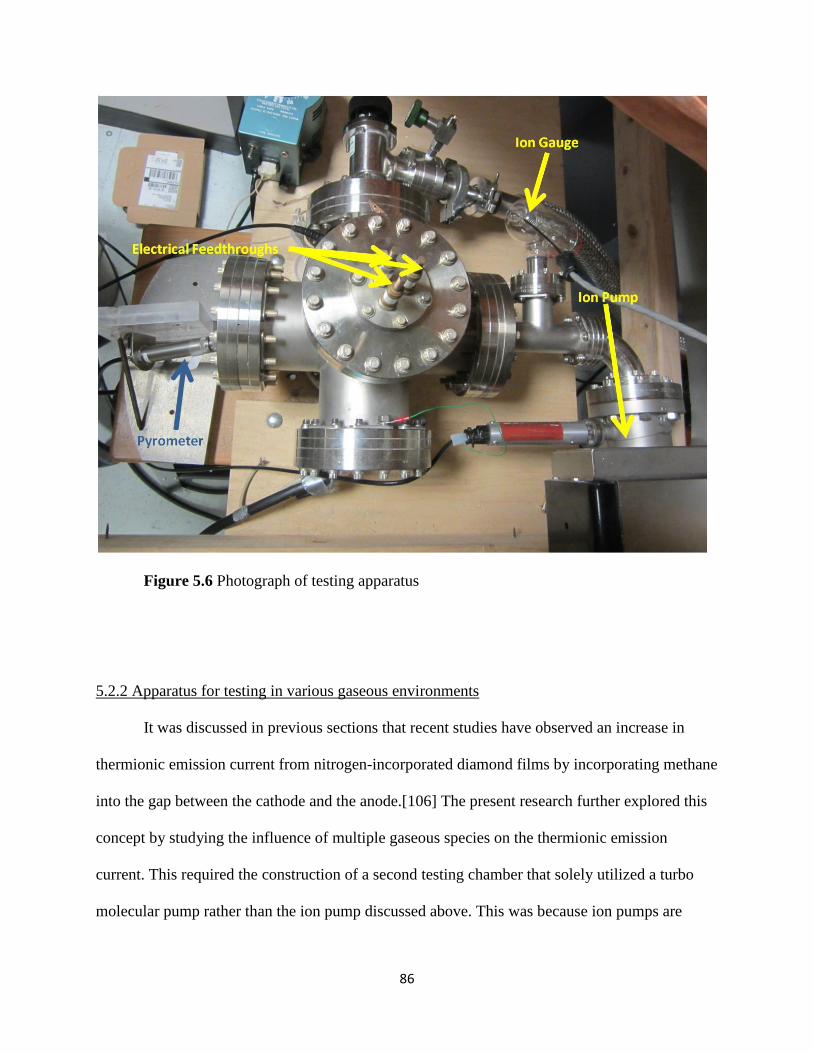
86
Figure 5.6 Photograph of testing apparatus
5.2.2 Apparatus for testing in various gaseous environments
It was discussed in previous sections that recent studies have observed an increase in
thermionic emission current from nitrogen-incorporated diamond films by incorporating methane
into the gap between the cathode and the anode.[106] The present research further explored this
concept by studying the influence of multiple gaseous species on the thermionic emission
current. This required the construction of a second testing chamber that solely utilized a turbo
molecular pump rather than the ion pump discussed above. This was because ion pumps are

87
extremely slow compared to turbo molecular pumps and can only operate effectively at low
pressures (<10-6
Torr) and it was desired to fill the chamber with higher gas pressures.
The second testing apparatus functioned much the same as the one discussed in Section
5.2.1, but was also equipped with a Residual Gas Analyzer to measure the chemical makeup of
the gaseous species present in the chamber. Substances that exist in the gas phase as well as
those which exist in the liquid phase at room temperature were tested in this research.
Methane, molecular nitrogen, molecular hydrogen, and nitrous oxide were the four
substances examined which exist in the gas phase at room temperature. Each of these species
was contained in a tank of compressed gas equipped with a regulator to control the pressure to
the chamber. The tanks were attached to the chamber by means of a high vacuum variable leak
valve. Connections from the tank to the leak valve were made with copper piping that was first
evacuated to remove all water vapor and other contaminates that could be present. Upon
pressuring the copper piping with the desired gas, the testing apparatus was ready for testing.
Gaseous species were able to be incorporated into the chamber to a desired pressure by simply
opening the leak valve. The testing method used to characterize these gaseous species’ influence
on the thermionic emission from diamond is discussed later.

88
Figure 5.7 Schematic of the testing apparatus for the incorporation of gaseous species
into the vacuum gap
Testing with H2O proved more difficult than the above gaseous substances as it exists in
the liquid phase at room temperature. Water vapor was fed into the vacuum chamber from a
custom-designed water vessel chamber. The water vessel chamber, constructed with stainless
steel to prevent corrosion/rust accumulation, was equipped with three valves and a viewport. The
preparation of this vessel consisted of a four step process which was shown to prevent the
inclusion of any other gaseous species during experimentation. This processes consisted of first
pumping down the clean, empty water vessel with a turbo-molecular pump to pressures on the
order of 5 x 10⁻⁷
Torr to remove the atmospheric gasses present in the vessel. After a period of
several hours, the turbo-molecular pump was valved off and deionized water was sucked into the
chamber through a leak valve. The line that fed the deionized water to the leak valve had all air

89
removed. Water was continually fed into the vessel until a desired level was achieved which was
gauged through the viewport. At this point, the leak-valve to the water line was closed and the
vessel was attached to the gaseous environment testing chamber through a second leak valve (the
same leak valve used in the gaseous species experiments). The whole vessel was then heated to
temperatures on the order of 75oC by means of heating wraps. The heating was meant to both
increase the vapor pressure of the water to provide enough vapor for experimentation and also to
prevent freezing of the water upon entering the testing apparatus. A step-by-step visual
description of this process can be seen below in Figure 5.8. Construction of this configuration
allowed testing to be performed in the same manner as the other tests on gaseous species
permitting direct comparison of all results.
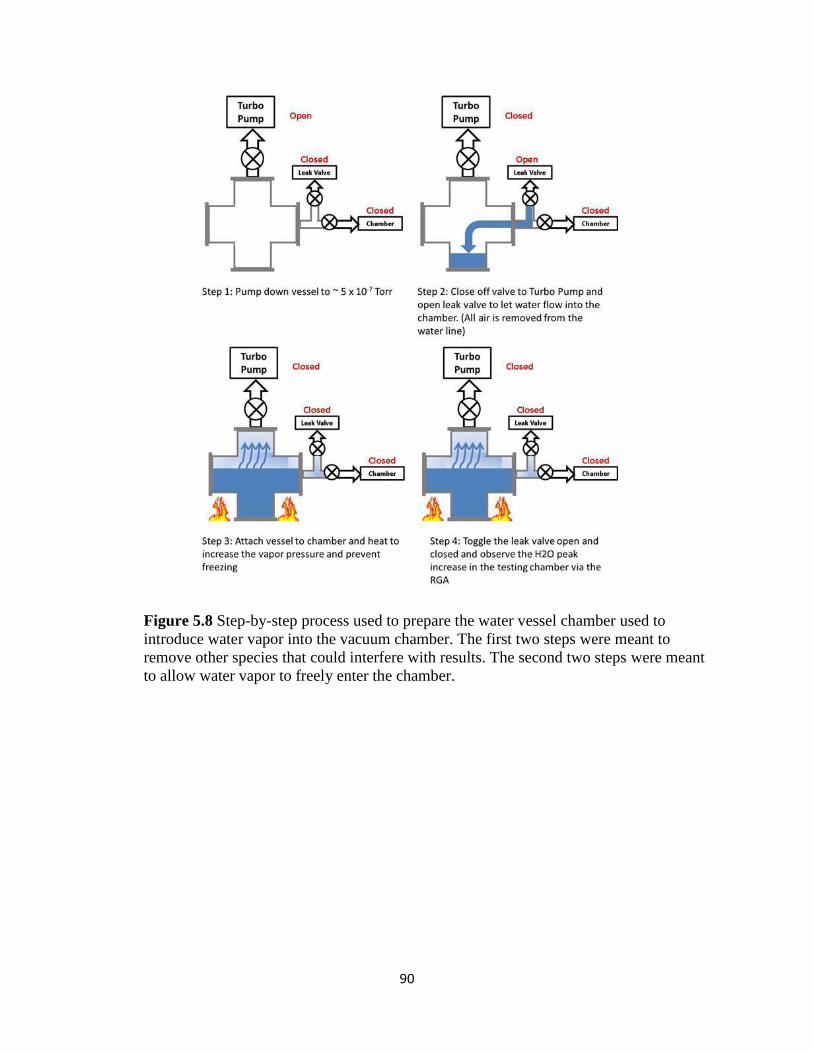
90
Figure 5.8 Step-by-step process used to prepare the water vessel chamber used to
introduce water vapor into the vacuum chamber. The first two steps were meant to
remove other species that could interfere with results. The second two steps were meant
to allow water vapor to freely enter the chamber.

91
Figure 5.9 Schematic of the testing apparatus for the incorporation of species that are in
the liquid state at room temperature into the vacuum gap.
5.3 Data collection and system control
As previously mentioned, the sample holder was equipped with an electrically isolated
prong that acted as the collector anode. Low fields (<1 V/μm) were applied to the sample as it
was desired to measure only thermionic emission current. High fields could lead to tunneling
thus promoting erroneous results. This anode voltage, Vanode, was held at a fixed voltage for all
tests performed in this research. The emission current was required to be measured in series
between the anode and the power supply as the high currents required to heat the sample made
the expected low emission current values (pA) hard to decipher. The ammeter chosen for this
purpose was a USB powered RBD Instruments 9103 floating picoammeter capable of floating at
voltages up to 1000V.
The temperature was controlled by adjusting the current through the sample. The power
supply used for this was a Lambda GENH20-38 capable of outputting up to 38 A. (this power
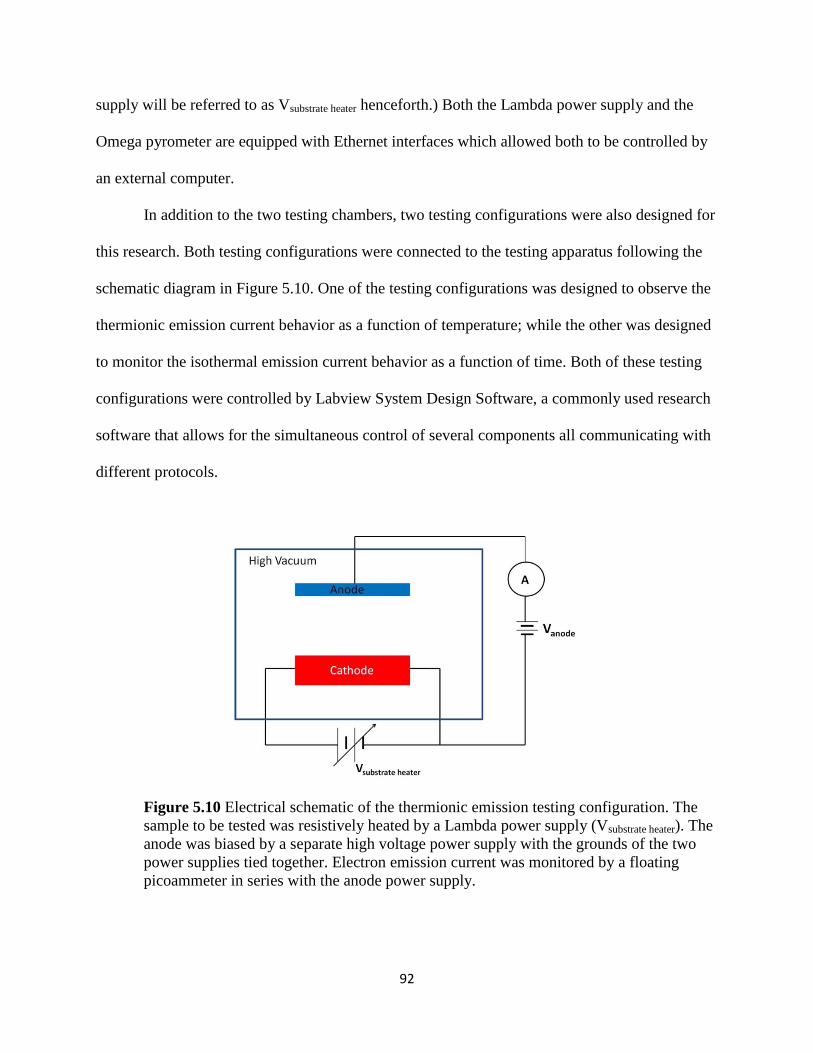
92
supply will be referred to as Vsubstrate heater henceforth.) Both the Lambda power supply and the
Omega pyrometer are equipped with Ethernet interfaces which allowed both to be controlled by
an external computer.
In addition to the two testing chambers, two testing configurations were also designed for
this research. Both testing configurations were connected to the testing apparatus following the
schematic diagram in Figure 5.10. One of the testing configurations was designed to observe the
thermionic emission current behavior as a function of temperature; while the other was designed
to monitor the isothermal emission current behavior as a function of time. Both of these testing
configurations were controlled by Labview System Design Software, a commonly used research
software that allows for the simultaneous control of several components all communicating with
different protocols.
Figure 5.10 Electrical schematic of the thermionic emission testing configuration. The
sample to be tested was resistively heated by a Lambda power supply (Vsubstrate heater). The
anode was biased by a separate high voltage power supply with the grounds of the two
power supplies tied together. Electron emission current was monitored by a floating
picoammeter in series with the anode power supply.

93
5.3.1 Current vs. Temperature (CVT) Configuration
The first testing configuration, the CVT Configuration, was designed for experiments
where it was of interest to study the thermionic emission current behavior of diamond films at
several temperatures. Data collected in this method was meant to be analyzed with respect to the
Richardson equation (previously described) to determine the thermionic emission parameters
such as the sample’s work function and Richardson constant. Testing with the CVT
Configuration consisted of first heating the sample to a desired starting temperature by slowly
increasing the power through the sample with the Vsubstrate heater power supply. Once the desired
starting temperature was achieved, the CVT Configuration control loop was initiated. This
control loop entailed first increasing the current through the sample by 0.05A which
corresponded to a roughly 3-5oC temperature increase. The control loop would then pause for 25
seconds to let the temperature stabilize. Finally, five emission current data points and 5
temperature data points were collected simultaneously and averaged to give one emission
current/temperature data point. This process was then repeated until the desired temperature was
reached. A flow diagram depicting the process can be seen below in Figure 5.11.

94
Figure 5.11 Flow diagram depicting the Labview control loop for the current vs.
temperature tests.
When the desired maximum testing temperature was achieved, the control loop was
stopped, the data saved, and the temperature of the sample manually lowered by decreasing the
power of Vsubstrate heater until no power was flowing through the heating circuit.

95
5.3.2 Isothermal (IT) Configuration
Experiments such as those meant to determine the activation energy of hydrogen in the
diamond films required a more advanced control configuration. These experiments were
performed isothermally over long periods of time whereby the emission current was constantly
monitored. This was accomplished by incorporating a commonly used temperature control
method known as a PID control loop. The “P” element stands for “proportional” and accounts for
the current error at time t or the present error. The “I” element accounts for the past error
integrated up to time t. The last element, the “D” element, accounts for the derivative at the
instant of time t which predicts the future error.[138] After calibrating the P, I, and D constants,
this control loop was able to precisely control the temperature of the sample with a standard
deviation typically less than 1oC.
The IT Configuration began with inputting the desired cathode temperature into the
Labview control program. As the pyrometer is unable to read temperature values less than
~475oC, the PID portion of the control loop was not able to be initiated with the sample at room
temperature. This problem was solved by starting the PID control loop after the Labview control
system had slowly heated the sample to 500oC by increasing the current through the heating
circuit current in small 0.05 A steps. The PID loop was then able to heat the sample from the
500oC starting temperature to the desired temperature, which typically took a few minutes.
Collection of the thermionic emission current data was not begun until after it was observed that
the temperature had reached the desired set point. After the amount of collected data was deemed
sufficient for each particular experiment, the set point temperature was then able to be changed
for further testing. The above process was repeated until testing had been performed at all
96
desired temperatures after which, the data saved, control loop stopped, and the temperature
manually decreased until no power was traveling through the heating circuit.
5.4 Influence of gaseous species on the thermionic emission from diamond
In addition to vacuum testing, the thermionic emission performance of nitrogen-
incorporated diamond cathodes in various gaseous environments was also performed. These
experiments were all performed using the testing apparatus earlier described in Section 5.2.2
utilizing the PID control loop in the isothermal configuration (Section 5.3.2). As mentioned, the
chamber was equipped with a residual gas analyzer (RGA) to allow for direct verification of the
composition of the gasses fed into the chamber. Operation of the RGA consisted of three steps:
First, the chamber was pumped down for a period of ~24 hours. Second, the RGA was initialized
with the leak valve closed to establish a baseline of all species present in the chamber. Finally,
the desired species were leaked into the chamber. The configuration was deemed ready for
testing when only the documented spectrum of the desired species was seen in the chamber.
During testing, the RGA was shut off to prevent the collection of stray electrons by the anode
Each testing run characterized the isothermal emission current response to the
introduction of various low pressure gaseous environments at five temperatures: 600oC, 625
oC,
650oC, 675
oC, and 700
oC (in increasing order). At each testing temperature, the isothermal
emission current was first monitored in a vacuum environment on the order of 1x10⁻⁷
Torr for a
period of time to establish a baseline emission current trend. A gaseous species was then fed into
the chamber to a pressure of ~5.5 μTorr (N2 equivalent) measured at the pump for a period of
~60 seconds after which, the leak valve was closed and the chamber evacuated back down to 1 x
10-7
Torr levels. It was required to measure the pressure at the pump as all available pressure

97
measurement techniques operate on the principal of electron emission. Attaching such a gauge
directly to the chamber could lead to unreliable results if stray electrons are collected by the
anode. The gaseous species were fed into the chamber twice at each testing temperature. Upon
completion of testing, the data was analyzed to determine the emission current response to the
introduction of each gaseous species. The results from these experiments are presented in
Chapter VII.

98
CHAPTER VI
THERMIONIC EMISSION CHARACTERIZATION IN VACUUM
This chapter presents the results of the thermionic emission experiments performed in a
vacuum environment. Thermionic emission characterizations of both as-grown and hydrogenated
diamond films are presented and compared. The isothermal emission current of diamond films
exposed to various plasma conditions was also explored to better understand the hydrogen
desorption process from diamond.
6.1 As-gown nitrogen-incorporated diamond films
This portion of the research began by examining the thermionic emission current of
nitrogen-incorporated diamond films immediately after deposition before exposure to any
hydrogenation treatments. The Richardson constant and work function of samples in this “as-
grown” state were calculated by observing the emission current vs. temperature trend of the
samples.
6.1.1 Thermionic emission behavior of as-grown samples
A nitrogen-incorporated diamond sample was first prepared according to the method
described in Section 5.1. Thermionic emission testing for this experiment was performed in
vacuum testing apparatus (Section 5.2.1) using the Current vs. Temperature (CVT) testing
configuration.

99
Observation of the electron emission current above background began at 485oC and
increased with temperature up to a maximum testing temperature of 640oC. A plot of the
emission current vs. temperature can be seen below in Figure 6.1.
Figure 6.1 Thermionic emission current behavior of an as-grown diamond sample as a
function of temperature
As previously mentioned, the thermionic emission current arising from a heated cathode
is described by the Richardson equation (Equation 6.1). [22, 109]
⁄
(6.1)
Where: J=Current Density (A/cm2); A=Richardson Constant (A/K
2cm
2); T=Temperature
(K); Φ=work function (eV); and k=Boltzmann constant (8.617 x 10⁻⁵
eV/K). The emission
parameters “A” and “Φ” were determined by rearranging Eq. 6.1, taking the natural logarithm of

100
both sizes of the equation (Eq. 6.2), and plotting Ln(J/T2) against -1/kT. In the resulting
“Richardson plot,” the slope and y-intercept correspond to the work function and natural log of
the Richardson constant respectively.
( ⁄ )
⁄ ( ) (6.2)
Analysis of the thermionic emission current data from the as-grown diamond sample with
respect to Eq. 6.2 did not exhibit the expected linear relationship across the entire temperature
range. Rather, the work function and Richardson constant varied with temperature. From Figure
6.2, it can be seen that there was a distinct transition region in which the work function and
Richardson constant both increased.
Figure 6.2 Richardson plot of the thermionic emission data seen in Figure 6.2. It is clear
that the plot is not linear contrary to what would be expected from the Richardson
equation. Rather there was a distinct transition temperature in which both the work
function and Richardson constant increased.
101
It should be noted that the Richardson constant value in the high temperature regime of
153A/cm2K
2 is larger than the theoretical value of 120A/cm
2K
2. Past research on this topic has
indicated that the calculation of this constant requires several factors to be taken into account
beyond Richardson’s initial model.[139] These factors lead to large variations in this value for
different materials and values much larger than 120A/cm2K
2 have been well documented.[105]
The results shown in Fig. 6.2 not only exhibit a strong temperature dependence on
diamond’s work function but also its Richardson constant, which are consistent with previous
thermionic emission studies on other wide bandgap materials. Examining the emission properties
of emissive oxides, M. Myojo derived several equations describing the change in both work
function and Richardson constant as linear relations to the natural logarithm of the ratio of the
conduction band concentration to the donor level concentration.[140] It has been noted in
previous sections that the donor level of nitrogen in diamond is 1.7eV below the conduction
band.[141] At the temperatures tested in this study, it can be assumed that a negligible amount of
donors were ionized. Conversely, the conduction band concentration has a strong dependence on
temperature resulting from the defect-induced energy bands that nitrogen presents in
diamond.[60] According to M. Myojo, this increase in conduction band carrier concentration
accounts for the observed increase in work function as well as Richardson constant with
increasing temperature.
Thermionic emission testing results from as-grown nitrogen-incorporated diamond
demonstrated that much higher emission current density values can be achieved compared to
those seen from boron-doped diamond films.[142] Unfortunately, these current levels are lower
than viable application levels, prompting further investigations.

102
6.2 Effect of hydrogen on the thermionic emission from diamond
Previous sections of this dissertation have provided substantial documentation on the
beneficial effects that hydrogen has on the electronic properties of diamond films. For instance, it
is believed that hydrogen interaction at the diamond surface is responsible for its observed
negative electron affinity.[67] Hydrogen has also been shown to affect the solid state electronic
properties of diamond through the passivation of grain boundaries in polycrystalline films in
addition to deep traps found in single crystalline films.[65, 143] The present study sought to
further the understanding of the influence of hydrogen in diamond by examining its effects on
thermionic emission.
6.2.1 Characterization technique
A diamond sample was deposited according to the process described in Section 5.1. This
“as-grown” diamond sample was first tested (Test #1) to observe its thermionic emission
properties using the vacuum testing chamber in the same manner as described in Section 6.1.1.
Rather than ceasing testing below 700oC (as was done in Section 6.1), testing continued up to a
maximum temperature of ~900oC. It was observed that the emission current began to exhibit a
strong deviation from the Richardson equation in that it transitioned into a decreasing trend with
increasing temperature. Testing was halted at 900oC as the emission current had decreased to
levels below measurement capability (10pA). The sample was then retested (Test #2) in the same
manner and no measureable emission current was observed up to a maximum testing temperature
of 800oC. After a cooling period, the sample was removed from the testing apparatus and placed
back in the MPCVD chamber to be “hydrogenated.” This process consisted of exposing the
sample to a low energy hydrogen plasma at the following parameters: temperature = 850oC,
103
hydrogen flow rate = 200 sccm, pressure = 20 Torr, and microwave power = 550 W. The
duration of this process was one hour. Following hydrogenation, the sample was placed back in
into the vacuum testing chamber to examine the effects the hydrogen plasma had on the
thermionic emission (Test # 3).
6.2.2 Comparison of as-grown and hydrogenated diamond samples
Examining the data from the first two tests (Figure 6.3), it can be seen that the emission
current began to decrease with increasing temperature when the sample was heated to
temperatures exceeding ~800oC. Though never specifically addressed, this effect has frequently
been seen by other researchers and is believed to be caused by the desorption of hydrogen from
the diamond cathode.[74, 75] The present study went beyond those previous observations by
continuing to test up to 900oC whereby all beneficial effects of hydrogen appeared to be
removed. This was verified by the lack of recovery of any measureable emission current as seen
in Test # 2.

104
Figure 6.3 Comparison of the thermionic emission testing results from Test #1 and Test
#2 of an as-grown sample before hydrogenation. Test #1 was an as-grown diamond
sample and the thermionic emission current was observed to increase with temperature
according to the Richardson equation until ~800oC, upon which the emission current
began to decrease. Test #2 was performed on the same sample after a cool down period.
No emission current above the noise level was observed up to a maximum testing
temperature of 800oC. The solid line represents the fit to the Richardson equation of Test
#1 data.
Upon hydrogenation of the sample, the emission current not only recovered but exceeded
the emission current observed in Test #1 by four orders of magnitude, as seen in Figure 6.4. This
indicates that hydrogen indeed beneficially affects the thermionic emission from diamond.
Though the hydrogenated sample achieved much higher emission current levels than the as-
grown sample, the emission current vs. temperature trend for Test #3 again followed the same
“roll over” trend seen for Test #1 in that the emission current began to decrease with increasing
temperature. Additionally, comparison of Figures 6.3 and 6.4 revealed that Test #3 began to
decrease at roughly 100oC lower temperature than Test #1.

105
Figure 6.4 Comparison of the thermionic emission testing results from Test #1, Test #2,
and Test #3. The electron emission current from the sample after hydrogenation was
significantly higher than the previous runs. The solid line represents the fit of Test#3 to
the Richardson Equation.
6.2.3 Analysis of hydrogen’s effects on thermionic emission
Comparison of the Richardson equation fits for Test #1 and Test #3 yield some
interesting results. First, there was little change in the work function between the two runs.
Second, the Richardson constant for Test #3 was four orders of magnitude larger than for Test
#1. As the work function is simply the barrier that electrons must overcome to be emitted into the
vacuum, these results indicate that exposure to a hydrogen plasma does not alter the barrier, but
rather influences the emission current by means of the Richardson constant. The remainder of
this section presents two possible explanations to describe these results.
The first explanation deals with a previously discussed study by Cui and colleagues.[67]
Their work found that hydrogen termination on the diamond surface reduces the barrier which
electrons must overcome in order to be emitted by decreasing the electron affinity.[67] As there
was little change in work function from Test #1 to Test #3, it can be assumed that electron

106
emission primarily arose from surface sites with surface hydrogen bonds. Though Test #1 was
performed with an as-grown sample that had not been exposed to the hydrogenation treatment, it
was grown in a methane starved hydrogen-rich environment unavoidably resulting in some
amount of hydrogen present in bulk and on the surface of the diamond films. The large increase
in emission current seen in Test #3 was likely due to the hydrogenation treatment increasing the
diamond’s hydrogen surface concentration, thus providing more sites from which electrons can
be emitted. A visual depiction of this scenario can be seen below in Figure 6.5. This increase in
the amount of emission sites could explain the large increase in current seen after the
hydrogenation treatment with little change in the work function. This postulated trend of
increasing hydrogen concentration with hydrogen plasma exposure is consistent with previously
reported studies.[144]

107
Figure 6.5 Visual depiction of the as-grown diamond sample, A) compared with a
hydrogenated sample, B). The as-grown sample was grown in a methane-starved
hydrogen-rich environment resulting in some concentration of hydrogen on the diamond
surface and in the diamond bulk. Exposure of the sample to a hydrogenation treatment
increased both surface and bulk concentrations resulting in higher emission current levels
but little change in work function.
A second possible explanation for the results obtained in the present study deals with
bulk rather than surface hydrogen effects. It has been previously mentioned that hydrogen affects
the electrical resistivity polycrystalline diamond films. Previous studies have observed a decrease
in the resistivity of diamond films upon exposure to a hydrogen plasma which is thought to be
the result of the passivation of both grain boundaries as well as deep traps present in the
bulk.[143] The subsequent decrease in resistivity equates to enhanced electron transport to the
diamond cathode’s surface whereby a greater amount of electrons are available for emission. As

108
this effect deals solely with the bulk, it can assumed that the surface chemistry is unchanged
therefore the work function does not change. This explanation then accounts for the large
increase observed in the Richardson constant from Test #1 to Test #3 and also the small change
in work function.
Two possible mechanisms have been discussed to explain the observations made in the
present study. However, it remains unclear which mechanism is more accurate or if the
observations are a result of a combination of the two.
6.3 Determination of the optimal hydrogenation procedure
It has been shown that hydrogen is crucial to increasing the thermionic emission
performance of the nitrogen-incorporated diamond films used in this research. Therefore, it was
desired to determine the optimal hydrogenation procedure which would result in the best
emission characteristics. Multiple sets of diamond films were synthesized consisting of three to
four films per set. Each set was used to examine the influence of one distinct parameter during
the hydrogenation processes such as stage temperature, pressure, and microwave power. Within
each set, all but one parameter was held constant. Further, each set was grown simultaneously to
minimize inconsistencies between samples.
6.3.1 Influence of temperature on the hydrogenation of diamond
The influence of temperature on the hydrogenation of diamond consisted of first
preparing four samples (A1, A2, A3, A4) grown in the same manner as described in Section 5.1.
Each of these four samples was tested consecutively and the emission current recorded. The
emission area was determined by using a caliper to measure both the aperture size and sample

109
width allowing the emission current density to be calculated. Using emission current densities
allowed for direct comparison of each sample’s thermionic emission properties. After the as-
grown emission current data was taken, each sample was exposed to a hydrogen plasma
treatment with pressure, microwave power, time, and hydrogen flow rate held constant at 20
Torr, 550 Watts, one hour, and 200 SCCM, respectively. The stage temperature during the
hydrogenation treatment was modified for each sample ranging from 400oC to 850
oC.
The thermionic emission current behavior of the initial as-grown runs for Set A can be
seen in Figure 6.6. Each sample achieved similar emission current densities and reached the
maximum emission current levels around 775oC. The discrepancies between films were likely
due to the polycrystalline nature of the diamond films resulting in non-uniformity from sample to
sample. To reduce the influence of these discrepancies on testing, it is helpful to base
conclusions on the differences each sample experienced before and after hydrogenation.
Figure 6.6 As-grown thermionic emission current vs. temperature behavior for Set A. It
can be seen that the emission current behavior was similar for each sample. The
discrepancies likely were a result of the polycrystalline nature of the diamond films.

110
Comparison of the emission current before and after hydrogenation for each sample can
be seen in Figure 6.7, while a plot of the maximum current achieved from each sample as a
function of hydrogenation temperature can be seen in Figure 6.8. It was observed that the
maximum emission current density decreased as the temperature at which they were
hydrogenated increased with the exception of the final hydrogenation temperature of 850oC.
Though a precise explanation of this trend cannot be made at this time, it was hypothesized to be
a result of the two competing processes: adsorption and desorption. In the adsorption process,
molecular hydrogen is fed into the MPCVD chamber and dissociates into atomic hydrogen by
the microwave power. These hydrogen atoms then incorporate into the diamond films by either
diffusing through the bulk or accumulating on the surface, bonding with the surface carbon
atoms. Desorption results from the thermal dissociation of surface C-H bonds that has been
shown to occur from diamond samples at elevated temperatures.[78, 80, 82, 84, 145-147] At low
hydrogenation temperatures, adsorption was the dominant process as the temperatures to which
the films are exposed are not sufficient to promote rapid desorption. As the temperature
increased, the rate of the hydrogen desorption also increased resulting in a net lower
concentration of hydrogen. Finally, at even higher temperatures, hydrogen can more easily
diffuse through the diamond lattice thereby allowing adsorption to once again become the
dominant process.

111
Figure 6.7 Comparison of the performance of each sample before and after
hydrogenation from Set A
Figure 6.8 Maximum current densities obtained from each film as a function of
temperature at which they were achieved for each hydrogenation treatment in Set A. It
can be seen that the maximum emission current decreased with increasing temperature
until the final temperature of 850oC.

112
6.3.2 Influence of time on the hydrogenation of diamond
The effect of hydrogenation time on the emission performance was studied using Set B
consisting of three samples (B1, B2, B3) grown as described in Section 5.1. Each sample was
tested according to the same protocol discussed for Set A. For this set, hydrogenation time was
the variable with pressure, microwave power, temperature, and flow rate held constant at 20
Torr, 550 Watts, 850oC, and 200 SCCM, respectively. The hydrogenation time was modified for
each sample ranging from 1 hour to 4 hours.
Analysis of the data from Set B can be seen in Figure 6.10. Little change was observed
indicating the amount of time (exceeding 1 hour) has little effect on overall performance from
these devices.
Figure 6.9 Emission current density vs. cathode temperature of samples B1, B2, and B3
hydrogenated for 1, 2, and 4 hours respectively. It can be seen that increased exposure
time not only decreased the maximum emission current density values slightly but also
decreased the temperature at which the samples achieve their maximum current densities.
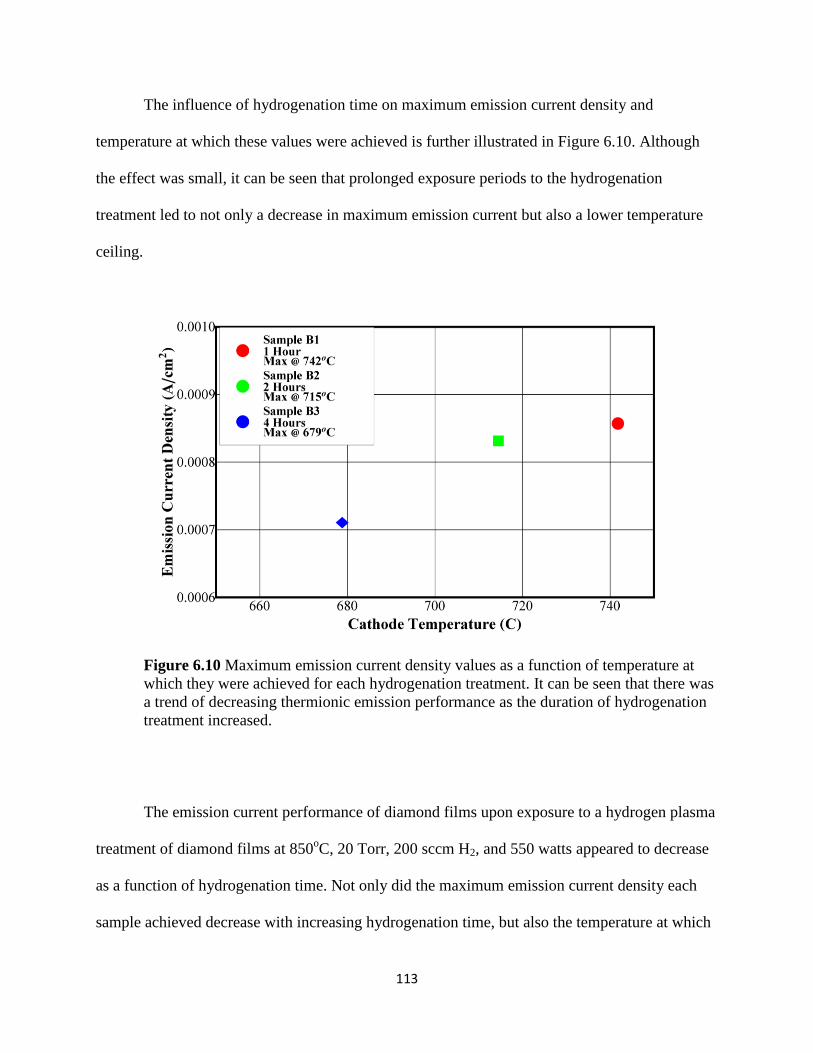
113
The influence of hydrogenation time on maximum emission current density and
temperature at which these values were achieved is further illustrated in Figure 6.10. Although
the effect was small, it can be seen that prolonged exposure periods to the hydrogenation
treatment led to not only a decrease in maximum emission current but also a lower temperature
ceiling.
Figure 6.10 Maximum emission current density values as a function of temperature at
which they were achieved for each hydrogenation treatment. It can be seen that there was
a trend of decreasing thermionic emission performance as the duration of hydrogenation
treatment increased.
The emission current performance of diamond films upon exposure to a hydrogen plasma
treatment of diamond films at 850oC, 20 Torr, 200 sccm H2, and 550 watts appeared to decrease
as a function of hydrogenation time. Not only did the maximum emission current density each
sample achieved decrease with increasing hydrogenation time, but also the temperature at which

114
they began the “roll over” trend, both of which are unfavorable. These effects can likely be
attributed to the competing absorption/desorption mechanisms discussed for Set A. At the
temperatures of 850oC performed in each hydrogenation treatment in Set B, there is likely a large
amount of desorption occurring. Further, the temperature of the sample could likely be
increasing during the hydrogenation treatment. The MPCVD chamber contains an inductively
heated stage that the samples sit on during deposition and hydrogenation. The 850oC temperature
measured during the treatment was the temperature of the stage, not the sample. Over extended
periods of times, it is highly possible that the plasma imparts thermal energy on to the sample
causing it to heat past the 850oC stage temperature. Thus these higher temperatures will cause the
hydrogen to desorb faster. If the desorption rate is higher than the hydrogen adsorption rate
caused by the plasma, then the sample will experience a net decrease in hydrogen surface
concentration. This appears to be the most probable explanation for the results seen from Set B
in the absence of a direct measurement of the sample temperature.
6.3.3 Influence of microwave power on the hydrogenation of diamond
Hydrogenating diamond films with varying microwave powers was studied with Set C
consisting of three samples (C1, C2, C3), which again were grown according to the method
described in Section 5.1. Microwave power was the variable in this set with temperature,
pressure, flow rate, and time held constant at 850oC, 20 Torr, 200 SCCM, and one hour
respectively. The power for each sample varied from 550 Watts to 850 Watts.
The effect of hydrogenation power on the electron emission of the diamond films from
Set C was observed to have little effect. The plot of the emission current density vs. temperature
for samples exposed to 550, 700, and 850 Watts were extremely similar with the discrepancies

115
being within a reasonable margin of error (Figure 6.11). This indicated that microwave power
has little effect on overall emission current.
Figure 6.11 Emission current density vs. cathode temperature of samples C1, C2, and C3
hydrogenated at pressures of 550, 700, and 850 Watts, respectively. It can be seen that
increased microwave power had little effect on emission current.
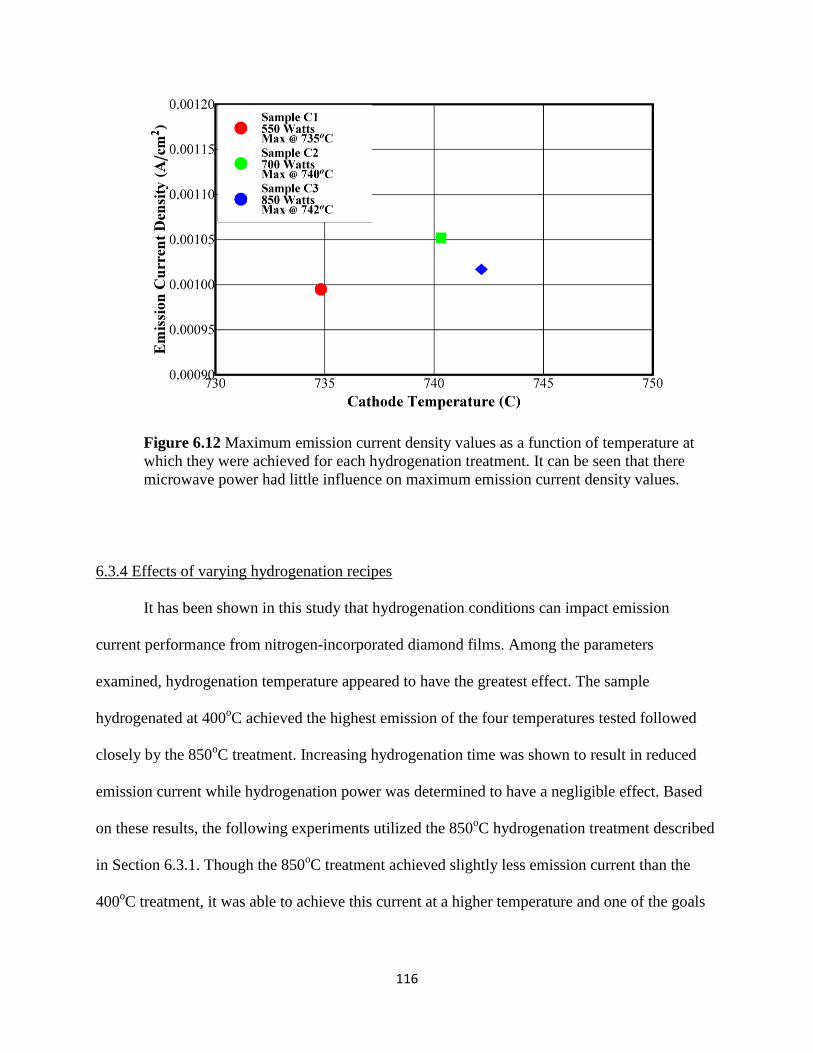
116
Figure 6.12 Maximum emission current density values as a function of temperature at
which they were achieved for each hydrogenation treatment. It can be seen that there
microwave power had little influence on maximum emission current density values.
6.3.4 Effects of varying hydrogenation recipes
It has been shown in this study that hydrogenation conditions can impact emission
current performance from nitrogen-incorporated diamond films. Among the parameters
examined, hydrogenation temperature appeared to have the greatest effect. The sample
hydrogenated at 400oC achieved the highest emission of the four temperatures tested followed
closely by the 850oC treatment. Increasing hydrogenation time was shown to result in reduced
emission current while hydrogenation power was determined to have a negligible effect. Based
on these results, the following experiments utilized the 850oC hydrogenation treatment described
in Section 6.3.1. Though the 850oC treatment achieved slightly less emission current than the
400oC treatment, it was able to achieve this current at a higher temperature and one of the goals

117
of the present research was to increase the temperature ceiling at which diamond films can
operate.
6.4 Desorption process of hydrogen in diamond
Accounts of previous works have been discussed which illustrate that hydrogen has
beneficial effects on the electronic properties of diamond films. Further, the work in this
dissertation has been the first to not only specifically prove that hydrogen enhances the
thermionic emission of diamond films but to examine its effects quantitatively. The following
study sought to further this understanding by calculating the activation energy of the hydrogen
desorption process from diamond films.
Examination of the Richardson equation (Eq. 6.1) indicates that if a cathode is held at a
constant temperature over a period of time, the thermionic emission current should also be
constant. In other words, the Richardson equation contains no explicit time dependence. Though
hydrogen desorption has been mentioned in previous thermionic emission studies involving
diamond, no known studies have examined the isothermal thermionic emission current of
diamond films which this study seeks to accomplish.
With any desorption reaction, hydrogen desorption can be described by the Polanyi-
Wigner equation seen below.
[ ]
[ ] [ ]
( ) (6.3)
Where km: the rate constant; [H]: the hydrogen concentration; M: the formal order; Em: the
activation energy; and ko
m: the pre-exponential factor.[77] As this study examined the isothermal
desorption of hydrogen from diamond surfaces, it was useful to integrate Equation 6.3 with

118
respect to time to obtain equations that describe the desorption as a function of time. The
integrated rate equations for zeroth, ½, first, and second order reactions can be seen below.
[ ] [ ], zeroth (6.4)
(√⌈ ⌉ √[ ]), ½ order (6.5)
([ ]
[ ]⁄ ), first order (6.6)
[ ]
[ ], second order (6.7)
Where k: the rate constant, [Ho]: the initial surface hydrogen concentration, and [H] the surface
hydrogen concentration at time t.[84] The integrated rate equations seen above in Equations 6.4-
6.7 provide a mathematical relationship between the initial hydrogen concentration and the
concentration at time t in terms of a rate constant k. Determination of the reaction order is
typically done by observing the decrease (or increase) of the concentration of a certain species as
a function of time and comparing the data to Equations 6.4-6.7 to determine which has the best
fit. The present study utilized a novel method to determine the desorption kinetics of hydrogen in
diamond by analyzing the isothermal thermionic emission current behavior instead of directly
observing the desorbed species.
6.4.1 Diamond sample preparation
For this study, two diamond films (A and B) were synthesized according to Section 5.1.
Both films were initially heated it 900oC in vacuum to fully desorb all hydrogen present from the
deposition process. The samples were then exposed to identical hydrogenation treatments in the
MPCVD chamber for one hour under the following conditions: temperature = 850oC, H2 flow
rate = 200 SCCM, microwave power = 550 Watts, and chamber pressure = 20 Torr. The sample

119
heater was then turned off and the samples were let cool in the hydrogen plasma until the
temperature reached 500oC (which took ~ 5 minutes) after which, the microwave power was shut
off and the chamber evacuated so the remaining sample cooling took place in a vacuum
environment. It is necessary to cool the samples in the hydrogen plasma to prevent any
desorption of the hydrogen while cooling. The samples were then tested separately in the
vacuum testing chamber described in Section 5.2.1. The isothermal emission current was studied
using the isothermal (IT) testing configuration described in Section 5.3.2.
6.4.2 Isothermal emission behavior of hydrogenated diamond films
The two samples prepared for this study were tested a total of three times at three
different temperatures. The first sample (A) was tested at 600°C, 650°C, and 750°C, while the
second sample (B) was tested at 700°C, 725°C, and 775°C. The isothermal emission current
behavior of the two samples can be seen below in Figure 6.13. The data was normalized such
that J0=J (t=0) =1 for direct comparison. The vertical and horizontal error bars seen for each data
point in Figure 6.13 represent the accuracy of the ammeter and pyrometer, respectively,
according to their manufacturers’ specifications. When these diamond emitters were held at a
constant temperature, it was clear that the emission current decreased with time which is
inconsistent with the Richardson equation as previously discussed. Additionally, it can be seen
that the rate of emission current decrease became larger with increasing temperature.

120
Figure 6.13 Normalized emission current for two samples (sample A: 600°C, 650°C,
750°C; sample B: 700°C, 725°C, 775°C) at different operation temperatures. The small
vertical and horizontal lines within each data point represent the error of the ammeter and
the pyrometer respectively.
Previous experiments, using various other techniques, have observed that the desorption
of hydrogen from CVD diamond surfaces follows the first order reaction rate.[78, 80, 82, 84,
145-147] Examination of Equation 6.6 indicates that if a reaction is first order, a plot of
0][][ln HH versus time should yield a straight line with a slope equal to the rate k. Such a
plot can be seen in Figure 6.14 with the y-axis equal to
ln[J] [J]0 , where [J] and [J0] are the
emission current and initial emission current respectively, and were substituted for the reactant

121
concentrations in Equation 6.6. In Figure 6.14, it is clear that each temperature test yielded a first
order curve that was linear, indicating that a first order reaction was indeed observed.
Figure 6.14 First-order plots of emission current for temperatures between 600oC and
775oC. Two samples were measured (Sample A: 600
oC, 650
oC, 750
oC; Sample B: 700
oC, 725
oC, 775
oC).
6.4.3 Calculation of the activation energy of hydrogen in diamond
A thermally driven classical reaction process where a reaction energy barrier must be
overcome can be described by the Arrhenius equation as:
TkE
Hb
A
eAk
(6.8)

122
where T is temperature (K), AH is a pre-exponential factor, EA is an activation energy (Ev), and k
is the Boltzmann constant (8.617 x 10⁻⁵
eV/K).[77] Upon rearrangement of the Arrhenius
equation, activation energy and pre-exponential factor can be determined using the k values
determined for each temperature from Figure 6.14 by plotting ln(k) against 1/kbT. This plot can
be seen below in Figure 6.15 for which an activation energy and pre-exponential constant were
found to be 1.23 eV and 2.5 x 10³ s
-1, respectively.
Figure 6.15 Arrhenius plot of rate constants obtained in Figure 3. The slope is equal to –
EA, found to be 1.23eV and the y-intercept is equal to ln(ko) found to be 2.5 x 10³ s
-1.
It has so far been assumed that the desorption of hydrogen is primarily responsible for the
observed isothermal degradation of emission current and the results obtained in this study appear
to add validity to this assumption.[68, 148, 149] Previous theoretical and experimental work has

123
demonstrated that diamond(100):H or diamond(111):H surfaces exhibit negative electron
affinity. This property arises from the surface dipole moment the hydrogen-terminated surface
bonds invoke. In a semiconductor, the work function can be described as the energy difference
between the Fermi level and the conduction band plus the energy difference from the conduction
band to the vacuum level (electron affinity). Thus a negative electron affinity equates to a lower
function which, from the Richardson equation, leads to increased thermionic emission. A switch
from negative to positive electron affinity has also been observed in parallel with a phase
transition of the diamond surface from H-terminated (1 x 1) to hydrogen free reconstructed (2 x
1) upon thermal annealing.[150, 151] Also, post-testing exposure of degraded emission diamond
films to low intensity hydrogen plasmas resulted in significantly enhanced recovery of
thermionic emission capability.[76] It then follows that the desorption of a hydrogen atom from a
surface site would result in a vacancy with a higher electron affinity (and also a higher work
function) at that site implying a direct correlation between surface hydrogen concentration and
electron emission current.
Previous studies have suggested that high surface hydrogen concentrations correspond to
two hydrogen atoms per surface carbon atom suggesting a dihydride surface configuration.[85]
Taking this into account, A.V. Hamza and colleagues provides suitable explanation of the first
order hydrogen desorption mechanism observed in the present study. Hamza postulates that the
desorption process consists of the “unimolecular decomposition of two adjacent dihydrides to
form two adjacent monohydrides.”[82] Observations from the present work, that the emission
current declined according to a first-order rate equation, are therefore consistent with the
presence and desorption of hydrogen at its surface determining emission energetics.

124
Various methods have been used in previous studies attempting to determine the
activation energy of the hydrogen desorption from diamond. These methods include direct recoil
spectroscopy (DRS), thermal desorption spectroscopy (TDS), and reflection high-energy electron
spectroscopy (RHEED), among others. A rather large range of activation energy values have
been reported and can be seen below in Table 6.1. The value of 1.23eV determined from the
Arrhenius behavior plotted in Figure 6.15 agrees with the median reported values around 1.25eV
for (111) and 1.5-1.7eV for (100) surfaces.
Table 6.1 Measurements of the bond energy from hydrogen desorption studies using
various experimental approaches.
Diamond Face Ea (eV) Method Reference
001 0.91 RHEED [78]
111 1.25 Change in x [79]
100 3.15 TDS [80]
100 1.48 Theory [81]
100 1.60 ESD-TOF [82]
100 1.47 TPD [83]
100 1.69 Ion Spectroscopy [84]
In summary, this study measured the isothermal, time-dependent thermionic emission
from polycrystalline diamond films at temperatures ranging from 600-800oC. The emission
current was observed to degrade over time following the first-order reaction trend also observed
by other previous studies using different methods. The activation energy of 1.23 eV found in this
study is also in agreement with previously reported hydrogen-diamond desorption reactions on
the 100 and 111 surfaces. The results obtained in the present study not only provide evidence
that hydrogen has beneficial effects on the thermionic emission from diamond cathodes, but also

125
indicated that the magnitude of thermionic emission is directly proportional to the amount of
hydrogen present in the sample.
6.5 Desorption of deuterium in diamond
The studies presented so far have demonstrated the beneficial effect hydrogen has on the
thermionic emission from diamond films. Though the emission current has been seen to increase
by several orders of magnitude upon exposure to a hydrogenation treatment compared to as-
grown, it has been found that the thermionic emission performance decreased logarithmically
(following a first-order trend) when heated to operating temperatures exceeding 600oC.[76, 152]
This lack of stable operating performance drastically limits the applicability of hydrogenated
diamond cathodes and must be addressed.
The interest in deuterium lies in the kinetic isotope effects that occur when a carbon-
hydrogen (C-H) bond is substituted with a carbon-deuterium (C-D) bond. Kinetic isotope effects
describe how the reaction rates of chemically identical molecules can vary simply by replacing
one element of the molecule with its isotope.[153, 154] The vibrational frequency, v, of both the
surface C-H bond and the surface C-D bond can be described as a simple harmonic oscillator
(Equation 6.9).[153]
√
(6.9)
or
(6.10)
Where f is the spring constant of either the C-H or C-D bond, μ is the reduce mass, mC, mH, and
mD are the masses of a carbon, hydrogen, and deuterium atom respectively.[155] Given that
deuterium and hydrogen exhibit nearly identical ionization energies,[156] the spring constant, f,
in Equations 6.9 can be approximated to be equal for the C-H and C-D bonds. Further, as

126
deuterium has twice the atomic mass as hydrogen,[157] the relatively large mass of carbon
(compared to hydrogen and deuterium) allows for the effective mass, µ, of deuterium to be
simplified as being twice that of hydrogen. These assumptions allow for a simple linear
relationship for the vibrational frequency of the C-H bond in terms of the C-D bond to be
expressed as:
√ (6.11)
As the present study was interested in the activation energy of the deuterium bond, it was
desired to express the vibrational frequency of a bond in terms of energy. The vibrational energy
of a diatomic molecule is provided in Equation 6.12.
(
) (6.12)
Where n: the vibrational quantum number, h: Plank’s constant (4.135 x 10⁻¹⁵
eV*s), and v: the
vibrational frequency of the bond found in Equation 2 (s-1
).[153] When characterizing kinetic
isotope effects, it is often useful to express the vibrational energy in terms of zero point energy
(ZPE). At room temperature, virtually all molecules with a certain vibrational frequency can be
approximated to be at the lowest vibrational energy level (n=0) which is referenced as the ZPE.
[154] Using the relation found in Equation 6.11, an expression can be made relating the zero
point energies of the hydrogen and deuterium carbon bonds (Equation 6.13) which indicates that
the C-D bond will lie energetically below the C-H bond at the same temperature.
√ (6.13)

127
In a classical reaction, the dissociation of the C-D or C-H bond can only occur when the
energy of the molecule is sufficient to overcome an energy barrier known as the dissociation
energy, De.[154] The Morse diagram presented in Figure 6.16 demonstrates that the ZPE
difference between hydrogen and deuterium requires more energy be imparted to the C-D bond
to overcome the dissociation energy than the C-H bond. Thus, assuming kinetic isotope effects
are the only factor influencing the reaction, the desorption of deuterium from diamond should
have a higher activation energy than the desorption of hydrogen.
Figure 6.16 Morse diagram representing the difference in Zero Point Energies (ZPE)
between hydrogen and deuterium. As deuterium has a higher mass, it will have a lower
vibration energy implying that it will have a larger activation energy than hydrogen.
In the present study, the isothermal thermionic emission current arising from a deuterated
diamond sample was examined to characterize the deuterium desorption kinetics. The desorption
behavior was compared to the previously reported hydrogen desorption behavior in an effort to
better understand the kinetic isotope effects arising from the surface C-D bonds compared to
rC H, rC D
C DZPE
C HZPE
DE
Internuclear Separation
En
ergy

128
surface C-H bonds. The information obtained in this study was meant to provide a greater
understanding of the thermionic emission phenomena from diamond and is information relevant
to the future implementation of such cathodes for use in thermionic applications.
6.4.1 Isothermal emission behavior of deuterated diamond films
The desorption of deuterium from diamond was studied in the same manner as the
previous hydrogen desorption experiment. Two samples were prepared for this experiment (A
and B) according to the method described in Section 6.4.1, but with using a deuterium plasma
instead of a hydrogen plasma. The isothermal emission current behavior from each sample was
examined using the IT configuration for time periods ranging from 500 to 2500 seconds at three
separate temperatures providing six total points for which the desorption parameters could be
calculated. Both samples were tested in order of increasing temperature with Sample A tested at
650oC, 700
oC, and 750
oC and Sample B tested at 675
oC, 725
oC, and 750
oC. Isothermal emission
testing at each temperature is shown in Figure 6.17. The emission current data was normalized
such that J0=J(t=0)=1 to assist in the following calculation of the deuterium desorption
parameters. It can be clearly seen in Figure 6.17 that the emission current followed a decreasing
trend with respect to time as to be predicted from previous work.[152] The normalized emission
current data was then analyzed according to the first-order reaction equation (Equation 6.14) by
plotting the natural logarithm of the emission current against time (Figure 6.18).
ln[A]
[A]0 kt (6.14)
Where k is the desorption rate (s-1
), t is time (s), and [A]/[A]o is the normalized emission
current.[84] The resulting linear trends indicated that the decay in emission current followed
first-order reaction behavior with the slope at each temperature corresponding to the reaction

129
rate. A first order desorption trend was also observed for the previously discussed study on
hydrogen as well as several other previous studies by other researchers, further verifying that the
deuterium desorption rate was indeed being directly observed.[152, 158-160]
The rate of a classical thermally driven reaction in which a barrier must be overcome can
be expressed as a function of temperature by means of the Arrhenius equation (Equation 6.15).
⁄
(6.15)
Where k: the reaction rate (s-1
); AD: the Arrhenius pre-exponential constant (s-1
); EaD: the
activation energy of deuterium; kb: the Boltzmann constant (8.617 x 10⁻⁵
eV*Kelvin-1
); and T:
the temperature of the sample (Kelvin).[77] The desorption rate at each temperature calculated
from Equation 6.14 was analyzed according to the Arrhenius equation (Figure 6.19). A linear fit
of the resulting Arrhenius plot indicated an activation energy and pre-exponential constant of
1.95 eV and 8.6 x 10⁶ s
-1, respectively.
Figure 6.17 Normalized thermionic emission current behaviors as a function of time.

130
Figure 6.18 First order desorption plot of the normalized isothermal thermionic emission
current behaviors. The linear trend at each temperature indicates the desorption followed
first order kinetic behavior.
Figure 6.19 Arrhenius plot of the desorption data. The deviation from linearity at lower
temperatures incates tunneling could have played a role in the desorption mechanism.
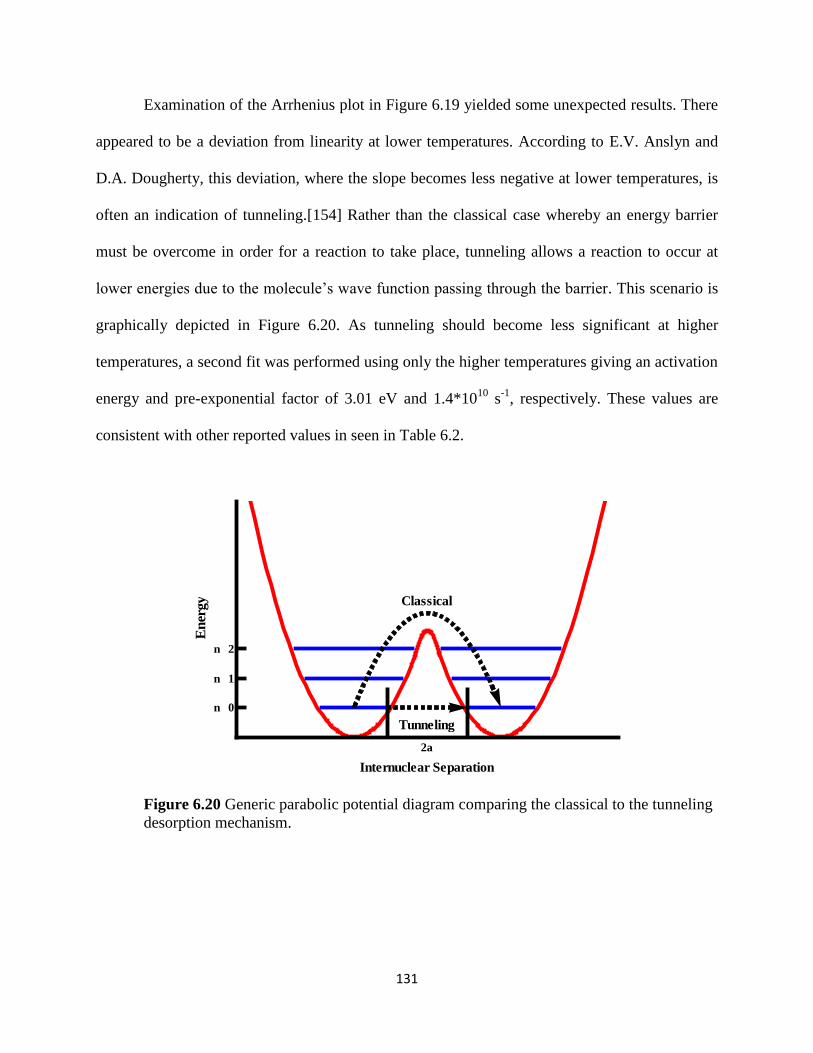
131
Examination of the Arrhenius plot in Figure 6.19 yielded some unexpected results. There
appeared to be a deviation from linearity at lower temperatures. According to E.V. Anslyn and
D.A. Dougherty, this deviation, where the slope becomes less negative at lower temperatures, is
often an indication of tunneling.[154] Rather than the classical case whereby an energy barrier
must be overcome in order for a reaction to take place, tunneling allows a reaction to occur at
lower energies due to the molecule’s wave function passing through the barrier. This scenario is
graphically depicted in Figure 6.20. As tunneling should become less significant at higher
temperatures, a second fit was performed using only the higher temperatures giving an activation
energy and pre-exponential factor of 3.01 eV and 1.4*1010
s-1
, respectively. These values are
consistent with other reported values in seen in Table 6.2.
Figure 6.20 Generic parabolic potential diagram comparing the classical to the tunneling
desorption mechanism.
Classical
Tunneling
2a
n 0
n 1
n 2
Internuclear Separation
Ener
gy

132
Table 6.2 Activation energies and pre-exponential factors obtained from previous
deuterium desorption studies
Ea (eV) A Source
3.82 1.0 x 10¹³
[158]
3.47 5.0 x 10¹²
[159] (Plane)
2.91 5.0 x 10¹²
[159] (Edge)
3.08 1.0 x 10¹³
[161]
3.7 9.5 x 10¹³
[160]
It is possible to account for tunneling by incorporating a pre-exponential correction
factor, Q, into the Arrhenius equation above. This factor, first mathematically derived by Bell,
accounts for the mass of the desorbing species (m), the width of the barrier (2a), the temperature
(T), and the activation energy (Ea). The tunneling correction for the Arrhenius equation can be
seen below in Equations 6.16-19.[162] It should be noted that this tunneling correction assumes
parabolic potential wells as depicted in Figure 6.20.
⁄ (6.16)
⁄
( ⁄ )
(
) (6.17)
⁄ (6.18)
( )
⁄
(6.19)
Where 2a is the width of the tunneling barrier (meters), m is the mass of the tunneling particle
(eV*c-2
), and h is Plank’s constant (4.135 x 10⁻¹⁵
eV*s).
A fit of the k values for each temperature was performed with respect to the tunneling
equation described in Equations 6.16-19 using a Levenberg-Marquardt algorithm. The starting
parameters for the fit algorithm were chosen to be the EaD and AD values obtained from the high
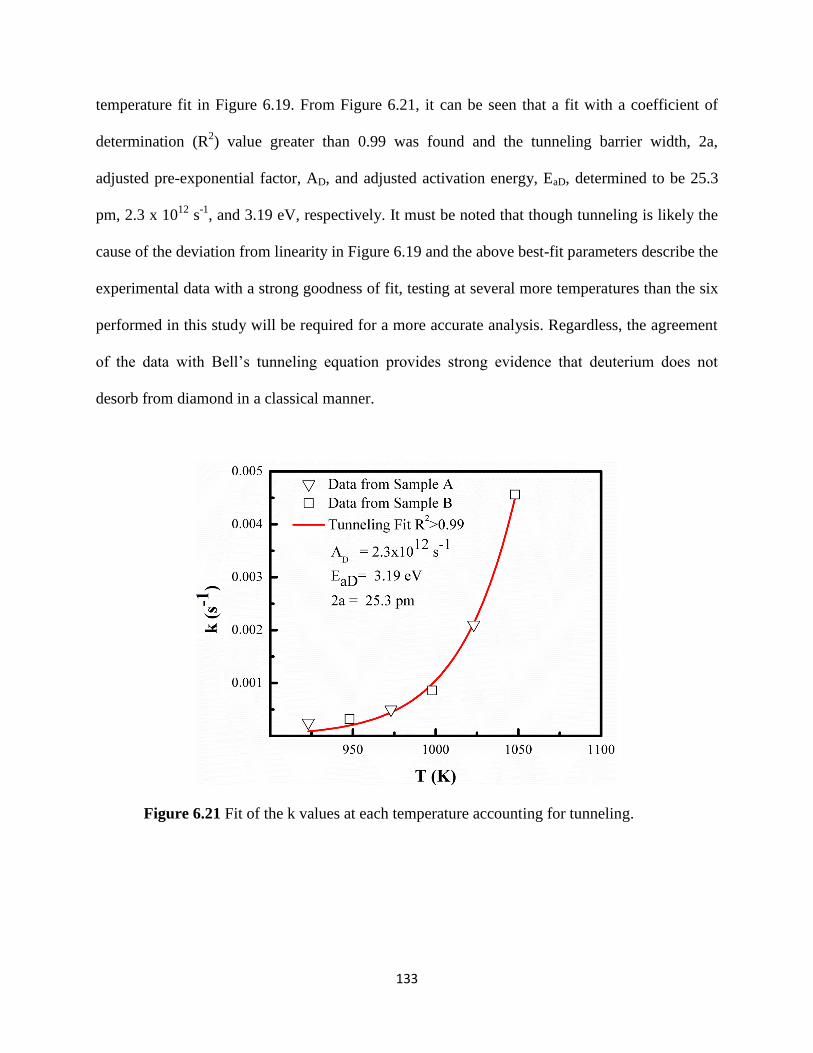
133
temperature fit in Figure 6.19. From Figure 6.21, it can be seen that a fit with a coefficient of
determination (R2) value greater than 0.99 was found and the tunneling barrier width, 2a,
adjusted pre-exponential factor, AD, and adjusted activation energy, EaD, determined to be 25.3
pm, 2.3 x 10¹²
s-1
, and 3.19 eV, respectively. It must be noted that though tunneling is likely the
cause of the deviation from linearity in Figure 6.19 and the above best-fit parameters describe the
experimental data with a strong goodness of fit, testing at several more temperatures than the six
performed in this study will be required for a more accurate analysis. Regardless, the agreement
of the data with Bell’s tunneling equation provides strong evidence that deuterium does not
desorb from diamond in a classical manner.
Figure 6.21 Fit of the k values at each temperature accounting for tunneling.
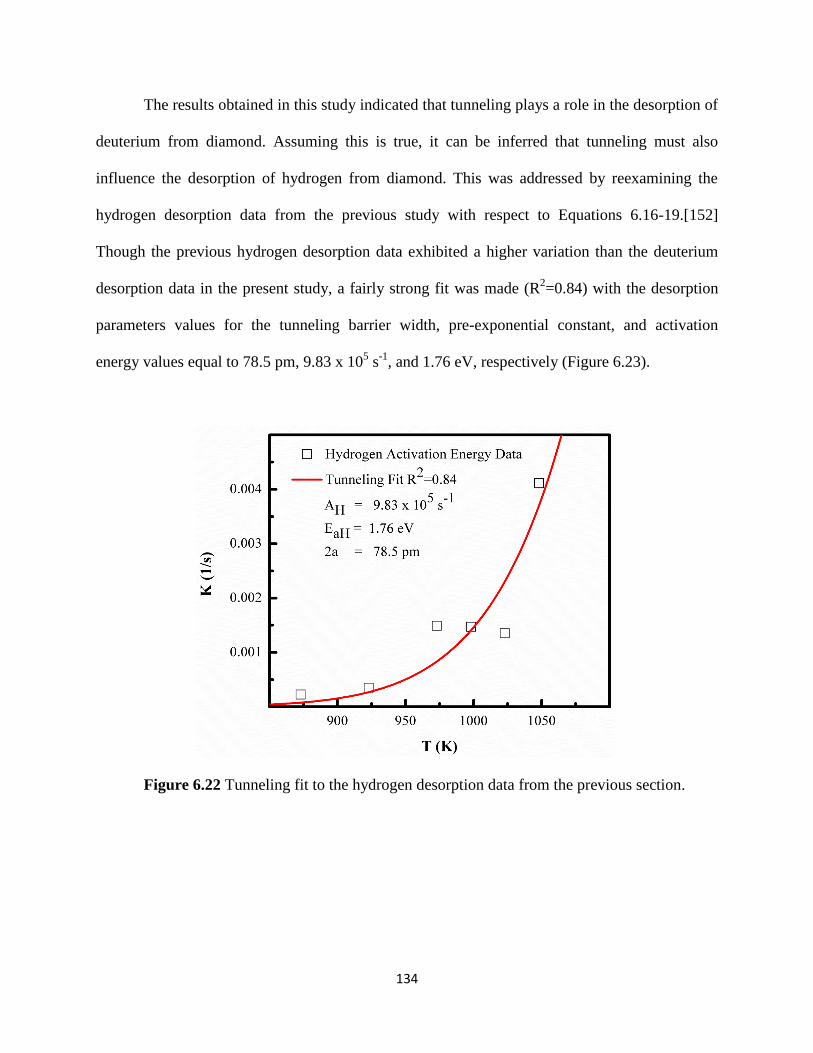
134
The results obtained in this study indicated that tunneling plays a role in the desorption of
deuterium from diamond. Assuming this is true, it can be inferred that tunneling must also
influence the desorption of hydrogen from diamond. This was addressed by reexamining the
hydrogen desorption data from the previous study with respect to Equations 6.16-19.[152]
Though the previous hydrogen desorption data exhibited a higher variation than the deuterium
desorption data in the present study, a fairly strong fit was made (R2=0.84) with the desorption
parameters values for the tunneling barrier width, pre-exponential constant, and activation
energy values equal to 78.5 pm, 9.83 x 10⁵ s
-1, and 1.76 eV, respectively (Figure 6.23).
Figure 6.22 Tunneling fit to the hydrogen desorption data from the previous section.

135
6.4.3 Summary of the desorption of deuterium from diamond
The results presented in the previous two desorption studies provide useful insight into
hydrogen’s role in the thermionic emission process from diamond films. The observed first order
decay in emission current for both hydrogenated and deuterated diamond samples is evidence
that emission current is directly proportional to the hydrogen (deuterium) concentration. Further,
the present study is the first known to suggest that the desorption reaction is non-classical with
contributions from tunneling. Lastly, the desorption of the C-D bond appeared to have a much
higher activation energy (>1eV) than the C-H bond. Though it is difficult to quantify, this higher
activation energy should allow a deuterated diamond sample to have a much higher temperature
ceiling than a corresponding hydrogenated sample resulting in improved thermionic
performance. In conclusion, the research presented thus far has performed the most detailed
study to date on hydrogen’s role in the thermionic emission behavior of diamond films. The
following chapter sought to further this research by exposing diamond films to various low
pressure gaseous environments in an effort to further increase the emission performance beyond
hydrogenation.

136
CHAPTER VII
THERMIONIC EMISSION CHARACTERIZATION OF GASEOUS ENVIRONMENTS
The work discussed in the previous chapter characterized the thermionic emission
properties of diamond films operating in a vacuum environment. It was shown that exposure to
hydrogen plasma significantly enhanced the thermionic emission performance but hydrogen’s
beneficial effects began to diminish when the diamond cathodes were either heated to high
temperatures or operated for extended periods of time. The work presented in this chapter sought
to explore a new approach, beyond hydrogenation, to increase both the thermionic emission
performance and the long term emission stability of diamond films. This approach consisted of
operating diamond thermionic cathodes in low pressure gaseous environments. Multiple gaseous
species were studied and detailed analyses of the results are presented in this chapter.
7.1 Molecular Nitrogen
The first gaseous species examined to determine its influence on the thermionic emission
performance of nitrogen-incorporated diamond cathodes was molecular nitrogen (N2). Testing
with N2 was chosen primarily to act as a control due to the easily predicable influence it should
have on the thermionic emission current. Molecular nitrogen possesses a relatively high
magnitude negative electron affinity of -1.8 eV.[163] The electron affinity is the energy
difference between the ground state of molecule and its negatively charged anion. The electron
affinity value for nitrogen indicates that the ground state of the N2 molecule lies 1.8 eV below
the anion N2- thus N2
- is unstable. Further, molecular nitrogen has an extremely high dissociation
energy of 9.8 eV and a large (relative to the diamond lattice spacing) atomic cross section of ~10-

137
17 cm
2 suggesting that no reaction, bonding, or incorporation will occur when the molecular
nitrogen is in contact with the diamond sample.[163, 164] Given these reasons, it can be
reasonably inferred that the thermionic emission performance of diamond cathodes in a nitrogen
environment would not be positively influenced, due to the reduction in electron mean-free-path.
Furthermore, R.J. Nemanich and colleagues have previously operated nitrogen-incorporated
diamond cathodes in a molecular nitrogen environment at pressure ranging from 10 mTorr to 1
Torr.[106] This study reported that no identifiable thermionic emission current enhancement was
observed.[106] Hence the present study aimed to demonstrate the experimental technique’s
ability to accurately characterize the thermionic emission performance of diamond films upon
exposure to low pressure gaseous environments.
7.1.2 Behavior of diamond thermionic cathodes in a N2 environment
Nitrogen-incorporated polycrystalline diamond cathodes were deposited according to the
method described in Section 5.1 and tested in the manner described in Section 5.4. The results
from one of the testing runs on an as-grown diamond sample can be seen below in Figure 7.1.
While more data was collected and verified on multiple separate samples, only one complete
testing run is shown as the other results exhibited the same trend. Examination of the results
confirmed the hypothesis that the thermionic emission performance of diamond cathodes in the
presence of nitrogen gas would not be positively affected. The emission current clearly decreased
from the baseline level established in high vacuum when the nitrogen was introduced into the
chamber to a pressure of ~5.5 μTorr (N2 equivalent) measured at the pump. As nitrogen is not
believed to interact favorably with the emitted electrons nor affect the diamond sample itself, it
was hypothesized here that this decrease in emission current was due to the mean-free-path
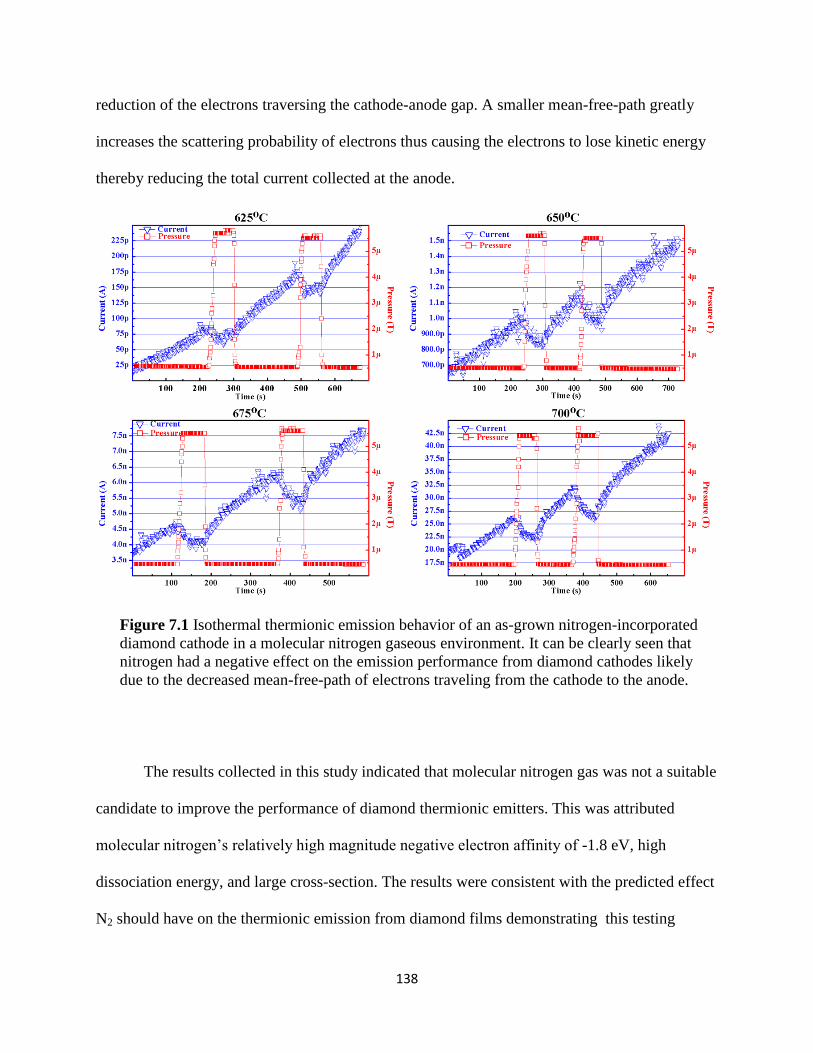
138
reduction of the electrons traversing the cathode-anode gap. A smaller mean-free-path greatly
increases the scattering probability of electrons thus causing the electrons to lose kinetic energy
thereby reducing the total current collected at the anode.
Figure 7.1 Isothermal thermionic emission behavior of an as-grown nitrogen-incorporated
diamond cathode in a molecular nitrogen gaseous environment. It can be clearly seen that
nitrogen had a negative effect on the emission performance from diamond cathodes likely
due to the decreased mean-free-path of electrons traveling from the cathode to the anode.
The results collected in this study indicated that molecular nitrogen gas was not a suitable
candidate to improve the performance of diamond thermionic emitters. This was attributed
molecular nitrogen’s relatively high magnitude negative electron affinity of -1.8 eV, high
dissociation energy, and large cross-section. The results were consistent with the predicted effect
N2 should have on the thermionic emission from diamond films demonstrating this testing

139
method’s ability to assess the emission performance of diamond films upon exposure to other
gaseous environments. The following sections sought to examine multiple other gaseous species
that may beneficially enhance the thermionic emission of nitrogen-incorporated diamond
cathodes.
7.2 Methane
It has long been known that transient negative ions (TNI) can result from the collision of
electrons with certain molecules in the gas phase. The formation of a TNI often results in two
possible outcomes.[165] One scenario, known as autodetachment, occurs when the TNI emits an
extra electron.[166] If autodetachment leaves the neutral molecule in the ground state, such that
the energy of the detached electron is equal to the incident electron, the process is known as
elastic resonant scattering.[165, 167] Conversely, inelastic resonant scattering occurs when the
neutral molecule is left in an excited state with the energy of the detached electron different than
that of the incident electron.[165, 167] The other possible scenario for a TNI is through
decomposition into stable negatively charged and neutral fragments known as dissociative
electron attachment.[165-167] Assuming the correct gaseous vapor is chosen, it was
hypothesized that dissociative electron attachment could be used to enhance the thermionic
emission properties of diamond. One possible situation could be the dissociation of a hydrogen
containing molecule that could allow for the in situ rehydrogenation of a diamond cathode
allowing for increased operational temperature, longer stability, and higher emission current.
The ability of a molecule to form a TNI is determined by its electron affinity which is
defined as the energy difference between ground states of the neutral molecule (M) and the
negatively charged molecule (M-). The electron affinity is conventionally referenced as positive

140
if the ground state of M- is energetically lower than that of M.[165, 166] The definition provides
that, for a molecule with a positive electron affinity, M- is stable when the attached electron
exists in a bound state.[165] Thus the formation of a TNI upon impact with an incident electron
typically can only occur for neutral molecules with positive electron affinities. The sign of the
electron affinity is rooted in the Pauli exclusion principal which states that no two electrons in
atom/molecule can have the same atomic numbers.[110] When an electron approaches an
atom/molecule, a dipole (or any higher multipole) moment is induced creating a binding
potential for the electron in the atom/molecule. Some substances such as noble gases have
completely occupied outer shells requiring the extra electrons to exist in shells with higher
principal quantum numbers. In such cases, the binding potential is not sufficient to bind the
electron thereby making the atom/molecule unstable resulting in a negative electron
affinity.[168] Conversely, atoms with only a single electron missing from their outer shell allow
the approaching electron to easily fill this vacancy. The binding energy in these types of atoms is
sufficient to retain the electron allowing for the existence of a stable negative ion and, therefore,
a positive electron affinity.[168]
One such molecule of interest with respect to thermionic applications is methane (CH4).
Methane has a slightly positive electron affinity of 0.083 eV allowing it to easily form a TNI
upon electron impacts.[166] Further, extensive studies of methane have demonstrated that its
TNI state decays following dissociative electron attachment forming a mixture of negatively and
positively charged products.[169-173] Previous work has also demonstrated the operation of
diamond thermionic cathodes in a high pressure (up to 700 mTorr) methane environment greatly
increased the emission performance compared to operation in a vacuum environment.[106] The

141
present study sought to further past research by examining the influence of low pressure methane
exposure on the thermionic operation of nitrogen-incorporated diamond cathodes.
7.2.1 Behavior of diamond thermionic cathodes in a CH4 environment
Nitrogen-incorporated polycrystalline diamond cathodes were deposited according to the
method described in Section 5.1 and tested in the manner described in Section 5.4. Several tests
were performed on samples in both the as-grown state and after exposure to a hydrogenation
treatment. The as-grown isothermal emission current results for each test can be seen below in
Figure 7.2. The results from the 675oC and 700
oC yielded the same behavior as those presented
below for 600oC through 650
oC and are therefore not shown. Run 1 and Run 2 below were
performed with the typical 200 Volt anode bias used in all other pervious experiments.
Examination of the as-grown diamond tests showed that no significant effect was observed upon
the introduction of methane gas into the testing apparatus. In an effort to further understand this
lack of effect, Runs 3 and 4 were performed with higher anode voltages, Run 3 at 400 V and Run
4 at 600 V. Similarly, it can be seen that no observable effect could be discerned upon the
introduction of methane gas.

142

143
Figure 7.2 Isothermal thermionic emission current behavior of an as-grown nitrogen-
incorporated diamond cathode in the presence of methane gas. Four runs were performed
and each run tested at 600oC, 625
oC, 650
oC, 675
oC, and 700
oC. Little effect can be seen
in the emission current (blue points) as methane pressure (red points) increased. Plots for
675oC and 700
oC were not shown as they exhibited the same behavior as the other
temperatures. The anode voltage was increased from 200V used in Runs 1 and 2 to 400V
in Run 3 and 600V in Run 4. Again, no effect was observed with increasing voltage.
The thermionic emission behavior of a sample after the hydrogenation treatment (which
was performed after the as-grown runs) can be seen below in Figure 7.3. Unlike the as-grown
sample, the emission current of the hydrogenated sample did exhibit some response to the
introduction of methane into the chamber. The fact that this response appeared to be positive
(emission current increased in the presence of a low pressure gaseous environment compared to a
vacuum environment) agrees with previously reported work , however, the magnitude of this
positive response was much smaller than that seen from the same previously reported work.[106]

144
Figure 7.3 Isothermal emission current testing of a hydrogenated diamond sample in the
presence of methane gas. A small positive increase in emission current (blue points) can
be seen as the methane pressure (red points) was introduced into the chamber. Plots for
the 675oC and 700
oC runs were not shown as the variations in emission current were too
large to decipher any significant changes in emission current.
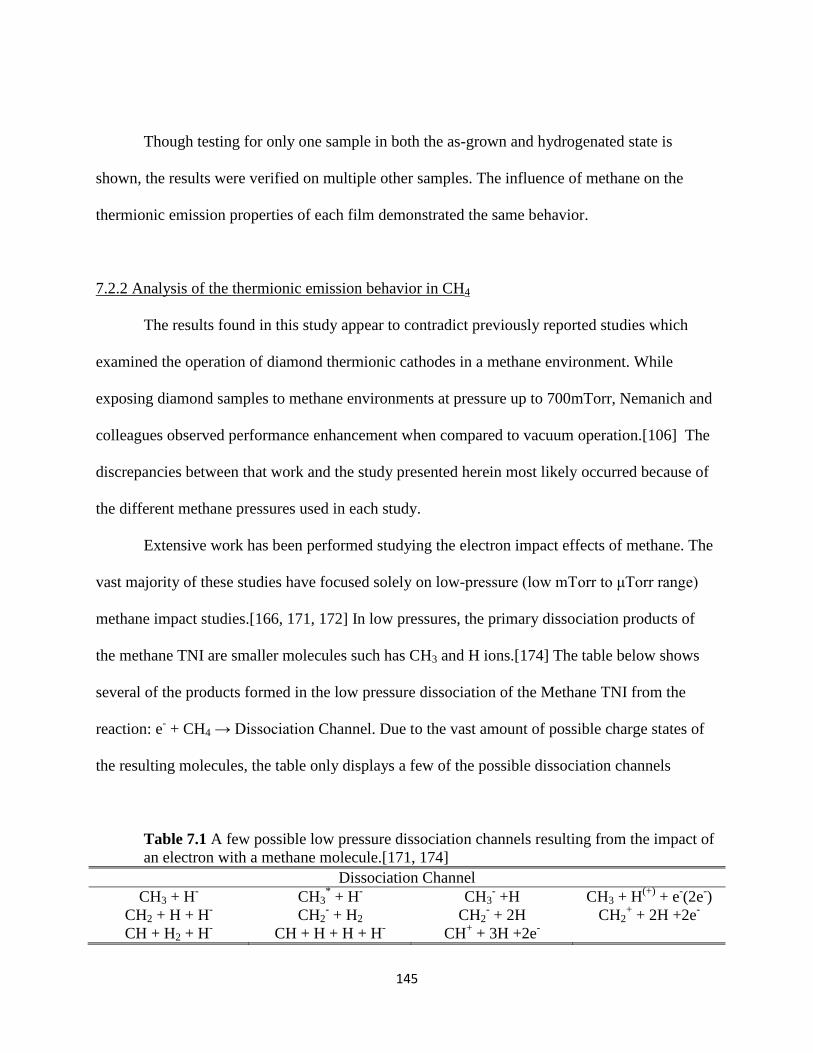
145
Though testing for only one sample in both the as-grown and hydrogenated state is
shown, the results were verified on multiple other samples. The influence of methane on the
thermionic emission properties of each film demonstrated the same behavior.
7.2.2 Analysis of the thermionic emission behavior in CH4
The results found in this study appear to contradict previously reported studies which
examined the operation of diamond thermionic cathodes in a methane environment. While
exposing diamond samples to methane environments at pressure up to 700mTorr, Nemanich and
colleagues observed performance enhancement when compared to vacuum operation.[106] The
discrepancies between that work and the study presented herein most likely occurred because of
the different methane pressures used in each study.
Extensive work has been performed studying the electron impact effects of methane. The
vast majority of these studies have focused solely on low-pressure (low mTorr to μTorr range)
methane impact studies.[166, 171, 172] In low pressures, the primary dissociation products of
the methane TNI are smaller molecules such has CH3 and H ions.[174] The table below shows
several of the products formed in the low pressure dissociation of the Methane TNI from the
reaction: e- + CH4 → Dissociation Channel. Due to the vast amount of possible charge states of
the resulting molecules, the table only displays a few of the possible dissociation channels
Table 7.1 A few possible low pressure dissociation channels resulting from the impact of
an electron with a methane molecule.[171, 174]
Dissociation Channel
CH3 + H-
CH3* + H
- CH3
- +H CH3 + H
(+) + e
-(2e
-)
CH2 + H + H-
CH2- + H2 CH2
- + 2H CH2
+ + 2H +2e
-
CH + H2 + H-
CH + H + H + H-
CH+ + 3H +2e
-

146
At higher pressures, such as those studied by R.J. Nemanich and colleagues, the products
of the methane TNI dissociation haven been shown to be much more complex than those in
Table 7.1.[106] G. Drabner and colleagues performed an extensive study to examine the products
of the dissociation of methane as a function of pressure.[171] Their study found that three
different types of products can be formed by increasing the pressure which can be classified into
primary, secondary and tertiary products. The primary products have m/z values equal to 12, 13,
14, 15, and 16 corresponding to C, CH, CH2, CH3, and CH4 respectively.[171] The secondary
products consist of products with m/z values of 17, 26, 27, 28, and 29 while the tertiary products
consist of m/z values equal to 39, 41, and 43. The percent of ionization of these species as a
function of pressure digitized from Drabner and colleagues’ study is presented below in Figures
7.4-6.[171]
Figure 7.4 Semi-log plots of the percent of total ionization of the primary methane
dissociation products as a function of pressure. Data has been digitized from a previous
study by G. Drabner and colleagues.[171]

147
Figure 7.5 Semi-log plots of the percent of total ionization of the secondary methane
dissociation products as a function of pressure. Data has been digitized from a previous
study by G. Drabner and colleagues.[171]
Figure 7.6 Semi-log plots of the percent of total ionization of the tertiary methane
dissociation products as a function of pressure. Data has been digitized from a previous
study by G. Drabner and colleagues.[171]
Figures 7.4-6 obtained from Drabner and colleague’s study indicate that the formation of
primary products all greatly increase at lower pressures while the secondary and tertiary
products tend to increase at higher pressures.[171] It then follows that the discrepancies between
the results presented in Figures 7.2 and 7.3 and the study by Nemanich can likely be attributed to
148
the largely differential dissociation products of methane upon electron impact arising from the
vastly different pressures used in each study. It is yet to be determined why the formation of
more complex carbon chains such as the secondary and tertiary products would be more
beneficial to the thermionic emission current from diamond cathodes than the simple carbon
compounds found in the primary products. In summary, this study showed methane to have some
enhancing effects on the thermionic emission performance of diamond cathodes. However, this
enhancement is greatly dependent on pressure.
7.3 Water vapor
The next study to be discussed examined the operation of thermionic devices in a low
pressure water vapor environment. With a relatively high electron affinity of 1.8 eV (compared
to other species), water vapor was not expected to have an enhancing effect on the thermionic
emission from diamond based on the previously discuss theory dealing with transient negative
ions. However, there are several other reasons to study water vapor. First, there is some debate
amongst previously reported work as to how water affects the electron emission from diamond.
Several studies have reported that interaction of water vapor with the diamond surface lowers the
electron affinity. Water vapor disassociates upon interaction with diamond into H and OH, both
of which bond with the diamond surface creating a dipole that promotes negative electron
affinity.[175, 176] Other studies contradict these results such as one by G. Piantanida et al.
While observing the influence of moderate (200-300oC) heat treatments on the photoemission
from diamond cathodes, G. Piantanida et al concluded that water vapor increased the electron
affinity. Using information obtained from XPS and UPS data of their diamond films, G.
Piantanida et al developed a surface dipole model and calculated this increase to be 0.8 eV

149
compared to a hydrogenated surface.[177] With these two contradicting theories, it was clear that
there is much that can be learned by studying the thermionic emission from diamond in a low
pressure water vapor environment. Further, should there be an enhancing effect, water vapor
would be a more attractive candidate than other gaseous species as it is abundant, readily
available, non-toxic, and inflammable.
7.3.1 Behavior of diamond thermionic cathodes in a H2O environment
Nitrogen-incorporated polycrystalline diamond cathodes were deposited according to the
method described in Section 5.1 and tested in the manner described in Section 5.4. The delivery
method of water vapor in to the vacuum chamber was discussed in Section 5.2.2. Experimental
difficulties restricted testing to only a hydrogenated diamond sample. The data obtained for all
testing runs (Figure 7.7) indicated that water vapor has a definite effect on the thermionic
emission behavior from hydrogenated diamond films. This effect appeared to be different at
lower temperatures than at higher temperatures. It can be seen in that, at lower temperatures
(600oC and 625
oC), the thermionic emission current increased in the presence of water.
Conversely, at higher temperatures (675oC and 700
oC), the thermionic emission decreased when
water vapor was added to the system. Testing at 650oC appeared to be a transition temperature
given that during the first two testing runs, the emission current decreased but during the second
two testing runs, the emission current first increased when water vapor was added then began to
decrease such that there was a resulting net negative effect.

150

151

152
Figure 7.7 Thermionic emission current behaviors of diamond films operating in a low pressure
water vapor environment. The four testing runs shown are categorized by the temperature at
which they were performed and are labeled accordingly. It can be seen that the emission current
increased in the presence of water vapor at the lower temperatures but increased at higher
temperatures.
7.3.2 Analysis of the thermionic emission behavior in H2O
The results obtained in this study indicate that water vapor has a varying effect on the
thermionic emission from diamond cathodes based on temperature. It has been previously shown
by A. Laikhtman et al that water vapor interacts differently with a hydrogenated diamond surface
than with a bare hydrogen surface.[178] They observed that the exposure of a bare diamond
surface to water vapor resulted in a large amount of it dissociating forming of C=O, C-O-H, and
C-H chemisorbed surface structures that were mostly stable until annealing at 300oC for two
hours.[178] Conversely, it was determined that the exposure of water vapor to a hydrogenated

153
diamond surface did not disassociate to form chemisorbed surface structures, rather it
physisorbed into and on the diamond.[178] Though physiosorbed water on the diamond surface
has been shown to increase the surface conductivity, it is believed to readily desorb at
temperatures as low as 90oC.[178, 179] In order to better analyze the varying effect water vapor
has on the thermionic emission behavior from diamond films, Table 7.2 below has been prepared
describing the emission current response right as the leak valve was opened (Beginning), the
trend during the ~60 seconds it was open (During), the response as the leak valve was closed
(End), and the resulting net change in current (Result) for each testing run.
Table 7.2 Qualitative description of the response of the emission current to the presence
of water vapor
Current Response to Leak
Temperature
(oC) Run
Current Range
(A) Beginning During End Result
600 1 10u-50u Increase Increasing Decrease Increase
600 2 150n-240n Increase Stable Decrease Increase
600 3 20n-50n Increase Stable Decrease Increase
600 4 8n-14n Increase Stable Decrease Increase
625 2 500n-640n Increase Decreasing Decrease None
625 3 100n-135n Increase Decreasing Decrease None
625 4 30n-38n Increase Decreasing Decrease Decrease
650 1 12.5u-32u Decrease Stable Increase None
650 2 1.1u-1.3u Decrease Decreasing Increase Decrease
650 3 225n-350n Increase Decreasing Increase Decrease
650 4 50n-70n Increase Decreasing None Decrease
675 2 1.6u-2u Decrease Decreasing Increase Decrease
675 3 200n-340n Decrease Decreasing None Decrease
675 4 50n-110n Decrease Decreasing Increase Decrease
700 1 5u-20u Decrease Stable Increase Increase
700 2 1.7u-2.1u Decrease Decreasing Increase None
700 3 250n-400n Decrease Decreasing None Decrease
700 4 90n-120n Decrease Decreasing Increase Decrease
154
Table 7.2 indicates that at the lowest tested temperatures (600oC and 625
oC), water vapor
had a positive effect on the thermionic emission current. It has been previously discussed that
water vapor is thought to physiosorb into a hydrogenated diamond sample which increases the
surface conductivity of diamond.[178] As this experiment dealt with a polycrystalline diamond
sample, water vapor likely absorbed into the grain boundaries of the diamond increasing the
overall conductivity of the film. A likely explanation for the results found in the low temperature
tests may then be as follows: (1) Water vapor is fed into the chamber and is physiosorbed into
the diamond grain boundaries. (2) The physiosorbed water vapor increases the conductance
throughout the diamond film which in turn causes an augmented flux of electrons traveling
normal to the diamond surface.[175] This larger amount of electrons available for emission
increases the emission current from the sample which was reflected in the data. (3) The water
vapor readily desorbs at these temperatures but is constantly replenished as long as water vapor
is continually fed into the chamber. (4) When the water vapor is shut off, the majority of this
water vapor desorbs causing the emission current to decrease back towards pre-water vapor
levels. (5) For the 600oC tests, the emission current did not fully decrease down to the pre-water
vapor because the temperature was not high enough to fully desorb all water vapor absorbed into
the sample. The result was a net positive increase in emission current. Conversely, at 625oC it
was observed that the emission current fully decreased down to pre-water vapor levels. This is
likely due to the slightly higher testing temperature which caused more of the water vapor to be
desorbed from the diamond terminating all its emission current enhancing effects. The observed
low temperature response of the emission current to the presence of water vapor could also be
explained by the dissociation of the water molecules.

155
The heating of the diamond samples for testing will inevitably result in hydrogen
desorption from the diamond surface based on the previous desorption experiments. This is
clearly evident when observing the sharp decreasing current trend in 600oC Run 1 test which was
the first test performed after hydrogenation. The desorption of hydrogen results in a vacancy
with a higher electron affinity (thus lower emission current) at that site unless it gets filled by a
hydrogen atom diffusing from the bulk. When water vapor is fed into the chamber, it has been
shown to disassociate and chemisorb onto bare unhydrogenated surfaces forming C-H and C-OH
bonds, both of which invoke a negative electron affinity which promotes electron emission.[175,
176] This process could possibly be happening, filling the poorly emitting surface carbon
vacancies allowing for the observed increased emission. Studies have indicated that the C-OH
bond is not stable upon annealing for extended periods at temperatures of 500oC.[175, 180]
Accordingly, the C-OH bonds are then desorbing at a much faster rate than the C-H bonds but
are being constantly replenished as long as water vapor is being fed into the chamber. When the
water vapor is shut off, the hydroxyl molecules rapidly desorb causing the emission to quickly
decrease. Per the Arrhenius equation discussed in the previous chapter, the hydroxyl groups will
desorb slower at 600oC than at 625
oC accounting for the observation that water vapor resulted in
a net increase in emission current at 600oC but net zero change at 625
oC. Both of the proposed
processes explain the observed low temperature effects and are supported by literature. It is yet
to be determined which process is more accurate due to the lack of previously reported work on
this topic.
At higher temperatures, 675oC and 700
oC, the findings indicated that water vapor
negatively affected the electron emission current. When the water vapor was first introduced into
the vacuum chamber, emission current was observed to decrease followed by a decreasing trend

156
during the period the valve was open. Upon closure of the valve, a majority of the tests
demonstrated an increasing trend but the current never reached levels up to the pre-leak trend
resulting in a net negative effect. Though no previously reported research has observed an effect
such as this, it is possible to make a hypothesis. The proposed process is as follows: (1) Water
vapor is leaked into the chamber and dissociates form C-H and C-OH bonds.[175, 176] This
dissociation occurs because several of the surface C-H bonds have been broken due to the
desorption that occurs during testing. (2) According to L.M Struck and M.P. D’Everlyn, many of
the C-OH bonds will further decompose into a mixture of C-O-C, C-H, and C=O bonds when
heated to temperatures on the order of 1000oC.[181] Studies have indicated that the C-OH bond
(unlike the C-H bond) is not stable upon annealing to temperatures of 500oC for several
hours.[175, 180] Further, the stability of the water induced surface groups follows the order of
OH > C-O-C > C=O. Therefore, it can be inferred that the oxide containing groups other than C-
OH are also unstable upon annealing to temperatures of 500oC.[175, 180] The oxide containing
species will constantly desorb from the surface and be replenished while the leak valve is open.
(3) The resulting activated oxygen resulting from the desorption of the oxide containing
molecules has been reported to cause the abstraction of chemisorbed hydrogen (C-H
bonds).[182] Based on results from previously conducted experiments, the removal of this
hydrogen will lead to decreased emission current. (4) When the leak valve is closed and water
vapor is no longer fed into the chamber, the oxide containing species will be removed. (5) The
observed increase in emission current toward pre-water vapor levels could be explained by the
“percolation” of hydrogen diffusing from inside the bulk of the diamond to fill some of the
newly vacant surface sites. It is expected that a large amount of the hydrogen contained in and on
the diamond will be removed due to water vapor providing a smaller number of hydrogen atoms

157
available for diffusion to the surface. This may explain the small increase in emission current and
the net negative emission current compared to pre-water vapor levels.
In summary, water vapor was observed to affect the thermionic emission from diamond
films both positively and negatively depending on temperature. Multiple explanations have been
proposed based on previously reported work which attempt to describe the observed effects. This
experiment indicated that water vapor could potentially enhance the thermionic emission of
diamond under certain conditions but more research will be required to determine these
conditions.
7.4 Molecular hydrogen
The previous vacuum thermionic emission studies discussed in Chapter VI demonstrated
hydrogen to have a definite beneficial effect on the thermionic emission properties of diamond
films. The present study sought to examine the operation of diamond thermionic cathodes in a
low pressure hydrogen environment. It was believed that this could both potentially allow for
better thermionic emission performance and provide a better understanding of how hydrogen
affects the electronic properties of diamond. Though the molecular hydrogen anion is the
simplest of all molecular anions, it has proven to be one of the more widely debated topics in
molecular physics over the past 50 years. Interestingly, it was not until recently that the existence
of the molecular hydrogen anion had even been verified.[183, 184]
The earliest calculations regarding the molecular hydrogen anion were performed by H.
Eyring and colleagues who mathematically demonstrated that the energy required to dissociate
H2- into H and H
- was positive. This positive energy requirement to dissociate means that energy
must be added to the system in order for the reaction to occur, thus implying H2- to be

158
stable.[168, 185] The stability of the molecular hydrogen anion would appear to indicate H2 to
have a positive electron affinity. However, all previous attempts to calculate the electron affinity
of molecular hydrogen have been in disagreement with each other and a large range of electron
affinity values reported, both negative and positive.[168, 186-188] Experimental observation of
H2- has been reported several times beginning with V.I. Khvostenko and V.M. Dukel’skii in
1957.[189, 190] However, results have been met with skepticism due the experimental difficulty
of deciphering H2- from the stable atomic deuterium anion.[189] It has not been until recently (in
the last decade) that the existence and behavior of H2- been experimentally observed with enough
confidence to be accepted by the scientific community.[184, 189, 191] It is clear that many
challenges still exist to understand molecular hydrogen making it difficult to predict its influence
on the thermionic emission from diamond films.
7.4.1 Behavior of diamond thermionic cathodes in a H2 environment
Nitrogen-incorporated polycrystalline diamond cathodes were deposited according to the
method described in Section 5.1 and tested in the manner described in Section 5.4. The delivery
method of molecular hydrogen in to the vacuum chamber was discussed in Section 5.2.2. The
present study examined diamond films in both the as-grown and hydrogenated state. Though the
results from only one sample are presented below, the data was verified by testing multiple other
samples.
Emission current and pressure plotted against time for the sample in the as-grown state
can be seen below in Figure 7.8. Upon inspection, it was immediately identified that leaking in
hydrogen had a positive effect on the emission current at every temperature for each of the three
runs on the as-grown sample at temperatures of 600oC, 625
oC, and 650
oC. The emission current

159
increased from the baseline trend when hydrogen was introduced into the chamber and decreased
back toward the baseline trend when the hydrogen was shut off. Further inspection of the plots in
Figure 7.8 indicated an increasing baseline trend for each run with increasing time. This trend is
somewhat counter intuitive to the results previously found in the hydrogen activation energy
experiment in which it was seen that the emission current decreased (rather than increased) with
increasing time. Though no known reported work has observed this increasing trend, speculation
can be made as to its cause.
The previous hydrogen activation energy experiment was performed using a
hydrogenated sample whereas the data collected for Figure 7.8 was performed with an as-grown
sample. It is believed that a hydrogenated sample has virtually all dangling surface bonds
occupied by a hydrogen atom. As the sample is heated, the hydrogen atoms desorb from the
surface into the vacuum resulting in decreased emission. In short, a fully hydrogenated diamond
sample cannot emit any better. The reason for the poor emission from an as-grown sample,
compared to a hydrogenated sample, may be because a large number of the surface carbon atoms
are not bonded with a hydrogen atom. They are likely either dangling or bonded to a non-
emission enhancing species such as the hydroxyl ion that easily desorbs when heated. The
explanation for the increasing current trend with time seen below is thought to lie in the
deposition process. As the samples were grown in a hydrogen-rich, methane-starved
environment, a substantial amount of hydrogen was likely deposited within the bulk of the
diamond films. When the diamond films were heated during testing, these hydrogen atoms
diffused throughout the diamond and to the surface, bonding with some of the surface carbon
atoms. When these bonds were made, emission current was enhanced. Though it is not believed
that the emission current would ever increase to the levels seen in fully hydrogenated samples, a

160
small increase occurred (similar to a conditioning process) as observed in the results seen in
Figure 7.8. Emission current variations in the 675oC and 700
oC tests made the response of
emission current to the introduction of molecular hydrogen difficult to decipher, and are
therefore not shown.
Isothermal testing of the sample post hydrogenation treatment demonstrated a similar
response to the as-grown sample, but with much higher emission current values (Figure 7.9). The
first runs all exhibited a decreasing current trend that was expected given the previous hydrogen
desorption experiments. Again, the data from the higher temperatures was not shown as the
background current variations were too large to accurately quantify the current response to
hydrogen.

161
Figure 7.8 Isothermal emission current behavior of an as-grown diamond film with
hydrogen leaked in for the temperature 600oC, 625
oC, and 650
oC. The blue data
represents the current while the red data represents the pressure in the chamber. For all
graphs, it can clearly be seen that there was an increase in emission current when the
hydrogen pressure was increased in the chamber.

162
Figure 7.9 Isothermal emission current behavior of a hydrogenated diamond film with
hydrogen leaked in for the temperatures 600oC, 625
oC, and 650
oC. The blue data
represents the current while the red data represents the pressure in the chamber. For all
graphs, it can clearly be seen that there was an increase in emission current when the
hydrogen pressure was increased in the chamber.
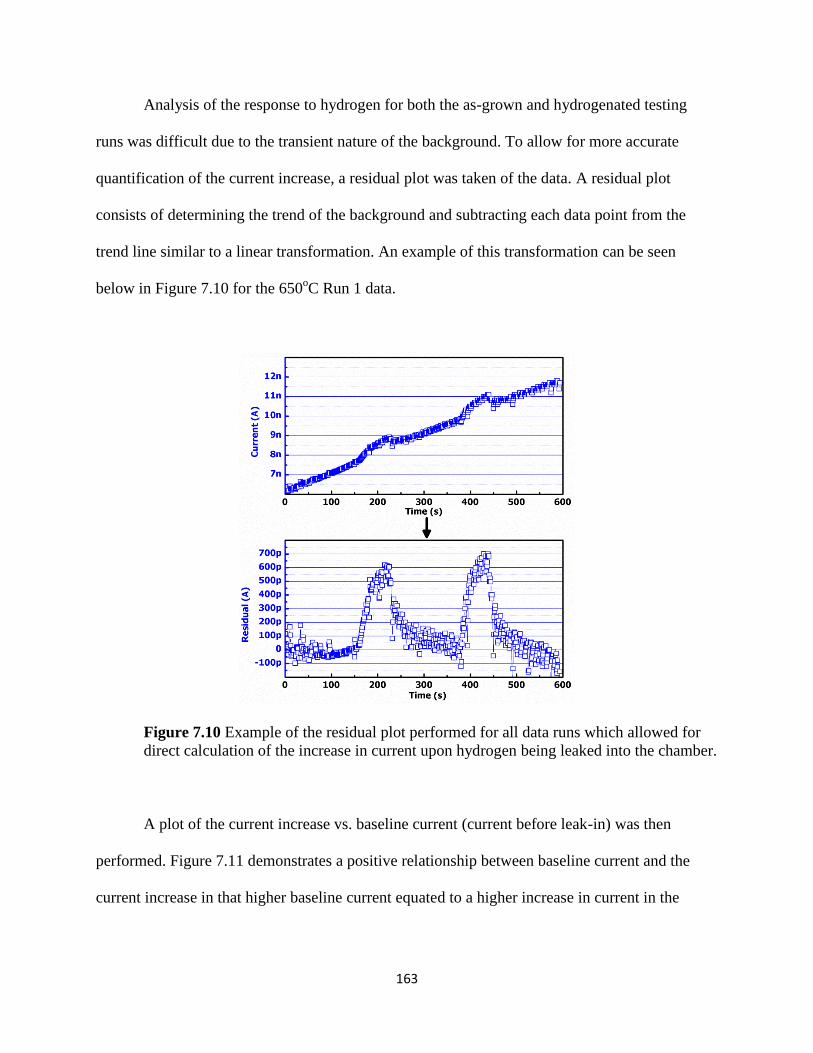
163
Analysis of the response to hydrogen for both the as-grown and hydrogenated testing
runs was difficult due to the transient nature of the background. To allow for more accurate
quantification of the current increase, a residual plot was taken of the data. A residual plot
consists of determining the trend of the background and subtracting each data point from the
trend line similar to a linear transformation. An example of this transformation can be seen
below in Figure 7.10 for the 650oC Run 1 data.
Figure 7.10 Example of the residual plot performed for all data runs which allowed for
direct calculation of the increase in current upon hydrogen being leaked into the chamber.
A plot of the current increase vs. baseline current (current before leak-in) was then
performed. Figure 7.11 demonstrates a positive relationship between baseline current and the
current increase in that higher baseline current equated to a higher increase in current in the

164
presence of hydrogen. Two possible trend lines were found that describe the observed the data,
one linear, the other a power function.
Though the power trend line has a higher coefficient of determination (R2), it is unlikely
that a physical model can be derived with which it is consistent. This is due to both the
dependent and independent variables being in units of Amperes. Examination of the equation for
the power trend lines implies that there is some constant (units unknown) that is multiplied by
amperes to the 0.8754 power. As the result of this product must be in Amperes, the constant must
have units of amperes raised to the 0.1246 power which is highly improbable. Thus, a more
likely description is the linear trend line.
The linear fit to the data seen in Figure 7.11 implies the baseline current can be related to
the current increase by means of a simple unit-less constant. Further, the calculated linear trend
line has a y-intercept of 0. This follows intuition given that when there is no baseline current
(which happens at 0K as described by the Richardson equation), there can be no increase in
emission current.
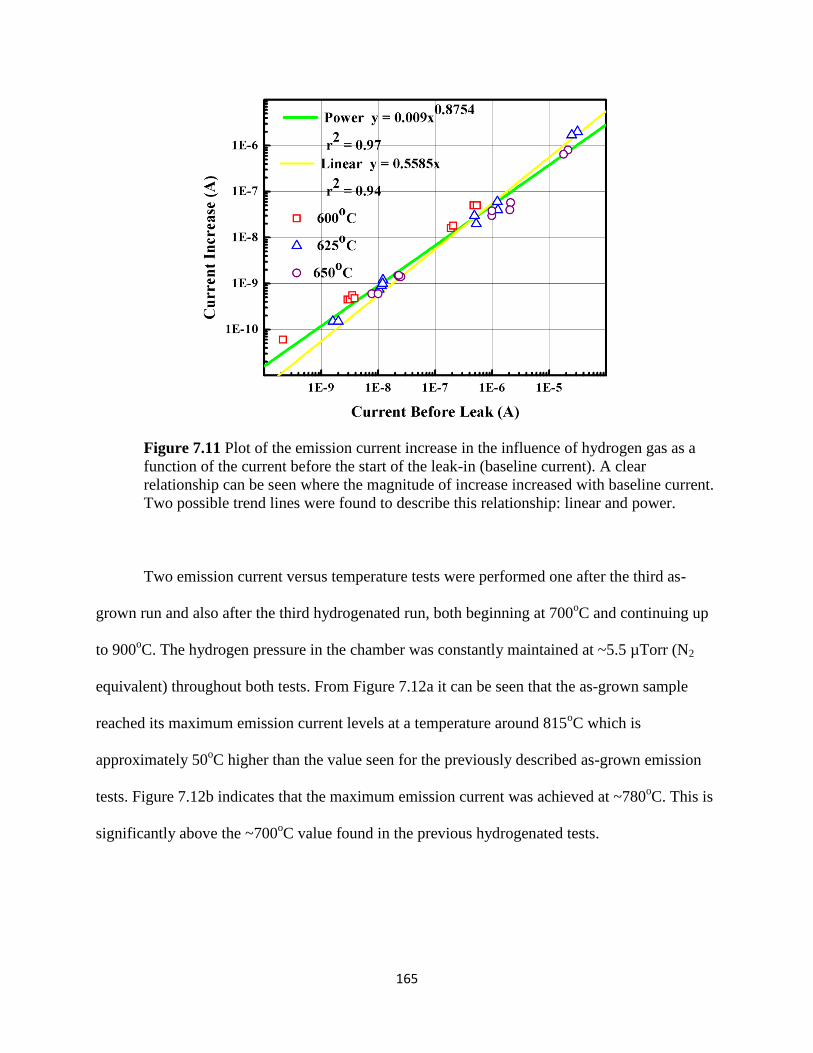
165
Figure 7.11 Plot of the emission current increase in the influence of hydrogen gas as a
function of the current before the start of the leak-in (baseline current). A clear
relationship can be seen where the magnitude of increase increased with baseline current.
Two possible trend lines were found to describe this relationship: linear and power.
Two emission current versus temperature tests were performed one after the third as-
grown run and also after the third hydrogenated run, both beginning at 700oC and continuing up
to 900oC. The hydrogen pressure in the chamber was constantly maintained at ~5.5 µTorr (N2
equivalent) throughout both tests. From Figure 7.12a it can be seen that the as-grown sample
reached its maximum emission current levels at a temperature around 815oC which is
approximately 50oC higher than the value seen for the previously described as-grown emission
tests. Figure 7.12b indicates that the maximum emission current was achieved at ~780oC. This is
significantly above the ~700oC value found in the previous hydrogenated tests.

166
Figure 7.12 Plots of the emission current vs. temperature after the third testing runs for
the as-grown (a) and hydrogenated (b) diamond sample.
7.4.2 Analysis of the thermionic emission response to H2
The above results indicate that the incorporation of hydrogen gas into the cathode-anode
gap did indeed have an enhancing effect. The positive correlation between baseline current and
emission current increase seen in Figure 7.11 is evidence that the reaction was a result of the
electrons traversing the vacuum gap rather than direct interaction between the heated cathode
and the molecular hydrogen. Attempts to hydrogenate diamond with molecular hydrogen have
only proven successful at temperatures in excess of 400oC.[192, 193] The lack of temperature
dependence on the emission current increase seen in the overlap of data points at different

167
temperatures in Figure 7.11 implies that a similar effect must have occurred at all three tested
temperatures. Assuming this to be true, two possible explanations are proposed to describe the
observed behavior which are consistent with previously reported work.
The first possible explanation deals with the in-situ rehydrogenation of the diamond
films. As noted in previous sections, the beneficial effects hydrogen has on the thermionic
emission from diamond films are due to atomic hydrogen bonding with the surface carbon atoms
reducing the electron affinity. In the typical hydrogenation treatment, the atomic hydrogen
results from the dissociation of molecular hydrogen into atomic hydrogen due to electron
collisions. The electrons are stimulated by the microwaves in the MPCVD chamber such that
they oscillate with high enough energy that when they collide with molecular hydrogen, they
ionize and split into two hydrogen atoms. The atomic hydrogen then bonds with the diamond
surface forming C-H bonds which are favorable for thermionic emission. This same effect may
be happening when the diamond thermionic cathodes are in operation in a molecular hydrogen
environment. As electrons are emitted from the diamond and accelerated towards the anode, they
likely collide with the hydrogen present in the interelectrode gap. These electrons will have a
large range of energies as described by Fermi-Dirac statistics with some high enough to cause
the molecular hydrogen to ionize and dissociate. Some of this atomic hydrogen will migrate to
the diamond cathode filling the dangling surface bonds thus increasing the emission current.
When the hydrogen is shut off and evacuated from the chamber, these new emission sites desorb
per Arrhenius rate kinetics causing the emission current to decrease back down toward the
baseline levels. If this is the case, then this effect should increase when more electrons are
traversing the vacuum gap (higher emission current) which was observed in Figure 7.11.

168
A second explanation deals with the mitigation of space-charge effects. During testing,
the cathode and anode were biased at a fixed potential difference of 200V. Space charge effects
arise when electrons begin traversing the gap between the cathode and anode. Each electron has
a negative charge that cancels out some portion of the 200V potential difference; so higher
emission current levels result in a larger portion of the potential being canceled. The lower the
potential the cathode sees, the lower the EMF to accelerate electrons to the anode and thus a
lower emission current. The operation of the diamond thermionic emission devices in a hydrogen
atmosphere could possibly cancel out some of this effect through the ionization of the molecular
hydrogen. The ionization of molecular hydrogen results in two products: electrons with a
negative charge, and ionized hydrogen with a positive charge. The negatively charged electrons
will be attracted to the anode while the positively charged ions will proceed to the cathode. From
the cathodes perspective, this accumulation of positive ions at the cathode surface will resemble
the positive bias originally applied, canceling out some of the space-charge effects and
increasing the emission current. As more emission current would result in the creation of more
positive ions, it is to be expected that a higher increase in emission current upon exposure to
hydrogen gas would be seen which also agrees with the results obtained in Figure 7.11.
Both these postulated mechanisms are consistent with the observed increase in emission
current upon exposure of diamond films to a low pressure hydrogen environment. It is not clear
which explanation is satisfactory or rather, if the observations in this study can be better
explained by a combination of the two. In any case, it was determined that the emission current
increases by roughly 50% which is extremely favorable for thermionic emission applications.

169
7.4.3 Increased operating temperature in H2
In addition to the increase in isothermal emission current, the introduction of hydrogen
into the interelectrode cathode-anode gap appeared to increase the temperature at which the
emission current began the “roll over” behavior thus allowing for increased operating
temperatures. The plots in Figure 7.12 indicate that operation in a 5.5 µTorr (N2 equivalent)
hydrogen environment increased the emission temperature “ceiling” of diamond films. The
insufficient information available on the interaction of molecular hydrogen with diamond at the
elevated temperatures tested in the present study makes it difficult to provide a suitable
explanation for the observed behavior. Additionally, the reaction between molecular hydrogen
and incident electrons is still a hotly debated topic. Ample evidence has been offered to justify
that hydrogen desorption is the cause of the emission current roll over seen in the vacuum
experiments presented in Chapter VI. Hence, the faster the hydrogen desorbs, the lower the
temperature will be at which the current begins to decrease. Thus it was posited that the
increased temperature ceiling seen in Figure 7.12 was likely due to some amount of in situ
rehydrogenation of the diamond surface. As the hydrogen desorbed from the surface, the
molecular hydrogen provided additional hydrogen atoms to fill the newly formed vacancies
which allowed the thermionic emission process to continue.
Both the as-grown and hydrogenated samples began the typical “roll over” behavior at
much higher temperatures compared to vacuum operation which is desirable for thermionic
energy conversion applications. Before the “roll over”, diamond electron emission followed the
Richardson equation, whereby emission current increased exponentially with increasing
temperature. It was then concluded that the operation of diamond thermionic cathodes in a low

170
pressure hydrogen environment allowed for higher emission current levels to be achieved which
would directly equate to a better performing thermionic energy conversion device.
7.5 Nitrous Oxide
The final gaseous species studied in the present research was nitrous oxide (N2O).
Nitrous oxide is one of the most studied species that undergoes dissociative electron attachment.
Though the electron affinity N2O is widely accepted to be slightly positive at 0.2 eV,[194, 195]
other experimental and theoretical calculations have reported different values.[196-198]
Regardless of the reported electron affinity discrepancies, the dissociative electron attachment of
N2O (Equation 7.1) has been extremely useful in mass spectrometry applications concerning the
O- radical anion.[199]
→ (7.1)
It has been previously discussed that past thermionic energy converters utilized tungsten
cathodes with cesium vapor fed into the cathode-anode gap. Among other reasons, this cesium
was meant to mitigate space charge. In such a scenario, electrons emitted from the cathode
collide with the vapor causing the cesium to ionize. The positively charged molecules then
migrate to the cathode while the negatively charged ions travel to the cathode resulting in
decreased space charge effects.[114] Observation of the dissociative electron attachment reaction
nitrous oxide undergoes (Eq. 7.1) indicates that no positively charged ions will be formed. Thus,
the space charge effects which limit the performance of a thermionic emission device will be
further magnified by the addition of another negatively charged species present in the cathode-
anode gap. Previous studies examining the reactivity of nitrous oxide with diamond have not
observed any adsorbed states of N2O on a clean C(100) surface by either EELS (high-resolution
171
electron energy loss spectroscopy) or TDS (thermal desorption spectroscopy) techniques.[200]
These properties indicate that nitrous oxide should only have a strong negative effect on the
thermionic emission performance of diamond cathodes. The present study was meant to examine
this hypothesis in an effort to add further validity to both the experimental technique used in all
of the gaseous studies and also to the analyses presented for results obtained from the above
studies.
7.5.1 Behavior of diamond thermionic cathodes in a N2O environment
Nitrogen-incorporated polycrystalline diamond cathodes were deposited according to the
method described in Section 5.1 and tested in the manner described in Section 5.4. The delivery
method of nitrous oxide in to the vacuum chamber was discussed in Section 5.2.2. The present
study examined diamond films in both the as-grown and hydrogenated state.
The thermionic emission current response of an as-grown nitrogen-incorporated
polycrystalline diamond sample to the introduction of nitrous oxide is shown below in Figure
7.13. The graphs from 650oC and 700
oC are not shown as the response was difficult to decipher
do to large variations in the emission current. At all temperatures, a small change in emission
current was observed for each testing run. It appeared that nitrous oxide had a negative effect
such that the emission current decreased with respect to vacuum levels when the gas was
introduced into the chamber.
Testing after exposing the sample to a hydrogenation treatment demonstrated a more
dramatic effect compared to the as-grown sample. From Figure 7.14, it can be seen that a
decrease in emission current resulted from the introduction of nitrous oxide. As the leak valve
was opened and N2O fed into the chamber, a sharp decline in emission current was observed.
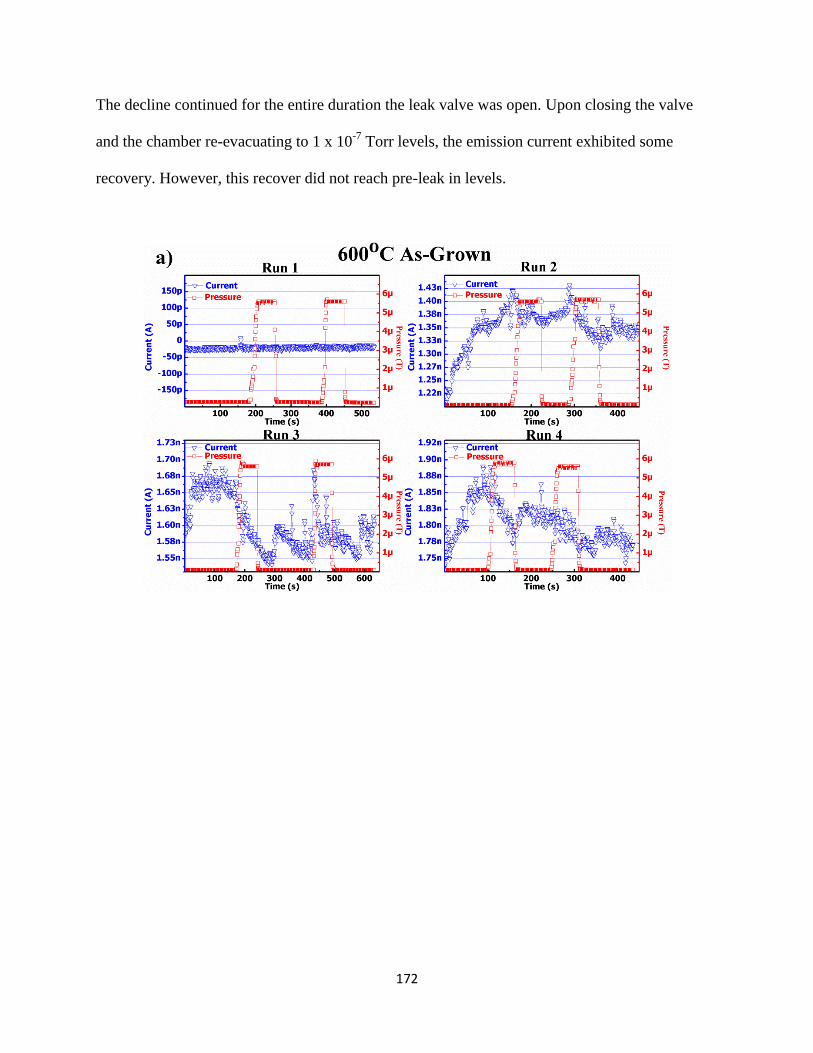
172
The decline continued for the entire duration the leak valve was open. Upon closing the valve
and the chamber re-evacuating to 1 x 10⁻⁷
Torr levels, the emission current exhibited some
recovery. However, this recover did not reach pre-leak in levels.

173
Figure 7.13 Emission current response of the as-grown diamond sample to the
introduction of a low pressure nitrous oxide environment. Graphs a), b), and c) are the
behavior for the four runs performed at 600oC, 625
oC, and 650
oC, respectively.

174

175
Figure 7.14 Emission current behavior of a hydrogenated diamond sample in the influence of a
low pressure nitrous oxide environment. Graphs a), b), and c) are the behavior for the four runs
performed at 600oC, 625
oC, and 650
oC, respectively.
7.5.2 Analysis of the thermionic emission behavior in N2O
The results presented in the previous section suggest that nitrous oxide had a negative
effect on the thermionic emission from diamond films. When comparing the magnitude of
decrease amongst all testing runs (as-grown and hydrogenated) it is clear that the magnitude of
this decrease was larger when the baseline emission current (current before leak-in) was higher.
To better understand the results in Figures 7.13 and 7.14, the magnitude of this decrease was
calculated for each run in which it was easily decipherable. For runs that exhibited an increasing
or decreasing baseline trend, a residual plot to accurately calculate the amount the emission
current decreased was performed (this was the same method described in the previous section for
the hydrogen data).

176
Figure 7.15 a) Magnitude of the emission current decrease from baseline vacuum levels
upon exposure of the cathodes to nitrous oxide. b) Percent of emission current decrease
from vacuum levels.
The plot in Figure 7.15a indicates that there was a direct positive correlation between
emission current decrease and the baseline emission current levels. Further, the percent of
emission current decrease appears to also increase linearly as a function of increasing baseline
current per the exponential trend on the semi-log plot seen in Figure 17.5b. The observed impact
nitrous oxide had on the thermionic emission from diamond films strongly agrees with the
previous predictions.
Nitrous oxide has been shown to have no observable interaction with diamond films
suggesting that any effects observed in the present study should be the result of electron impact
reactions with the N2O molecules.[200] Additionally, nitrous oxide predictably dissociates into a
neutral nitrogen molecule and an atomic oxygen anion (Equation 7.1) which should greatly
inhibit the electron emission from all types of thermionic cathodes. As no positive ions were
produced, the space charge effects between the cathode and anode were not suppressed (as
would be the case with a molecule that dissociates into a positive ion). Thus, the nitrous oxide

177
molecules and the corresponding dissociation products likely only decreased the mean free path
of electrons causing various scattering processes which inevitably led to a decrease in emission
current. This is also believed to be the case in the nitrogen experiment discussed in Section 7.1.
Both of these predictions were verified by the strong positive correlation of the emission current
decrease with baseline emission current.
It can also be predicted that a portion of the oxygen radicals produced in the chamber
likely bonded with the emission-enhancing hydrogen atoms on the diamond surface also causing
further decreased emission.[182] This prediction was also confirmed upon examination of
Figures 7.13 and 7.14. Should nitrous oxide present in the cathode-anode gap act as only a means
to suppress emission current, the sample would have immediately resumed normal operation
upon the removal of all N2O present in chamber when the leak valve was closed. The present
experiment observed the emission current to show some signs of recovery though never back to
the same level that would be predicted by the baseline current trend. Thus, as molecular nitrogen
nor nitrous oxide effect the diamond surface,[200] it is likely that the oxygen radicals are
removing some of the surface hydrogen atoms, preventing the sample from achieving full
operational performance.
The present study demonstrated that the operation of diamond cathodes in a low pressure
nitrous oxide environment dramatically decreased their thermionic emission performance.
However, this study added further validity to this testing method. This testing
apparatus/configuration has proven capable of producing results in strong agreement with well-
established theory. Although other experiments in this research examined gaseous species with
much less predictable behavior on the thermionic emission from diamond, the results from this
nitrous oxide study increased the confidence in all results obtained with this testing method.

178
In summary of this chapter, several gaseous species were examined to assess their impact
on the thermionic emission from diamond. The testing method used for all gaseous studies was
shown to provide reliable results such that future work can continue this research. Though a
detailed analysis of the results has been presented based on available research, more work is
needed for the implementation of a reliable, highly performing, diamond cathode for thermionic
applications. The next chapter elaborates on suggestions for furthering this research.

179
CHAPTER VIII
CONCLUSIONS AND RECOMMENDATIONS
Several experiments have been presented in this research examining the thermionic
emission properties of polycrystalline nitrogen-incorporated diamond cathodes. This final
chapter is meant to outline the implications of the present research. Though it is clear that this
research has resulted in a better understanding of thermionic emission from diamond, much more
work is required for diamond cathodes to be fully utilized for thermionic applications.
Accordingly, this chapter also presents recommendations for future research.
8.1 Observed effects of hydrogen in diamond
Perhaps the most useful information obtained in the present research is that hydrogen is
responsible for significant enhancement of diamond’s thermionic emission properties. It has been
shown that exposure of diamond cathodes to a hydrogen plasma treatment greatly increases the
emission current compared to an as-grown sample by as much as four orders of magnitude.
Further, current vs. temperature plots of hydrogenated samples revealed that the emission current
begins to decline at temperatures below 700oC limiting the capability of such cathodes. That is,
isothermal emission current testing of hydrogenated diamond samples exhibited a decreasing
trend with time for temperatures ranging from 600oC to 800
oC. It was shown that this decreasing
trend followed a first-order reaction equation with an activation energy of ~1.25 eV. These
results are the first known to indicate a direct correlation between emission current and surface
hydrogen concentration.

180
In addition to hydrogen, the desorption of deuterium from diamond was also studied. The
isothermal emission current decrease of a deuterated sample followed a first-order reaction rate
equation. An Arrhenius plot of the data did not exhibit a linear trend as would be expected from
a classical desorption reaction. It was determined that this lack of linearity indicates that
deuterium likely desorbs from diamond though quantum mechanical tunneling. The data was
analyzed according to Bell’s tunneling equation instead of the classical Arrhenius equation from
which an activation energy of 3.19 eV was calculated with a coefficient of determination (R2)
extremely close to 1. Assuming tunneling is indeed responsible for the desorption of deuterium
from diamond, the data obtained from the hydrogen desorption experiment was reanalyzed
according to Bell’s tunneling equation which provided an activation energy of 1.76 eV. Though
more data is required to increase the confidence of the activation energy calculations, these
findings suggest deuterium requires more energy to desorb than hydrogen. The results obtained
from both the deuterium and hydrogen activation energy studies indicate that a deuterated
diamond sample could likely operate at higher temperatures before experiencing the effects of
desorption than a hydrogenated sample.
8.2 Gaseous environment effects on thermionic emission
8.2.1 Gases the diminish thermionic emission
Diamond cathodes were exposed to five different gases to examine their effect on
thermionic emission. Two gases were observed to have negative effects on diamond’s thermionic
emission properties: N2 and N2O. Both molecular nitrogen and nitrous oxide were not predicted
to favorably affect thermionic emission. Specifically, nitrous oxide was predicted to have a
strong negative effect due to its well documented dissociation products upon electron interaction.
181
The testing method confirmed this hypothesis verifying its capability to accurately characterize
each gas’s influence on the thermionic emission from diamond.
8.2.2 Gases that enhance thermionic emission
CH4: Operation of diamond films in a methane environment was predicted to have an
enhancing effect on the thermionic emission performance based on a previous study by
Nemanich.[106] Though, testing of an as-grown diamond sample exhibited very little response to
the introduction of CH4, testing with a hydrogenated sample appeared to have a small positive
response. This positive response is in agreement with Nemanich but the magnitude of response
does not reflect his findings that methane appreciably enhanced the thermionic emission of
nitrogen-incorporated diamond films. It was hypothesized that this discrepancy is due to the
pressures used in each study. At the high pressures Nemanich examined (up to 700mTorr),
previous electron impact studies suggest that methane will decompose and reform into many
different hydrocarbon molecules consisting of several carbon and hydrogen atoms.[171, 174]
These same electron impact studies also imply that the low pressures used in the present research
(5.5 µTorr) result in the dissociation of CH4 into smaller, simpler radicals such as CH3+(-)
and H-
(+).[171, 174] Thus, pressure likely dictates how methane will influence the thermionic emission
from diamond films.
Based on the results obtained in the present research, methane was deemed an unsuitable
gaseous species for increasing the thermionic emission performance of diamond. Though
previous studies have shown methane to have a positive effect on the operation of diamond
thermionic cathodes, previous electron impact studies suggest that this effect cannot be
sustained. The complex carbon contained molecules formed during Nemanich’s study will likely

182
coalesce on the surface of the diamond electrode. At the elevated temperatures required for
thermionic energy conversion, it is probable that these carbon molecules will result in the
formation of graphite or other non-diamond carbonaceous content which is not favorable for
electron emission due to its high work function of ~4.5eV.[128, 201]
H2O: Water vapor was also examined and shown to have varying effects on the
thermionic emission from diamond. Testing of a hydrogenated sample revealed that a roughly 60
second exposure to H2O had a net positive effect at lower temperatures while at higher
temperatures, it was seen to have a net negative effect. This was determined to be caused by the
varying reaction water vapor has with the diamond surface at different temperatures. At lower
temperatures, water is thought to interact with the diamond surface by forming C-H and C-OH
bonds, both of which have been reported to invoke a negative electron affinity.[175, 176] But at
higher temperatures, studies have shown that water vapor can decompose upon interaction with
the diamond surface to form a mixture of C-H, C-O-C, and C=O bonds, with the latter two being
unfavorable for electron emission.[181] The results in this study suggest water vapor is likely not
an ideal candidate to increase the thermionic emission performance of diamond.
H2: Molecular hydrogen was the third gas shown to enhance the emission performance of
diamond films and appears to be the most promising candidate for use in a diamond thermionic
energy converter. For both as-grown and hydrogenated diamond samples, the emission current
was observed to increase over vacuum levels. When plotting the emission current increase
against baseline emission current, a distinct trend was observed such that the magnitude of this
positive effect increased linearly as a function of baseline current levels. A linear regression of
this data allowed an expression to be quantified with an R2 of 0.94 (Equation 8.1).

183
(8.1)
Where Iincrease: the thermionic emission current increase upon exposure to molecular hydrogen
and Ibaseline: emission current prior to the introduction of hydrogen. Thus, there is a roughly 50%
increase in emission current when operating in a 5.5 µTorr H2 environment.
Operation in molecular hydrogen was also observed to increase the temperature ceiling at
which diamond films can operate. Recall that though hydrogenated diamond cathodes were able
to achieve much higher emission current than as-grown films, they began to exhibit the “roll off”
behavior (where the emission current ceases to increase exponentially with temperature and
begins to decrease) at lower temperatures, limiting their performance capability. When
examining the current versus temperature behavior of diamond cathodes in a constant 5.5µTorr
H2 environment, this roll off was observed to occur at ~100oC higher temperatures for
hydrogenated films. The ability to operate at higher temperatures will allow for more emission
current to be extracted from diamond thermionic emitters.
Summarizing: Out of the five gaseous species studied in this research, it is clear that
molecular hydrogen is most favorable for use in diamond thermionic energy converters. Not only
does exposure to a low pressure hydrogen environment result in a roughly 50% increase in
emission current but also allows diamond cathodes to operate at higher temperatures permitting
even more current to be extracted. It thus appears unlikely that any future thermionic energy
converter implementations utilizing diamond will not take advantage of molecular hydrogen’s
beneficial effects.

184
8.3 Potential thermionic energy conversion performance
As a goal of the present research was to examine diamond films for use in TEC, an
analysis of the potential performance characteristics was executed. This research demonstrated
that exposure of diamond samples to a hydrogen plasma significantly enhanced thermionic
emission current levels at low temperatures (<1000oC). Unfortunately, the emission current was
observed to degrade at temperatures below 700oC when operating in a vacuum environment.
This research further established that exposure of diamond samples to low pressure molecular
hydrogen results in increased thermionic emission current (compared to operation in vacuum)
and also allows for operation at higher temperatures.
The performance of a thermionic energy converter with a nitrogen-incorporated cathode
and anode was calculated based on the equations presented in Chapter III including all the
beneficial effects identified in this work. For the cathode, this analysis used the thermionic
emission parameters (Richardson constant and work function) derived for a hydrogenated
diamond sample calculated from the data points prior to the “roll off” trend. The anode was
modeled from the thermionic emission parameters for the low temperature operation of an as-
grown diamond sample discussed in Section 7.1. The performance was extrapolated by applying
the enhancing effects observed from operation in the 5.5 µTorr hydrogen environment. Thus,
Equation 8.1 was employed to predict the increased thermionic emission current and the energy
conversion performance was calculated up to temperatures just exceeding 800oC. To simplify the
calculations, the TEC performance was based on a device with ideal electrical contacts and a
load resistance that perfectly matched the power output.
The potential output current and power of this all diamond thermionic energy converter
just described was calculated as a function of cathode temperature for an anode held constant at a

185
nominal temperature of 400oC (Figs. 8.1 and 8.2). Assuming the effects of both the hydrogen
plasma treatment and the low pressure hydrogen environment are retained, this configuration
could achieve emission current densities of 1 A/cm2 with an overall output power greater than
100 mW/cm2 at a cathode operational temperature of 800
oC. This equates to the production of
over 1 kW per square meter of electrical power from this diamond TEC configuration.
Figure 8.1 Potential output current of an all diamond thermionic energy converter with
molecular hydrogen as the interelectrode gas at a pressure of 5.5µTorr.
550 600 650 700 750 800
1m
10m
100m
1
Temperature oC
Curr
ent
Den
sity
Acm
2
TEC Output Current
Anode at 400oC

186
Figure 8.2 Potential output power of an all diamond thermionic energy converter with
molecular hydrogen as the interelectrode gas at a pressure of 5.5µTorr.
8.4 Recommendations for future work
The numerous findings presented in this dissertation should encourage future research of
diamond cathodes for thermionic energy conversion. It has been shown that exposure of diamond
films to a hydrogenation treatment significantly enhances their thermionic emission
performance. The thermal desorption of hydrogen is the primary failure mechanism of diamond
emitters preventing exceptionally high emission current from being achieved. This research has
shown that the desorption of hydrogen, and its isotope deuterium, is a more complex process
than previously thought. The observed non-classical tunneling behavior of the desorption process
should be further examined by other research using different methods.
The thermionic emission studies performed in gaseous environments presented in
Chapter VII indicate that future implementation of a diamond thermionic energy converter may
550 600 650 700 750 800
0.1m
1m
10m
100m
Temperature oC
Pow
erD
ensi
tyW
cm2
TEC Output Power
Anode at 400oC

187
utilize a gaseous species in order to achieve the useful power output performance described in
the previous section. This is rational as all previous TEC implementations took advantage of
similar effects, thus many of the engineering challenges have been addressed. Results presented
in the present research pertaining to methane differed somewhat from previous work.[106] This
dissertation has presented evidence suggesting the previous research utilizing high pressure
methane environments would not be feasible for long term operation, follow-up studies could
further clarify this matter. Such work would involve testing diamond thermionic emitters in
methane environments at varying pressures.
Perhaps the most promising results obtained in this research involve exposing diamond
cathodes to low pressure molecular hydrogen environments. While examining operation in
pressures of 5.5µTorr, a marked improvement in thermionic emission current was observed.
Future studies should examine this effect more broadly in an effort to further characterize the
performance of diamond thermionic emitters. This effort should consist of examining emission
operation in different molecular hydrogen environment pressures to determine the maximum
beneficial effect. This future research would lead to a better understanding of the mechanisms
whereby hydrogen has emission current enhancing effects.
In conclusion, this research has provided a sound framework on which future work with
diamond thermionic energy converters can be built. It is hoped that the results presented in this
dissertation will reinvigorate interest in thermionic energy conversion which is a technology that
could revolutionize the field of power generation.

188
LIST OF PUBLICATIONS
[1] W. F. Paxton, J. L. Davidson, W. P. Kang, and M. Howell, "Enhanced thermionic energy
converter," USA, Provisional Patent, 2013.
[2] T. D. Musho, W. F. Paxton, J. L. Davidson, and D. G. Walker, "Quantum simulation of
thermionic emission from diamond films," Journal of Vacuum Science & Technology B:
Microelectronics and Nanometer Structures, vol. 31, p. 021401, 2013.
[3] W. F. Paxton, A. Steigerwald, M. Howell, N. Tolk, W. P. Kang, and J. L. Davidson, "The
effect of hydrogen desorption kinetics on thermionic emission from polycrystalline
chemical vapor deposited diamond," Applied Physics Letters, vol. 101, p. 243509, 2012.
[4] W. F. Paxton, M. Howell, W. P. Kang, and J. L. Davidson, "Influence of hydrogen on the
thermionic electron emission from nitrogen-incorporated polycrystalline diamond films,"
Journal of Vacuum Science & Technology B: Microelectronics and Nanometer
Structures, vol. 30, p. 021202, 2012.
[5] W. F. Paxton, T. Wade, M. Howell, N. Tolk, W. P. Kang, and J. L. Davidson,
"Thermionic emission characterization of boron-doped microcrystalline diamond films at
elevated temperatures," physica status solidi (a), 2012.
[6] W.F. Paxton, M. Howell, N. Tolk, W.P. Kang, and J.L. Davidson, "Nonclassical
Desorption Kinetics of Deuterium from Diamond Studied by Thermionic Emission," (In
serious preparation)

189
REFERENCES
[1] E. Becquerel, "Rescherches Sur La Transmission De L'Electricite Au Travers Des Gaz A
Des Temperatures Elevees," Annales de Chimie et de Physique, vol. 39, p. 48, 1853.
[2] P. A. Redhead, "The birth of electronics: Thermionic emission and vacuum," 1998, pp.
1394-1401.
[3] T. A. Edison, "Method and apparatus for scanning and object and correcting image data
using concurrently generated illumination data," United States Patent 307031, 1884, 1884.
[4] E. J. Houston, "Notes on Phenomena in Incandescent Lamps," American Institute of
Electrical Engineers, Transactions of the, vol. I, pp. 11-18, 1884.
[5] J. A. Fleming, "On Electric Discharge between Electrodes at Different Temperatures in
Air and in High Vacua," Proceedings of the Royal Society of London, vol. 47, pp. 118-
126, January 1, 1889 1889.
[6] "Power Vacuum Tube Applications," in Power Vacuum Tubes Handbook, Third Edition,
ed: CRC Press, 2012, pp. 1-18.
[7] M. Henikenius. Fluorescent Lamp. Available:
http://www.ustr.net/electronics/fluorescent.shtml#Overview
[8] V. r. Andr√°s and P. Michael, "The Scanning Electron Microscope," in Handbook of
Charged Particle Optics, Second Edition, ed: CRC Press, 2008, pp. 437-496.
[9] H. Mimura, "The Status of Field Emission Displays," in Vacuum Electronics Conference,
2007. IVEC '07. IEEE International, 2007, pp. 1-4.
[10] G. N. Hatsopoulos and E. P. Gyftopoulos, Thermionic energy conversion. Volume II.
Theory, technology, and application, 1979.
[11] D. Y. Goswami and K. Frank, "Global Energy System," in Handbook of Energy Efficiency
and Renewable Energy, ed: CRC Press, 2007, pp. 1-1-1-24.
[12] "World Energy Outlook," International Energy Agency2009.
[13] J. O'Toole. (2012, Coal company announces layoffs in response to Obama win. CNN
Money.
[14] R. Roberts, "Energy Sources and Conversion Techniques: What is our capability of
meeting the energy needs of the future within the limitations of known energy resources
and energy conversion technology," American Scientist, vol. 61, pp. 66-75, 1973.

190
[15] K. George, "Conventional Power Generation," in Systems, Controls, Embedded Systems,
Energy, and Machines, ed: CRC Press, 2006, pp. 1-1-1-20.
[16] L. E. Bell, "Cooling, Heating, Generating Power, and Recovering Waste Heat with
Thermoelectric Systems," Science, vol. 321, pp. 1457-1461, September 12, 2008 2008.
[17] K. Biswas, J. He, I. D. Blum, C.-I. Wu, T. P. Hogan, D. N. Seidman, V. P. Dravid, and M.
G. Kanatzidis, "High-perfance bulk thermoelectrics with all-scale hierachical
architectures," Nature, vol. 489, p. 5, 2012.
[18] S. M. Sze, Physics of Semiconductor Devices, 2nd ed. New York, NY: John Wiley &
Sons, Inc., 1981.
[19] B. Dale, "Wind Energy Conversion," in Handbook of Energy Efficiency and Renewable
Energy, ed: CRC Press, 2007, pp. 22-1-22-30.
[20] J. M. Houston, Theoretical Efficiency of the Thermionic Energy Converter vol. 30: AIP,
1959.
[21] J. H. Ingold, "Calculation of the Maximum Efficiency of the Thermionic Converter,"
Journal of Applied Physics, vol. 32, pp. 769-772, 1961.
[22] O. W. Richardson, "The Electrical Conductivity Imparted to a Vacuum by Hot
Conductors," Philosophical Transactions of the Royal Society of London. Series A,
Containing Papers of a Mathematical or Physical Character, vol. 201, pp. 497-549, 1903.
[23] S. J. Pearton, "Wide Bandgap Semiconductors - Growth, Processing and Applications,"
ed: William Andrew Publishing/Noyes, 2000.
[24] R. J. Zhang, S. T. Lee, and Y. W. Lam, "Characterization of heavily boron-doped diamond
films," Diamond and Related Materials, vol. 5, pp. 1288-1294, 1996.
[25] R. B. Kusner, P. M. Lahti, and C. P. Lillya, "New surface allotropes of carbon," Chemical
Physics Letters, vol. 241, pp. 522-527, 1995.
[26] S. Koizumi, T. Murakami, T. Inuzuka, and K. Suzuki, "Epitaxial growth of diamond thin
films on cubic boron nitride {111} surfaces by dc plasma chemical vapor deposition,"
Applied Physics Letters, vol. 57, pp. 563-565, 1990.
[27] H. Liu and D. S. Dandy, "Diamond Chemical Vapor Deposition," ed: William Andrew
Publishing/Noyes, 1995.
[28] B. V. Spitsyn, L. L. Bouilov, and B. V. Derjaguin, "Vapor growth of diamond on diamond
and other surfaces," Journal of Crystal Growth, vol. 52, pp. 219-226, 1981.
[29] H. Maeda, S. Masuda, K. Kusakabe, and S. Morooka, "Nucleation and growth of diamond
in a microwave plasma on substrate pretreated with non-oxide ceramic particles," Journal
of Crystal Growth, vol. 121, pp. 507-515, 1992.
191
[30] K. F. Turner, B. R. Stoner, L. Bergman, J. T. Glass, and R. J. Nemanich, "Observation of
surface modification and nucleation during deposition of diamond on silicon by scanning
tunneling microscopy," Journal of Applied Physics, vol. 69, pp. 6400-6405, 1991.
[31] G. Popovici and M. A. Prelas, "Nucleation and Selective Deposition of Diamond Thin
Films," physica status solidi (a), vol. 132, pp. 233-252, 1992.
[32] M. W. Geis, "Growth of textured diamond films on foreign substrates from attached seed
crystals," Applied Physics Letters, vol. 55, pp. 550-552, 1989.
[33] B. R. Stoner, G. H. M. Ma, S. D. Wolter, and J. T. Glass, "Characterization of bias-
enhanced nucleation of diamond on silicon by invacuo surface analysis and transmission
electron microscopy," Physical Review B, vol. 45, p. 11067, 1992.
[34] R. F. Davis, "Diamond Films and Coatings," ed: William Andrew Publishing/Noyes,
1993.
[35] W. D. Yasuaki Hayashi, and Russel Messier, "Temperature Dependence of Nucleation
Density of Chemical Vapor Deposition Diamond," Jpn. J. Appl. Phys., vol. 31, 1992.
[36] M. A. Pinault, J. Barjon, T. Kociniewski, F. Jomard, and J. Chevallier, "The n-type doping
of diamond: Present status and pending questions," Physica B: Condensed Matter, vol.
401-402, pp. 51-56, 2007.
[37] R. C. Hyer, M. Green, K. K. Mishra, and S. C. Sharma, "Nucleation and growth of
diamond in hot filament assisted chemical vapour deposition," Journal of Materials
Science Letters, vol. 10, pp. 515-518, 1991.
[38] S. Prawer and R. J. Nemanich, "Raman spectroscopy of diamond and doped diamond,"
Philosophical Transactions of the Royal Society of London. Series A:
Mathematical, Physical and Engineering Sciences, vol. 362, pp. 2537-2565, November
15, 2004 2004.
[39] P. Instruments, "Raman Spectroscopy Basics," ed.
[40] N. Wada and S. A. Solin, "Raman efficiency measurements of graphite," Physica B+C,
vol. 105, pp. 353-356, 1981.
[41] A. M. Zaitsev, Optical Properties of Diamond: Springer, 2001.
[42] R. W. Bormett, S. A. Asher, R. E. Witowski, W. D. Partlow, R. Lizewski, and F. Pettit,
"Ultraviolet Raman spectroscopy characterizes chemical vapor deposition diamond film
growth and oxidation," Journal of Applied Physics, vol. 77, pp. 5916-5923, 1995.
[43] J. F. Shackelford, Materials Science for Engineers. Upper Saddle River, New Jersey:
Pearson Prentice Hall, 2005.

192
[44] J. M. Hollander and W. L. Jolly, "X-ray photoelectron spectroscopy," Accounts of
Chemical Research, vol. 3, pp. 193-200, 1970/06/01 1970.
[45] P. van der Heide, X-Ray Photoelectron Spectroscopy : An Introduction to Principles and
Practices. Hoboken, NJ, USA: Wiley, 2011.
[46] P. J. Goodhew, F. J. Humphreys, and R. Beanland, Electron Microscopy and Analysis.
London, GBR: Taylor & Francis, 2000.
[47] W. Zhu, B. R. Stoner, B. E. Williams, and J. T. Glass, "Growth and characterization of
diamond films on nondiamond substrates for electronic applications," Proceedings of the
IEEE, vol. 79, pp. 621-646, 1991.
[48] D. G. Brandon and W. D. Kaplan, Microstructural Characterization of Materials: J.
Wiley, 1999.
[49] M. N. Yoder, "Diamond Properties and Applications," in Diamond Films and Coatings-
Development, Properties, and Applications, R. F. Davis, Ed., ed. Park Ridge: Noyes
Publications, 1993, pp. 1-30.
[50] D. R. S. Gilbert, Rajiv K., "Diamond Deposition and Characterization," in Wide Bandgap
Semiconductors - Growth, Processing and Applications, S. J. Pearton, Ed., ed. Norwich:
William Andrew Publishing/Noyes, 2000, p. 507.
[51] A. A. Giardini, "A Study of the Directional Hardness in Silicon," The American
Mineralogist, vol. 43, p. 13, 1958.
[52] V. L. Solozhenko, S. N. Dub, and N. V. Novikov, "Mechanical properties of cubic BC2N,
a new superhard phase," Diamond and Related Materials, vol. 10, pp. 2228-2231, 2001.
[53] C. Research. Boron Nitride (BN) - Properties and Information on Boron Nitride [Online].
Available: http://www.azom.com/article.aspx?ArticleID=78
[54] R. Kalish, "Doping of diamond," Carbon, vol. 37, pp. 781-785, 1999.
[55] A. Wisitsora-at, W. P. Kang, J. L. Davidson, Y. Gurbuz, and D. V. Kerns, "Field emission
enhancement of diamond tips utilizing boron doping and surface treatment," Diamond and
Related Materials, vol. 8, pp. 1220-1224, 1999.
[56] R. F. Mamin and T. Inushima, "Conductivity in boron-doped diamond," Physical Review
B, vol. 63, p. 033201, 2001.
[57] J. Barjon, N. Habka, C. Mer, F. Jomard, J. Chevallier, and P. Bergonzo, "Resistivity of
boron doped diamond," physica status solidi (RRL) – Rapid Research Letters, vol. 3, pp.
202-204, 2009.

193
[58] M. Nishitani-Gamo, E. Yasu, C. Xiao, Y. Kikuchi, K. Ushizawa, I. Sakaguchi, T. Suzuki,
and T. Ando, "Sulfur-doped homoepitaxial (001) diamond with n-type semiconductive
properties," Diamond and Related Materials, vol. 9, pp. 941-947, 2000.
[59] S. A. Kajihara, A. Antonelli, J. Bernholc, and R. Car, "Nitrogen and potential n-type
dopants in diamond," Physical Review Letters, vol. 66, pp. 2010-2013, 1991.
[60] Y. Show, T. Matsukawa, M. Iwase, and T. Izumi, "Effects of defects introduced by
nitrogen doping on electron emission from diamond films," Materials Chemistry and
Physics, vol. 72, pp. 201-203, 2001.
[61] G. Z. Cao, J. J. Schermer, W. J. P. v. Enckevort, W. A. L. M. Elst, and L. J. Giling,
"Growth of {100} textured diamond films by the addition of nitrogen," Journal of Applied
Physics, vol. 79, pp. 1357-1364, 1996.
[62] S. Bhattacharyya, O. Auciello, J. Birrell, J. A. Carlisle, L. A. Curtiss, A. N. Goyette, D. M.
Gruen, A. R. Krauss, J. Schlueter, A. Sumant, and P. Zapol, "Synthesis and
characterization of highly-conducting nitrogen-doped ultrananocrystalline diamond films,"
Applied Physics Letters, vol. 79, pp. 1441-1443, 2001.
[63] F. A. M. Koeck, R. J. Nemanich, A. Lazea, and K. Haenen, "Thermionic electron emission
from low work-function phosphorus doped diamond films," Diamond and Related
Materials, vol. 18, pp. 789-791, 2009.
[64] J. P. Goss, "Theory of hydrogen in diamond," Journal of Physics: Condensed Matter, vol.
15, p. R551, 2003.
[65] M. I. Landstrass and K. V. Ravi, "Resistivity of chemical vapor deposited diamond films,"
Applied Physics Letters, vol. 55, pp. 975-977, 1989.
[66] M. I. Landstrass and K. V. Ravi, "Hydrogen passivation of electrically active defects in
diamond," Applied Physics Letters, vol. 55, pp. 1391-1393, 1989.
[67] J. B. Cui, J. Ristein, M. Stammler, K. Janischowsky, G. Kleber, and L. Ley, "Hydrogen
termination and electron emission from CVD diamond surfaces: a combined secondary
electron emission, photoelectron emission microscopy, photoelectron yield, and field
emission study," Diamond and Related Materials, vol. 9, pp. 1143-1147, 2000.
[68] F. J. Himpsel, J. A. Knapp, J. A. VanVechten, and D. E. Eastman, "Quantum photoyield
of diamond(111)—A stable negative-affinity emitter," Physical Review B, vol. 20, pp.
624-627, 1979.
[69] J. van der Weide, Z. Zhang, P. K. Baumann, M. G. Wensell, J. Bernholc, and R. J.
Nemanich, "Negative-electron-affinity effects on the diamond (100) surface," Physical
Review B, vol. 50, p. 5803, 1994.

194
[70] I. L. Krainsky, V. M. Asnin, G. T. Mearini, and J. A. Dayton, Jr., "Negative-electron-
affinity effect on the surface of chemical-vapor-deposited diamond polycrystalline films,"
Physical Review B, vol. 53, pp. R7650-R7653, 1996.
[71] D. Takeuchi, S. G. Ri, H. Kato, C. E. Nebel, and S. Yamasaki, "Negative electron affinity
on hydrogen terminated diamond," physica status solidi (a), vol. 202, pp. 2098-2103,
2005.
[72] R. U. Martinelli and D. G. Fisher, "The application of semiconductors with negative
electron affinity surfaces to electron emission devices," Proceedings of the IEEE, vol. 62,
pp. 1339-1360, 1974.
[73] F. Maier, J. Ristein, and L. Ley, "Electron affinity of plasma-hydrogenated and chemically
oxidized diamond (100) surfaces," Physical Review B, vol. 64, p. 165411, 2001.
[74] M. Suzuki, T. Ono, N. Sakuma, and T. Sakai, "Low-temperature thermionic emission
from nitrogen-doped nanocrystalline diamond films on n-type Si grown by MPCVD,"
Diamond and Related Materials, vol. 18, pp. 1274-1277, 2009.
[75] M. Kataoka, C. Zhu, F. A. M. Koeck, and R. J. Nemanich, "Thermionic electron emission
from nitrogen-doped homoepitaxial diamond," Diamond and Related Materials, vol. 19,
pp. 110-113, 2010.
[76] W. F. Paxton, M. Howell, W. P. Kang, and J. L. Davidson, "Influence of hydrogen on the
thermionic electron emission from nitrogen-incorporated polycrystalline diamond films,"
Journal of Vacuum Science & Technology B: Microelectronics and Nanometer Structures,
vol. 30, p. 021202, 2012.
[77] D. Menzel, "Desorption Phenomena," in Interactions on Metal Surfaces, R. Gomer, Ed.,
ed New York: Springer-Verlag, 1975, p. 310.
[78] T. Nishimori, H. Sakamoto, Y. Takakuwa, and S. Kono, "Methane adsorption and
hydrogen isothermal desorption kinetics on a C(001)--(1 x 1) surface," Journal of Vacuum
Science & Technology A: Vacuum, Surfaces, and Films, vol. 13, pp. 2781-2786, 1995.
[79] J. B. Cui, J. Ristein, and L. Ley, "Dehydrogenation and the surface phase transition on
diamond (111): Kinetics and electronic structure," Physical Review B, vol. 59, pp. 5847-
5856, 1999.
[80] R. E. Thomas, R. A. Rudder, and R. J. Markunas, "Thermal desorption from hydrogenated
and oxygenated diamond (100) surfaces," Journal of Vacuum Science & Technology A:
Vacuum, Surfaces, and Films, vol. 10, pp. 2451-2457, 1992.
[81] X. M. Zheng and P. V. Smith, "The topologies of the clean and hydrogen-terminated
C(100) surfaces," Surface Science, vol. 256, pp. 1-8, 1991.
[82] A. V. Hamza, G. D. Kubiak, and R. H. Stulen, "Hydrogen chemisorption and the structure
of the diamond C(100)-(2 × 1) surface," Surface Science, vol. 237, pp. 35-52, 1990.
195
[83] M. T. Schulberg and G. D. S. Kubiak, Richard H., "Temperature Programmed Desorption
of Hydrogen and Deuterium from Cvd Diamond Samples," presented at the Novel Forms
of Carbon, 1992.
[84] M. McGonigal, M. L. Kempel, M. S. Hammond, and K. D. Jamison, "Isothermal
hydrogen desorption from the diamond (100)2 x 1 surface," Journal of Vacuum Science &
Technology A: Vacuum, Surfaces, and Films, vol. 14, pp. 2308-2314, 1996.
[85] T. E. Derry, C. C. P. Madiba, and J. P. F. Sellschop, "Oxygen and hydrogen on the surface
of diamond," Nuclear Instruments and Methods in Physics Research, vol. 218, pp. 559-
562, 1983.
[86] P. K. Baumann and R. J. Nemanich, "Surface cleaning, electronic states and electron
affinity of diamond (100), (111) and (110) surfaces," Surface Science, vol. 409, pp. 320-
335, 1998.
[87] J. Davidson, W. Kang, K. Holmes, A. Wisitsora-At, P. Taylor, V. Pulugurta, R.
Venkatasubramanian, and F. Wells, "CVD diamond for components and emitters,"
Diamond and Related Materials, vol. 10, pp. 1736-1742, 2001.
[88] A. Vescan, I. Daumiller, P. Gluche, W. Ebert, and E. Kohn, "1000oC operation of
diamond Schottky diode," in Device Research Conference Digest, 1997. 5th, 1997, pp. 40-
41.
[89] A. Vescan, I. Daumiller, P. Gluche, W. Ebert, and E. Kohn, "High temperature, high
voltage operation of diamond Schottky diode," Diamond and Related Materials, vol. 7,
pp. 581-584, 1998.
[90] A. Aleksov, A. Denisenko, M. Kunze, A. Vescan, A. Bergmaier, G. Dollinger, W. Ebert,
and E. Kohn, "Diamond diodes and transistors," Semiconductor Science and Technology,
vol. 18, p. S59, 2003.
[91] M. W. Geis, "Diamond transistor performance and fabrication," Proceedings of the IEEE,
vol. 79, pp. 669-676, 1991.
[92] J. Walko. (2009, Researchers tout diamond transistor breakthrough. EE Times [Online
Article].
[93] G. Fursey, "Advances in Applications," in Field Emission in Vacuum Microelectronics, I.
Brodie and P. Shwoebel, Eds., ed: Kluwer Academic/Plenum Publishers, 2005, pp. 137-
170.
[94] T. Utsumi, "Historical Overview," in Vacuum Microelectronics, W. Zhu, Ed., ed New
York: Jon Wiley & Sons, Inc, 2001, pp. 1-12.
[95] K. Subramanian, W. P. Kang, J. L. Davidson, Y. M. Wong, and B. K. Choi,
"Nanocrystalline diamond lateral field emission diode fabrication by dual micropatterning
technique," Diamond and Related Materials, vol. 16, pp. 1408-1412, 2007.

196
[96] K. Subramanian, W. P. Kang, J. L. Davidson, and M. Howell, "Nanodiamond lateral field
emitter devices on thick insulator substrates for reliable high power applications,"
Diamond and Related Materials, vol. 17, pp. 786-789, 2008.
[97] K. Subramanian, W. P. Kang, J. L. Davidson, B. K. Choi, and M. Howell, "Nanodiamond
lateral comb array field emission diode for high current applications," Diamond and
Related Materials, vol. 15, pp. 1994-1997, 2006.
[98] W. P. Kang, J. L. Davidson, A. Wisitsora-At, Y. M. Wong, R. Takalkar, K. Holmes, and
D. V. Kerns, "Diamond vacuum field emission devices," Diamond and Related Materials,
vol. 13, pp. 1944-1948, Nov-Dec 2004.
[99] K. Subramanian, W. P. Kang, J. L. Davidson, R. S. Takalkar, B. K. Choi, M. Howell, and
D. V. Kerns, "Enhanced electron field emission from micropatterned pyramidal diamond
tips incorporating CH4/H-2/N-2 plasma-deposited nanodiamond," Diamond and Related
Materials, vol. 15, pp. 1126-1131, Apr-Aug 2006.
[100] W. P. Kang, J. L. Davidson, M. A. George, I. Milosevljevic, J. Wittig, and D. V. Kerns,
"Characterization of the Microstructure of Diamond Pyramidal Microtip Emitters,"
presented at the International Conference on the New Diamond Science and Technology,
Tours, France, 1996.
[101] W. P. Kang, J. L. Davidson, A. Wisitsora-at, Y. M. Wong, R. Takalkar, K. Subramanian,
D. V. Kerns, and W. H. Hofmeister, "Diamond and carbon-derived vacuum micro- and
nano-electronic devices," Diamond and Related Materials, vol. 14, pp. 685-691, 2005.
[102] J. L. Davidson, W. P. Kang, K. Subramanian, and Y. M. Wong, "Vacuum Cold Cathode
Emitter Electronic Devices Comprised of Diamond or other Carbons," in
University/Government/Industry Micro/Nano Symposium, 2008. UGIM 2008. 17th
Biennial, 2008, pp. 102-106.
[103] B. K. Choi, W. P. Kang, I. L. Davis, J. L. Davidson, S. T. Hu, and R. W. Pitz,
"Thermionic electron emission from chemical vapor deposition diamond by nanosecond
laser heating," Journal of Vacuum Science & Technology B: Microelectronics and
Nanometer Structures, vol. 27, pp. 557-561, 2009.
[104] Y. M. Wong, W. P. Kang, J. L. Davidson, S. Raina, and J. H. Huang, "Carbon
nanostructures as thermal field emitters for waste heat recovery," Diamond and Related
Materials, vol. 18, pp. 563-566, 2009.
[105] F. A. M. Koeck and R. J. Nemanich, "Low temperature onset for thermionic emitters
based on nitrogen incorporated UNCD films," Diamond and Related Materials, vol. 18,
pp. 232-234, 2009.
[106] F. A. M. Koeck, R. J. Nemanich, Y. Balasubramaniam, K. Haenen, and J. Sharp,
"Enhanced thermionic energy conversion and thermionic emission from doped diamond
films through methane exposure," Diamond and Related Materials, vol. 20, pp. 1229-
1233, 2011.

197
[107] S. Dushman, "Electron Emission from Metals as a Function of Temperature," Physical
Review, vol. 21, pp. 623-636, 1923.
[108] O. W. Richardson, "The Positive Ionization from Hot Salts," Physical Review (Series I),
vol. 33, p. 450, 1911.
[109] W. B. Nottingham, "Thermionic Emission," Massachusetts Institute of Technology,
Cambridge, Technical Report 321, December 10 1956.
[110] G. N. Fleming, "The evolution of Pauli's exclusion principle," Studies in History and
Philosophy of Science Part B: Studies in History and Philosophy of Modern Physics, vol.
38, pp. 202-208, 2007.
[111] N. S. Rasor, "Thermionic Energy Converter," in Fundamentals Handbook of Electrical
and Computer Engineering. vol. II, S. S. L. Chang, Ed., ed New York: John Wiley &
Sons, Inc., 1983, pp. 668-679.
[112] G. Medicus and G. Wehner, "Noble Gas Hot Cathode Diodes with Negative Arc Drop,"
Journal of Applied Physics, vol. 22, p. 1389, 1951.
[113] L. L. Marton, Advances in Electronics and Electron Physics: Academic Press, 1963.
[114] N. S. Rasor, "Thermionic energy conversion plasmas," Plasma Science, IEEE
Transactions on, vol. 19, pp. 1191-1208, 1991.
[115] J. K. Shultis and R. E. Faw, "Thermionic Electrical Generators," in Fundamentals of
Nuclear Science and Engineering, ed New York: Marcel Dekker, Inc., 2002.
[116] G. M. Gryaznov, "30th anniversary of the startup of Topaz—The first thermionic nuclear
reactor in the world," Atomic Energy, vol. 89, pp. 510-515, 2000/07/01 2000.
[117] G. Gaertner and H. W. P. Koops, "Vacuum Electron Sources and their Materials and
Technologies," in Vacuum Electronics, J. A. Eichmeier and M. K. Thumm, Eds., ed:
Springer, 2008, pp. 429-481.
[118] C. Ferris, J. Whitaker, and S. Epstein, "Electron Vacuum Devices," in The Electronics
Handbook, Second Edition, ed: CRC Press, 2005, pp. 353-474.
[119] R. O. Jenkins, "A review of thermionic cathodes," Vacuum, vol. 19, pp. 353-359, 1969.
[120] E. L. Chaffeem, "Practical Sources of Emission and some General Physical Aspects of
Vacuum Tubes," in Theory of Thermionic Vacuum Tubes, ed New York and London:
McGraw-Hill, 1933, pp. 95-137.
[121] A. Taran, D. Voronovich, S. Plankovskyy, V. Paderno, and V. Filipov, "Review of LaB6,
Re-W Dispenser, and BaHfO3-W Cathode Development," Electron Devices, IEEE
Transactions on, vol. 56, pp. 812-817, 2009.

198
[122] C. Oshima, E. Bannai, T. Tanaka, and S. Kawai, "Thermionic work function of LaB[sub
6] single crystals and their surfaces," Journal of Applied Physics, vol. 48, pp. 3925-3927,
1977.
[123] V. C. Wilson, "Conversion of Heat to Electricity by Thermionic Emission," Journal of
Applied Physics, vol. 30, pp. 475-481, 1959.
[124] B. Fiegl, R. Kuhnert, M. Ben-Chorin, and F. Koch, "Evidence for grain boundary hopping
transport in polycrystalline diamond films," Applied Physics Letters, vol. 65, pp. 371-373,
1994.
[125] W. F. Paxton, "Characterization of the Thermal Electron Emission Properties of Boron-
Doped Polycrystalline Films for Use in Energy Conversion," Master of Science, Electrical
Engineering, Vanderbilt University, Nashville, 2011.
[126] B. P. Allen and T. Evans, "Aggregation of Nitrogen in Diamond, Including Platelet
Formation," Proceedings of the Royal Society of London. Series A, Mathematical and
Physical Sciences, vol. 375, pp. 93-104, 1981.
[127] A. T. Collins, "A spectroscopic survey of naturally-occurring vacancy-related colour
centres in diamond," Journal of Physics D: Applied Physics, vol. 15, p. 1431, 1982.
[128] K. S. Krishnan and S. C. Jain, "Thermionic Constants of Graphite," Nature, vol. 169, pp.
702-703, 1952.
[129] V. S. Robinson, Y. Show, G. M. Swain, R. G. Reifenberger, and T. S. Fisher, "Thermionic
emission from surface-terminated nanocrystalline diamond," Diamond and Related
Materials, vol. 15, pp. 1601-1608, 2006.
[130] N. S. Rasor, "Emission physics of the thermionic energy converter," Proceedings of the
IEEE, vol. 51, pp. 733-747, 1963.
[131] K. G. Hernqvist, "Analysis of the arc mode operation of the cesium vapor thermionic
energy converter," Proceedings of the IEEE, vol. 51, pp. 748-754, 1963.
[132] H. L. Witting and E. P. Gyftopoulos, "An Ionization Process in a Low-Energy Cesium
Plasma," Journal of Applied Physics, vol. 36, pp. 1328-1337, 1965.
[133] G. N. Hatsopoulos, "Transport effects in cesium thermionic converters," Proceedings of
the IEEE, vol. 51, pp. 725-733, 1963.
[134] I. Langmuir and K. H. Kingdon, "THERMIONIC EFFECTS CAUSED BY ALKALI
VAPORS IN VACUUM TUBES," Science, vol. 57, pp. 58-60, January 12, 1923 1923.
[135] G. O. Fitzpatrick, E. J. Britt, and B. Moyzhes, "Updated perspective on the potential for
thermionic conversion to meet 21st Century energy needs," in Energy Conversion
Engineering Conference, 1997. IECEC-97., Proceedings of the 32nd Intersociety, 1997,
pp. 1045-1051 vol.2.

199
[136] G. R. Caskey Jr, M. R. Louthan Jr, and R. G. Derrick, "Hydrogen transport in
molybdenum," Journal of Nuclear Materials, vol. 55, pp. 279-283, 1975.
[137] Y. Sato, H. Fujita, T. Ando, T. Tanaka, and M. Kamo, "Local epitaxial growth of diamond
on nickel from the vapour phase," in Thin Film Diamond, A. Lettington and J. W. Steeds,
Eds., 1st ed London: Chapman & Hall, 1994, pp. 58-59.
[138] M. Araki, "PID Control," in Control Systems, Robotics, and Automation vol. 2, H.
Unbehauen, Ed., ed. Oxford, UK: Eolss Publishers, 2004.
[139] R. Vanselow, "Compensation effects in thermionic electron emission," Surface Science,
vol. 149, pp. 381-393, 1985.
[140] M. Myojo, "Thermionic Emission Properties of Emissive Oxides," Journal of Light &
Visual Environment, vol. 34, pp. 24-34, 2010.
[141] S. Bhattacharyya, "Mechanism of high n -type conduction in nitrogen-doped
nanocrystalline diamond," Physical Review B, vol. 70, p. 125412, 2004.
[142] W. F. Paxton, T. Wade, M. Howell, N. Tolk, W. P. Kang, and J. L. Davidson,
"Thermionic emission characterization of boron-doped microcrystalline diamond films at
elevated temperatures," physica status solidi (a), pp. n/a-n/a, 2012.
[143] S. Albin and L. Watkins, "Current-voltage characteristics of thin film and bulk diamond
treated in hydrogen plasma," Electron Device Letters, IEEE, vol. 11, pp. 159-161, 1990.
[144] C.-L. Chen, C.-S. Chen, and J.-T. Lue, "Field emission characteristic studies of chemical
vapor deposited diamond films," Solid-State Electronics, vol. 44, pp. 1733-1741, 2000.
[145] Y. L. Yang, L. M. Struck, L. F. Sutcu, and M. P. D'Evelyn, "Chemistry of hydrogen on
diamond (100)," Thin Solid Films, vol. 225, pp. 203-211, 1993.
[146] D. D. Koleske, S. M. Gates, B. D. Thoms, J. N. Russell Jr, and J. E. Butler, "Isothermal
desorption of hydrogen from polycrystalline diamond films," Surface Science, vol. 320,
pp. L105-L111, 1994.
[147] D. D. Koleske, S. M. Gates, B. D. Thoms, J. J. N. Russell, and J. E. Butler, "Hydrogen on
polycrystalline diamond films: Studies of isothermal desorption and atomic deuterium
abstraction," The Journal of Chemical Physics, vol. 102, pp. 992-1002, 1995.
[148] J. B. Cui, J. Ristein, and L. Ley, "Electron Affinity of the Bare and Hydrogen Covered
Single Crystal Diamond (111) Surface," Physical Review Letters, vol. 81, p. 429, 1998.
[149] C. Bandis and B. B. Pate, "Electron Emission Due to Exciton Breakup from Negative
Electron Affinity Diamond," Physical Review Letters, vol. 74, pp. 777-780, 1995.

200
[150] R. J. Nemanich, P. K. Baumann, M. C. Benjamin, S. W. King, J. van der Weide, and R. F.
Davis, "Negative electron affinity surfaces of aluminum nitride and diamond," Diamond
and Related Materials, vol. 5, pp. 790-796, 1996.
[151] B. B. Pate, "The diamond surface: atomic and electronic structure," Surface Science, vol.
165, pp. 83-142, 1986.
[152] W. F. Paxton, A. Steigerwald, M. Howell, N. Tolk, W. P. Kang, and J. L. Davidson, "The
effect of hydrogen desorption kinetics on thermionic emission from polycrystalline
chemical vapor deposited diamond," Applied Physics Letters, vol. 101, p. 243509, 2012.
[153] J. E. House, Principles of Chemical Kinetics, 2nd ed.: Elsevier, 2007.
[154] E. V. Anslyn and D. A. Dougherty, Modern Physical Organic Chemistry: University
Science Books, 2006.
[155] J. H. Espenson, "Kinetic Isotope Effect," in Chemical Kinetics and Reaction Mechanisms,
ed New York: McGraw-Hill Inc., 1995, pp. 214-220.
[156] J. D. Garcia and J. E. Mace, "Energy Level and Line Tables for One-Electron Atomic
Spectra," J. Opt. Soc. Am., vol. 55, pp. 654-661, 1965.
[157] M. Wolfsberg, W. A. Van Hook, P. Paneth, and L. P. N. Rebelo, Isotope Effects in the
Chemical, Geological, and Bio Sciences. New York: Springer, 2010.
[158] K. Bobrov, H. Shechter, M. Folman, and A. Hoffman, "Deuterium adsorption-desorption
from diamond (100) single crystal surfaces studied by TPD," Diamond and Related
Materials, vol. 7, pp. 170-176, 1998.
[159] K. Bobrov, B. Fisgeer, H. Shechter, M. Folman, and A. Hoffman, "Thermal-programmed
desorption (TPD) of deuterium from Di(111) surface: presence of two adsorption states,"
Diamond and Related Materials, vol. 6, pp. 736-742, 1997.
[160] C. Su, K.-J. Song, Y. L. Wang, H.-L. Lu, T. J. Chuang, and J.-C. Lin, "Hydrogen
chemisorption and thermal desorption on the diamond C(111) surface," The Journal of
Chemical Physics, vol. 107, pp. 7543-7558, 1997.
[161] A. Hoffman, K. Bobrov, B. Fisgeer, H. Shechter, and M. Folman, "Effects of deuterium
adsorption-desorption on the state of diamond: surface degradation and stabilization of sp3
bonded carbon," Diamond and Related Materials, vol. 5, pp. 977-983, 1996.
[162] R. P. Bell, The Tunnel Effect in Chemistry. London: Chapman and Hall, 1980.
[163] A. E. Shilov, "Catalytic reduction of molecular nitrogen in solutions," Russian Chemical
Bulletin, vol. 52, pp. 2555-2562, 2003/12/01 2003.
[164] G. C. Baldwin, "Nitrogen total cross section for electrons below 2.0 eV," Physical Review
A, vol. 9, pp. 1225-1229, 1974.

201
[165] T. Oster, A. Kühn, and E. Illenberger, "Gas phase negative ion chemistry," International
Journal of Mass Spectrometry and Ion Processes, vol. 89, pp. 1-72, 1989.
[166] M. Born, S. Ingemann, and N. M. M. Nibbering, "Formation and chemistry of radical
anions in the gas phase," Mass Spectrometry Reviews, vol. 16, pp. 181-200, 1997.
[167] R. Balog, "Low Energy Electrons as a Soft Tool for Surface Modification," Doctor of
Philosphy, Department of Biology, Chemistry, and Pharmacy, University of Berlin,
Berlin, 2004.
[168] B. L. Moiseiwitsch, "Electron Affinities of Atoms and Molecules," in Advances in Atomic
and Molecular Physics. vol. 1, D. R. Bates and I. Estermann, Eds., ed New York:
Academic Press, 1965, pp. 61-83.
[169] S. R. Hunter, J. G. Carter, and L. G. Christophorou, "Electron transport measurements in
methane using an improved pulsed Townsend technique," Journal of Applied Physics, vol.
60, pp. 24-35, 1986.
[170] N. B. Ram and E. Krishnakumar, "Dissociative electron attachment to methane probed
using velocity slice imaging," Chemical Physics Letters, vol. 511, pp. 22-27, 2011.
[171] G. Drabner, A. Poppe, and H. Budzikiewicz, "The composition of the CH4 plasma,"
International Journal of Mass Spectrometry and Ion Processes, vol. 97, pp. 1-33, 1990.
[172] S. Motlagh and J. H. Moore, "Cross sections for radicals from electron impact on methane
and fluoroalkanes," The Journal of Chemical Physics, vol. 109, pp. 432-438, 1998.
[173] T. E. Sharp and J. T. Dowell, "Isotope Effects in Dissociative Attachment of Electrons in
Methane," The Journal of Chemical Physics, vol. 46, pp. 1530-1531, 1967.
[174] J. Gross, "Chemical Ionization," in Mass Spectrometry, ed: Springer Berlin Heidelberg,
2011, pp. 331-354.
[175] X. Gao, L. Liu, D. Qi, S. Chen, A. T. S. Wee, T. Ouyang, K. P. Loh, X. Yu, and H. O.
Moser, "Water-Induced Negative Electron Affinity on Diamond (100)," The Journal of
Physical Chemistry C, vol. 112, pp. 2487-2491, 2008/02/01 2008.
[176] M. J. Rutter and J. Robertson, "Ab initio calculation of electron affinities of diamond
surfaces," Physical Review B, vol. 57, pp. 9241-9245, 1998.
[177] G. Piantanida, A. Breskin, R. Chechik, O. Katz, A. Laikhtman, A. Hoffman, and C.
Coluzza, "Effect of moderate heating on the negative electron affinity and photoyield of
air-exposed hydrogen-terminated chemical vapor deposited diamond," Journal of Applied
Physics, vol. 89, pp. 8259-8264, 2001.
[178] A. Laikhtman, A. Lafosse, Y. Le Coat, R. Azria, and A. Hoffman, "Interaction of water
vapor with bare and hydrogenated diamond film surfaces," Surface Science, vol. 551, pp.
99-105, 2004.

202
[179] B. F. Mantel, M. Stammler, J. Ristein, and L. Ley, "The correlation between surface
conductivity and adsorbate coverage on diamond as studied by infrared spectroscopy,"
Diamond and Related Materials, vol. 10, pp. 429-433, 2001.
[180] S. Skokov, B. Weiner, and M. Frenklach, "Theoretical study of oxygenated (100) diamond
surfaces in the presence of hydrogen," Physical Review B, vol. 55, pp. 1895-1902, 1997.
[181] L. M. Struck and M. P. D'Evelyn, "Interaction of hydrogen and water with diamond (100):
Infrared spectroscopy," 1993, pp. 1992-1997.
[182] A. Laikhtman and A. Hoffman, "Interaction of thermally activated and molecular oxygen
with hydrogenated polycrystalline diamond surfaces studied by synchrotron radiation
techniques," Surface Science, vol. 522, pp. L1-L8, 2003.
[183] O. Heber, R. Golser, H. Gnaser, D. Berkovits, Y. Toker, M. Eritt, M. L. Rappaport, and D.
Zajfman, "Lifetimes of the negative molecular hydrogen ions: H_{2}^{−}, D_{2}^{−},
and HD^{−}," Physical Review A, vol. 73, p. 060501, 2006.
[184] B. M. Schwarzschild, "Negative ions of molecular hydrogen," Physics Today, vol. 64, p.
23, 2011.
[185] H. Eyring, J. O. Hirschfelder, and H. S. Taylor, "The Theoretical Treatment of Chemical
Reactions Produced by Ionization Processes Part I. The Ortho-Para Hydrogen Conversion
by Alpha-Particles," The Journal of Chemical Physics, vol. 4, pp. 479-491, 1936.
[186] I. Fischer-Hjalmars, "Theoretical Investigation of the Negative Hydrogen Molecule Ion,"
The Journal of Chemical Physics, vol. 30, p. 1099, 1959.
[187] R. D. Harcourt, "A bound 2 Σ g + ground state for H 2 - ? A valence-bond study," Journal
of Physics B: Atomic and Molecular Physics, vol. 20, p. L617, 1987.
[188] A. Dalgarno and M. R. C. McDowell, "Charge Transfer and the Mobility of H - Ions in
Atomic Hydrogen," Proceedings of the Physical Society. Section A, vol. 69, p. 615, 1956.
[189] B. Jordon-Thaden, H. Kreckel, R. Golser, D. Schwalm, M. H. Berg, H. Buhr, H. Gnaser,
M. Grieser, O. Heber, M. Lange, O. Novotný, S. Novotny, H. B. Pedersen, A. Petrignani,
R. Repnow, H. Rubinstein, D. Shafir, A. Wolf, and D. Zajfman, "Structure and Stability of
the Negative Hydrogen Molecular Ion," Physical Review Letters, vol. 107, p. 193003,
2011.
[190] V. I. Khvostenko and V. M. Dukel'skii, "Formation of negative H- ions in electron
collisions with hydrogen molecules," Zhurnal Eksperimental'noi i Teoreticheskoi Fiziki,
vol. 33, p. 5, 1957.
[191] R. Golser, H. Gnaser, W. Kutschera, A. Priller, P. Steier, A. Wallner, M. Čížek, J.
Horáček, and W. Domcke, "Experimental and Theoretical Evidence for Long-Lived
Molecular Hydrogen Anions H_{2}^{-} and D_{2}^{-}," Physical Review Letters, vol.
94, p. 223003, 2005.

203
[192] A. A. Shiryaev, D. Grambole, A. Rivera, and F. Herrmann, "On the interaction of
molecular hydrogen with diamonds: An experimental study using nuclear probes and
thermal desorption," Diamond and Related Materials, vol. 16, pp. 1479-1485, 2007.
[193] M. S. Melnik, "Diamond Surfaces: Interactions with Hydrogen and Halogens," Doctor of
Philosophy PDF, Applied Physics, California Institute of Technology, Pasadena, CA,
1997.
[194] J. E. Bartmess, "Gas phase ion energetics data," in NIST Chemistry WebBook, NIST
Standard Reference Database vol. 29, P. J. Linstrom and W. G. Mallard, Eds., ed.
Gaithersburg MD, 20899: National Institute of Standards and Technology, 2013.
[195] M. Allan and T. Skalický, "Structures in elastic, vibrational, and dissociative electron
attachment cross sections in N 2 O near threshold," Journal of Physics B: Atomic,
Molecular and Optical Physics, vol. 36, p. 3397, 2003.
[196] J. C. Rienstra-Kiracofe, G. S. Tschumper, H. F. Schaefer, S. Nandi, and G. B. Ellison,
"Atomic and Molecular Electron Affinities: Photoelectron Experiments and Theoretical
Computations," Chemical Reviews, vol. 102, pp. 231-282, 2002/01/01 2002.
[197] D. Yu, A. Rauk, and D. A. Armstrong, "Electron affinities and thermodynamic properties
of some triatomic species," The Journal of Physical Chemistry, vol. 96, pp. 6031-6038,
1992/07/01 1992.
[198] S. J. Nalley, R. N. Compton, H. C. Schweinler, and V. E. Anderson, "Molecular electron
affinities from collisional ionization of cesium. I. NO, NO[sub 2], and N[sub 2]O," The
Journal of Chemical Physics, vol. 59, pp. 4125-4139, 1973.
[199] F. Brüning, S. Matejcik, E. Illenberger, Y. Chu, G. Senn, D. Muigg, G. Denifl, and T. D.
Märk, "Effects of temperature on the dissociative electron attachment to N2O," Chemical
Physics Letters, vol. 292, pp. 177-182, 1998.
[200] M. Z. Hossain, T. Kubo, T. Aruga, N. Takagi, T. Tsuno, N. Fujimori, and M. Nishijima,
"Surface Phonons, Electronic Structure and Chemical Reactivity of Diamond (100)(2 x 1)
Surface," Japanese Journal of Applied Physics, vol. 38, p. 8, 1999.
[201] S. C. Jain and K. S. Krishnan, "The Thermionic Constants of Metals and Semi-
Conductors. I. Graphite," Proceedings of the Royal Society of London. Series A.
Mathematical and Physical Sciences, vol. 213, pp. 143-157, June 24, 1952 1952.