poly(ethylene oxide)-polyelectrolyte blends: viscometric and thermal analysis behaviour
TRANSCRIPT

Poly(ethylene oxide)–polyelectrolyte blends:viscometric and thermal analysis behaviourValdir Soldi,1* Helena M Wilhelm,1 Marly da S Soldi,1 Jose RS Rodrigues,1
Alfredo TN Pires1 and Maria R Sierakowski21Laboratorio de Polımeros (Polimat), Departamento de Quımica, Universidade Federal de Santa Catarina, 88040-900, Florianopolis, SC,Brazil2Departamento de Bioquımica, Universidade Federal do Parana (UFPR), Brazil
Abstract: The miscibility of binary poly(ethylene oxide) (PEO) and sodium poly(4-styrene sulphonate)
(PSS) or [3,6]-ionene (ION) systems, was analysed in aqueous solutions and in the solid state by
viscometry and thermal analysis, respectively. Both techniques indicate partial miscibility of PEO±
PSS and immiscibility of PEO±ION blends. In water solution, the partial miscibility of the PEO±PSS
system is probably due to the counterion Na� which can partially provide the driving force association
in a similar manner to that observed for PEO±surfactant systems. In blend ®lms, the PEO±
polyelectrolyte interaction is also analysed in terms of the effect on the PEO crystallization observed
through optical microscopy, and the results indicate compatibility between the components in the
PEO±PSS system.
# 2000 Society of Chemical Industry
Keywords: blends; miscibility; poly(ethylene oxide); polyelectrolytes
INTRODUCTIONPhysical properties, such as miscibility of poly(ethy-
lene oxide) (PEO) solution and PEO in blends with
other polymers and/or surfactants, have received
considerable attention in recent decades. In general,
the miscibility is a result of intermolecular interactions
such as hydrogen bonds with the electron pair of the
oxygen, hydrophobic interactions between the methy-
lene units of the polymer and those of the surfactant
alkyl group, and ion±dipole interactions between the
sulphonate group and ether oxygens.1±7
In solution, viscometry is one of the simplest
methods for studying the interactions and properties
of polymer±polymer and polymer±surfactant systems.
Attractive interaction increases the viscosity of these
systems, although the effect on surfactants depends on
anionic,1 non-ionic2 or cationic3 characteristics. For
example, the reduced viscosity of mixtures formed by
PEO8±10 or polyvinyl pyrrolidone (PVP)1 with sodium
dodecyl sulphate (SDS) increases when aggregates of
surfactant are formed and are increasing in size in the
polymer chain, tending to behave in a manner similar
to a polyelectrolyte. The solution viscosity also
increases in PEO±non-ionic surfactant systems, and
in general a more hydrophobic surfactant is more
effective in forming large network structures.11
The cationic surfactant cetyl pyridinium chloride
only interacts with high molecular weight PVP or
poly(ethylene glycol) (PEG).12 The viscosity of poly-
styrene (PS)±PEO and PS±PEG blends was measured
in benzene as a function of the blend composition, and
the interaction parameter used was the difference
between the experimental and the theoretical values of
the two polymers.13 Through viscometry, Ylmaz etal14 showed that in dilute solutions, PS±PEO and
polybutadiene-graft-polystyrene (PBS)±PEO are im-
miscible systems, and the miscibility parameter de-
creases with the increase in temperature. Viscosity
studies of solutions of PS±poly(vinyl chloride) (PVC),
PS±poly(vinyl acetate) and PS±poly[(vinyl chloride-
co-vinyl acetate)] (VCVAc) in tetrahydrofuran showed
immiscibility in agreement with thermal analysis
studies of blend ®lms.15 In contrast, miscibility was
observed for PVC±poly(n-butyl methacrylate)
(PBMA) under the same conditions.15 Studies
through viscometry are also in agreement with the
solid-state analysis for PVC±poly [ethylene-co-(vinyl
acetate)] (EVA) compatibility and EVA±poly(styrene-
co-acrylonitrile) (SAN) imcompatibility.16
In this work, studies on the interaction of poly
(ethylene oxide) with [3,6]-ionene (cationic) and
sodium poly(4-styrene sulphonate) (anionic) polyelec-
trolytes are reported. The main purpose is to analyse
the viscometric behaviour of the blends in water
Polymer International Polym Int 49:81±87 (2000)
* Correspondence to: Valdir Soldi, Laboratorio de Polımeros (Polimat), Departamento de Quımica, Universidade Federal de Santa Catarina,88040-900, Florianopolis, SC, BrazilContract/grant sponsor: Conselho Nacional de Desenvolvimento Cientıficoe Tecnologico (CNPq)Contract/grant sponsor: Coordenacao de Aperfeicoamento de Pessoal de Nivel Superior (CAPES)(Received 14 October 1998; revised version received 22 June 1999; accepted 14 September 1999)
# 2000 Society of Chemical Industry. Polym Int 0959±8103/2000/$17.50 81

solution in comparison with solid ®lms analysed by
thermal analysis and optical microscopy techniques.
EXPERIMENTALMaterialsSodium polystyrene-4-sulphonate (PSS, Aldrich,
Mw=70000g molÿ1), [3,6]-ioneno (ION, Aldrich,
Mw�15000g molÿ1) and poly(ethylene oxide),
(PEO, Aldrich, Mw=300000g molÿ1) were used
without further puri®cation.
Sample preparationUndiluted PEO, ION and PSS were ®rst dissolved in
water under mechanical stirring. The PEO±polyelec-
trolyte solutions for the viscosity analysis were
prepared from the dilution of a stock solution
(concentration 1gdlÿ1 of PEO±PSS or PEO±ION).
Cast ®lms for thermal and microscopic analysis were
obtained by slow solvent evaporation of PEO±PSS or
PEO±ION solutions of different compositions at room
temperature and dried in a vacuum oven at 40°C for 3
days.
Viscosity measurementsThe apparatus used in this work was a Brook®eld
rotational viscometer (model LDV III) equipped with
1.1 RheoCalc software. `Coaxial-cone' (spindles ULA
and CS4-18) and `cone-and-plate' (spindles cp-40 and
cp-52) modes were used for low and high shear rates,
respectively. The measurements were carried out in a
concentration range of 0.2±1.0gdlÿ1, at 25.0�0.1°Cwith 0.1M NaCl. For pure PSS and ION, Newtonian
behaviour has been observed according to the litera-
ture.17,18 However, in our experiment, non-New-
tonian behaviour was observed at low shear rate (less
than about 180sÿ1) for PEO, and a Newtonian plateau
was observed at a higher shear rate. All the blends had
the same behaviour as pure PEO. The values of
apparent viscosity for pure components and mixtures
were taken in relation to the Newtonian plateau at a
shear rate of 180sÿ1 and were used to determine the
speci®c and intrinsic viscosities.
Thermal analysisThermal analyses were carried out on a Shimadzu
DSC-50. The samples were ®rst heated from room
temperature to 200°C and 300°C for PEO±ION and
PEO±PSS blends, respectively, at a heating rate of
10°Cminÿ1. The samples were then slowly cooled to
room temperature. The crystalline melting tempera-
ture (Tm) was measured in the second heating, at
10°Cminÿ1. For a PEO±PSS (70/30) blend, we also
analysed the in¯uence of the ®rst run over the second
run. The effect was noted after heating the sample
(®rst run) from room temperature to 100, 200, 250
and 300°C.
The thermal stability of the pure components and
blends was analysed by thermogravimetry (TGA)
using a Shimadu TGA-50 thermal analyser under
nitrogen atmosphere. The samples were heated from
room temperature to 800°C with a uniform heating
rate of 10°Cminÿ1. Pure ionene decomposition was
observed above 260°C, whereas PEO and PSS
remained stable up to approximately 360°C.
Morphology analysisThe morphology of PEO, PEO±ION and PEO±PSS
blends was analysed using hot-stage optical micro-
scopy (HSOM). Crystal structure was studied using
polarized light on an Olympus microscope. The
samples were heated between two cover glasses at
5°Cminÿ1 up to 200°C and 300°C for PEO±ION and
PEO±PSS blends, respectively, and the subsequent
cooling to room temperature was conducted at the
same rate.
RESULTS AND DISCUSSIONViscometric behaviourDifferent criteria have been used to predict the
miscibility of binary polymeric solution systems in
terms of viscosity,16,19±22 one of which considers the
comparison between the theoretical speci®c viscosity
determined by intrinsic viscosity additivity19 and the
experimental values determined using relative vis-
cosity. In eqn (1), Zspm is the speci®c viscosity of the
mixed polymer solution, [Z]A and [Z]B indicate the
intrinsic viscosities, and CA and CB denote the
concentrations of the components A and B.
�spm � ���ACA � ���BCB �1�Figure 1 shows the speci®c viscosities versus the
PEO weight fraction [WPEO=CPEO/(CPEO�CPSS(ION))] of PEO±PSS and PEO±ION (inset)
mixtures. In both systems the continuous line repre-
Figure 1. Specific viscosity of PEO–PSS blends in 0.1M NaCl at 25°C.Inset: PEO–ION blends under the same conditions. For both plots, the solidline represents the theoretical values determined considering the additivityas eqn (1), and the experimental values are shown by filled squares.
82 Polym Int 49:81±87 (2000)
V Soldi et al

sents the viscosity behaviour considering additivity
according to the above equation, using 1.72dlgÿ1,
0.20dlgÿ1 and 0.14dlgÿ1 as the intrinsic viscosities for
PEO, PSS and ION, respectively, in 0.1M of NaCl. In
the PEO±PSS system, the experimental data showed a
positive deviation in the PEO weight fraction above
0.5, indicating attractive interaction between the
components. However, a negative deviation was
observed below the PEO weight fraction of 0.5,
indicating immiscibility in this composition range.
For PEO±ION mixtures, a very clear negative devia-
tion was observed in all PEO composition ranges,
indicating a repulsive interaction which in turn caused
a shrinkage of the macromolecular coils. These results
show that PEO±ION is an immiscible system similar
to that reported in the literature for PEO±cationic
surfactant systems in which no interactions were
observed.23±26
To analyse the PEO±PSS system in greater detail,
another criterion was used to predict miscibility
between the components in water solution. In the
procedure developed by Sun et al,22 the Huggins
coef®cient Km can be de®ned by three types of
interactions: (i) a long-range hydrodynamic interac-
tion of pairs of single molecules (Km1) as in eqn (2),
Km1 �KA���2AW 2
A �KB���2BW 2B � 2�KAKB�0:5���A���BWAWB
����AWA � ���BWB�2�2�
where WA and WB correspond to a weight fraction of
the components A and B, respectively, and KA and KB
express the Huggins coef®cients for the pure compo-
nents; (ii) the formation of double molecules, which in
our case was neglected because of the absence of a
strong speci®c force of attraction between molecules
and suf®ciently low concentration, and (iii) the
intermolecular attraction or repulsion, represented
by Km3=a. In this condition, Km can be described
by
Km � Km1 �Km3 �
KA���2AW 2A�KB���2BW 2
B�2�KAKB�0:5���A���BWAWB
����AWA � ���BWB�2��
�3�and the value of a for the PEO±PSS system deter-
mined using
� � Km ÿKm1 �4�The Huggins coef®cients Km in the blend, and KA and
KB for pure components were determined by
�sp
C� ��� �K ���2C �5�
considering the slope of the plot of ZSP/C versus C.
According to the parameter a a miscible system is
related by a�0, and the system is immiscible when
a<0. In Table 1, we show the Huggins coef®cients
and a parameters for pure components and PEO±PSS
blends. Values of the Huggins coef®cients between 0.3
and 0.7 indicate weak association of the polymer26 and
are typical for a good solvent.27,28 Huggins coef®cients
higher than 0.7, as observed in PEO weight fractions of
0.85 and 0.70, indicates molecular entanglement
between chains, and in this case are probably due to
the interactions between the components. In this
composition, positive values of a were observed, and
according to this criterion, miscibility occurred above
the PEO weight fraction of 0.5, with immiscibility
occurring in blends of lower composition. Sun et al22
studied poly(vinyl chloride)±poly(methyl methacry-
late) blends using this method, and positive a values
were observed in all composition ranges. The depen-
dency on the concentration ratio of both polymers in
the mixture was also observed in PSS±PVP blends.29
The results indicate repulsive interactions between
the components in the PEO±ION mixtures. It is well
known30 that ionene properties in general are related to
Figure 2. DSC thermograms for pure components and PEO–ION blends ofdifferent compositions as indicated. Heating rate 10°Cminÿ1.
Table 1. Huggins constant values and a parameter for pure components andPEO–PSS blends in 0.1M NaCl at 25°C
System WAa Km Km1 a
PEO±PSS 1 0.368 ± ±
0.80 0.875 0.367 0.508
0.70 0.815 0.366 0.449
0.50 0.336 0.365 ÿ0.029
0.30 0.253 0.361 ÿ0.108
0 0.338 ± ±
a Weight fraction of PEO in the blend.
Polym Int 49:81±87 (2000) 83
Viscometry and thermal analysis of PEO/polyelectrolyte blends

the high linear charge density in the main chain, and the
conformation of [3,6]-ionene, for example, is extended
duetotheelectrostaticrepulsive interactionbetweenthe
ionizable groups. Interactions between ionenes and
non-ionic polymers are reported in a few papers,31±33
and in general are associated with the complexation
between the ionene quaternary ammonium group and
high molecular weight polymers.
Partial miscibility, therefore, hasbeen observed in the
PEO±PSS system. As has already been discussed,8,9
charge repulsion between the aggregates expands the
polymer coil dimensions, increasing the reduced vis-
cosity. The effect of the counterion on the PEO±anionic
surfactant interaction has also been reported,34,35 and
the results show that sodium dodecyl sulphate interacts
more strongly with PEO than with lithium or cupric
dodecyl sulphate. This effect is attributed to the af®nity
ofthecounterionforthecomplexationwiththepolymer,
and in the case of the divalent cupric counterion it is
attributed to the larger degree of hydration compared
with that of the monovalent Na�. In the PEO±PSS
system, the counterion Na� can partially provide the
driving force association, because in water it is simulta-
neously electrostatically bound to PSS and is coorde-
nated with PEO. Similar behaviour was observed in
complexes of PEO with salts of alkali metals.36 In the
interaction between the ether oxygens of PEO and the
alkali-metal cation, three ethylene oxide repeat units are
coordinated with one Na� ion in this case, as con®rmed
Figure 3. DSC thermograms for pure components and PEO–PSS blendsof different compositions as indicated. Heating rate 10°Cminÿ1.
Figure 4. Ratio of enthalpic heat variation of pure PEO and the calculatedvalue corresponding to PEO in the blend versus polyelectrolytepercentage: &, PEO–PSS; ~, PEO–ION.
Figure 5. DSC thermograms for pure PEO and PEO–PSS blend (70/30) asa second run with the first scan up to: (A) 300°C, (B) 100°C, (C) 200°C, (D)250°C and (E) 300°C. Heating rate 10°C minÿ1.
84 Polym Int 49:81±87 (2000)
V Soldi et al

by wide-angle X-ray scattering. For the PEO±PSS
system studied in this work, the counterion Na� is
probably responsible for the coordination of both
polymer and polyelectrolyte in a similar manner to that
reported for the PEO±SDS system by Dubin et al.37
Thermal analysis of blend filmsThe DSC thermograms of PEO±ION blends are
shown in Fig 2. The curves at the top and the bottom
are for undiluted PEO and ION, respectively. The
intermediate curves are for blends containing 25wt%,
Figure 6. Optically polarizedphotomicrographs of pure PEO (A) andblends with PEO–ION (w/w) of 55/45 (B)and 25/75 (C). For blends 85/15 (w/w) thePEO crystallization temperatures were:46°C (D), 41°C (E) and 39°C (F). The baris 100mm long. [ ]
Figure 7. Optically polarizedphotomicrographs of pure PEO (A) andblends with PEO–PSS (w/w) with 85/15 (B),40/60 (C) and (D) 10/90. The bar is 100mmlong. [ ]
Polym Int 49:81±87 (2000) 85
Viscometry and thermal analysis of PEO/polyelectrolyte blends
55wt%, and 70wt% PEO. The melting temperature
Tm of PEO at 62°C did not change with the presence
of ION as may be observed in intermediate curves.
The endothermic peak simply indicates that the
absorbed heat decreases proportionally with the
percentage decrease of PEO in the blend. This
indicates that ION acts merely as a diluent and does
not affect PEO crystallization.
Figure 3 shows DSC results in the melting region for
PEO±PSS blends. The curve at the top represents pure
PSS, the intermediate curves are for blends with 25,
40, 55, 70 and 85wt% PEO, and undiluted PEO is
given by the bottom curve. In relation to the
endothermic peaks in the PEO±PSS blends with
compositions between 40 and 70% of PEO, changes
to values lower than those of the undiluted semicrys-
talline component, indicate partial miscibility between
the components in this composition range. The
broadening of the endothermic peaks is probably
related to changes in the PEO crystallization. The
effect of both polyelectrolytes on the PEO melting
temperature was analysed in terms of the melting
enthalpies of PEO in the blend in comparison with the
value for undiluted PEO. The ratios of the melting
enthalpy of PEO in the blend and in undiluted form
are shown in Fig 4 for both systems studied. In the
PEO±ION system, the ratio is unity, indicating the
absence of effect due to ION in the blend. This
behaviour is in agreement with the viscometric and
DSC data, and is indicative of immiscibility between
the components. In contrast, in the PEO±PSS system
the ratio of enthalpies deviates signi®cantly from unity,
indicating that the PSS disturbs the PEO crystallinity,
in agreement with the partial miscibility discussed
above.
Figure 5 shows the PEO melting curves of PEO±
PSS (70/30) blends, obtained as a second run, after
running samples at different annealing temperatures in
the ®rst run. Thermograms A and E represent a
second run of pure PEO and blend, respectively,
which were ®rst scanned up to 300°C and than cooled
to room temperature. In the same manner, samples B,
C and D were ®rst run up to 100°C, 200°C and
250°C, respectively. The presence of a shoulder in B
and a double melting peak in C indicates two crystal
populations give rise to the melting behaviour. We also
observed that with the temperature increase in the ®rst
run, the endothermic peaks broadened and shifted to a
lower melting temperature. The above behaviour is
related to changes of crystallization during quenching.
Morphology and PEO crystallizationFigure 6 shows the photomicrograph of pure PEO and
PEO±ION blends. Pure PEO crystallization (Fig 6A)
shows a typical spherulitic structure with ®brous
subunits extended radially outwards from the central
nucleus, as has been previously discussed.38 Blends
with 85% PEO (Fig 6D±F) at different crystallization
temperatures showed the same spherulitic morphology
in the PEO domains. Similar behaviour was observed
in blends with 55% of PEO (Fig 6B). The amount of
ION in the mixture remains in speci®c domains
without perturbing the PEO crystallization. With
25% PEO (Fig 6C), crystal formation is not very
clear, probably because of the presence of large
domains of ION. Apparently, some crystals must be
present in the clear part of the photomicrograph. The
immiscibility of the PEO±ION system is once again in
agreement with the DSC results.
In Fig 7, we show the PEO crystallization in the
presence of 15, 60 and 90% of PSS in the blend (Fig
7B±D). The decrease in spherulite size and change in
morphology when the PSS content in the blend
increases is clear. In compositions with 15 and 60%
of PSS the crystal distribution is very homogeneous,
indicating the in¯uence of one component over
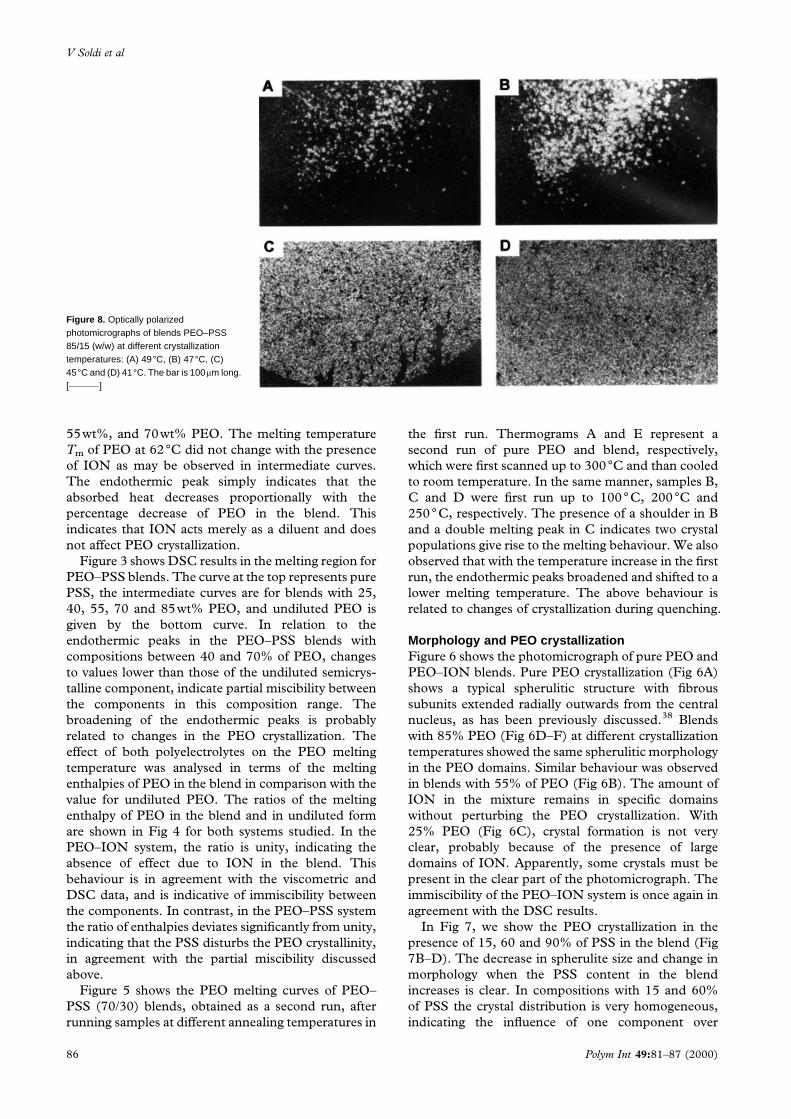
Figure 8. Optically polarizedphotomicrographs of blends PEO–PSS85/15 (w/w) at different crystallizationtemperatures: (A) 49°C, (B) 47°C, (C)45°C and (D) 41°C. The bar is 100mm long.[ ]
86 Polym Int 49:81±87 (2000)
V Soldi et al

another. In blends with a large amount of PSS (90%),
the PEO crystal grows inspeci®c domains but with the
same characteristics in size and morphology. Micro-
graphs kept at different crystallization temperatures
are shown in Fig 8 for blends with 85% PEO. As may
be observed, PEO crystallization is very fast and the
PEO crystal size is smaller, achieving a homogeneous
distribution in the matrix.
In conclusion, it is clear that the solution viscosity
data are in agreement with the behaviour observed by
thermal analysis studies of blend ®lms. Partial mis-
cibility is observed for PEO±PSS systems with PEO
concentration higher than 50wt%. In terms of vis-
cosity, the results show behaviour similar to the data
reported for PEO±surfactant interactions, and the
counterion Na�must be responsible for the miscibility
of PEO with the anionic polyelectrolyte. These
conclusions are supported by the effect of PSS on
PEO crystallization as observed by optical microscopy.
ACKNOWLEDGEMENTSThis research was supported by Conselho Nacional de
Desenvolvimento Cientõ®co e TecnoloÂgico (CNPq)
and CoordenacËaÄo de AperfeicËoamento de Pessoal de
NõÂvel Superior (CAPES).
REFERENCES1 Robb ID, in Anionic Surfactants ± Physical Chemistry of Surfactant
Action, Vol 11, Ed by Lucassen Reynders EH, Marcel Dekker,
New York, p 109 (1981).
2 Saito S, in Nonionic Surfactants ± Physical Chemistry, Vol 23, Ed
by Marcel Dekker MJ, New York, p 881 (1987).
3 Hayakawa K and Kwak JCT, in Cationic Surfactants: Physical
Chemistry, Ed by Rubingh DN and Holland PM, Vol 37,
Marcel Dekker, New York, p 189 (1991).
4 Xia J, Dubin PL and Kim Y, J Phys Chem 96:6805 (1992).
5 Hansson P and Almgren M, Langmuir 10:2115 (1994).
6 Olofsson G and Wang G, Pure Appl Chem 66:527 (1994).
7 Kresheck GC and Hargraves WA, J Colloid Interface Sci 83:1
(1981).
8 Minatti E and Zanette D, Colloids Surf A 113:327 (1996).
9 Tam KC, in Hydrophilic Polymers: Performance with Environmental
Acceptance, Ed by Glass JE, American Chemical Society,
Washington DC, p 205 (1996).
10 Van Stam J, Brown W, Fundin J, Almgren M and Lindblad C,
ACS Symp Ser 532:194 (1993).
11 Alami E, Almgren M and Brown W, Macromolecules 29:5026
(1996).
12 Mateos IG, PeÂrez S and VelaÂzquez MJ, J Colloid Interface Sci
194:356 (1997).
13 Abdel-Azim AA, Atta AM, Farahat MS and Boutros WY, J Appl
Polym Sci 69:1471 (1998).
14 Ylmaz E, Ylmaz O and Caner H, Eur Polym J 32:927 (1996).
15 Danait A and Deshpande DD, Eur Polym J 31:1221 (1995).
16 Lizymol PP and Thomas S, J Appl Polym Sci 51:635 (1994).
17 Ganter JLMS, Millas M and Rinaudo M, Polymer 33:113 (1992).
18 Whorlow RW, in Rheological Techniques, Ed by Ellis H Limited,
England, p 26 (1980).
19 Catsiff EH and Hewett WA, J Appl Polym Sci 6:530 (1962).
20 Lizymol PP and Thomas S, Eur Polym J 30:1135 (1994).
21 Raval H and Surekha D, Angew Makromol Chem 227:27 (1995).
22 Sun Z, Wang W and Feng Z, Eur Polym J 28:1259 (1992).
23 Winnik FM, Winnik MA and Tazuke S, J Phys Chem 91:594
(1987).
24 Napper DH, Polymeric Stabilization of Colloidal Dispersions,
Academic Press, London, p 141 (1983).
25 Olofsson G and Wang G, Pure Appl. Chem 66:527 (1994).
26 Mc Cleary BV, Progr Food Nutr Sci Elmsford 6:108 (1982).
27 Weill G, Proceedings of an International workshop on plant
polysaccharides, structure and function, CNRS±INRA, p 113
(1984).
28 Tager A, in Physical Chemistry of Polymers, 2nd edn, Mir
Publishers, Moscow, p 453 (1978).
29 Garcia R, Gomez CM, Porcar I, Figueruelo JE and Campos A,
Eur Polym J, 33:1723 (1997).
30 Soldi V, Erismann NM and Quina FH, J Am Chem Soc 110:5137
(1988).
31 Ohno H and Tsuchida E, Makromol Chem Rapid Commum 1:585
(1980).
32 Bortel E and Kochanowski A, Makromol Chem 185:1409 (1984).
33 Bortel E and Styslo M, Angew Makromol Chem 138:61 (1986).
34 Abuin E, Lissi E, Quina F and Paredes S, Bol Soc Chil Quim 40:65
(1995).
35 Kamenka N, Burgaud I, Treiner C and Zana R, Langmuir
10:3455 (1996).
36 Eastmond GC, Scho®eld P and Sakellariou P, Polymer 38:1753
(1997).
37 Dubin PL, Gruber JH, Xia J and Zhang H, J. Colloid Interface Sci.
148:35 (1992).
38 Sotele JJ, Soldi V and Pires ATN, Polymer 38:1179 (1997).
Polym Int 49:81±87 (2000) 87
Viscometry and thermal analysis of PEO/polyelectrolyte blends