polyethylene tererphthalate (pet) resin from … tererphthalate (pet) resin from india, indonesia,...
TRANSCRIPT
Polyethylene Tererphthalate (PET) Resin from India, Indonesia, Taiwan, and
Thailand Investigations Nos. 701 -TA-439-440 and 731 -TA-1077-1080 (Preliminary)
Publication 3694 Mav 2004
Washington, DC 20436

COMMISSIONERS
Deanna Tanner Okun, Chairman Jennifer A. Hillman, Vice-chairman
Marcia E. Miller Stephen Koplan Charlotte R. Lane Daniel R. Pearson
Robert A. Rogowsky Director of Operations
Staff assigned
Jim McClure, Senior Investigator Raymond Cantrell, Industry Analyst
Clark Workman, Economist David Boyland, Auditor
Michael Haldenstein, Attorney Lita David-Harris, Statistician
Address all communications to Secretary to the Commission
United States International Trade Commission Washington, DC 20436
I U.S. International Trade Commission Washington, DC 20436
www. usitc.gov
Polyethylene Terephthalate (PET) Resin from India, Indonesia, Taiwan,
and Thailand
I nves t ig a t ion s
Publication 3694
Nos. 701 -439-440 and 731 -TA-1077-1080 ( P ret i mi nary )
May 2004

Contains Business Proprietary Information
CONTENTS
Page
. . . . . . . . . . . . . . . . . . . . . . . . . . . . . . . . . . . . . . . . . . . . . . . . . . . . . . . . . . . . . . . . . . Determinations 1 ViewsoftheCommission 3 PartI: Introduction . . . . . . . . . . . . . . . . . . . . . . . . . . . . . . . . . . . . . . . . . . . . . . . . . . . . . . . . . . . . . . 1-1
Background . . . . . . . . . . . . . . . . . . . . . . . . . . . . . . . . . . . . . . . . . . . . . . . . . . . . . . . . . . . . . . . . . . 1-1 Summarydata . . . . . . . . . . . . . . . . . . . . . . . . . . . . . . . . . . . . . . . . . . . . . . . . . . . . . . . . . . . . . . . . 1-1 Nature and extent of alleged subsidies and sales at LTFV .............................. 1-1 Summary of market participants . . . . . . . . . . . . . . . . . . . . . . . . . . . . . . . . . . . . . . . . . . . . . . . . . . 1-2 The subjectproduct . . . . . . . . . . . . . . . . . . . . . . . . . . . . . . . . . . . . . . . . . . . . . . . . . . . . . . . . . . . 1-3
1-3
Channels of distribution . . . . . . . . . . . . . . . . . . . . . . . . . . . . . . . . . . . . . . . . . . . . . . . . . . . . . 1-5 Price . . . . . . . . . . . . . . . . . . . . . . . . . . . . . . . . . . . . . . . . . . . . . . . . . . . . . . . . . . . . . . . . . . . . 1-5
11-1 U.S. market segments/channels of distribution ...................................... 11-1 Supply and demand considerations . . . . . . . . . . . . . . . . . . . . . . . . . . . . . . . . . . . . . . . . . . . . . . . 11-1
Subjectimports . . . . . . . . . . . . . . . . . . . . . . . . . . . . . . . . . . . . . . . . . . . . . . . . . . . . . . . . . . . . 11-2 U.S.demand . . . . . . . . . . . . . . . . . . . . . . . . . . . . . . . . . . . . . . . . . . . . . . . . . . . . . . . . . . . . . . 11-2
11-3
111-1 U.S.producers . . . . . . . . . . . . . . . . . . . . . . . . . . . . . . . . . . . . . . . . . . . . . . . . . . . . . . . . . . . . . . . 111-1
111-3 111-4 111-4 1v-1 1v-1
. . . . . . . . . . . . . . . . . . . . . . . . . . . . . . . . . . . . . . . . . . . . . . . . . . . . . . . . .
Physical characteristics and uses and manufacturing process ......................... Interchangeability and customer and producer perceptions .......................... 1-4
Part 11: Conditions of competition in the U.S. market ...................................
U.S.supply . . . . . . . . . . . . . . . . . . . . . . . . . . . . . . . . . . . . . . . . . . . . . . . . . . . . . . . . . . . . . . . 11-1
Substitutabilityissues . . . . . . . . . . . . . . . . . . . . . . . . . . . . . . . . . . . . . . . . . . . . . . . . . . . . . . . . . . 11-3 Comparison of domestic products and subject imports . . . . . . . . . . . . . . . . . . . . . . . . . . . . . . Other country comparisons . . . . . . . . . . . . . . . . . . . . . . . . . . . . . . . . . . . . . . . . . . . . . . . . . . . 11-5
Part 111: U.S. producers’ production, shipments, and employment ..........................
U.S. producers’ capacity, production. capacity utilization. and shipments of PET resin U.S. producers’ inventories of PET resin . . . . . . . . . . . . . . . . . . . . . . . . . . . . . . . . . . . . . . . . . . . U.S. producers’ employment. compensation. and productivity with respect to PET resin . . . . .
Negligibility . . . . . . . . . . . . . . . . . . . . . . . . . . . . . . . . . . . . . . . . . . . . . . . . . . . . . . . . . . . . . . . . . 1v-3 Apparent U.S. consumption of PET resin . . . . . . . . . . . . . . . . . . . . . . . . . . . . . . . . . . . . . . . . . . 1v-4
Ratio of subject imports to U.S. production . . . . . . . . . . . . . . . . . . . . . . . . . . . . . . . . . . . . . . . . .
. . . . . .
Part IV: U.S. imports, apparent U.S. consumption, and market shares ...................... U.S. imports of PET resin . . . . . . . . . . . . . . . . . . . . . . . . . . . . . . . . . . . . . . . . . . . . . . . . . . . . . . .
U.S.marketshares . . . . . . . . . . . . . . . . . . . . . . . . . . . . . . . . . . . . . . . . . . . . . . . . . . . . . . . . . . . . 1v-6 1v-7 V-1
Factors affecting prices . . . . . . . . . . . . . . . . . . . . . . . . . . . . . . . . . . . . . . . . . . . . . . . . . . . . . . . . . V-1 Raw material costs . . . . . . . . . . . . . . . . . . . . . . . . . . . . . . . . . . . . . . . . . . . . . . . . . . . . . . . . . . V-1 Transportation costs to the U.S. market . . . . . . . . . . . . . . . . . . . . . . . . . . . . . . . . . . . . . . . . . V-2 U.S. inland transportation costs . . . . . . . . . . . . . . . . . . . . . . . . . . . . . . . . . . . . . . . . . . . . . . . . V-2 Exchangerates . . . . . . . . . . . . . . . . . . . . . . . . . . . . . . . . . . . . . . . . . . . . . . . . . . . . . . . . . . . . . V-2
Part V: Pricing and related information . . . . . . . . . . . . . . . . . . . . . . . . . . . . . . . . . . . . . . . . . . . . . .
i
Contains Business Proprietary In formation
CONTENTS-Continued
Page
Part V: Pricing and related information-Continued Pricingpractices . . . . . . . . . . . . . . . . . . . . . . . . . . . . . . . . . . . . . . . . . . . . . . . . . . . . . . . . . . . . . .
Pricingmethods . . . . . . . . . . . . . . . . . . . . . . . . . . . . . . . . . . . . . . . . . . . . . . . . . . . . . . . . . . . . Pricedata . . . . . . . . . . . . . . . . . . . . . . . . . . . . . . . . . . . . . . . . . . . . . . . . . . . . . . . . . . . . . . . . . . .
Pricetrends . . . . . . . . . . . . . . . . . . . . . . . . . . . . . . . . . . . . . . . . . . . . . . . . . . . . . . . . . . . . . . . Pricecomparisons . . . . . . . . . . . . . . . . . . . . . . . . . . . . . . . . . . . . . . . . . . . . . . . . . . . . . . . . . .
Lost sales and lost revenues
Background . . . . . . . . . . . . . . . . . . . . . . . . . . . . . . . . . . . . . . . . . . . . . . . . . . . . . . . . . . . . . . . . . .
. . . . . . . . . . . . . . . . . . . . . . . . . . . . . . . . . . . . . . . . . . . . . . . . . . . . . Part VI: Financial experience of U.S. producers .......................................
Operations on PET resin . . . . . . . . . . . . . . . . . . . . . . . . . . . . . . . . . . . . . . . . . . . . . . . . . . . . . . . . Capital expenditures and R&D expenses . . . . . . . . . . . . . . . . . . . . . . . . . . . . . . . . . . . . . . . . . . . Assets and return on investment . . . . . . . . . . . . . . . . . . . . . . . . . . . . . . . . . . . . . . . . . . . . . . . . . . Capitalandinvestment . . . . . . . . . . . . . . . . . . . . . . . . . . . . . . . . . . . . . . . . . . . . . . . . . . . . . . . . .
Part VII: Threat considerations . . . . . . . . . . . . . . . . . . . . . . . . . . . . . . . . . . . . . . . . . . . . . . . . . . . . . TheindustryinIndia . . . . . . . . . . . . . . . . . . . . . . . . . . . . . . . . . . . . . . . . . . . . . . . . . . . . . . . . . . . TheindustryinIndonesia . . . . . . . . . . . . . . . . . . . . . . . . . . . . . . . . . . . . . . . . . . . . . . . . . . . . . . . TheindustryinTaiwan . . . . . . . . . . . . . . . . . . . . . . . . . . . . . . . . . . . . . . . . . . . . . . . . . . . . . . . . . The industry in Thailand . . . . . . . . . . . . . . . . . . . . . . . . . . . . . . . . . . . . . . . . . . . . . . . . . . . . . . . U.S. inventories of PET resin from the subject countries U.S. importers’ current orders . . . . . . . . . . . . . . . . . . . . . . . . . . . . . . . . . . . . . . . . . . . . . . . . . . . Antidumping and countervailing duty orders in third-country markets ....................
..............................
v-2 v-2 v-5 V-6 V-6 v-7
VI- 1 VI- 1 VI- 1 v14 v14 v1-7
v11-1 VII- 1 VII- 1 v11-1 vn- 1 v11-3 v11-4 v114
Appendixes
A . Federal Register notices . . . . . . . . . . . . . . . . . . . . . . . . . . . . . . . . . . . . . . . . . . . . . . . . . . . . . . A-1
C . Summarydata . . . . . . . . . . . . . . . . . . . . . . . . . . . . . . . . . . . . . . . . . . . . . . . . . . . . . . . . . . . . . . . C-1 B . Conferencewitnesses . . . . . . . . . . . . . . . . . . . . . . . . . . . . . . . . . . . . . . . . . . . . . . . . . . . . . . . . . B-1
D . Weighted-average prices of products 1.2. and 4 for imports from all subject
E . Alleged effects of imports of PET resin from India. Indonesia. Taiwan. and Thailand countriescombined . . . . . . . . . . . . . . . . . . . . . . . . . . . . . . . . . . . . . . . . . . . . . . . . . . . . . . . . . D-1
on U.S. producers’ existing development and production efforts. growth. investment. and ability to raise capital . . . . . . . . . . . . . . . . . . . . . . . . . . . . . . . . . . . . . . . . . . . . . . . . . . . . E-1
Note.-Information that would reveal confidential operations of individual concerns may not be published and. therefore. has been deleted from this report . Such deletions are indicated by asterisks .
11

UNITED STATES INTERNATIONAL TRADE COMMISSION
Investigations Nos. 70 1 -TA-439440 and 73 1 -TA-1077-1080 (Preliminary)
POLYETHYLENE TEREPHTHALATE (PET) RESIN FROM INDIA, INDONESIA, TAIWAN, AND THAILAND
DETERMINATIONS
On the basis of the record’ developed in the subject investigations, the United States International Trade Commission (Commission) determines, pursuant to sections 703(a) and 733(a) of the Tariff Act of 1930 (19 U.S.C. 3 1671b(a)) and 19 U.S.C. 6 1673b(a)) (the Act), that there is a reasonable indication that an industry in the United States is materially injured by reason of imports from India and Thailand of polyethylene terephthalate (PET) resin provided for in subheading 3907.60.00 of the Harmonized Tariff Schedule of the United States, that are alleged to be subsidized by Governments of India and Thailand and by reason of imports from India, Indonesia, Taiwan, and Thailand of PET resin that are alleged to be sold in the United States at less than fair value (LTFV).
COMMENCEMENT OF FINAL PHASE INVESTIGATIONS
Pursuant to section 207.18 of the Commission’s rules, the Commission also gives notice of the commencement of the final phase of its investigations. The Commission will issue a final phase notice of scheduling, which will be published in the Federal Register as provided in section 207.21 of the Commission’s rules, upon notice from the Department of Commerce (Commerce) of affirmative preliminary determinations in the investigations under sections 703(b) and 733(b) of the Act, or, if the preliminary determinations are negative, upon notice of affirmative final determinations in those investigations under sections 705(a) and 735(a) of the Act. Parties that filed entries of appearance in the preliminary phase of the investigations need not enter a separate appearance for the final phase of the investigations. Industrial users, and, if the merchandise under investigation is sold at the retail level, representative consumer organizations have the right to appear as parties in Commission countervailing duty and antidumping investigations. The Secretary will prepare a public service list containing the names and addresses of all persons, or their representatives, who are parties to the investigations.
BACKGROUND
On March 24,2004, a petition was filed with the Commission and Commerce by the U.S. PET Resin Producers’ Coalition, Washington, DC, alleging that an industry in the United States is materially injured or threatened with material injury by reason of subsidized and LTFV imports of PET resin from India, Indonesia, Taiwan, and Thailand. Accordingly, effective March 24,2004, the Commission instituted countervailing duty and antidumping investigations Nos. 70 1 -TA-439-440 and 73 1 -TA-1077- 1080 (Preliminary).
in connection therewith was given by posting copies of the notice in the Office of the Secretary, U.S. International Trade Commission, Washington, DC, and by publishing the notice in the Federal Register
Notice of the institution of the Commission’s investigations and of a public conference to be held
’ The record is defined in sec. 207.2(f) of the Commission’s Rules of Practice and Procedure (19 CFR tj 207.2(0).
of March 3 1,2004 (69 FR 16955). The conference was held in Washington, DC, on April 14,2004, and all persons who requested the opportunity were permitted to appear in person or by counsel.

VIEWS OF THE COMMISSION
Based on the record in these investigations, we find that there is a reasonable indication that an industry in the United States is materially injured by reason of imports of bottle-grade polyethylene terephthalate resin (“PET resin”) from India and Thailand that are allegedly subsidized and by reason of imports of bottle-grade PET resin from India, Indonesia, Taiwan, and Thailand that are alleged to be sold in the United States at less than fair value.
I. THE LEGAL STANDARD FOR PRELIMINARY DETERMINATIONS
The legal standard for preliminary antidumping and countervailing duty determinations requires the Commission to determine, based upon the information available at the time of the preliminary determinations, whether there is a reasonable indication that a domestic industry is materially injured or threatened with material injury, or that the establishment of an industry is materially retarded, by reason of the allegedly unfairly traded imports.’ In applying this standard, the Commission weighs the evidence before it and determines whether “( 1) the record as a whole contains clear and convincing evidence that there is no material injury or threat of such injury; and (2) no likelihood exists that contrary evidence will arise in a final investigation.”2
11. BACKGROUND
The petition was filed by the U.S. PET Resin Producers’ Coalition, which consists of four of the seven U.S. producers of bottle-grade PET resin. The Commission received questionnaire responses from all seven U.S. producers.
containers approved by the Food and Drug Administration (FDA), as well as to produce other containers and strapping. Bottle-grade PET resin producers sell the product to downstream converters who fabricate the resin into products for end-use applications. Major end use applications are containers for soft drinks, water, juices, peanut butter, jams and jellies, salad dressings, cooking oils, household cleaners, and cosmetics.
Domestically produced shipments of bottle-grade PET resin accounted for just over 83 percent of the market during the period examined while imports of bottle-grade PET resin from the four subject countries, after gaining over 5 percentage points of market share between 2001 and 2003, accounted for more than 10 percent of the market in 2003.
PET is a large-volume commodity plastic resin commonly used to produce bottles and other
111. DOMESTIC LIKE PRODUCT
A. InGeneral
To determine whether there is a reasonable indication that an industry in the United States is materially injured or threatened with material injury by reason of imports of the subject merchandise, the
’ 19 U.S.C. 6 1673b(a); see also American Lamb Co. v. United States, 785 F.2d 994, 1001-04 (Fed. Cir. 1986);
* American Lamb, 785 F.2d at 1001; see also Texas Crushed Stone Co. v. United States, 35 F.3d 1535, 1543 Aristech Chemical Corn. v. United States, 20 CIT 353,354-55 (1996).
(Fed. Cir. 1994).
3
Commission first defines the “domestic like product” and the “indu~try.”~ Section 77 1(4)(A) of the Tariff Act of 1930, as amended (“the Act”), defines the relevant domestic industry as the “producers as a [wlhole of a domestic like product, or those producers whose collective output of a domestic like product constitutes a major proportion of the total domestic production of the produ~t.”~ In turn, the Act defines “domestic like product” as “a product which is like, or in the absence of like, most similar in characteristics and uses with, the article subject to an investigation . . . .”5
The decision regarding the appropriate domestic like product(s) in an investigation is a factual determination, and the Commission has applied the statutory standard of “like” or “most similar in characteristics and uses” on a case-by-case bask6 No single factor is dispositive, and the Commission may consider other factors it deems relevant based on the facts of a particular in~estigation.~ The Commission looks for clear dividing lines among possible like products, and disregards minor variatiom8 Although the Commission must accept the determination of the Department of Commerce (“Commerce”) as to the scope of the imported merchandise allegedly subsidized or sold at LTFV, the Commission determines what domestic product is like the imported articles Commerce has identified.’ The Commission must base its domestic like product determination on the record in the investigation before it. The Commission is not bound by prior determinations, even those pertaining to the same imported products, but may draw upon previous determinations in addressing pertinent like product issues.”
B. Product Description
In its notice of initiation, Commerce defined the imported merchandise within the scope of these investigations as:
19 U.S.C. Q 1677(4)(A).
19 U.S.C. 9 1677(10). See, G, NEC Corp. v. Department o f Commerce, 36 F. Supp.2d 380,383 (Ct. Int’l Trade 1998); Nippon Steel
C o r n y United States, 19 CIT 450,455 (1995); Torrington Co. v. United States, 747 F. Supp. 744, 749 n.3 (Ct. Int’l Trade 1990), a, 938 F.2d 1278 (Fed. Cir. 1991) (“every like product determination ‘must be made on the particular record at issue’ and the ‘unique facts o f each case”’). The Commission generally considers a number o f factors including: (1 ) physical characteristics and uses; (2) interchangeability; (3) channels o f distribution; (4) customer and producer perceptions o f the products; (5) common manufacturing facilities, production processes, and production employees; and, where appropriate, (6) price. See Nippon, 19 CIT at 455 n.4; Timken Co. v. United States, 913 F. Supp. 580, 584 (Ct. Int’l Trade 1996).
41d.
’ - See, u, S. Rep. No. 249, 96th Cong., 1” Sess., at 90-91 (1979). Nippon Steel, 19 CIT at 455; Torrington, 747 F. Supp. at 748-49; see also S. Rep. No. 249 at 90-91 (Congress
has indicated that the domestic like product standard should not be interpreted in “such a narrow fashion as to permit minor differences in physical characteristics or uses to lead to the conclusion that the product and article are not ‘like’ each other, nor should the definition o f ‘like product’ be interpreted in such a fashion as to prevent consideration o f an industry adversely affected by the imports under consideration.”).
Hosiden Corn. v. Advanced Displav Mfis., 85 F.3d 1561, 1568 (Fed. Cir. 1996) (Commission may find a single domestic like product corresponding to several different classes or kinds defined by Commerce); Torrington, 747 F. Supp. at 748-52 ( a f f i n g Commission’s determination o f six domestic like products in investigations where Commerce found five classes or kinds).
NipponSteel Corn. v. United States, 19 CIT 450,455 (1995); Asociacion Colombiana de Exportadores de Flores v. United States, 693 F. Supp. 1165, 1169 n.5 (Ct. Int’l Trade 1988) (particularly addressing like product determination); Citrosuco Paulista. S.A. v. United States, 704 F. Supp. 1075, 1087-88 (Ct. Int’l Trade 1988).
lo See Acciai Speciali Terni S.U.A. v. United States, 118 F. Supp.2d 1298, 1304-05 (Ct. h t ’ l Trade 2000);
4
bottle-grade polyethylene terephthalate (PET) resin, defined as having an intrinsic viscosity of at least 0.68 deciliters per gram but not more than 0.86 deciliters per gram. The scope includes bottle-grade PET resin that contains various additives introduced in the manufacturing process. The scope does not include post-consumer recycle (PCR) or post-industrial recycle (PIR) PET resin; however, included in the scope is any bottle- grade PET resin blend of virgin PET bottle-grade resin and recycled PET (WET). Waste and scrap PET is outside the scope of the investigations. Fiber-grade PET resin, which has an intrinsic viscosity of less than 0.68 deciliters per gram, is also outside the scope of the investigations.”
PET resin is a polymer that is formed by combining two monomers: mono ethylene glycol (“MEG’) and purified terephthalic acid (“PTA’7).1’ It is produced by a melt polymerization of PTA and MEG, followed by a solid stating process that increases the molecular weight, crystallinity and melt viscosity to the level desired by the end-u~er.’~ Bottle-grade PET resin is sold in bulk as pellets, specifically for the manufacture of bottles and other sterile containers for f00d.I~ Bottles and other food containers made from bottle-grade PET resin are generally manufactured using an injection stretch blow-molding proce~s.’~
lightweight with excellent gas barrier and strength properties.16 The plastic bottles used for water and soft drinks are produced from bottle-grade PET resin.17 Containers in which solid foods, such as strawberries and cupcakes, are packed as well as strapping for holding bulk products are also made from bottle-grade PET resin.”
Containers manufactured fkom bottle-grade PET resin are characterized as being clear, sterile and
C. Domestic Like Product
The petitioner urges the Commission to adopt a definition of the domestic like product coterminous with the scope of the investigations, bottle-grade PET resin.” No party has argued for a domestic like product different from that proposed by petitioner. Although there are grades of PET resin other than bottle-grade, they are not used for production of bottles and other containers for food.” There is no indication on the record in these preliminary investigations that it would be appropriate to include any of the other grades of PET resin in the definition of the domestic like product. Accordingly, for purposes of these preliminary investigations, we define the domestic like product coterminously with the scope of the investigations as bottle-grade PET resin.
Confidential Staff Report, INV-BB-051, (“CR’) at 1-1 n.1, Public Report (“PR’) at 1-1 n.1. Notices of Initiation, 79 Fed. Reg. 21082,21083,21086 (April 20,2004). The subject merchandise is provided for in statistical reporting number 3907.60.0010 of the Harmonized Tariff Schedule of the United States (HTSUS). Commerce indicated that merchandise classified under HTSUS subheading 3907.60.0050 that otherwise meets the written description of the scope is also subject to these investigations. 79 Fed. Reg. at 21083,21086.
I’ CR at 1-4, PR at 1-3.. l 3 CR at 1-4, PR at 1-3.. l 4 CR at 1-3, PR at 1-3. l5 CR at 1-5, PR at 1-4. l 6 CR at 1-3, PR at 1-3.
CR at 1-4, PR at 1-3. l8 CR at 1-5,II-l, PR at I-4,II-1. *’ Petitioners’ Postconference Brief at 2. ’O Petition at 65.
5
IV. DOMESTIC INDUSTRY
The domestic industry is defined as the “producers as a [wlhole of a domestic like product, or those producers whose collective output of a domestic like product constitutes a major proportion of the total domestic production of the product.”21 In defining the domestic industry, the Commission’s general practice has been to include in the industry all domestic production of the domestic like product, whether toll-produced, captively consumed, or sold in the domestic merchant market.22 Based on our domestic like product determination, we determine that there is a single domestic industry consisting of all U.S. producers of PET resin.23
V. CUMULATION24
A. InGeneral
For purposes of evaluating the volume and price effects for a determination of reasonable indication of material injury by reason of subject imports, section 771(7)(G)(i) of the Act requires the Commission to assess cumulatively the volume and effect of imports of the subject merchandise from all countries as to which petitions were filed andor investigations self-initiated by Commerce on the same day, if such imports compete with each other and with domestic like products in the U.S. market.25 In assessing whether subject imports compete with each other and with the domestic like Commission has generally considered four factors, including:
the
(1) the degree of fungibility between the subject imports from different countries and between imports and the domestic like product, including consideration of specific customer requirements and other quality related questions;
(2) the presence of sales or offers to sell in the same geographic markets of subject imports from different countries and the domestic like product;
21 19 U.S.C. 9 1677(4)(A). 22 &United States Steel Group v. United States, 873 F. Supp. 673, 681-84 (Ct. Int’l Trade 1994), affd, 96 F.3d
1352 (Fed. Cir. 1996). 23 One domestic producer, StarPet, is owned in part by a subject exporter. The subject exporter, ***, and owns
*** percent of StarPet. C W R at Table 111-1. The remaining interest in StarPet belongs to ***, but *** is not an exporter of subject merchandise. C W R at Table 111-1. Thus, there is an issue of whether StarPet is a related party pursuant to section 771(4)(B) of the Act by virtue of being “controlled” by ***. There is, however, no evidence that *** controls StarPet, and no party argued that StarPet is a related party. Indeed, *** percent ownership would appear to give *** control over StarPet rather than ***. Accordingly we do not find StarPet to be a related party for purposes of these preliminary investigations.
24 In these investigations, subject imports from India, Indonesia, Taiwan, and Thailand each accounted for more than three percent of the volume of all imports into the United States in the most recent 12-month period for which data are available preceding the filing of the petition. CR/PR at Table IV-3. We therefore find that imports from each of the subject countries are not negligible as defined in 19 U.S.C. 9 1677(24).
25 19 U.S.C. 0 1677(7)(G)(i). 26 The Uruguay Round Agreements Act (“URAA”) Statement of Administrative Action (“SAA”) expressly states
that “the new section will not affect current Commission practice under which the statutory requirement is satisfied if there is a reasonable overlap of competition.” SAA, H.R. Rep. 103-3 16, vol. I at 848 (1994), & Fundicao Tupy, S.A. v. United States, 678 F. Supp. 898, 902 (Ct. Int’l Trade 1988), a, 859 F.2d 915 (Fed. Cir. 1988).
6

(3) the existence of common or similar channels of distribution for subject imports from different countries and the domestic like product; and
(4) whether the subject imports are simultaneously present in the market.27
While no single factor is necessarily determinative, and the list of factors is not exclusive, these factors are intended to provide the Commission with a framework for determining whether the subject imports compete with each other and with the domestic like product?’ Only a “reasonable overlap” of competition is required.29
B. Analvsis
Petitioner contends that the Commission should cumulate imports from all four subject countries
The threshold requirement for cumulation is satisfied because the petitioner filed petitions with while the respondents3’ do not address the issue.
respect to each of the subject countries on the same day, and none of the statutory exceptions to cumulation applies.31 Therefore, we examine the four factors that the Commission customarily considers in determining whether there is a reasonable overlap of competition.
Fungibility. A majority of domestic producers and a majority of importers reported that the U.S. PET resin and each individual country’s subject imports are always or frequently Subject imports have largely been used only for cold-fill applications and not for hot-fill application^.^^ Cold-fill applications constitute approximately 80 percent of the U.S. market.34 Although a particular formulation of PET resin may be optimal for either cold-fill or hot-fill applications, there appears to be some interchangeability between PET resins that are designed for either type of appl i~at ion.~~
*’ See Certain Cast-Iron Pipe Fittings from Brazil, the Republic of Korea. and Taiwan, Inv. Nos. 731-TA-278-280 (Final), USITC Pub. 1845 (May 1986), affd, Fundicao Tupv. S.A. v. United States, 678 F. Supp. 898 (Ct. Int’l Trade), affd, 859 F.2d 915 (Fed. Cir. 1988).
*’ - See, e.~., Wieland Werke, AG v. United States, 718 F. Supp. 50 (Ct. Int’l Trade 1989). 29 See Goss Graphic Svstem Inc. v. United States, 33 F. Supp. 2d 1082, 1087 (Ct. Int’l Trade 1998), affd, 216
F.3d 1357 (Fed. Cir. 2000) (“cumulation does not require two products to be highly fungible”); Mukand Ltd. v. United States, 937 F. Supp. 910, 916 (Ct. Int’l Trade 1996); Wieland Werke, 718 F. Supp. at 52 (“Completely overlapping markets are not required.”).
30 The respondents in this investigation are Reliance Industries, Ltd, an Indian producer and exporter of the subject merchandise; South Asia Petrochem Ltd., an Indian producer and exporter of subject merchandise; Indo-Pet (Thailand) Ltd., a Thai producer and exporter of the subject merchandise; and P.T. Indorama, an Indonesian producer and exporter of the subject merchandise.
3’ 19 U.S.C. 0 1677(7)(G)(i)(I) and 9 1677(7)(G)(ii). 32 See CR 11-5; CR/PR at Table 11-1; CR at 1-6. See also Tr. at 14 (“Generally speaking, PET resin from any
source, be it imported or produced in the U.S., is chemically the same and can be used in any of the various applications that use PET bottle resin.).
33 Public Conference Transcript (Tr.) at 15-16. A cold-fill application is one in which the container is filled with a cold liquid; a hot-fill application is one in which the container is filled with a hot product, such as jam or juice. CR at 1-5, PR at 1-4. While it appears that subject imports have only entered the hot-fill segment of the market to at most a very limited degree, importers offer hot-fill PET resin for sale on their websites. Tr. at 16, 56.
34 Estimates of the size of the hot-fill market vary fiom 10 to 20 percent of the total U.S. market. Tr. at 53, 112. 35 - See Tr. at 137-38. Customers may prefer certain viscosities for certain applications, but PET resin is generally
interchangeable. Tr. at 14.
7

Geographic Overlap. Five of the seven U.S. producers reported geographic markets encompassing the entire United States.36 Importers tended to concentrate on just a particular portion of the United States, such as the Northeast or
percent of Thai subject import^.^' On the other hand, all the subject imports from India entered on the East Coast.39 The data indicate, however, that over 80 percent of subject imports were shipped between 100 and 1000 miles within the United States, suggesting that subject imports were marketed over relatively large areas!'
merchandise and all subject imports from each of the four subject countries were sold directly to end users.41
which information was gathered.42 Subject imports from India, Indonesia, and Thailand also were present in large quantities in the U.S. market during the three years of the period of investigation while import data indicate that subject imports from Taiwan were present in substantial quantities in 2003."3 The pricing data also indicate that subject imports from Taiwan meeting the definition of product 4 were competing with subject imports from the other countries and domestic PET resin during all four quarters of 2003 !4
Conclusion. For purposes of these preliminary determinations the record, on balance, indicates a reasonable overlap of competition between imports from each subject country and the domestic like product, and between imports from the various subject countries. Accordingly, we cumulate imports from the four subject countries for our analysis of reasonable indication of material injury by reason of subject imports.
Virtually all subject imports from Indonesia and Taiwan entered on the West Coast, as well as 60
Channels of Distribution. Over ninety percent of shipments of domestically-produced
Simultaneous Presence. Domestically produced PET resin was present throughout the period for
VI. REASONABLE INDICATION OF MATERIAL INJURY BY REASON OF SUBJECT IMPORTS
A. General Lepal Standards
In the preliminary phase of antidumping or countervailing duty investigations, the Commission determines whether there is a reasonable indication that an industry in the United States is materially injured by reason of the imports under in~estigation.~~ In making this determination, the Commission must consider the volume of subject imports, their effect on prices for the domestic like product, and their impact on domestic producers of the domestic like product, but only in the context of U.S.
36 CR at 11-1, PR at 11-1. 37 CR at 11-1, PR at 11-1. 38 CR at IV-1, PR at IV-1. 39 CR at IV-1, PR at IV-1. 40 CR at 11-2, PR at 11-1. 41 CR at 11-1, PR at 11-1. 42 - See C W R at Tables V-1 to V-3. 43 See C W R at Table IV-4. 44 C%R at Table IV-2; CRPR at Table V-3. 45 19 U.S.C. 99 1671b(a) and 1673b(a).
8

production The statute defines “material injury” as “harm which is not inconsequential, immaterial, or unim~ortant.”~~ In assessing whether there is a reasonable indication that the domestic industry is materially injured by reason of subject imports, we consider all relevant economic factors that bear on the state of the industry in the United States.“’ No single factor is dispositive, and all relevant factors are considered “within the context of the business cycle and conditions of competition that are distinctive to the affected industry.”49
industry producing PET resin is materially injured by reason of subject imports from India, Indonesia, Taiwan, and Thailand.
For the reasons stated below, we determine that there is a reasonable indication that the domestic
B. Conditions of Competition
Several conditions of competition are pertinent to our analysis in the preliminary phase of these
Demand for PET resin’s principal end uses, especially soft drink and water bottles, drives investigations.
demand for PET resin.” There are two general types of end uses, cold-fill and h~t-fill,~’ and subject imports are generally used only for cold-fill application^,'^ which account for approximately 80 percent of the US. market.53 PET resin demand exhibits seasonal patterns with prices peaking in the second and third quarters of the year as PET resin consumers stock up in anticipation of increased beverage sales in the summer months.54 There are relatively few buyers and sellers of PET resin in the U.S. market.55 Other products, such as aluminum and glass, are substitutes for PET resin, but the record in these preliminary investigations contains only limited information on the degree of substitution and effect on prices for PET resin.56
pounds in 2002 and 4.9 billion pounds in 2003.57 The parties generally agree that demand for this U.S. apparent consumption of PET resin increased from 4.0 billion pounds in 2001 to 4.4 billion
46 19 U.S.C. Q 1677(7)(B)(i). The Commission “may consider such other economic factors as are relevant to the determination” but shall “identify each [such] factor . . . [alnd explain in full its relevance to the determination.” 19 U.S.C. 9 1677(7)(B). See also Anms Chemical Co. v. United States, 140 F.3d 1478 (Fed. Cir. 1998).
47 19 U.S.C. Q 1677(7)(A). 48 19 U.S.C. Q 1677(7)(C)(iii). 49 19 U.S.C. Q 1677(7)(C)(iii). 50 CR at 11-3, PR at 11-2.
CR at 1-5, PR at 1-4. 52 Tr. at 15-16. While it appears that subject imports have only entered the hot-fill segment of the market to at
53 Estimates of the size of the hot-fill market vary from 10 to 20 percent of U.S. market. Tr. at 53, 112. 54 CR at 11- 1, PR at 11-1. ” Tr. at 41.
most a very limited degree, importers offer hot-fill PET resin for sale on their websites. Tr. at 16, 56.
CR at 11-4, PR at 11-2 to 11-3. In any final phase investigations, we will seek information, including data from purchasers, on substitute products and their effects on the PET resin market.
2002, and $2.3 billion in 2003. 57 CFUPR at Table IV-5. In dollar terms, U.S. apparent consumption was $2.0 billion in 2001, $1.9 billion in
9
product is forecast to grow at approximately 5 to 7 percent per year58 as new uses for PET resin continue to be in t r~duced .~~
subject imports enter on the East or West Coast6’ During the period of investigation, most of the domestic producers added to their capacity to produce PET resin; only *** did not increase capacity.61 Additions to production capacity are generally made in substantial increments, such as when a new plant or production line is opened, while demand for PET resin tends to increase more gradually.62 DAK constructed a new PET resin facility, and other producers added to capacity in a variety of ways, such as entering into a joint purchasing agreement or converting an existing production line to production of PET resin.63 On the other hand, domestic producers Voridian and M&G shut down portions of their operations in Tennessee and West Virginia.64 The domestic industry as a whole increased its capacity from 5 .O billion pounds in 2001 , to 5.6 billion pounds in 2003 .65 Costs for the raw materials (PTA and MEG) account for 75 to 80 percent of the cost of production of PET resin.66
Subject imports and their market share increased over the period examined, rising from 5.0 percent of apparent consumption in 200 1 and to 10.2 percent in 2003. Nonsubject imports did not increase to the same extent as subject imports; nonsubject imports declined in 2002 relative to 2001, but then returned to their 2001 level in 2003;67 their market share was 10.9 percent in 2001,8.5 percent in 2003, and 8.9 percent in 2003.68
The seven domestic producers of PET resin are all located in the Southeast while most of the
C. Volume of Subiect ImDorts
Section 771(7)(C)(i) of the Act provides that the “Commission shall consider whether the volume of imports of the merchandise, or any increase in that volume, either in absolute terms or relative to production or consumption in the United States, is ~ignificant.”~~
The quantity of cumulated subject imports increased throughout the period examined. The volume of cumulated subject imports increased from 197.9 million pounds in 2001 to 3 12.5 million pounds in 2002 and 497.6 million pounds in 2003.70 Cumulated subject imports’ share of apparent U.S.
58 Petitioners’ Postconference Brief at 2; Respondents’ Postconference Brief at 13. 59 The new uses for PET resin include sports drinks and beer which remain largely in glass. Tr. at 149. The
bottled water market is expected to continue to grow. Id.
the East and West coasts in any final phase of these investigations. CR/PR at Table 111-1. We will M e r examine the extent to whch shipments of imports are concentrated on
CR at 111-1, PR at 111-1. 62 Respondents’ Postconference Brief at 5. 63 CR at 111-1, PR at 111-1. 64 Tr. at 22; CR at 111-3 n.5, PR at 111-1 n.5. 65 CR /PR at Table 111-2.
CR at 1-4, PR at 1-3. 67 Nonsubject imports were 43 1 million pounds in 2001,373 million pounds in 2002, and 435 million pounds in
2003. CFUI’R at Table IV-2. We also note that a portion of nonsubject imports, most of which come from Mexico and Canada, are produced by companies related to the domestic producers. See CR/PR at Table 111-1; Tr. at 93, 107; CR at IV-1, PR at IV-1.
68 C W R at Table IV-5. 69 19 U.S.C. 9 1677(7)(C)(i). 70 CR/PR at Table IV-4. The value of subject imports increased from $90.8 million in 2001 to $121.7 million in
2002 and $214.2 million in 2003. Id-
10

consumption rose from 5.0 percent in 2001 to 7.1 percent in 2002 to 10.2 percent in 2003.71 The domestic industry’s market share increased from 84.1 percent in 2001 to 84.5 percent in 2002 (reflecting a decline in nonsubject imports), and then declined to 80.9 percent in 2003, indicating that subject imports captured market share from the domestic U.S. production increased from 4.8 percent in 2001 to 7.1 percent in 2002, and then to 10.6 percent in 2003.73 For purposes of these preliminary investigations, we find the volume and the increase in the volume of subject imports, both absolute and relative to U.S. consumption and production, to be significant.
The ratio of cumulated subject imports to
D. Price Effects of the Subiect Imports
Section 771(7)(C)(ii) of the Act provides that, in evaluating the price effects of the subject imports, the Commission shall consider whether -
(I) there has been significant price underselling by the imported merchandise as compared with the price of domestic like products of the United States, and
(II) the effect of imports of such merchandise otherwise depresses prices to a significant degree or prevents price increases, which otherwise would have occurred, to a significant degree.74
The evidence indicates that the domestic like product and subject imports are substantially interchangeable and used in the same application^.^^ Although the subject imports have not generally been used in hot-fill application^,^^ those applications only account for about 20 percent of the market.77 When asked if differences other than price between PET resin produced in the United States and other countries are a significant factor in their firms’ sales of PET resin, domestic producers and importers reported mostly that non-price factors were either never or sometimes a significant factor in purchasing decision^.^' We conclude that there is a moderate to high degree of substitutability between the subject imports and the domestic like product. The record further indicates that price is an important, if not the most important, factor in purchasing decisions.79
7’ CRPR at Table IV-5. In terms of value, the market share of the subject imports was 4.5 percent in 2001, 6.3
72 C W R at Table IV-5. As discussed earlier, nonsubject imports’ market share was 10.9 percent of the market in
73 CRPR at Table IV-6. 74 19 U.S.C. 0 1677(7)(C)(ii). 75 The majority of domestic producers and importers reported that the subject imports were always or frequently
76 Tr. at 15-16. 77 Tr. at 52-53. 78 CR /PR at Table 11-2. 79 Tr. at 18-19. Petitioners state that sales are made or lost based upon price differentials of only a penny a pound
percent in 2002, and 9.4 percent in 2003.
2001, 8.5 percent in 2002, and 8.9 percent in 2003. zrl,
interchangeable with the domestic PET resin. See O R at Table 11-1.
and “customers are quite likely to switch suppliers for a small decrease in price.” Tr. at 18.
11
The Commission collected quarterly pricing data from the domestic industry and importers on four PET resin products.80 The subject imports undersold the domestic like product in *** quarterly, comparisons, with margins ranging from ***.81 We find the margins and prevalence of underselling to be significant for purposes of the preliminary phase of these investigations.
Data for all the pricing products show that domestic prices for PET resin generally fell during 2001, and then recovered somewhat during 2003.82 However, domestic prices ended the period lower than at the beginning of the period.83 These price declines occurred despite the growth in U.S. apparent consumption that occurred during the period of inve~tigation.8~ For purposes of the preliminary phase of these investigations, we find that the subject imports depressed domestic prices to a significant degree.
The unit value of net sales declined in 2002 relative to 2001, and the costs of goods sold fell to a similar, though slightly smaller extent.85 However, in 2003, the cost of goods sold increased relative to 2002, due to higher prices for raw materials, yet the unit value of net sales for the domestic industry did not increase to the same degree.86 As a result, the ratio of cost of goods sold to sales increased over the period, from 84.7 in 200 1 to 90.4 in 2003 .87 Thus, the financial data indicate that the domestic producers were unable to increase prices sufficiently to cover the increased cost of goods sold in 2003 .88 We find that the increased volume of lower-priced subject imports suppressed domestic prices to a significant degree.
CR at V-6, PR at V-5. The four products were PET resin sold for use in water bottles, soft drink bottles, hot- fill applications, and general purposes. a Price data from the domestic producers accounted for over 80 percent of domestic shipments during 2003. Data from importers reflected *** percent of subject imports from India, *** percent of subject imports from Indonesia, *** subject imports from Taiwan, and *** percent of subject imports from Thailand during 2003. CR at V-7, PR at V-5.
CR/PR at Table D - 1 (revised by INV-BB-054). For product 1 , underselling occurred in *** comparisons. For product 2, underselling occurred in *** comparisons. For product 4 underselling occurred in *** comparisons . a No comparisons were available for product 3, reflecting the fact that subject imports are generally not used in hot-fill applications.
82 Prices tend to be higher during the second and third quarter of each year as demand peaks. CR at V-7, PR at V- 5. The trend was the same for all three pricing products for which the Commission obtained comparisons. See CR/PR at Figs. V-3 to V-5.
periodamined. That is, prices for first quarter 2003, for example, were lower than for first quarter 2001. This trend holds for every calendar quarter for every pricing product in which subject import data were reported. See CR/PR at Tables V-1 to V-3.
contend that additions to capacity and slower than anticipated growth in consumption were responsible for any adverse effects on domestic prices. Respondents' Postconference Brief at 24. We note, however, that apparent U.S. consumption increased by over 10 percent in both 2002 and 2003 versus the previous year. See_ CRPR Table at C-1. Domestic capacity was relatively unchanged in 2002 versus 2001, yet the unit value of the domestic industry's net sales and domestic prices trended downwards in 2002. CRPR at Table VI-2 and Figs. V-3 to V-5.
costs of goods sold fell the same amount, from $0.41 in 2001, to $0.36 in 2002. Td.
yet the unit value of net sales only increased from $0.43 in 2002, to $0.46 in 2003.
83 See CRPR at Figs. V-3 to V-5. The decline is also seen when comparing individual calendar quarters over the
84 U.S. apparent consumption was 23.3 percent greater in 2003 than in 2001. CR/PR at Table C-1. Respondents
85 CRPR at Table VI-2. The unit value of net sales fell from $0.48 in 2001 to $0.43 in 2002, and the unit value of
86 CRPR at Table VI-2. In 2003, the unit value of the cost of good sold increased to $0.42 from $0.36 in 2002,
" CRPR at Table C- 1 . 88 We note that none of the petitioner's eight lost sales allegations or three lost revenue allegations was confiied.
CR/PR at Table V-5; CR/PR at Table V-6.
12
For purposes of the preliminary phase of these investigations, we therefore find that the domestic industry’s prices were depressed and suppressed to a significant degree by the subject imports.89
E. Impact of the Subiect I rnpor t~~’
Section 771(7)(C)(iii) of the Act provides that the Commission, in examining the impact of the subject imports on the domestic industry, “shall evaluate all relevant economic factors which have a bearing on the state of the industry.”” These factors include output, sales, inventories, capacity utilization, market share, employment, wages, productivity, profits, cash flow, return on investment, ability to raise capital, research and development, and factors affecting domestic prices. No single factor is dispositive and all relevant factors are considered “within the context of the business cycle and conditions of competition that are distinctive to the affected ind~stry.”~’
The condition of the domestic industry is mixed. Many economic indicators improved over the period examined. The domestic industry’s produ~tion,9~ shipments 94 and sales 95 all increased over the period. While the domestic industry increased its production improved.97 Other indicators also improved. The domestic industry’s production workers increased from 1,93 1 in 2001 to 1,974 in 2002 and then to 1,998 in 2003.98 The industry’s capital expenditures increased from $*** in 2001 to $*** in 2002, before declining to $*** in 2003.99 The industry’s productivity improved over the period.”’
Nonetheless, in an environment of increasing demand, the domestic producers’ market share declined from 84.1 percent in 2001 to 80.9 percent in 2003 while the subject imports increased
its capacity utilization also
89 In any final phase investigations, we intend to examine other market factors that might explain the price
90 In its notice of initiation, Commerce estimated the dumping margin for subject imports of PET resin from India depression and suppression.
at 35.51 percent, from Indonesia at 27.61 percent, from Taiwan at 37.35 percent, and from Thailand at 41.28 percent. Notice of Initiation, 69 Fed. Reg. 21082 (April 20,2004).
91 19 U.S.C. 9 1677(7)(C)(iii); see also SAA at 851. “In material injury determinations, the Commission considers, in addition to imports, other factors that may be contributing to overall injury. While these factors, in some cases, may account for the injury to the domestic industry, they also may demonstrate that an industry is facing difficulties from a variety of sources and is vulnerable to dumped or subsidized imports.” SAA at 885.
92 19 U.S.C. 0 1677(7)(C)(iii); see also SAA at 851,885; Live Cattle from Canada and Mexico, Invs. Nos. 701- TA-386 and 731-TA-812-813 (Preliminary), USITC Pub. 3155 at 25 n.148 (Feb. 1999).
93 The domestic industry’s production was 4.1 billion pounds in 2001,4.4 billion pounds in 2002, and 4.7 billion pounds in 2003. CRPR at Table 111-2. The industry’s inventories remained relatively constant relative to production and shipments.
94 The domestic industry’s US. shipments were 3.3 billion pounds in 2001, 3.7 billion pounds in 2002, and 3.9 billion pounds in 2003. CRPR at Table 111-2.
95 The domestic industry’s sales were 4.2 billion pounds in 2001,4.5 billion pounds in 2002, and 4.9 billion pounds in 2003. CRPR at Table VI-1. The value of these sales was $2.0 billion in 2001, $1.9 billion in 2002, and $2.2 billion in 2003.
96 The industry increased its production capacity from 5.0 billion pounds in 2001 to 5.6 billion pounds in 2003. CRPR at Table 111-2.
97 The industry’s capacity utilization increased from 81.6 percent in 2001 to 88.1 percent in 2002, before declining to 83.9 percent in 2003. CRPR at Table 111-2.
98 CRPR at Table 111-4. 99 CRPR at Table VI-4 loo Productivity increased from 1,034 pounds per hour in 2001 to 1,083 pounds per hour in 2002 and then 1,145
CRPR at Table 111-3.
pounds per hour in 2003. CRPR at Table 111-4.
13

significantly and gained market share."' Further, despite strong and growing demand for PET resin, the domestic industry's financial indicators weakened over the period examined. In particular, the domestic industry's prices and unit sales values were lower in 2002 than 2001 .lo2 When raw material costs subsequently rose in 2003, the industry was unable to increase its prices sufficiently to cover the increases in the cost of its raw rnaterial~.'~~ Indeed, the ratio of cost of goods sold to net sales rose throughout the period of investigation.lW As a result, the industry's operating income fell steadily - from $164.0 million in 200 1 to $140.8 million in 2002 to $72.7 million in 2003. lo5 The ratio of operating income to net sales fell from 8.1 percent in 2001 to 7.4 percent in 2002 and to 3.2 percent in 2003.'06 The industry's return on investment followed a similar trend.lo7
priced subject imports had significant price depressing and suppressing effects. The volume of subject imports and the inability of domestic producers to increase prices sufficiently to cover increased costs contributed significantly to reductions in the domestic industry's net sales values, operating income, and return on investment. Consequently, for purposes of these preliminary investigations, we find a reasonable indication that the subject imports have had a significant adverse impact on the domestic industry."'
The record for these preliminary determinations indicates that significant volumes of lower-
CONCLUSION
For the foregoing reasons, we determine that there is a reasonable indication that a domestic industry is materially injured by reason of subject imports of PET resin from India and Thailand that are allegedly subsidized and by reason of subject imports of PET resin from India, Indonesia, Taiwan, and Thailand that are alleged to be sold in the United States at less than fair value.
IO1 C R R R at Table IV-5 lo* C R P R at Table VI-2 and Figs. V-3 to V-5. IO3 The unit value of cost o f goods sold increased from $0.36 in 2002, to $0.42 in 2003, yet the unit value o f net
sales only rose from $0.43 in 2002, to $0.46 in 2003. IO4 C R P R at Table VI-1. The ratio rose from 84.7 percent in 2001 to 85.7 percent in 2002 and then to 90.4
percent in 2003. IO5 C R P R at Table VI- 1.
C R P R at Table VI- 1. IO7 C R P R at Table VI-5. Return on investment declined from 10.4 percent in 2001 to 8.8 percent in 2002 and
then to 4.1 percent in 2003. In any final phase investigations, we intend to examine other factors that might explain the decline in the
industry's financial performance.
14

PART I: INTRODUCTION
BACKGROUND
These investigations result from petitions filed by the U.S. PET Resin Producers’ Coalition, Washington, DC, on March 24,2004, alleging that an industry in the United States is materially injured and threatened with material injury by reason of subsidized imports from India and Thailand and less- than-fair-value (LTFV) imports of polyethylene terephthalate (PET) resin’ from India, Indonesia, Taiwan, and Thailand. Information relating to the background of the investigations is provided below.2
Date Action
March 24,2004 . . . .
April 14,2004 . . . . . April 20,2004 . . . . . May 7,2004 . . . . . . . May 10,2004 . . . . . .
Petitions filed with Commerce and the Commission; institution of Commission
Commission’s conference3 Commerce’s notice of initiation (69 FR 21082) Commission’s vote Commission determinations transmitted to Commerce
investigation (69 FR 16955, March 31,2004)
SUMMARY DATA
A summary of data collected in these investigations is presented in appendix C, table C-1. Except as noted, U.S. industry data are based on questionnaire responses of the seven firms that accounted for all U.S. production of PET resin during 2003. U.S. imports are based on official Commerce statistics for Taiwan and all other sources and data from foreign producer/exporter questionnaires for India, Indonesia, and Thailand.
NATURE AND EXTENT OF ALLEGED SUBSIDIES AND SALES AT LTFV
In its notice of initiation, Commerce advised that it is investigating the following programs alleged in the petition to have provided countervailable subsidies to manufacturers, producers, and exporters in India:
’ For purposes of these investigations, PET resin is defined as bottle-grade polyethylene terephthalate (PET) resin, defined as having an intrinsic viscosity of at least 0.68 deciliters per gram but not more than 0.86 deciliters per gram. The scope includes bottle-grade PET resin that contains various additives introduced in the manufacturing process. The scope does not include post-consumer recycle (PCR) or post-industrial recycle (PIR) PET resin, however, included in the scope is any bottle-grade PET resin blend of virgin PET bottle-grade resin and recycled PET (WET). Waste and scrap PET is outside the scope of the investigations. Fiber-grade PET resin, wluch has an intrinsic viscosity of less than 0.68 deciliters per gram, is also outside the scope of the investigations.
The merchandise subject to these investigations is properly classified under subheading 3907.60.00 (statistical reporting number 3907.60.0010) of the Harmonized Tariff Schedule of the United States (HTSUS); however, merchandise covered by HTSUS statistical reporting number 3907.60.0050 that otherwise meets the written description of the scope is also subject to these investigations. For this subheading, a normal trade relations tariff rate of 6.5 percent ad valorem applies to imports from Taiwan. Products of India, Indonesia, and Thailand are eligible to enter free of duty under the Generalized System of Preferences (GSP). Petitioners have filed a petition in the 2003 GSP Annual Review requesting withdrawal of duty-free treatment for imports of PET resin.
Federal Register notices cited in the tabulation are presented in app. A. A list of witnesses appearing at the conference is presented in app. B.
I- 1
1. The Duty Entitlement Passbook Scheme (DEPS)/ Post-Export Credits 2. Pre-Shipment and Post-Shipment Export Financing 3. Export Promotion Capital Goods Scheme (EPCGS) 4. Income Tax Exemption Scheme (Sections 10A, 10B, and 80 HHC) 5. Exemption of Export Credit from Interest Taxes 6. Export Processing ZonesExport-Oriented Units Program 7. Market Development Assistance (MDA) 8. Status Certificate Program 9. Loan Guarantees from the GO1 10. State of Maharashtra Program: Industrial Policy 2001 11. State of Gujurat Program 12. State of West Bengal Program: New Economic Policy on Industrial Development
Sales-Tax Incentive Scheme.
With respect to Thailand, Commerce advised that it is investigating the following programs alleged in the petition to have provided countervailable subsidies to manufacturers, producers, and exporters :
1. Section 28 of the Investment Promotion Act: Exemption from Payment of Import Duties
2. Section 30 of the Investment Promotion Act: Reduction of Import Duties on Raw or
3. Section 3 1 of the Investment Promotion Act: Income Tax Exemptions 4. Section 35 of the Investment Promotion Act: Special Rights and Benefits Granted to
on Machinery
Essential Materials
Promoted Activities Located in Investment Promotion Zones.
The estimated dumping margins as reported by Commerce are 35.5 1 percent ad valorem for India, 27.61 percent ad valorem for Indonesia, 37.35 percent ad valorem for Taiwan, and 41.28 percent ad valorem for Thailand.
SUMMARY OF MARKET PARTICIPANTS
The domestic industry producing PET resin consists of seven companies. Four of the companies, Voridian," Wellman, Inc. (Wellman), DAK Americas, LLC (DAK),5 and Nan Ya Plastics Corporation of America (Nan Ya); are members of the U.S. Pet Resin Producers' Coalition. The other three producers are M&G Polymers USA, LLC (M&G), StarPet, Inc. (Starpet),' and Arteva Specialties S.a.r.1 (KoSa).8
countries during the period examined with a number of them importing from more than one subject source. Among them are ***.
Approximately 30 companies accounted for the bulk of imports of PET resin from the subject
Voridian is a division of Eastman Chemical Corporation. DAK is owned by Alfa S.A. de C.V. (Mexico). Nan Ya is owned by Nan Ya Plastics Corporation (Taiwan). ' StarPet is owned by ***. KoSa is a division of Koch Industries.
1-2
THE SUBJECT PRODUCT
The imported PET resin covered by the scope of these investigations is described in detail in the "Background" section earlier in Part I.
Physical Characteristics and Uses and Manufacturing Process
Subject PET resin is a large volume, commodity-grade thermoplastic polyester polymer. PET resin is typically produced in several different grades through the chemical reaction between purified terephthalic acid (PTA)9 and mono ethylene glycol (MEG). The product is sold primarily in bulk form as opaque chips or pellets, most specifically for the manufacture of bottles and other sterile containers that house liquid and solid products for human consumption or contact. Articles of PET are clear, transparent, sterile, lightweight, thermally stable, impact resistant products with excellent gas barrier and strength properties.
intrinsic viscosity (IV) of at least 0.68 but not more than 0.86 deciliters per gram.'' Also included are all bottle-grade resins containing various additives, such as recycled PET, which do not alter the fundamental properties of subject product. In contrast, nonsubject fiber-grade PET resin has an IV below 0.68, while products such as tire cord and microwaveable food trays have IVs above 0.86.12 l 3
PET resin is produced by the melt polymerization chemical reaction of PTA with MEG, followed by a solid stating process that increases the molecular weight, crystallinity, and melt viscosity to the desired levels for the intended end use. PTA and MEG feedstocks are based on paraxylene and ethylene, respectively, products of the petroleum industry; thus, PTA and MEG feedstock prices for PET resin manufacture are variably dependent upon petrochemical feedstock costs. Some U.S. PET resin producers are partially vertically integrated between feedstocks and resin production, while others are not.14 Raw material costs account for approximately 75 to 80 percent of total manufacturing costs.15
produce bottles and other containers approved by the Food and Drug Administration (FDA). PET resin producers sell the product to downstream converters who fabricate the resin into products for end-use applications. Major end-use applications are for bottles and other containers for soft drinks, water, juices, peanut butter, jams and jellies, salad dresssings, cooking oils, household cleaners, and cosmetics.I6 PET bottle-grade resins are subdivided into two major end-use classifications, cold-fill and
PET resins" subject to these investigations are defined as uncompounded resins having an
PET is a large-volume commodity plastic resin commonly used along with sheet and strapping to
Dimethyl terephthalate (DMT) may be used instead of PTA, but has been largely displaced by PTA. See, testimony of Hans Kinner, Voridian, conference transcript, pp. 81-82.
lo The terms resin and resins are used interchangeably in this report. ' I Statistical note 1 to Chapter 39; Harmonized Tariff Schedule of the United States (2004). Viscosity, in
general, refers to the resistance of a given material in liquid or molten form to shear or force under defmed conditions. A deciliter is a unit of volume defined as one tenth of a liter.
I 2 See, testimony of Mike Dewsbury, Wellman, and Robert Taylor, Wellman, conference transcript, pp. 78-79. l3 Staff interview with Hans Kinner, Voridian, April 20,2004. l4 Voridian and DAK are basic in PTA production, while Nan Ya is basic in MEG production. See, testimony of
Mike Dewsbury, Wellman, Ricky Lane, DAK, and Hans Kinner, Voridian, conference transcript, pp. 46-48 and staff interviews with Hans Kinner, Voridian, and Mike Dewsbury, Wellman, April 21-22, 2004.
Is Petition, p. 18. Id., pp. 9-10.
1-3
hot-fill. Cold-fill resins, for soda and water bottles, for example, dominate resin use.I7 Examples of hot- fill applications are for juices, jams, and jellies.'* Also, new uses continue to be found for PET resin.lg
Demand for PET bottle-grade resin grew at 13.3 percent from 2001 to 2002 and 6.7 percent from 2002 to 2003. PET demand has been bolstered by the replacement of glass and other competing materials due to its unique properties and commodity prices. Demand is even higher outside the United States where growth and substitution potential are greater.20
Bottles and other specialty food containers are produced predominately by the injection stretch blow-molding process. In this process, an intermediate preform product is produced by injection molding, followed by a stretch blow-molding process to form finished PET containers. Subject product can also be extruded into sheets of various thicknesses and thermoformed (molded) into clear cups, cupcake trays, strawberry clamshells, vegetable containers, etc. PET can also be directly extruded to produce high-strength strapping for industrial uses. PET containers are ideal for recycling into polyester fibers for garments, carpets, and fiberfill, high-strength commodity strapping, and other uses. PET is the type of plastic labeled with the #1 code on or near the bottom of bottles and containers.2'
Subject PET resin must be protected from moisture and contamination during transport. Both imported and exported products are typically shipped offshore in sealed metal containers of one metric ton poly bags (super sacks). Subject imported product may be removed from the containers and temporarily stored in order to have some local inventory and save on demurrage. Both imported and domestic product may be shipped bulk inland in specially lined railcars or stainless steel truck beds in lots of 200,000 pounds and 50,000 pounds, respectively. Subject imported product can be the most competitive with the U.S. producers in coastal regions, where the U.S. producers have the higher cost of inland freight, and where the importers have the lower cost of freight.22
Interchangeability and Customer and Producer Perceptions
Producers and importers responding to questionnaires, in general, agreed that the U.S.-produced and imported product were interchangeable and were viewed as such by customers23 as well. More detailed information on interchangeability and customer and producer perceptions can be found in Part 11 of this report, Conditions of Competition in the US. Market.
I' See, testimony of Mlke Dewsbury, Wellman, conference transcript, p. 58. The basic difference between hot-fill and cold-fill resin is that some temperature and additive adjustments are
made in the process of producing PET resin; or, the process techque used in converting it into a bottle versus the resin itself; also, additives may be a factor. See, testimony of Ricky Lane, DAK, and Juliana Cofrancesco, Howrey, Simon, Arnold & White, pp. 16-17; 81, respectively.
See, testimony of Dan Mullock, Constar International, Inc. (Constar), conference transcript, pp. 156-158. Future PET demand growth inside the United States is pegged at 7-10 percent annually and hgher in emerging
markets outside the United States. See, testimony of Susan G. Esserman, Steptoe & Johnson, conference transcript,
Petition, pp. 9-10; staff interviews with Robert Taylor, Wellman, and Hans Kinner, Voridian, April 19-20, p. 99.
2004.
153. Staff interviews with Robert Taylor, Wellman, and Hans Kinner, Voridian, April 19-20,2004.
the ***. Petitioners' postconference brief, p. 41.
22 See, testimony of Mike Dewsbury, Wellman, and Dan Mullock, Constar, conference transcript, pp. 78-79; 152-
23 The customer base for this product is rather limited. In response to staff questions, petitioners estimated that
1-4

Channels of Distribution
During the period examined, U.S. producers reported selling more than 90 percent of their product to end users while importers reported selling all of their product to end users. In a number of instances, the importers consumed all of their imports internally in the production of bottles and packaging products. Additional information on channels of distribution can be found in Part 11 of this report, Conditions of Competition in the US. Market.
Price
Information with regard to prices of PET resin is presented in Part V of this report, Pricing and Related Information.
1-5
PART 11: CONDITIONS OF COMPETITION IN THE U.S. MARKET
U.S. MARKET SEGMENTS/C"NELS OF DISTRIBUTION
PET resin is used in three main applications: bottles for soft drinks and other beverages, sheets used for making clam shells by which items such as strawberry and other fruits are packaged, and strapping which is used on bulk substances such as lumber.' The demand for PET resin used in bottles tends to be seasonal, reaching peak level during the summer months as the demand for soft drinks is at peak levels.*
producers, shipments to end users accounted for between 91 and 95 percent of commercial U.S. shipments annually during 2001-03. In the case of imports from India, Indonesia, Taiwan and Thailand, all U.S. shipments went to end users during 200 1-03.
When firms were asked to list market areas in the United States where they sell PET resin, the responses showed that U.S. producers' market areas tended to be broader than those of importers from the subject countries. Among the seven producers, five said that they sell nationally, while the other two reported that they sell in specific regions including the Northeast, the Mid-Atlantic region, the Southeast, the Midwest, and the West Coast. Among the importers of PET resin from the subject countries, just one firm reported that it sells nationally. The others listed specific regions including the Northeast, the Midwest, the Northwest, the Southeast, and the West Coast. For most importer questionnaires, it was not possible to break out sales from the four countries into separate regions. However, *** stated that all sales were on the West Coast. *** stated that its imports from India are sold primarily in the Midwest, and its imports from *** are sold primarily on the West Coast.
imports from the subject countrie~.~ For U.S. producers, *** percent of their U.S. sales occur within 100 miles of their storage or production facility, *** percent were within distances of 101 to 1,000 miles, and *** percent were at distances of over 1,000 miles from their facilities. For imports from the subject countries, *** percent of sales occurred within 100 miles of importers' storage facilities, and *** percent were within 101 to 1,000. No shipments were over 1,000 miles.
Lead times for delivery of PET resin ranged widely for both producers and importers. For producers they ranged for two to three days to as much as 50 days. For importers they ranged from one day to as much as four months. The questionnaires show that lead times for PET resin products held in inventories tend to be shorter than those for products that have to be specially ordered. However, this varies from company to company.
Practically all sales of PET resin go to end users rather than distributors. In the case of U.S.
U.S. inland shipping distances for U.S.-produced PET resins were compared with those for
SUPPLY AND DEMAND CONSIDERATIONS
U.S. Supply
The supply response of domestic PET resin producers to changes in price depends on such factors as the level of excess capacity, the availability of alternate markets for U.S.-produced PET resin, inventory levels, and the ability to shift to the manufacture of other products. The evidence indicates that the U.S. supply is probably fairly elastic. The capacity utilization rates ranged from a low of 8 1.6
See, testimony of Ricky Lane, DAK, conference transcript, p. 15. * See, conference transcript, pp. 60-61.
from India, Indonesia, Taiwan, and Thailand. Information was not available in a form where it was possible to break out shipping costs separately for imports
II- 1

percent in 2001 to a high of 88.1 percent in 2002. Total exports by U.S. producers are relatively large, accounting for 14.4 to 18.7 percent of total shipments annually during 2001-03. The ratio of end-of- period inventories to U.S. shipments was 7.0 percent during 200 1-03. None of the firms use the actual machinery and equipment used to make PET resin in the production of other products. However, firms often use the workers that produce PET resin in the production of other products at their facilities.
Subject Imports
The responsiveness of imports from India, Indonesia, Taiwan, and Thailand to changes in price in the U.S. market is likely to be affected by such factors as capacity utilization rates, and the availability of home markets and other export markets. During 2003, the capacity utilization rate for
India was *** percent, but it was projected to reach about *** percent in 2004 and *** percent in 2005. The share of India’s total shipments in 2003 that went to the U.S. market was about *** percent while about *** percent went to its other export markets and the remainder went to its home market.
percent in both 2004 and 2005. The U.S. market accounted for *** percent of Indonesia’s total shipments in 2003 with *** percent going to its other export markets and the remainder going to its home markets.
*** percent in 2004 and *** percent in 2005. There were *** reported exports to the United States during 2003 by the two companies reporting data. About *** percent of its shipments went to other country sources, and the remainder went to its home market in that year.
percent in 2004 and *** percent in 2005. The U.S. market accounted for about *** percent of its total shipments in 2003 with *** percent going to its other export markets and the balance going to its home market.
For Indonesia the capacity utilization rate for 2003 was *** percent and projected to be ***
During 2003, the capacity utilization rate for Taiwan was *** percent. It is projected to reach
For Thailand, the capacity utilization rate for 2003 was *** percent and is projected to reach ***
U.S. Demand
Demand Characteristics
The demand for PET resin is a derived demand that depends upon the demand for bottles and other containers that use PET resin as well as other products including strapping and sheet that are made of PET resin. The ready availability of substitutes for PET resin discussed below indicates that the demand for this product is fairly price elastic. The overall demand in the United States as measured by I apparent consumption in quantity terms increased steadily from about 3.9 billion pounds in 200 1 to about 4.8 billion pounds in 2003.
U.S. producers and most importers stated that the demand had increased. This increase in demand was most commonly attributed to a shift away from other packaging materials to PET resin. An increase in market growth, an improving economy, and new applications were also cited.
When asked how the overall demand for PET resin has changed since January 200 1, all seven
Substitute Products
When asked whether there are substitutes for PET resin, all U.S. producers and most responding importers cited one or more alternative materials. Aluminum and glass were the most frequently
II-2

menti~ned.~ The evidence indicates that aluminum is the most common substitute for PET resin in the carbonated soft drink market, while glass is a common substitute for other beverages and food. Polyethylene and polypropylene were also listed as substitutes.
When asked whether changes in the prices of these substitutes affect the price of PET resin, there was no consensus among questionnaire respondents. Some firms said that prices of substitutes would not influence the price of PET resin at all, while others reported that they could have an effect. Two U.S. producers did state that if the price of PET resin became too high some shifting to the substitute products might occur. Another firm said that a reduction of the price of polypropylene and high density polyethylene relative to PET could drive some converters and brand companies to substitute where possible. However, this would require a 6 to 12 month time lag as the tooling required to make a substitution has long lead times.
Cost Share
Questionnaire responses indicate that PET resin generally accounts for a large percentage of the total cost of end use products where it is used. For example, estimates by producers and importers show that it typically accounts for well over half of the cost of bottles made of this material. However, the cost of the bottle is normally a small share of the final cost of the beverages to consumers. Therefore, an increase in the price of PET resin would probably have little effect on consumer demand for beverages.
SUBSTITUTABILITY ISSUES
The extent of substitutability between domestic products and subject and nonsubject imports, between subject imports from different sources, and between subject and nonsubject imports is examined in this section. The discussion is based upon the results of questionnaire responses from producers and importers.
Comparison of Domestic Products and Subject Imports
In order to determine whether U.S.-produced PET resin can generally be used in the same applications as imports from India, Indonesia, Taiwan and Thailand, producers and importers were asked whether the product can “always,” “frequently,” “sometimes,”or “never” be used interchangeably. The majority of producers and importers that compared these four countries with the United States reported that they are always or frequently comparable as shown in table 11-1. Some producers and importers made some general comments concerning the extent of interchangeability between products from the United States and other country sources. One producer said that some PET resin products require additives that may not be available from all import sources. Another producer said that PET resin used in some applications such as heat-set resins or barrier resins cannot always be interchanged with resins from some countries. One importer said that some PET resins from India and Taiwan are not interchangeable with U.S. PET resins that have been approved for use by U.S. converters for specific brand holders. Another importer said that the U.S. and India have different measurement systems and different color standards for certain products. This firm also said that color differences, packaging concerns, and differences in fast reheat components and packaging concerns also limit the interchangeability between
Dan Mullock, Constar, said that producers of carbonated soft drinks can easily shift between PET resin and aluminum. He said that switching between PET resin and glass as a container for other products is more difficult. See, conference transcript, pp. 146-147.
11-3

Table 11-1
Note: “ A = Always, “F” = Frequently, “S” = Sometimes, and “N” = Never.
Source: Compiled from data submitted in response to Commission questionnaires.
different country sources. Another importer stated that the quality of the resin and customer requirements may also limit the extent of substitutability.
compare U.S.-produced products with imports from each subject country in terms of product differences such as quality, availability, product range, and others. Again, firms were asked whether these product differences are always, frequently, sometimes, or never significant (see table 11-2). The majority of U.S. producers and importers that compared the United States with the subject countries said that the differences are sometimes or never significant. Three producers cited certain advantages that the domestic industry has over imports in general. These include superior product quality and consistency, a wider product range, superior technical support, location advantages, and a superior transportation network. Among importers, one firm that imports from *** said that the U.S. customers are reluctant to order foreign products because of doubts concerning quality and delivery time. Another importer of PET resin from *** said that the product range of imports is more limited than for the U.S. industry, and the
In addition to questions concerning interchangeability, producers and importers were asked to
11-4

quality of imported products is not as consistent. It also said that transportation problems due to long shipping distances put imports at a disadvantage.
A F
Other Country Comparisons
S N
In addition to comparisons between the U.S. product and imports from the four subject countries, U.S. producer and importer comparisons between the United States and imports from the nonsubject countries, between subject imports and nonsubject imports, and between subject imports from the different subject countries are also shown in tables 11-1 and 11-2. None of the producers or importers provided any specific comments concerning these comparisons.
Table 11-2
U.S. vs. India
U.S. vs. Indonesia
U.S. vs. Taiwan
0 1 4
0 1 4
0 1 4
’ET resin: Differences other than price between products from dii
US. producers
U.S. vs. Thailand 0 1 4 0
0
3 2 4
2 2 3
India vs. Indonesia
India vs Taiwan
0 0 2
0 0 2
India vs Thailand
Indonesia vs. Taiwan
0
0
0
0
2 2 3
2 2 3
0 2 2 3
Country comparison I A I F I S N 3 3
3
3
3
3
U.S. vs. Nonsubject 1 0 1 1 1 4 3
3
3
0 1 2 3
3 - 0)2
0 3
3 - Indonesia vs Thailand
Taiwan vs Thailand
India vs. Nonsubject
0
0 0 1 2 3 i 2 i 2 r 3 Indonesia vs. Nonsubject 3 0
0 Taiwan vs. Nonsubject
Thailand vs. Nonsubject 1 0 1 0 1 2 1 3
’ Producers and importers were asked if differences other the price between PET resin produced in the United States and in other countries are a significant factor in their firms’ sales of PET resin.
Note: “A” = Always, “F” = Frequently, “S” = Sometimes, and “N” = Never.
Source: Compiled from data submitted in response to Commission questionnaires.
11-5

PART 111: U.S. PRODUCERS’ PRODUCTION, SHIPMENTS, AND EMPLOYMENT
The Commission analyzes a number of factors in making injury determinations (see 19 U.S.C. $5 1677(7)(B) and 1677(7)(C)). Information on the alleged subsidies and margins of dumping was presented earlier in this report and information on the volume and pricing of imports of the subject merchandise is presented in Parts IV and V. Information on the other factors specified is presented in this section and/or Part VI and (except as noted) is based on the questionnaire responses of seven firms that accounted for all U.S. production of PET resin during 2003.
U.S. PRODUCERS
Table m-1 presents U.S. producers’ plant locations, positions on the petition, parent companies
During the period examined, a number of firms added to their capacity to produce PET resin.’ (if applicable), and shares of total reported U.S. production in 2003.
Petitioner DAK’ completed a new PET resin facility and brought it on line in Moncks Comer, SC, in May 2003. Of the various additions to capacity by U.S. producers during the period examined, DAK’s increase was the only one that resulted from construction of a new plant. Other capacity additions occurred in a variety of ways, including the conversion of existing product lines to the production of PET resin as was the case for Wellman (petitioner) and ***; entry into a joint purchase agreement on the part of Wellman and Voridian (petitioner) that took advantage of Wellman’s excess melt capacity and Voridian’s excess solid stating ~apacity;~ and, in the case of M&G, through a deb~ttlenecking~ program that allowed for lower cost production lines at its West Virginia production facility.’
these investigations, Tiepet6 ***. StarPet began its operations in April 2003 with the purchase of Tiepet’s PET resin assets. For
’ *** did not increase their capacity during the period examined. DAK was created on July 1,2001, as a new company by acquisition from E.I. DuPont de Nemours (DuPont).
At the request of USITC staff, DAK provided estimated trade and financial results for Dupont’s operations for the first half of 200 1.
PET resin produced by the joint agreement was split 50150 by Wellman and Voridian. The term “debottlenecking” generally refers to an incremental expansiodincrease of capacity vs. addition of a
M&G began its U.S. PET resin operations in 2000 with the purchase of assets from Shell and began its new production line or plant.
debottlenecking program in 2001. In April 2004, M&G announced closure of one of its production lines at its Apple Grove, WV facility, stating, “The closure is regrettable but it has been forced by the current business environment where feedstock suppliers are showing little consideration for the need of the PET industry (particularly in North America) and stubborn brand owners are failing to share of the higher chain costs or to pass through the increases to the final consumers.” Retrieved on April 16,2004 at httr,://~~~v.mmolvmers.corn’CP2closinp:.hh-n.
liquidated and dissolved on December 27,2003. Tiepet was a wholly owned subsidiary of Tietex International, Ltd., a South Carolina corporation. Tiepet was
m- 1

Table 111-1 PET resin: U.S. producers, their positions on the petition, plant locations, ownership, and share of total
Firm
DAK
KoSa'
M&G2
Nan Ya3
oported U.S. production, 2003
Position on petition Plant location(s)
SuppoNPetitioner Fayetteville, NC
support Charlotte, NC
support Apple Grove, WV
SupporVPetitioner Lake City, SC
Moncks Corner, SC
SuppoNPetitioner
Starpet4 I*** (Asheboro, NC
Florence, SC Bay St. Louis, MS
Wellman5
~
Voridian' ~~
SupporVPetitioner Kingsport, TN Columbia, SC
2 *** 3 tt*
4 t**
5 *** 6 tt*
Source: Compiled from data submitted in response to Commission questionnaires.
Parent comDanv
Alfa S.A. de C.V. (Mexico)
Koch industries (Wichita, KS)
Share of production (percent)
**I
**I
**, NIA I **, Nan Ya Plastics
Corp. (Taiwan)
**r I ***
Co. (Kingsport, TN)
III-2
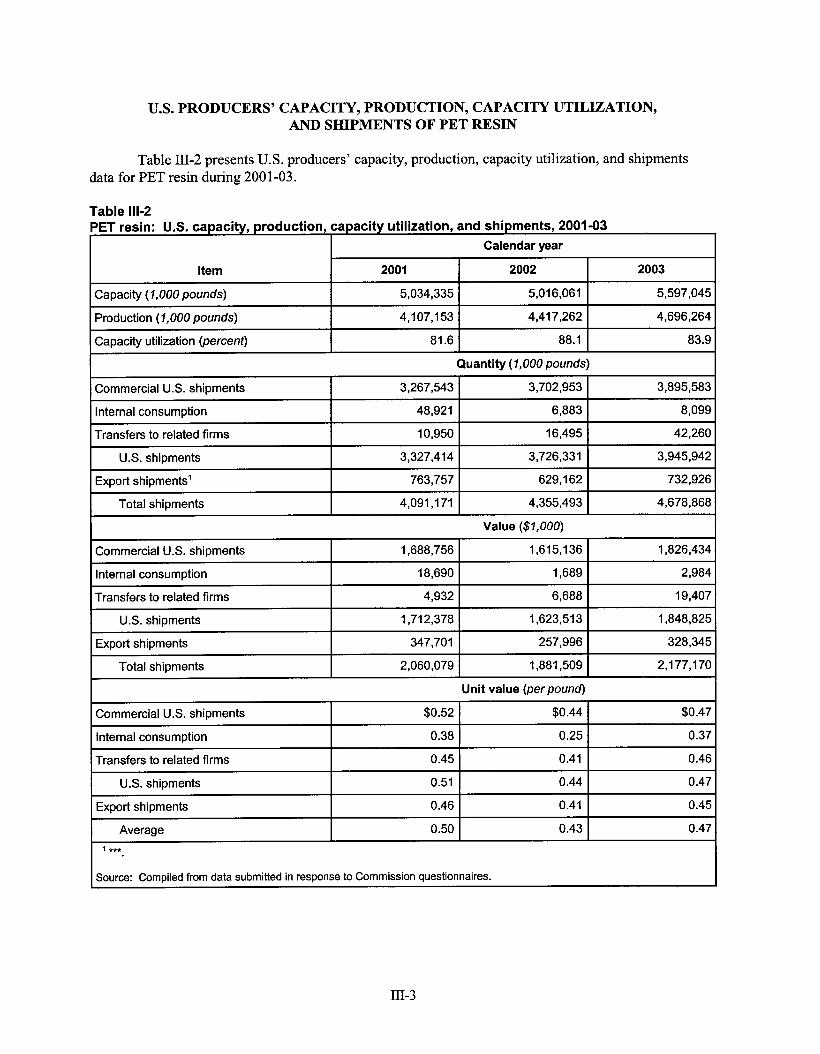
U.S. PRODUCERS’ CAPACITY, PRODUCTION, CAPACITY UTILIZATION, AND SHIPMENTS OF PET RESIN
Total shipments 4,091,171 4,355,493
Table 111-2 presents U.S. producers’ capacity, production, capacity utilization, and shipments data for PET resin during 2001-03.
4,678,868
Commercial U.S. shipments 1,688,756 1,615,136
Internal consumption 18,690 1,689
Transfers to related firms 4,932 6,688
U.S. shipments 1,712,378 1,623,513
Export shipments 347,701 257,996
Total ShiDments 2,060,079 1,881,509
1,826,434
2,984
19,407
1,848,825
328,345
2,177,170
Average I 0.50 I 0.43 I 0.47
Commercial U.S. shipments $0.52 $0.44
Internal consumption 0.38 0.25
Transfers to related firms 0.45 0.41
U.S. shipments 0.51 0.44
EX DO^^ ShiDments 0.46 0.41
I ’ ***.
$0.47
0.37
0.46
0.47
0.45
I Source: Comoiled from data submitted in resDonse to Commission auestionnaires.
111-3

U.S. PRODUCERS’ INVENTORIES OF PET RESIN
Item
Inventories (7,000 pounds)
Ratio to production (percent)
Ratio to total shipments (percent)
Ratio to U.S. shipments (percent)
Table III-3 presents end-of-period inventories for PET resin during the period for which data were collected.
Calendar year
2001 2002 2003
233,045 260,411 274,784
5.7 5.9 5.9
7.0 7.0 7.0
5.7 6.0 5.9
U.S. PRODUCERS’ EMPLOYMENT, COMPENSATION, AND PRODUCTIVITY WITH RESPECT TO PET RESIN
Table III-4 presents employment-related data for PET resin during the period for which data were collected.
Table 111-4
PART IV: U.S. IMPORTS, APPARENT U.S. CONSUMPTION, AND MARKET SHARES
The Commission sent questionnaires to more than 100 firms identified by the petition and a review of Customs data as having been importers of PET resin.’ Of these importers, approximately 30 accounted for most of the PET resin imports from the subject countries. Useable data were received from 2 1 firms, 17 of which imported subject product from India, Indonesia, Taiwan, and/or Thailand during the period examined. Table IV-1 presents information on the importing firms that provided useable information in response to the Commission’s questionnaire. For nine of the firms, imported product was consumed internally, while the remainder of the firms shipped their imports to end users.
Table IV-I PET resin: U.S. importers and sources of their imports, 2001-03
* * * * * * *
U.S. IMPORTS OF PET RESIN
Table IV-2 presents data regarding the quantity and value of U.S. imports of PET resin based on official Commerce statistics (HTS statistical reporting number 3907.60.0010). Canada and Mexico were the primary sources of “other source” imports, with Mexico’s portion of that category having increased in each succeeding year of the period examined. With respect to the geographical distribution of imports from the subject countries, in 2003, virtually all the imports from Indonesia and Taiwan were landed on the U.S. West Coast, while approximately 60 percent of all Thai imports were landed there. Conversely, essentially all of the subject Indian imports were landed on the U.S. East Coast.
’ Importers of PET resin from all sources.
Iv- 1
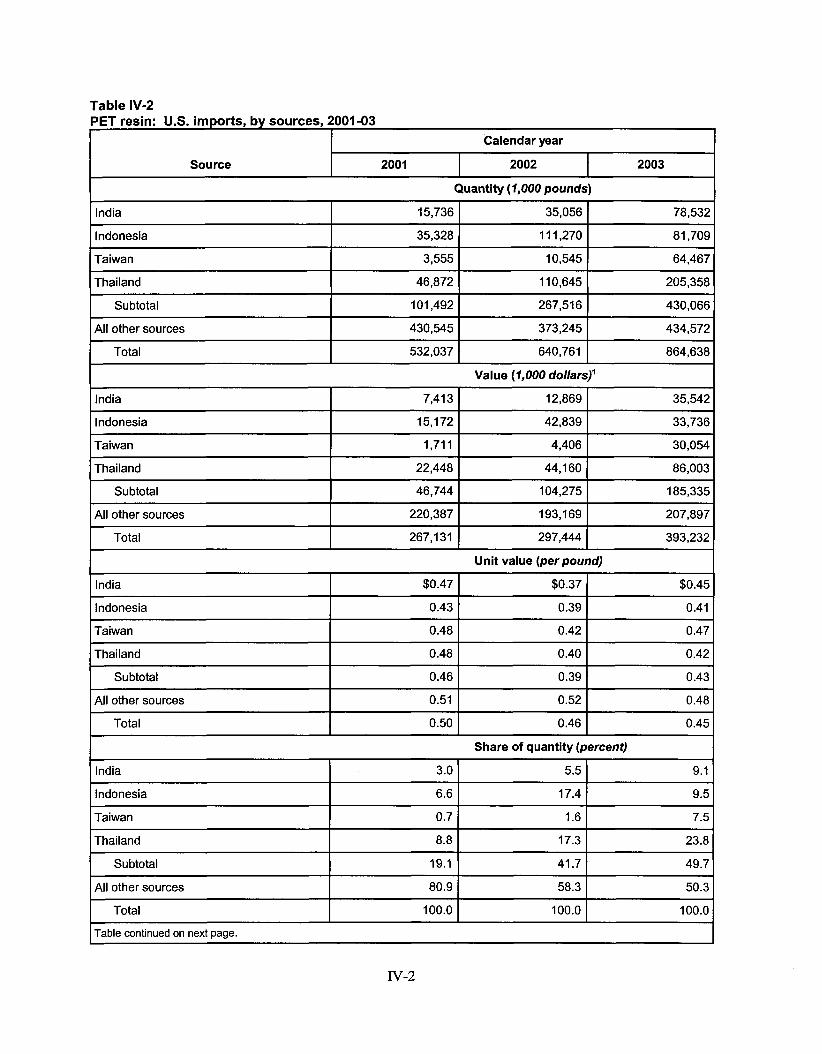
Table IV-2 'ET resin: U.S. imports, by sources, 2001 -03
Calendar year
India
Indonesia
Source I 2001 I 2002 I 2003
15,736 35,056 78,532
35,328 I 1 1,270 81,709
India
Indonesia
Taiwan I 3,555 I 10,545 I 64,467
7,413 12,869 35,542
15,172 42,839 33,736
Thailand I 46,872 I 11 0,645 I 205,358
Thailand
Subtotal
Subtotal I 101,492 I 267,516 I 430,066
22,448 44,160 86,003
46,744 104,275 185,335
~
All other sources
India $0.47
Indonesia 0.43
Taiwan 0.48
Thailand 0.48
Subtotal 0.46
All other sources 0.51
Total 0.50
I 430,545 I 373,245 I 434,572
$0.37 $0.45
0.39 0.41
0.42 0.47
0.40 0.42
0.39 0.43
0.52 0.48
0.46 0.45
Total I 532,037 I
~~~~~
India
Indonesia
Taiwan
Thailand
Subtotal
~
640,761 I 864,638
~
3.0 5.5 9.1
6.6 17.4 9.5
0.7 1.6 7.5
8.8 17.3 23.8
19.1 41.7 49.7
Taiwan I 1,711 I 4,406 I 30,054
All other sources I 220,387 I 193,169 I 207,897
Total I 267,131 I 297,444 I 393,232
All other sources I 80.9 I 58.3 I 50.3
Total I 100.0 I 100.0 I 100.0 ~
Table continued on next page.
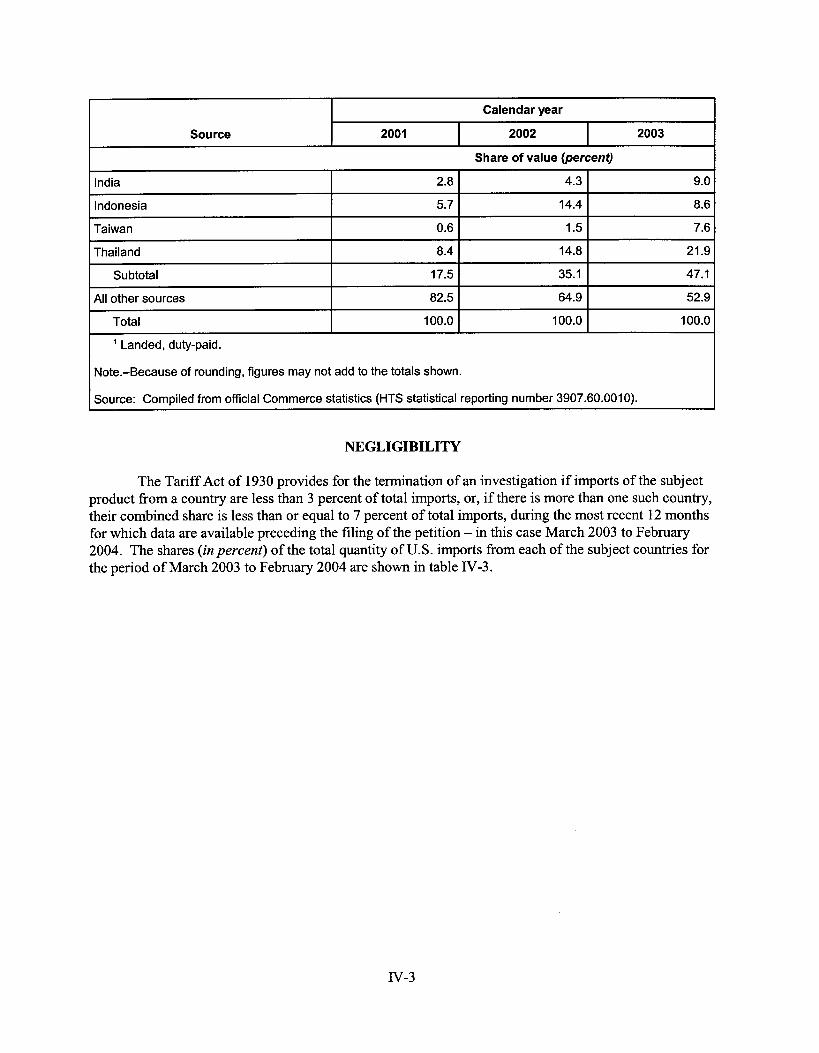
Calendar year I Source 2001 2002 2003
India
Indonesia
Taiwan
Thailand
Subtotal
All other sources
Total
I 2.8 I 4.3 I 9.0
5.7 14.4 8.6
0.6 1.5 7.6
8.4 14.8 21.9
17.5 35.1 47.1
82.5 64.9 52.9
100.0 100.0 100.0
’ Landed, duty-paid.
Note.-Because of rounding, figures may not add to the totals shown.
Source: Compiled from official Commerce statistics (HTS statistical reporting number 3907.60.001 0).
NEGLIGIBILITY
The Tariff Act of 1930 provides for the termination of an investigation if imports of the subject product from a country are less than 3 percent of total imports, or, if there is more than one such country, their combined share is less than or equal to 7 percent of total imports, during the most recent 12 months for which data are available preceding the filing of the petition - in this case March 2003 to February 2004. The shares (in percent) of the total quantity of U.S. imports from each of the subject countries for the period of March 2003 to February 2004 are shown in table IV-3.
Iv-3

Imports Share of total imports Country (7,000 pounds) (percen f)
India 77,732 9.7
Indonesia 77,520 9.7
Taiwan 60,818 7.6
Thailand 201,690 25.2
Subtotal 41 7,759 52.1
All other countries 383,347 47.9
Total 801,106 100.0
Note: Numbers may not add to the totals shown due to rounding.
Source: Compiled from official Commerce statistics (HTS statistical reporting number 3907.60.001 0).
APPARENT U.S. CONSUMPTION OF PET RESIN
Table IV-4 presents U.S. producers’ U.S. shipments, U.S. imports, and apparent U.S. consumption of PET resin. In this table, as well as tables IV-5 and C-1, the information is compiled from data submitted in response to Commission questionnaires (for U.S. producers’ shipments), official Commerce statistics (for imports from Taiwan and all other sources), and foreign producer/exporter questionnaires (for India, Indonesia, and Thailand). In the latter instance, the reported exports to the United States exceeded the imports reported in the official statistics, which may suggest that certain of the imported product may have been incorrectly entered under HTS statistical reporting number 3907.60.0050.2 Consequently, staff believes the foreign producer/exporter data are a more accurate reflection of imports from India, Indonesia, and Thailand.
* Petitioners stated their belief that the import statistics in HTS statistical reporting number 3907.60.0010 might be “understated due to the incorrect classification of some PET resin imports entered under HTS subheading 3907.60.0050, particularly for Indonesia.’’ Petition, p. 15, h. 19. Table C-2 presents official import statistics for HTS numbers 3907.60.0010 and 3907.60.0050 combined.
IV-4

Table IV-4 PET resin: U.S. producers’ U.S. shipments, U.S. imports, by sources, and apparent U.S. :onsumption, 2001 -03
I Calendar year Item 2001 2002 2003
U.S. producers’ U.S. shipments 3,327,414 3,726,331
U.S. imports from- *** *** India
Indonesia
Taiwan 3,555 10,545
Thailand
*** ***
*** ***
Subtotal 197,863 312,512
All other sources 430,545 373,245
Total 628,408 685,757
Apparent U.S. consumption 3,955,822 4,412,087
3,945,942
***
***
64,467 ***
497,616
434,572
932,188
4,878,130
1,848,825 U.S. producers’ U.S. shipments 1,712,378
U.S. imports’ from- *** India
Indonesia
Taiwan 1,711
Thailand
***
***
Subtotal 90,818
All other sources 220,387
Total 31 1,205
Apparent U.S. consumption 2,023,583
***
1,623,513
***
***
4,406 ***
121,695
193,169
314,864
1,938,377
***
30,054 ***
214,222
207,897
422,119
2,270,944
Source: Compiled from data submitted in response to Commission questionnaires (U.S. producers’ shipments and foreign producers’ exports to the United States for India, Indonesia, and Thailand), and official Commerce statistics (Taiwan and all other sources).
Iv-5
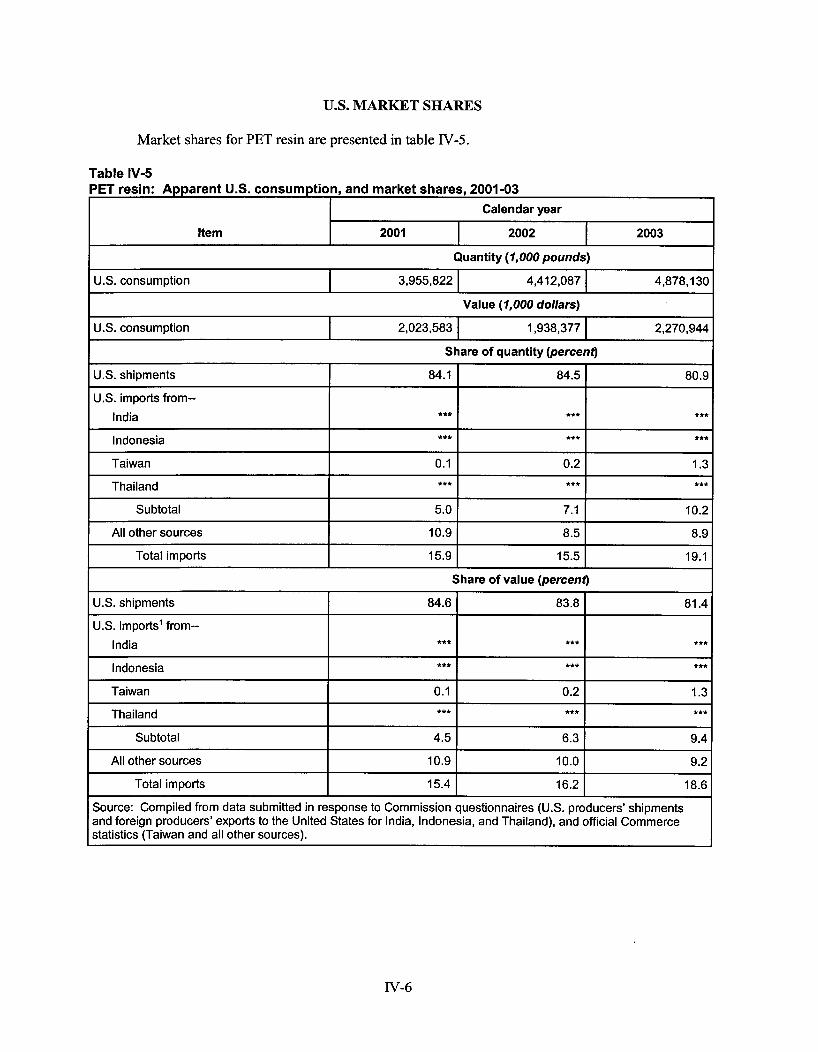
U.S. MARKET SHARES
Item
Market shares for PET resin are presented in table IV-5.
Calendar year
2001 2002 2003
U.S. consumption 3,955,822 4,412,087 4,878,130
US. shipments
U.S. imports‘ from-- India
Indonesia I *** I
84.6 83.8 81.4
*** *** ***
*** I
Subtotal
All other sources
Total imports
***
4.5 6.3 9.4
10.9 10.0 9.2
15.4 16.2 18.6
Taiwan 0.1 I 0.2 I 1.3
Thailand *** I *** I ***
IV-6
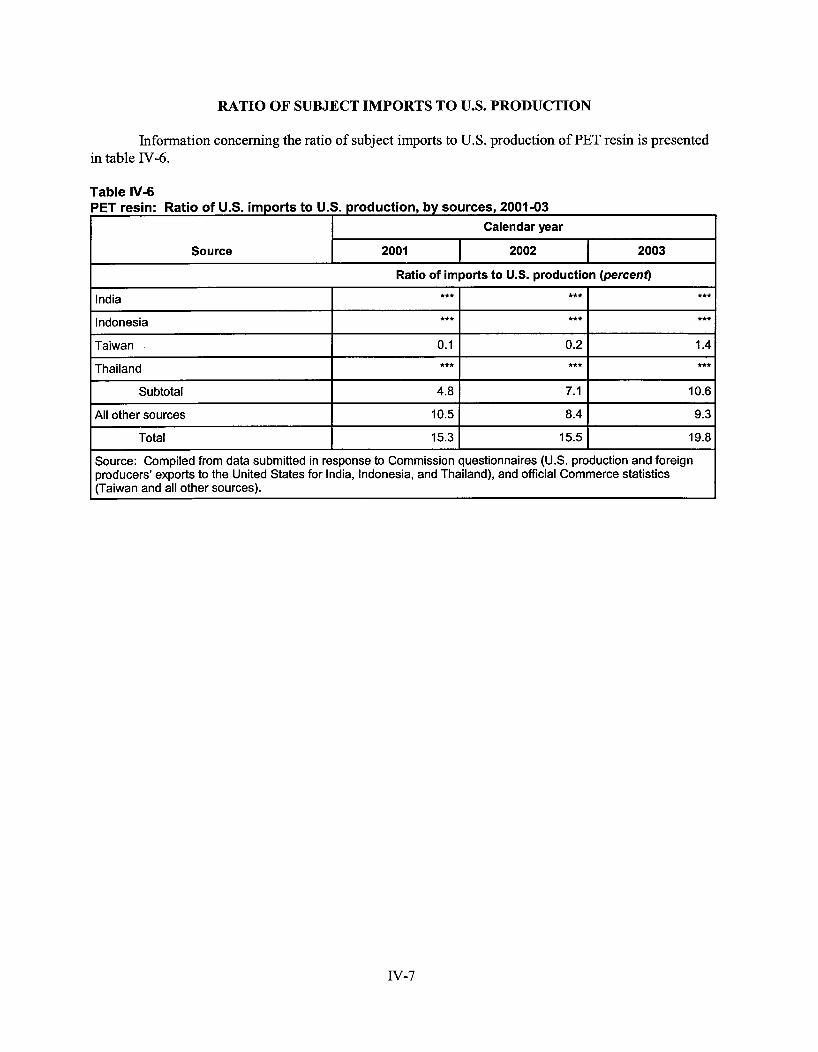
RATIO OF SUBJECT IMPORTS TO U.S. PRODUCTION
Source
Information concerning the ratio of subject imports to U.S. production of PET resin is presented in table IV-6.
Calendar year
2001 2002 I 2003
*** *** India *** ~~
Indonesia
Taiwan
Thailand
Subtotal
All other sources
Total
IV-7
*** *** ***
0.1 0.2 1.4 *** *** ***
4.8 7.1 10.6
10.5 8.4 9.3
15.3 15.5 19.8
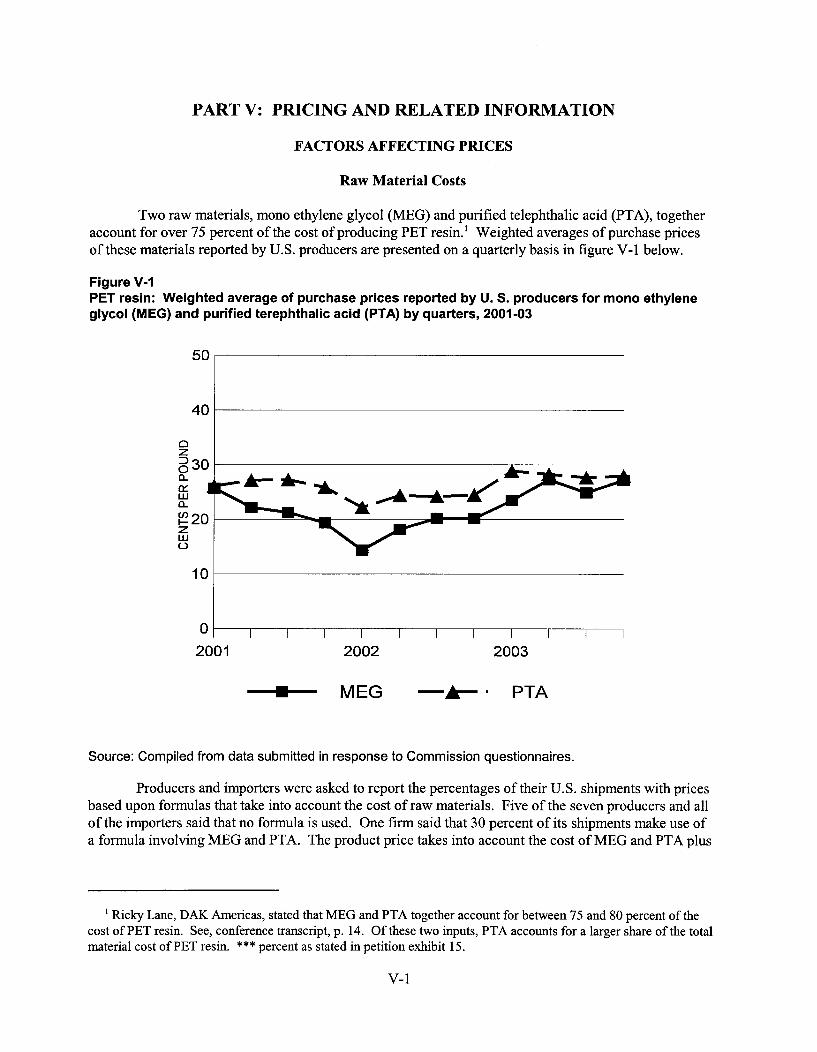
PART V: PRICING AND RELATED INFORMATION
FACTORS AFFECTING PRICES
Raw Material Costs
Two raw materials, mono ethylene glycol (MEG) and purified telephthalic acid (PTA), together account for over 75 percent of the cost of producing PET resin.' Weighted averages of purchase prices of these materials reported by U.S. producers are presented on a quarterly basis in figure V-1 below.
Figure V-I PET resin: Weighted average of purchase prices reported by U. S. producers for mono ethylene glycol (MEG) and purified terephthalic acid (PTA) by quarters, 2001-03
40 50d
01 I I I I I I I I I I I
2001 2002 2003
MEG -&I PTA
Source: Compiled from data submitted in response to Commission questionnaires.
Producers and importers were asked to report the percentages of their U.S. shipments with prices based upon formulas that take into account the cost of raw materials. Five of the seven producers and all of the importers said that no formula is used. One firm said that 30 percent of its shipments make use of a formula involving MEG and PTA. The product price takes into account the cost of MEG and PTA plus
' Ricky Lane, DAK Americas, stated that MEG and PTA together account for between 75 and 80 percent of the cost of PET resin. See, conference transcript, p. 14. Of these two inputs, PTA accounts for a larger share of the total material cost of PET resin. *** percent as stated in petition exhibit 15.
v- 1

a conversion fee which includes other costs plus a margin. Another firm that is engaged in tolling said about 20 percent of its shipments make use of complex formulas involving MEG and PTA.
Transportation Costs to the U.S. Market
Transportation costs for PET resin shipped from India to the United States averaged 10.3 percent of the customs value during 2003, and transportation costs of imports from India, Indonesia, Taiwan, and Thailand averaged 10.3 percent, 9.7 percent, 8.4 percent, and 10.1 percent of their respective customs values during 2003. These estimates are derived from official import data.2
U.S. Inland Transportation Costs
Transportation costs on U.S. inland shipments of PET resin generally account for a small to moderate share of the delivered price of these products. For the seven U.S. producers, reported costs ranged from 5 to 7 percent of the delivered price. For importers fkom the subject counties, the costs ranged from 1.25 percent to as much as 13 percent of the delivered price.
Exchange Rates
Nominal and real exchange rate data for India, Indonesia, Taiwan, and Thailand are presented on a quarterly basis in figure V-2.3 The data show that the nominal exchange and real exchange rates of the Indonesian rupiah and Thailand baht both appreciated relative to the U.S. dollar during the 200 1-03 period, while the new Taiwan dollar was relatively stable in both nominal and real terms. In the case of India, the rupee was relatively stable in nominal terms, but appreciated moderately in real terms.
PRICING PRACTICES
Pricing Methods
When questionnaire respondents were asked how they determined the prices that they charge for PET resin, responses were varied. Among U.S. producers, customer-by-customer negotiations, or transaction-by-transaction negotiations were cited by some firms. In other cases, the responses focused upon such factors as raw material costs, competitive conditions, payment terms, or shipping costs. Among importers most firms reported that prices are determined through negotiations with buyers, in some cases on a transaction-by-transaction basis. Three importers also said that prices are determined in the course of negotiations for multiple shipments. None of the producers or importers reported the use of price lists.
Prices of PET resin are most commonly quoted on a delivered basis rather than an f.0.b. basis. Five of seven producers quote exclusively on a delivered basis, while the other firms provide both f.0.b. and delivered quotes. Most of the responding importers that sell PET resin quote on a delivered basis, although one firm quotes on an f.0.b. Asia basis.
The estimated cost was obtained by subtracting the customs value from the c.i.f. value of the imports for
Real exchange rates are calculated by adjusting the nominal rates for movements in producer prices in the 2002 and then dividing by the customs value.
United States and each of the subject countries.
v-2
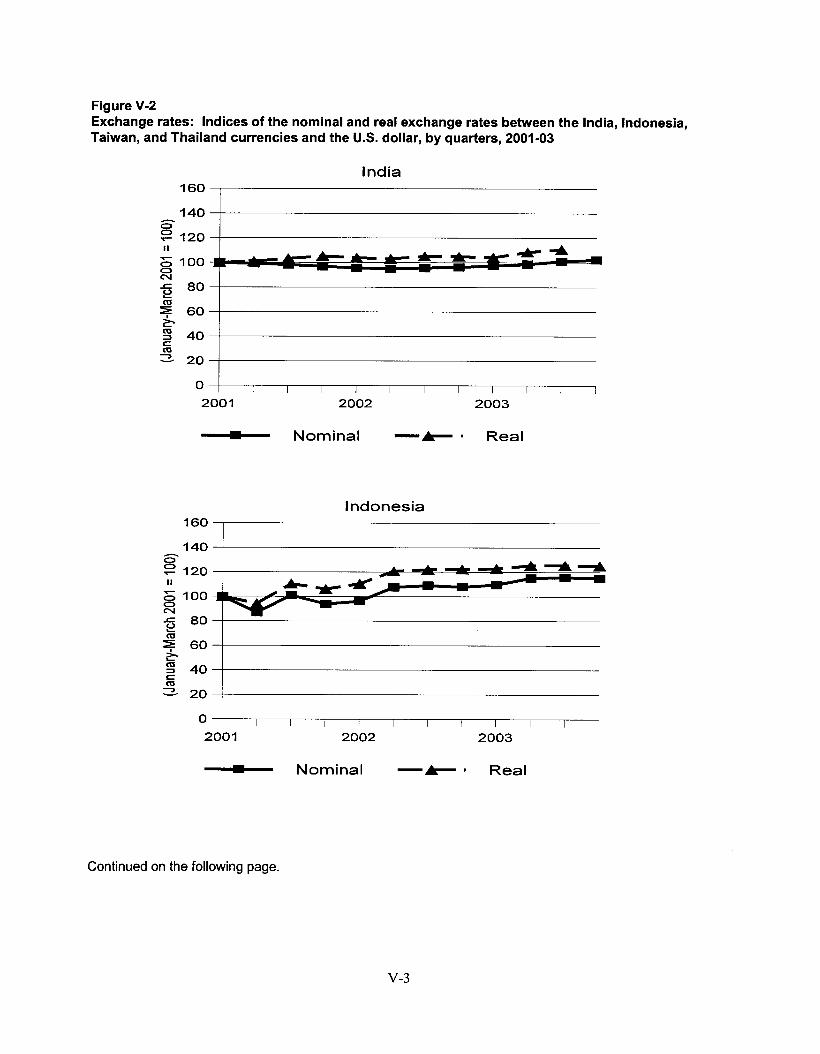
Figure V-2 Exchange rates: Indices of the nominal and real exchange rates between the India, Taiwan, and Thailand currencies and the U.S. dollar, by quarters, 2001-03
0
India 160
I I I I I I I I I
II g 100 cv
= 80 2 4 60
=I 40 s c m 2- 20
0 I I I I I I I I I I I
- Nominal -* I Real
Indonesia 160 I
I
140 !
Indonesia,
- Nominal -* I Real
Continued on the following page.
v-3
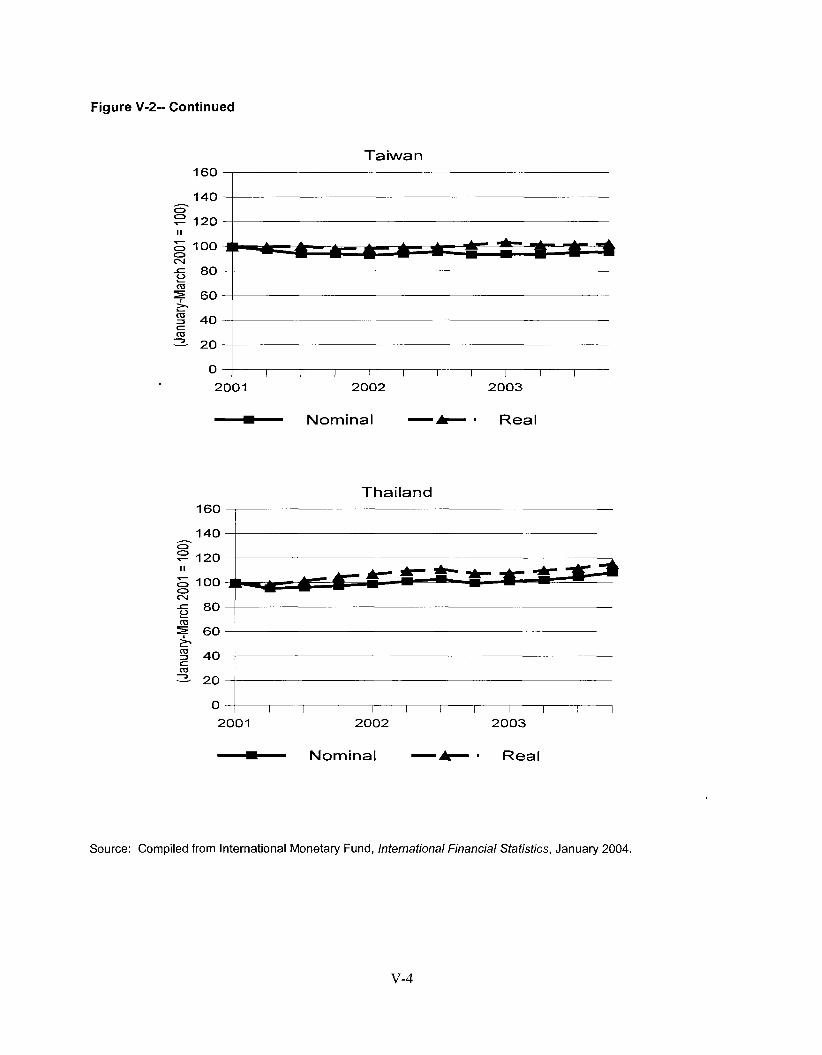
Figure V-2- Continued
Ta iwa n 160
80
60
40
20
0
2001 2002 2003 - Nominal -e I Real
Thailand 160
h
0 z 120 II
g 100 tv
20 40 : I I I I I I I I I I I
2001 2002 2003 - Nominal -+ I Real
Source: Compiled from International Monetary Fund, International Financial Statistics, January 2004.
v-4
U.S. producers and importers of PET resin from India, Indonesia, Taiwan, and Thailand were asked what share of their sales were on a (1) long-term contract basis (multiple deliveries for more than 12 months), (2) short-term contract basis, and (3) spot sales basis (for a single delivery) during 2003. Among producers, two firms reported that they sell entirely on a spot basis. Among the other five producers, a majority of sales were on either a short-term or long-term contract basis. Among the nine importers that reported sales of imports from the subject countries, two reported that they sell exclusively on a spot basis, and seven sell on both a spot and contract basis. None of the importers reported the use of long-term contracts. For U.S. producers selling on a contract basis, provisions varied from company to company. Long-term contracts are typically for periods of two to five years, while short-term contracts are for periods of less than one year. For both long-term and short-term contracts, quantities but not prices are generally fixed during the contract period. These producer contracts usually have a meet-or-release provision. In the case of importers, short- term contracts are typically for periods of one to nine months with both prices and quantities typically fixed during the contract period. They do not contain meet-or-release provisions.
PRICE DATA
The Commission asked U.S. producers and importers of PET resin from India, Indonesia, Taiwan, and Thailand to provide quarterly data for the total quantity and value of selected products that were shipped to unrelated customers in the U.S. market during 2001-03. The products for which pricing data were requested are as follows:
Product I.-PET resin, being either a clear homo- or co-polymer, and having an intrinsic viscosity of 0.72 IV to 0.84 IV, in the solid stated form. This PET resin product is typically used in water bottle applications.
Product 2.--PET resin, being either a clear homo- or co-polymer, and having an intrinsic viscosity of 0.78 IV to 0.86 IV, in the solid stated form. This PET resin product is typically used in carbonated soft drink (“CSD”) applications.
Product 3.--PET resin, being either a clear homo- or co-polymer, and having an intrinsic viscosity of 0.75 IV to 0.86 IV, in the solid stated form. This PET resin product is typically used in heat set or hot fill applications.
Product &-PET resin, being either a clear homo- or co-polymer, and having an intrinsic viscosity of 0.75 IV to 0.84 IV, in the solid stated form. This PET resin product is a general purpose resin that can be used in custom, food, household product, sheet, liquor, water bottle, CSD, and heat set or hot fill applications.
Six U.S. producers and nine importers of PET resin from one or more of the subject countries provided varying amounts of usable price data! Price data from the producers accounted for over 80 percent of domestic shipments during 2003, and data from importers accounted for *** percent of imports fiom India, *** percent of imports from Indonesia, *** imports from Taiwan, and *** percent of imports from Thailand in 2003.
One U.S. producer,***, presented data in a form that could not be used.
v-5
Price Trends
Weighted-average prices reported for U.S. producers and importers are presented in tables V-1 through V-3 and in figures V-3 through V-5 on a quarterly basis during 200 1-03 .’ No clear trend was evident from either producer or importer prices during this period. However, producer prices show some evidence of seasonality, tending to be higher in the second and third quarters of each year than in the first and fourth quarters.
Table V- I PET resin: Weighted-average f.0.b. prices and quantities of domestic and imported product 1, by quarters, 2001 -03
* * * * * * *
Table V-2 PET resin: Weighted-average f.0.b. prices and quantities of domestic and imported product 2, and domestic product 3 by quarters, 2001 -03
* * * * * * *
Table V-3 PET resin: Weighted-average f.0.b. prices and quantities of domestic and imported product 4, by quarters, 2001 -03
* * * * * * *
Figure V-3 PET resin: Weighted-average f.0.b prices and quantities of domestic and imported product 1, by quarters, 2001 -03
* * * * * * *
Figure V-4 PET resin: Weighted-average f.0.b prices and quantities of domestic and imported product 2, by quarters, 2001 -03
* * * * * * *
Figure V-5 PET resin: Weighted-average f.0.b prices and quantities of domestic and imported product 4, by quarters, 2001 -03
* * * * * * *
Price Comparisons
Margins of underselling for the three-year period are presented by country and by product category in table V-4. The data show that prices of imports from India were lower than the U.S. producer prices in 11 out of 14 quarterly comparisons by margins of 2.2 percent to 15.6 percent; imports from Indonesia were
’ A weighted average of imports from all subject countries for products 1,2, and 4 is presented in app. D.
V-6

Table V-4 PET resin: Margins of underselling (overselling) by product and by country, quarterly, 2001-03
* * * * * * *
lower in 18 out of 24 comparisons by margins ranging from a minimal level to 29.3 percent; imports from Taiwan were lower in 6 out of 10 comparisons by margins of 1.7 to 10.1 percent; and those from Thailand were lower in 18 out of 34 comparisons by margins of 0.4 to 19.7 percent.
LOST SALES AND LOST REVENUES
In the petition, members of the U.S. Pet Resin Producers’ Coalition (petitioner) provided *** usable lost sales allegations involving over *** pounds of PET resin valued at nearly $*** and *** lost revenue allegations involving about *** pounds of PETresin valued at over $***. The Commission staff contacted all of the *** purchasers named in the allegations; six purchasers responded.’ The results are summarized in tables V-5 and V-6 and are discussed below.
* * * * * * *
Table V-5 PET resin: U.S. producers’ lost sales allegations
* * * * Table V-6 PET resin: U.S. producers’ lost revenue allegations
* * * *
* * *
* * *
In addition to these allegations, the petitioner also alleged that it lost sales of more than *** in the sheet market in December 2003 due to competition imports from Indonesia and Thailand. However, specific companies and contacts were not provided.
The other purchasers did not respond to the allegations.
v-7

PART VI: FINANCIAL EXPERIENCE OF THE U.S. PRODUCERS
BACKGROUND
Eight companies reported financial results on their U.S. PET resin operations: DAK, KoSa, M&G, Nan Ya, Starpet, Tiepet, Voridian, and Wellman. With several exceptions, U.S. producers reported their financial results for calendar years 2001 through 2003.’ The majority of operations represented manufacturing of PET resin for direct commercial sale. Some tolling, transfers, and internal consumption activity was also reported.2
In several instances, ITC staff reclassified reported costs so they would correspond to the requested f ~ r m a t . ~
OPERATIONS ON PET RESIN
Income-and-loss data are presented in table VI-1. Selected financial information is presented in
The period began with what appears to be relatively healthy gross and operating profitability. table VI-2. A variance analysis is presented in table VI-3.
The interaction of changes in both average unit sales value and COGS -the primary component of which is raw material - resulted in narrowing gross margins in 2002 and 2003. While overall sales volume increased throughout the period, lower gross margins resulted in reduced absolute profitability.
pattern of change on an average unit basis: a decline in 2002 followed by an increase in 2003. Variations in raw material costs by company are due, at least in part, to the fact that the specific type and source of raw materials used is somewhat different for each corn pan^.^ Non-raw material manufacturing cost on an average unit basis stayed about the same for most producers, indicating that raw material cost was the primary factor explaining period-to-period changes in COGS.6 manufacturing COGS by company suggests other differences in cost structure beyond the type and form of raw material used.’
Raw material cost was separately reported by each company and generally followed the same
Overall PET resin
1 *** 2 *** For periods when the majority of a producer’s sales volume represented activity as a traditional toller (i.e.,
***), the U.S. producer’s operating income was deducted from overall non-tolling other factory costs. The toller’s volume, value, and COGS were excluded in the consolidated financial results.
***. April 23,2004 e-mail from Todd Murray, Business Analysis Manager - Packaging Resin, Kosa. ***. April 12,2004 staff interview with Jay Abraham, Controller, Wellman.
***. April 23 staff interview with Kevin McAaron, Finance Manager, M&G and Mark Adlam, North American Commercial Manager, M&G.
Voridian’s “PET polymers production is vertically integrated back to the raw material paraxylene for a substantial majority of its capacity.” P. 26 Eastman Annual Report. ***. April 19,2004 staff interview with Jim Steffen, Controller, Voridian. ***. April 15,2004 staff interview with Jay Abraham, Controller, Wellman. ***.
See footnote 4 regarding reclassification of direct labor and energy costs. Wellman’s 2003 10-K states that “{o}ur profitability is primarily determined by our raw material margins,
which is the difference between net selling prices and raw material costs.” Wellman 2003 10-K at p. 13. “Higher raw material costs for the PPG {Packaging Products Group} {in 2003) were the result of increased unit costs due to temporary supply pressures and higher crude oil and natural gas costs.” Wellman 2003 10-K at p. 17.
* ***. April 15,2004 staff interview with Jay Abraham, Controller, Wellman.
VI- 1

Table VI-I PET resin: Consolidated financial results, calendar years 2001-03
Calendar year
Item
Commercial sales
~~
2001 2002 2003
Quantity (1,000 pounds)
4,126,636 4,371,929 4,731,416
Internal consumption I 45,678 I 5,704 I 1,695
Total net sales quantity
Transfers
4,218,525 4,451,564 4,858,365
46,211 I
Commercial sales
Internal consumption
73,931 I
1,992,761 1,865,516 2,188,088
17,382 1,270 605
~
125,254
Total net sales value
Cost of goods sold:
2,032,672 1,896,065 2,239,897
Transfers
Other factory costs
Total cost of goods sold
I 22,529 I
41 7,941 407,559 458,093
1,720,721 1,624,454 2,025,045
~~
29,279 I 51,204
Gross profit
SG&A expenses
Operating income
- 31 1,951 271,611 214,852
147,994 130,782 142,194
163,957 140,829 72,658
I Raw material I 1,302,780 I 1,216,895 I 1,566,952 I
Interest expense
Other expenses
Other income items
37,049 39,381 36,067
9,768 7,944 8,586
0 0 5,322
I Net income I 117,140 I 93,504 I 33,327 I I Depreciation/amortization I 79,137 I 89,600 I 98,752 I I Estimated cash flow I 196,277 I 183,104 I 132,079 I
~~~
Continued on following page.
VI-2

Table VI-I --Continued
Other factory costs 0.10
‘ET resin: Consolidated financial results, calendar years 2001-03 Calendar year
0.09 0.09
I 2001 I 2002 I 2003
Total cost of goods sold
Gross profit
SG&A expenses
Cost of goods sold: I
0.41 0.36 0.42
0.07 0.06 0.04
0.04 0.03 0.03
Operating income 0.04 0.03 0.02
Number of firms reporting
Operating losses
Data
1 1 2 7 6 8
Source: Compiled from data submitted in response to Commission questionnaires.
VI-3
Table Vi-2 PET resin: Selected financial information by company, calendar years 2001 -03
* * * * * * *
Of those companies having operations throughout the period, M&G was consistently ***.9
CAPITAL EXPENDITURES AND R&D EXPENSES
Data on capital expenditures and research and development (R&D) expenses are shown in table
Most U.S. producers added capacity during the period examined which is reflected, in part, in the VI-4.
reported capital expenditures." While R&D expenses were reported by all companies, ***.ll
ASSETS AND RETURN ON INVESTMENT
The value of assets and return on investment is shown in table VI-5.12 No previous PET resin investigation has been conducted by the Commission. l3 Comparative Risk Management Association ( M A ) financial information for SIC 2821 is presented in table VI-6.I4
***. M&G's debottlenecking investments over the period examined were reported to be around $35 million. Retrieved on April 22,2004 at http://www.recyclingtoday.com/news/news.astx ***. April 22, 2004 staff interview with Kevin McAaron, Finance Manager, M&G and April 23 staff interview with Kevin McAaron and Mark Adlam, North American Commercial Manager, M&G. * * * .
10 ***. I ' ***. April 19,2004 staff interview with Hans Kinner, Business Director -North America, Voridian. I' Table VI-5 presents return on investment along with its sub-components: asset turnover and operating
margin. Asset turnover, sales divided by (in this case) total period assets, is a measure of a firm's ability to generate sales from a specific investment in assets (Financial Reporting and Statement Analysis: A Strategic Perspective, p. 128).
investigationdreviews. See, Polyethylene Terephthalate Film, Sheet and Strip from India and Taiwan, inv. Nos. 701-TA-415 and 73 1-TA-933-934 (Final) and Polyethylene Terephthalate film from Korea, inv. No. 73 1-TA-459 (Review). Staff does not believe, however, that a direct comparison of PET film and PET resin financial indicators would be meaningful.
and nonvulcanizable elastomers. Important products of this industry include: cellulose plastics materials; phenolic and other tar acid resins; urea and melamine resins; vinyl resins; styrene resins; alkyd resins; acrylic resins; polyethylene resins; polypropylene resins; rosin modified resins; coumarone-indene and petroleum polymer resins; miscellaneous resins, including polyamide resins, silicones, polyisobutylenes, polyesters, polycarbonate resins, acetal resins, and fluorohydrocarbon resins; and casein plastics. Since RMA does not identi@ respondents, the extent to which U.S. producers in these investigations are reflected in the RMA data is unknown.
I' PET film appears to be the closest product to PET resin for which the Commission has conducted
l 4 SIC 282 1 includes establishments primarily engaged in manufacturing synthetic resins, plastics materials,
VI-4
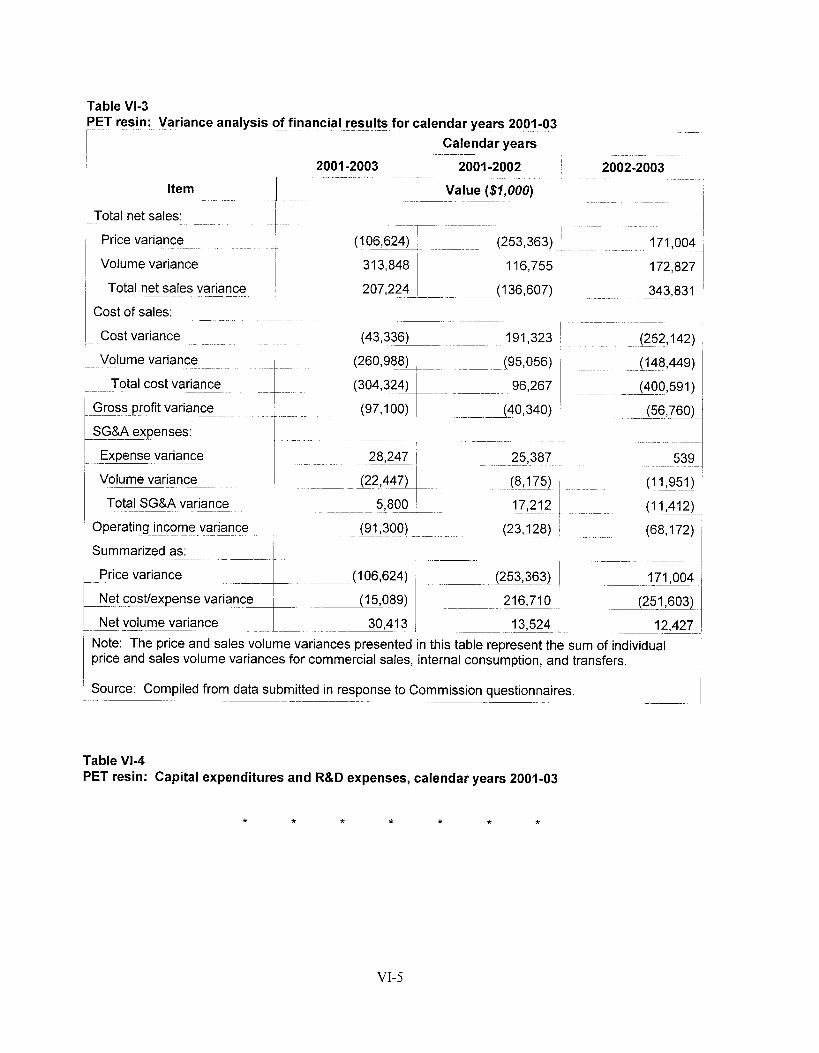
Table VI-3 PET resin: Variance analysis of financial results - for calendar years 2001-03
~
1 Total net sales: ~ _ _ ~
i
I
Calendar years -- - -
2001-2003 -~ 1 2001-2002 - - ~
Value ($7,000) ~~ - - ~~
Price variance
Volume variance
Total net sales variance ~~ - ~~
Cost of sales: I
Cost variance
Volume variance
Total - cost variance - -~
Gross profit variance ~ -~ ~- ._
SG&A expenses: - - ~
Expense variance ~ -~ ~~
Volume variance I -~ ~~
Total SG&A variance ~~ ~ _ _
Operating ~ - p -- income ~ variance ~~
Summarized as. ~
Price variance I Net cost/expense _ _ ~ ~ . variance __
Net volume variance ~ _ _ . _ _ _ _ _ _ _ _
(1 06,624) ~~ (253,363) --
313,848 ~
207,224 1 116,755
(1 36,607) ~
I I ~~
30,4131 .
(253,363)
216,710
13,524 ' ~-~
171,004, ~
172,827
~ 343,831
- - - ~~
~ ~- (252,142)
(1 48,449)
- ~ (400,591) ~
(56,760)
- ~~
~ p~
539
(11,951) -p
~- (1 - 1,412)
(68,172) ~ ~ - -
~ ~~
171.004
- (251,603) -~
- 12,427 Note: The price and sales volume variances presented in this table represent the sum of individual price and sales volume variances for commercial sales, internal consumption, and transfers.
Source: Compiled from data submitted in response to Commission questionnaires. -~ ~ - ~~ __-p - ~
Table V I 4 PET resin: Capital expenditures and R&D expenses, calendar years 2001-03
* * * * * * *
VI-5

Table VI-5 PET - resin: -~ Consolidated - value of assets and - - ~ return ~ on investment, -~~ calendar years 2001-03
-
Calendar years
2003 2001 I 2002 I Item I Value - -~ ($7,000)
1 I. Current - assets:
I -
Cash -~ and equivalents - -
r ~-
I 33.442 I 144,677
- ~ -
~ Accounts receivable, net I 290,664 273,121 ~ 306,823
i Inventories - 150,581 1 177,760 I - 7,253 '
20,803 1 - 701,335 1
-1 4,873 1 21,756 1
I 510,952 1
-~ -~ 27,378 ~~
~- ~
I ~~~ --
503,296
I Prepaid - expenses
1 Other current -~ assets -
' - Total current assets - - - -
~~~
- 2. Property, plant, ~~ and equipment: - -
-- Original ~ cost
- - ~ Accumulated - depreciation ~
Book value
Goodwill ~-
___.
~~ 3. Other non-current assets
4. Total assets --- -- ~
33,010 ' 54,079 58,236
- - 1,595,907 ~ 1,772,188
Asset turnover _ _ ~ ~ - - -
Ratio of operating income to net sales --__
____- Operating - income ~
7.4 1 3.2 I Asset turnover multiplied by operating income ratio 1 - - -
Return on investment _ _ _ _ _ ~ -- 4. I -~
Note: The asset base used to calculate return on investment is affected by the transfer of ownership during the period and the extent to which each company was able to isolate requested asset information to PET resin operations.
Source: Compiled from data submitted in response to Commission questionnaires. - - - - - - - -
VI-6

Table VI-6 PET resin: Risk Management Association data on the number of firms and their sales, operating income, assets, and return on investment on their operations for SIC Code 2821 (Plastic materials, synthetic resin, and nonvulcanizable elastomers) for 11 one-year periods ending March 31,1991 to March 31,2001
* * * * * * *
RMA information indicates that the majority of assets in SIC 2821 are comprised of trade receivables, inventory, and net fixed assets. The combined average of these items, as a percentage of total assets for the period reflected in table VI-6, was 85 percent. For PET resin operations, these items averaged around 90 percent of total reported assets, as shown in table VI-5.
CAPITAL AND INVESTMENT
The Commission requested U.S. producers to describe any actual or potential negative effects of imports of PET resin from India, Indonesia, Taiwan, and Thailand on their firms’ growth, investment, and ability to raise capital or development and production efforts (including efforts to develop a derivative or more advanced version of the product). Their responses are shown in appendix E.
VI-7

PART VII: THREAT CONSIDERATIONS
The Commission analyzes a number of factors in making threat determinations (see 19 U.S.C. tj 1677(7)(F)(i)). Information on the nature of the alleged subsidies was presented earlier in this report; information on the volume and pricing of imports of the subject merchandise is presented in Parts N and V; and information on the effects of imports of the subject merchandise on U.S. producers’ existing development and production efforts is presented in Part VI. Information on inventories of the subject merchandise; foreign producers’ operations, including the potential for “product-shifting;” any other threat indicators, if applicable; and any dumping in third-country markets, follows.’
THE INDUSTRY IN INDIA
Table VII-1 presents data provided by Indian producers/exporters with respect to their PET resin operations in India. Four firms provided useable data; however, one of the firms had only very limited exports to the United States during the period examined. The exports to the United States of these firms were equivalent to *** percent of official reported U.S. imports from India in 2003. Other export destinations for the Indian producers were ***.
THE INDUSTRY IN INDONESIA
Table VII-2 presents data provided by a single Indonesian producer/exporter with respect to its PET resin operations in Indonesia. *** exports to the United States were equivalent to *** percent of official reported U.S. imports from Indonesia in 2003. ***.
THE INDUSTRY IN TAIWAN
Table VII-3 presents data provided by Taiwan producers/exporters concerning their PET resin operations in Taiwan. Two firms, ***, responded to the Commission’s request for information. Of these firms, only ***. The export markets noted by the Taiwan producers were ***.
THE INDUSTRY IN THAILAND
Table VII-4 presents data provided by Thai producer/exporters with respect to their PET resin operations in Thailand. Four firms, three of which exported to the United States during 2001-03, provided useable data. Together, these firms’ exports to the United States were equivalent to *** percent of subject U.S. imports from Thailand in 2003. The fourth firm providing data (which is included in table VII-4) only began production in April 2004, but did indicate that ***. Aside from the United States, the other export destinations noted by Thai producers were ***.
’ The Commission contacted foreign producerlexporters in the subject countries either via FAX or through counsel for those firms with representation. The petition listed 5 Indian firms, 5 Indonesian firms, 5 Taiwan firms, and 5 Thai f m . Petition, exhibit 10.
VII- 1

Table VII-1 PET resin: Indian production capacity, production, shipments, and inventories, 2001 -03, and projected 2004-05
* * * * * * *
Table Vll-2 PET resin: Indonesian production capacity, production, shipments, and inventories, 2001 -03, and projected 2004-05
* * * * * * *
Table Vll-3 PET resin: Taiwan production capacity, production, shipments, and inventories, 2001-03, and projected 2004-05
* * * * * * *
Table Vll-4 PET resin: Thai production capacity, production, shipments, and inventories, 2001 -03, and projected 2004-05
* * * * * * *
vu-2

U.S. INVENTORIES OF PET RESIN FROM THE SUBJECT COUNTRIES
Inventories (7,000 pounds)
Ratio to imports (percent)
Ratio to U.S. shipments of imports (percent)
Inventories of PET resin reported by US. importers are presented in table VII-5.
375 396 1,989 *** *** **.
*** ttt ***
Inventories (7,000 pounds)
Ratio to imports (percent)
I Imports from Thailand: ~
4,468 7,080 10,467 *** *** ***
1
Inventories (7,000 pounds) 10,186 16,206 I 40,028
I Ratio to U.S. shipments of imports (percent) I
Ratio to imports (percent)
Ratio to US. shipments of imports (percent)
*** I
*** *** *tt
*** *** ***
*** ***
Inventories (7,000 pounds) 5,169 1,975 3,806
Ratio to imports (percent)
Ratio to U.S. shipments of imports (percent)
~~
*** *t* ***
t*t *** ***
Imports from all sources:
Inventories (7,000 pounds)
Ratio to imports (percent)
Ratio to U.S. shipments of imports (percent)
VII-3
~
15,355 18,181 43,834 *** *** ***
*** *** ***

U.S. IMPORTERS’ CURRENT ORDERS
-
Country Firm
Nine importers reported orders for approximately 67.0 million pounds of PET resin from subject countries that were slated for delivery after December 3 1,2003. The ordered product was sourced from Indonesia, Taiwan, and Thailand. No importers reported orders of product from India for delivery after December 3 1 , 2003.
An tid u m pi nglco u n tervai I i ng duty
(percent)
ANTIDUMPING AND COUNTERVAILING DUTY ORDERS IN THIRD-COUNTRY MARKETS
Reliance Industries, Ltd. Pearl Engineering Polymers, Ltd. Others
In November 2000, the EU imposed antidumping duties on imports of PET resin from India, Indonesia, Korea, Malaysia, Taiwan, and Thailand as well as countervailing duties on imports from India, Malaysia, and Thailand. The duties (as applicable), expressed as a percentage of the c.i.f. import price at the EU border, for the countries subject to these investigations are shown in table VII-6.
51.5 30.0 51.5
Thai Shigkong Industry Corp., Ltd. Others
Antidumping duty:
32.5 32.5
-
India
- Thailand Thai Shigkong Industry Corp., Ltd. 8.40
Source: Official Journal of the European Communities, Council Regulation (EC) No. 2604/2000, 27 November 2000, and Council Regulation (EC) No. 2603/2000,27 November 2000.
Indonesia
Taiwan
Thailand
Countervailing duty:
P.T. Bakrei Kasei Corp. P.T. lndorama Synthetics, Tbk P.T. Polypet Karyapersada Others
Far Eastern Textile, Ltd. Shingkong Synthetic Fibers Corp. Tuntex Distinct Corp. Nan Ya Plastics Corp. Others
63.5 15.2 73.7 73.7
7.8 7.8
12.4 9.6
12.4
India Reliance Industries, Ltd. Pearl Engineering Polymers, Ltd. Futura Polymer, Ltd. Elque Polyesters, Ltd. Others
8.23 5.80 0.37 4.43 8.23
VII-4

APPENDIX A
FEDERAL REGISTER NOTICES
A- 1
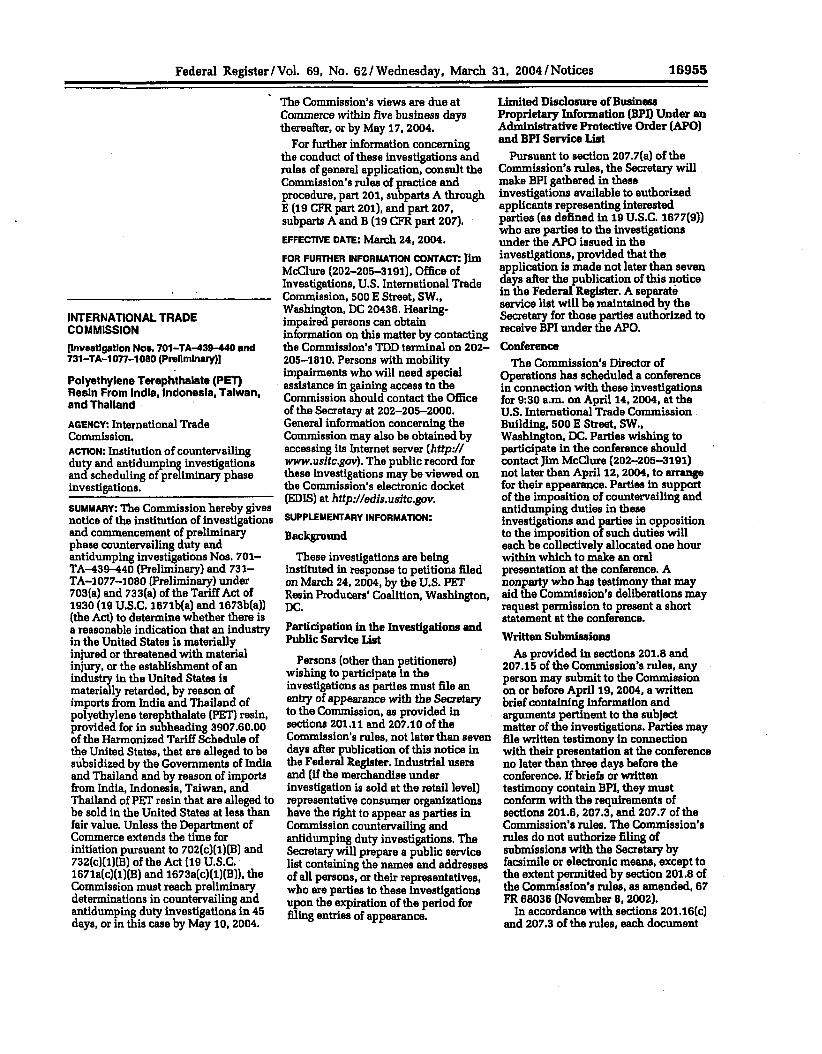
Federal RegisterlVol. 69, No. 62/ Wednesday, March 31, 2OO4INotices 16955
INTERNATIONAL TRADE COMMISSION flnvestigatlon Nos. 701-TA-434-440 and 731-TA-1077-1080 (Prellmlnary)]
Polyethylene Terephthalate (PET) Resln From India, Indonesla, Talwan, and Thalland
AGENCY: International Trade Commission. ACTION: Institution of countervaihg duty and antidump’ investigations and scheduling of pziminary phase investieations.
SUMMARY: The Commission hereby gives notice of the institution of investigations and commencement of preliminary phase countervailing duty and antidumping investigations Nos. 701- TA439-440 (Preliminary) and 731- TA-1077-1060 (Preliminary) under 703(a) and 733(a) of the Tariff Act of 1930 (19 U.S.C. 1671b(a) and 1673b(a)) (the Act) to determine whether there is a reasonable indication that an industry in the United States is materially injured or threatened with material injury, or the establishment of an industry in the United States is materially retarded, by reason of imports from India and Thailand of polyethylene terephthalate (PET) resin, provided for in subheading 3907.60.00 of the Harmonized Tariff Schedule of the United States, that are alleged to be subsidized by the Governments of India and Thailand and by reason of imports from India, Indonesia, Taiwan, and Thailand of PET resin that are alleged to be sold in the United States at less than fair value. Unless the Department of Commerce extends the time for initiation pursuant to 702(c)(l)[B) and 732(c)(l)(B) of the Act (39 U.S.C. 1671a(c)(l)(B) and 1673a(c)(l)(B)), the Commission must reach preliminary determinations in countervailing and antidumping duty investigations in 45 days, or in this case by May 10,2004.
The Commission’s views are due at Commerce within five business days thereafter, or by May 17,2004.
For further information concerning the conduct of these investigations and rules of general application, consult the Commission’s rules of practice and procedure, part 201, subparts A through E (19 CFR part 201)’ and part 207, subparts A and B (19 CFR part 207). EFFECTIVE DATE: March 24,2004.
McClure (202-205-3191), Office of Investigations, U.S. International Trade Commission, 500 E Street, SW., Washington, DC 20436. Hearing- impaired persons can obtain information on this matter by contacting the Commission’s TDD terminal on 202- 205-1810. Persons with mobility impairments who will need special assistance in gaining access to the Commission should contact the Office of the Secretary at 202-205-2000. General information concerning the Commission may also be obtained by accessing its Internet server (http:// www.usitc.gov). The public record for these investigations may be viewed on the Commission’s electronic docket (EDIS) at http://edis.usitc.gov.
Background
These investigations are being instituted in response to petitions filed on Mar& 24,2004, by the U.S. PE3 Resin Producers’ Coalition, Washington, DC. Participation in the Investigations and Public Service List
Persons (other than petitioners) wishing to participate in the investigations as parties must file an entry of appearance with &e Secretary to the Commission, as provided in sections 201.11 and 207.10 of the Commission’s rules, not later than seven days after publication of this notice in the Federal Register. Industrial users and (if the merchandise under investigation is sold at the retail level) representative consumer organizations have the right to appear as parties in Commission countervailing and antidumping duty investigations. The Secretary will prepare a public service list containing the names and addresses of all persons, or their representatives, who are parties to these investigations upon the expiration of the period for filing entries of appearance.
FOR FURTHER INFORMATION CONTACT: Jim
SUPPLEMENTARY INFORMATION:
Limited Disclosure of Business proprietary Information (BPI) Under an Administrative Protective Order (APO) and BPI Service List
Pursuant to section 207.7(a) of the Commission’s rules, the Secretary will make BPI gathered in these investigations available to authorized applicants representing interested parties (as defined in 19 U.S.C. 1677(9)) who are parties to the investigations under the APO issued in the investigations, provided that the application is made not later than seven days after the publication of this notice in the Federal Register. A separate service list will be maintained by the Secretary for those parties authorized to receive BPI under the APO. Conference
Operations has scheduled a conference in connection with these investigations for 9 3 0 a.m. on April 14,2004, at the U.S. International Trade Commission Building, 500 E Street, SW., Washington, DC. Parties wishing to participate in the conference should contact Jim McClure (202-205-3191) not later than April 12,2oorl,. to arraqp for their appearance. Parties in support of the imposition of countervailing and antidumping duties in these investigations and parties in opposition to the imposition of such duties will each be collectively allocated one hour within which to make an oral presentation at the conference. A
“*nP aid e Commission’s deliberations may request permission to present a short statement at the conference. Written Submbiom As provided in sections 201.8 and
207.15 of the Commission’s d e s . any person may submit to the Commission on or before April 19,2004, a written brief containing information and arguments pertinent to the subject matter of the investigations. Parties may file written testimony in connection with their presentation at the conference no later than three days before the conference. If briefs or written testimony contain BPI, they must conform with the requirements of sections 201.6,207.3, and 207.7 of the Commission’s rules. The Commission’s rules do not authorize filing of submissions with the Secretary by facsimile or electronic means, except to the extent permitted by section 201.8 of the Commission’s rules, as amended, 67 FR 68036 (November 8,2002).
In accordance with sections 201.16(c) and 207.3 of the rules, each document
The Commission’s Director of
‘
who has testimony that may
16956
filed by a party to the investigation must be served on all other parties to the investigation (as identified by either the public or BPI service list), and a certificate of service must be timely filed. The Secretary will not accept a document for filing without a certificate of service.
Authoritg: Them investigations are being conducted under authority of title Vn of the Tariff Act of 1930; this notice is published pursuant to section 207.12 of the Commission’s rultw.
By order of the Commission. baud: March 25,2004.
Marilyn R. Abbolt, Semtary to the commission. [FR Doc. 04-7152 Filed 3-30-04; 845 am1
Federal RegisterlVol. 69, No. 62 /Wednesday, March 31, 20041Notices
BILUNQ CODE 7020424
.

21082 Federal Register /Vol.’ 6 9 , No. 76/Tuesday, April 20, 2004 /Notices
DEPARTMENT OF COMMERCE
International Trade Administration (A-533-841, AJ60-817.A-583-840, Ab&- 8231
Notice of Initiation of Antidumping Duty 1nvestigations:Bottle-Grade Polyethylene Terephthalate (PET) Resin from India,lndonesia, Taiwan, and Thailand AGENCY: Import Administration, International TradeAdministration, Department of Commerce. ACTION: Initiation of Antidumping DutyInvestigations.
EFFECTIVE DATE: April 20,2004. FOR FURTHER INFORMATION CONTACT: Charles Riggle at (202) 482-0650 or Amber Musser at (202) 482-1777. AD/ CVD Enforcement Office 5. Group II, Import Administration, International Trade Administration. U.S. Department of Commerce, 14th Street and Constitution Avenue, NW. Washington, DC 20230. SUPPLEMENTARY INFORMATION:
Initiation of Investigations The Petition
On March 24,2004, the U.S. Department of Commerce (the Department) received a petition filed in proper form by the United States PET Resin Producers Coalition (the petitioner). The Department received supplemental information from the petitioner on April 5.2004.
In accordance with section 732(b)(1) of the Tariff Act of 1930, as amended (the Act), the petitioner alleges that imports of polyethylene terephthalate resin (bottle-grade PET resin) from India, Indonesia, Taiwan, and Thailand are, or are likely to be, sold in the United States at less than fair value within the meaning of section 731 of the Act, and that imports from India, Indonesia, Taiwan, and Thailand are materially injuring, or are threatening to materially injure, an industry in the United States.
The Department finds that the petitioner filed the petition on behalf of the domestic industry because it is an interested party as defined in section 771(9)(c) of the Act and it has demonstrated sufficient industry support with respect to each of the antidumping investigations that it is requesting the Department to initiate. See infra, “Determination of Industry Support for the Petition.” Periods of Investigation
The anticipated period of investigation (POI) for these
Federal Register / Vol. 69, No. 76 /Tuesday, April 20, 2004 /Notices 21083
investigations is January 1,2003, through December 31,2003. See section 351.204@~)(1) of the Department’s regulations (Antidumping Duties; Countervailing Duties; Final Rule, 62 FX 27296,27385 (May 19,1997)). Scope of Investigations
The merchandise covered by each of these investigations is bottle-grade polyethylene terephthalate (PET) resin, defined as having an intrinsic viscosity of at least 0.68 deciliters per gram but not more than 0.86 deciliters per gram. The scope includes bottle-grade PET resin that contains various additives introduced in the manufacturing process. The scope does not include post-consumer recycle (PCR) or post- industrial recycle (PIR) PET resin; however, included in the scope is any bottle-grade PET resin blend of virgin PET bottle-grade resin and recycled PET (RPET). Waste and scrap PET is outside the scope of the investigations. Fiber-grade PET resin, which has an intrinsic viscosity of less than 0.68 deciliters per gram, is also outside the sco e of the investigations.
&e merchandise subject to these investigations is properly classified under subheading 3907.60.0010 of the Harmonized Tariff Schedule of the United States (HTSUS); however, merchandise classified under HTSUS subheading 3907.60.0050 that otherwise meets the written description of the scope is also subject to these investigations. Although the HTSUS subheadings are provided for convenience and customs purposes, the written description of the merchandise under investigation is dispositive.
During our review of the petition, we discussed the scope with the petitioner to ensure that it is an accurate reflection of the products for which the domestic industry is seeking relief. As discussed in the preamble to the Department’s regulations (Antidumping Duties; Countervailing Duties; Final Rule, 62 FX 27296.27323 (May 19,1997)), we are setting aside a period for parties to raise issues regarding product coverage. The Department encourages all parties to submit such comments within 20 calendar days of publication of this notice. Comments should be addressed to Import Administration’s Central Records Unit, Room 1870, U.S. Department of Commerce, 14th Street and Constitution Avenue, NW, Washington, DC 20230. The period of scope consultations is intended to provide the Department with ample opportunity to consider all comments and consult with parties prior to the issuance of the preliminary determinations.
Determination of Industry Support for the Petition
Section 732@)(1) of the Act requires that a petition be filed on behalf of the domestic industry. Section 732(c)(4)(A) of the Act provides that the Department’s industry support determination, which is to be made before the initiation of the investigations, be based on whether a minimum percentage of the relevant industry supports the petition. A petition satisfies this requirement if the domestic producers or workers who support the petition account for (1) at least 25 percent of the total production of the domestic like product; and (2) more than 50 percent of the production of the domestic like product produced by that portion of the industry expressing support for, or opposition to, the petition. Moreover, section 732(c)(4)(D) of the Act provides that, if the petition does not establish support of domestic producers or workers accounting for more than 50 percent of the total production of the domestic like product, the Department shall either poll the industry or rely on other information in order to determine if there is support for the etition.
the “industry” as the producers of a domestic like product. Thus, to determine whether a petition has the requisite industry support, the statute directs the Department to look to producers and workers who produce the domestic like product. The U.S. International Trade Commission (ITC), which is responsible for determining whether “the domestic industry“ has been injured, must also determine what constitutes a domestic like product in order to define the industry. While both the Department and the ITC must apply the same statutory definition regarding the domestic like product (section 771(10) of the Act), they do so for different purposes and pursuant to separate and distinct authority. In addition, the Department’s determination is subject to limitations of time and information. Although this may result in different definitions of the like product, such differences do not render the decision of either agency contrary to law.’
domestic like product as “a product which is like, or in the absence of like,
Section 771(4)(A) of &e Act defines
Section 771(10) of the Act defines the
See USEC, Inc., v. United States. 132 F. Supp. Zd 1,8 (CIT 20011, citing Algoma Steel Cop. Ltd., v. United States, 688 F. Supp. 639,642-44 (CIT lQ88). See also High Information Content Flat Panel Displays and Display Glass from Japan: Final Determination; Rescission of Investigation and Partial Dismissal of Petition. 56 FR 32376.32380 81 O d V 16,19911.
most similar in characteristics and uses with, the article subject to an investigation under this title.” Thus, the reference point from which the domestic like product analysis begins is “the article subject to an investigation.” i.e., the class or kind of merchandise to be investigated, which normally will be the scope as defined in the petition. in this case, the petition covers a
single class or kind of merchandise, bottle-grade PET resin, as defined in the “Scope of Investigations” section above. The petitioner does not offer a definition of domestic like product distinct from the scope of the investigations. Further, based on our analysis of the information presented to the Department by the petitioner, we have determined that there is a single domestic like product, which is consistent with the definition of the “Scope of the Investigations” section above, and have analyzed industry support in terms of this domestic like product.
The Department has determined that the petitioner has established industry support representing over 50 percent of total production of the domestic like product. See Antidumping Duty Initiation Checklist: BottleGrade Polyethylene Terephthalate (PET) Resin from India, Indonesia, Taiwan, and Thailand (Initiation Checklist) (April 13, 2004), on file in the Central Records Unit, Room B-099 of the Department of Commerce. Thus, no polling of the domestic industry by the Department pursuant to section 732(c)(4)@) of the Act is required. In addition, the Department received no opposition to the petition from domestic producers of the like product. Therefore, the petitioner and domestic producers who support the petition account for at least 25 percent of the total production of the domestic like product, and the requirements of section 732(c)(4)(A)(i) of the Act are met. Furthermore, the petitioner and domestic producers who support the petition account for more than 50 percent of the production of the domestic like product produced by that portion of the industry expressing support for or opposition to the petition. Thus, the requirements of section 732(c)(4)(A)(ii) of the Act also are met.
Accordingly, we determine that the petition is filed on behalf of the domestic industry within the meaning of section 732(b)(1) of the Act. See Initiation Checklist at Attachment II. Export Price and Normal Value
The following are descriptions of the allegations of sales at less than fair value upon which the Department based its decision to initiate these investieations.
21084 Federal Register I Vol. 69, No. 76 I Tuesday, April 20, 2004 I Notices
The sources of data for the deductions and adjustments relating to U.S. and home market prices, and constructed value (CV), are discussed in greater detail in the Initiation Checklist. The petitioner stated it was unable to obtain information regarding specific sales or offers for sale of subject merchandise in Indonesia, Taiwan, and Thailand or in any third country. Therefore for these three countries, the petitioner based normal value (NV) on CV. See Petition at 17-18. Should the need arise to use any of this information as facts available under section 776 of the Act in our preliminary or final determinations, we may re-examine the information and revise the margin calculations, if appropriate. India
. Export Price The petitioner based export price (EP)
on average unit values (AUVs) of bottle- grade PET resin imports from India for the POI. The petitioner derived such values from import statistics under the HTSUS subheading 3907.60.0010. The petitioner did not make any adjustments to the AWs. Normal Value
With respect to NV, the petitioner calculated an average home market price for bottle-grade PET resin based on information obtained from Reliance Industries’ website. Reliance Industries’ price information was considered a reasonable surrogate for all Indian producers as it is India’s largest bottle- grade PET resin producer.
The petitioner calculated NV using a home market price quoted in Indian Rupees per kilogram and converted to U.S. cents per pound. NV was adjusted for export packing costs based on the assumption that export shipments to the United States were made in bulk containers. NV was not adjusted for home market packing costs, as it was assumed that home market shipments were made in bulk in an unpacked condition. In addition, NV was not adjusted for home market freight costs, as it was assumed that the published selling prices on Reliance Industries web page are ex-factory. See Initiation Checklist for details.
The estimated dumping margin for subject merchandise from India, based on a comparison of EP and NV based on the average home market price described above, is 35.51 percent. Indonesia Export Price
bottlegrade PET resin imports from The petitioner based E€’ on A W s of
Indonesia for the POI. The petitioner derived such values &om import statistics under the HTSUS subheading 3907.60.0010. The petitioner did not make any adjustments to the AWs. Normal Value
Pursuant to sections 773(a)(4), 773(b) and 773(e) of the Act, the petitioner based NV for sales in Indonesia on CV. The petitioner calculated CV using the same cost of manufacture (COM), selling, general and administrative (SG&A) and interest expense figures used to compute the cost of production (COP).
Accordine to section 7731133[33 of the . .. - Act, COP ctnsists of COM. SG&A expenses, financial expenses, and packing expenses. The petitioner calculated COM based on its own production experience, adjusted for known differences between costs incurred to produce bottle-grade PET resin in the United States and Indonesia using publicly available data. To calculate SG&A and interest, the petitioner relied upon amounts reported by an Indonesian PET resin producer in its 2001 financial statements, which were the most recent available. The petitioner did not include packing costs, as it was assumed that most home market shipments are made in bulk in an unpacked condition.
Consistent with section 773(e)(2) of the Act, the petitioner included in CV an amount for profit. For profit, the petitioner relied upon amounts reported by the same Indonesian bottle-grade PET resin producer in its 2001 financial statements. In addition, the petitioner added export packing costs to CV.
The estimated dumping margin for subject merchandise from Indonesia, based on a comparison of EP and NV based on CV, is 27.61 percent. Taiwan Export Price
bottle-grade PET resin imports from Taiwan for the POI. The petitioner derived such values from import statistics under the HTSUS subheading 3907.60.0010. The petitioner did not make any adjustments to the A W s . Normal Value
and 773(e) of the Act, the petitioner based NV for sales in Taiwan on CV. The petitioner calculated CV using the same COM, SG&A and interest expense figures used to compute the COP.
According to section 773(b)(3) of the Act, COP consists of COM, SG&A expenses, financial expenses, and packing expenses. The petitioner
The petitioner based EP on A W s of
Pursuant to sections 773(a)(4). 773(b)
calculated COM based on its own production experience, adjusted for known differences between costs incurred to produce bottlegrade PET resin in the United States and Taiwan using publicly available data. To calculate SG&A and interest, the petitioner relied upon amounts reported by a Taiwanese PET resin producer in its 2002 financial statements. The petitioner did not include packing costs, as it was assumed that most home market shipments are made in bulk in an unpacked condition.
Consistent with section 773(e)(2) of the Act, the petitioner included in CV an amount for profit. For profit, the petitioner relied upon amounts reported by the same Taiwanese PET resin producer in its 2002 financial statements. In addition, the petitioner added export packing costs to CV.
The estimated dumping margin for subject merchandise from Taiwan, based on a comparison of EP and NV based on CV, is 37.35 percent. Thailand Export Price
bottlegrade PET resin imports from Thailand for the POI. The petitioner derived such values from import statistics under the HTSUS subheading 3907.60.0010. The petitioner did not make any adjustments to the A W s . Normal Value
and 773(e) of the Act, the petitioner based NV for sales in Thailand on CV. The petitioner calculated CV using the same COM, SG&A and interest expense figures used to compute the COP.
According to section 773(b)(3) of the Act, COP consists of COM, SG&A expenses, financial expenses, and packing expenses. The petitioner calculated COM based on its own production experience, adjusted for known differences between costs incurred to produce bottle-grade PET resin in the United States and Thailand using publicly available data. To calculate SG&A and interest, the petitioner relied upon amounts reported in an Indian PET resin producer’s 2003 financial statements. We revised the petitioner’s S G U and financial expense rates calculation by using average SG&A and financial expense rates from the financial statements for two companies located in Thailand which are involved in industry sectors comparable to the bottlegrade PET resin industry. The SG&A and financial expense ratios were based on the financial statements of these two companies that were provided
The petitioner based EP on A W s of
Pursuant to sections 773(a)(4). 773(b)
Federal Register / Vol. 69, No. 76 / Tuesday, April 20, 2004 /Notices 21085
by the petitioner as an alternative to using the Indian company’s financial statements. The petitioner did not include packing costs, as it was assumed that most home market shipments are made in bulk in an unpacked condition. See Initiation Checklist at Attachment V for details.
Consistent with section 773(e)(2) of the Act, the petitioner included in CV an amount for profit. For profit, the petitioner relied upon amounts reported in an Indian PET resin producer’s 2003 financial statements. We revised the petitioner’s CV profit rate calculation by using an average profit rate from the financial statements of two companies located in Thailand which are involved in industry sectors comparable to the bottle-grade PET resin industry. The financial statements of the two Thai companies were provided by the petitioner as an alternative to using the Indian company’s financial statements. In addition, the petitioner added export packing costs to CV. See Initiation Checklist at Attachment V for details.
The estimated dumping margin for subject merchandise from Thailand, based on a comparison of EP and NV based on CV, is 41.28 percent. Fair Value Comparisons
Based on the data provided by the petitioner, there is reason to believe that imports of bottle-grade PET resin from India, Indonesia, Taiwan, and Thailand are being, or are likely to be, sold at less than fair value. Critical Circumstances
claims that, following the initiation of this case, there is a reasonable basis to believe or suspect that critical circumstances will exist with regard to imports of bottle-grade PET resin fiom India, Indonesia, Taiwan, and Thailand.
Section 733(e)(1) of the Act states that, if a petitioner alleges critical circumstances, the Department will find that such circumstances exist, at any time after the date of initiation, when there is a reasonable basis to believe or suspect that, under subparagraph (A)(i), there is a history of dumping and material injury by reason of dumped imports in the United States or elsewhere of the subject merchandise, or (ii) the person by whom, or for whose account, the merchandise was imported knew or should have known that the exporter was selling the subject merchandise at less than its fair value and that there was likely to be material injury by reason of such sales, and, under subparagraph (B), there have been massive imports of the subject merchandise over a relatively short
In its submission, the petitioner
period. Section 351.206(h) of the Department’s regulations defines “massive imports” as imports that have increased by at least 15 percent over the imports during an immediately preceding period of comparable duration. Section 351.206(i) of the regulations states that “relatively short period” will normally be defined as the period beginning on the date the proceeding begins and ending at least three months later. To date, the petitioner has not demonstrated that the requirement of “massive imports . . . over a relatively short period” has been met.
The petitioner alleges that importers knew, or should have known, that b o t t l q a d e PET resin was being sold at less than its fair value. Specifically, the petitioner alleges margins, as adjusted by the Department, of between 27.61 and 41.28 percent, a level high enough to impute importer knowledge that merchandise was being sold at less than its fair value. Additionally, the petitioner references the European Council Regulation (EC) No. 2604/2000 of 27 November 2000, which imposes a definitive antidumping duty and collects definitively the provisional duty imposed on imports of b o t t l e grade PET resin from India, Indonesia, Malaysia, the Republic of Korea, Taiwan, and Thailand, to establish a history of dumping.
to section 732(e) of the Act, the Department request U.S. Customs and Border Protection (CBP) to compile information on an expedited basis regarding entries of subject merchandise. We note that section 732(e) of the Act states that when there is a reasonable basis to believe or suspect (1) there is a history of dumping in the United States or elsewhere of the subject merchandise, or (2) the person by whom, or for whose account, the merchandise was imported knew, or should have known, that the exporter was selling the subject merchandise at less than its fair value, the Department may request the Commissioner of Customs to compile information on an expedited basis regarding entries of the subject merchandise.
met the criteria for a finding of critical circumstances. Therefore, at this time, we have no reasonable basis to believe or suspect that critical circumstances exist. However, the petitioner can resubmit its request for a finding of critical circumstances and, i f the criteria for such a finding are met, we will issue a critical circumstances finding at the earliest possible date. See Policy Bulletin 98/4,63 FR 55364 (October 15,
The petitioner requests that, pursuant
As noted above, the petitioner has not
1998) (determination of critical circumstances may be made any time after initiation). In addition, we are considering the petitioner’s request to obtain information from CBP for monitoring purposes, and will inform interested parties of our determination as soon as practicable.
Allegations and Evidence of Material Injury and Causation
The petitioner alleges that the U.S. industry producing the domestic like product is being materially injured, or is threatened with material injury. by reason of the cumulated imports from India, Indonesia, Taiwan, and Thailand of the subject merchandise sold at less than NV.
The petitioner contends that the industry’s injured condition is evident in lost sales and customers, in the declining trends in prices, profits, and domestic market share, and in its reduced ability to reinvest and pursue research and development activities. The allegations of injury and causation are supported by relevant evidence including U.S. import data, affidavits supporting claims of lost sales and declining revenues, and pricing information. The petitioner also alleges the imminent threat of further material injury based on the likely increases in foreign production volume of bottle- grade PET resin, the likelihood of substantially increased imports, and the prices of these imports having the likely effect of depressing or suppressing domestic prices.
The Department has assessed the allegations and supporting evidence regarding material injury, causation, and threat of material injury, and has determined that these allegations are properly supported by accurate and adequate evidence and meet the statutory requirements for initiation. See the Initiation Checklist at Attachment N. Initiation of Antidumping Investigations
Based upon our examination of the petition, we have found that it meets the requirements of section 732 of the Act. See the Initiation Checklist. Therefore, we are initiating antidumping duty investigations to determine whether imports of bottle-grade PET resin from India, Indonesia, Taiwan, and Thailand are being, or are likely to be, sold in the United States at less than fair value. Unless this deadline is extended, we will make our preliminary determinations no later than 140 days after the date of these initiations.
21086 Federal Register I Vol. 69, No. 76 I Tuesday, April 20, 2004 /Notices
Distribution of Copies of the Petition
732(b)(3)(A) of the Act, a copy of the public version of the petition has been provided to the representatives of the governments of India, Indonesia. Taiwan, and Thailand. We will attempt to provide a copy of the public version of the petition to each exporter named in the petition, as provided for under 19 CFR 351.203(~)(2). ITC Notification
initiations as required by section 732(d) of the Act. Preliminary Determinations by the ITC
The ITC will determine no later than May 10. 2004, whether there is a reasonable indication that imports of bottle-grade PET resin from India, Indonesia, Taiwan, and Thailand are causing material injury, or threatening to cause material injury, to a U.S. industry. A negative ITC determination for any country will result in the investigation being terminated with respect to that country; otherwise, these investigations will proceed according to statutory and regulatory time limits. This notice is issued and published pursuant to section 777(i) of the Act.
Jeffrey May,
In accordance with section
We have notified the ITC of our
Dated April 13,2004.
Acting Assistant Secretary for Import Administrution. [FX Doc. 04-8938 Filed 4-19-04; 8:45 am1 BILUNG CODE 351-
DEPARTMENT OF COMMERCE
International Trade Administration
Notice of hitiation of Countervailing Duty Investigations: Bottle-Grade Polyethylene Terephthalate (PET) Resin from India ((2-533-842) and Thailand (C-549-824)
AGENCY: Import Administration, International Trade Administration, Department of Commerce. EFFECTIVE DATE: April 20, 2004. FOR FURTHER INFORMATION CONTACT: Douglas Kirby (India) or Christian Hughes (Thailand) at (202) 482-3782 or (202) 482-0190 respectively, Office of AD/CVD Enforcement VII, Import Administration, International Trade Administration, U.S. Department of Commerce, 14th Street and Constitution Avenue, NW., Washington, DC 20230.
SUPPLEMENTARY INFORMATION:
Initiation of Investigations The Petition On March 24,2004, the US.
Department of Commerce (the Department) received a countervailing duty petition filed in proper form by the United States PET Resin Producers Coalition (“Petitioner”). The Department received supplemental information to the petition from the petitioner on April 5,2004. In accordance with section 702(b)(l) of the Tariff Act of 1930, as amended (the Act), petitioner alleges that producers or exporters of bottle- grade PET resin in India and Thailand receive countervailable subsidies within the meaning of section 701 of the Act, and that imports from India and Thailand are materially injuring, or are threatening material injury to, an
in the United States. indusY3 The epartment finds that the petitioner filed the petition on behalf of the domestic industry because it is an interested party as defined in section 771(9)(C) of the Act and it has demonstrated sufficient industry support with respect to the countervailing duty investigations that it is requesting the Department to initiate. See infra, “Determination of Industry Support for the Petition.” Period of Investigation
The anticipated period of investigation (POI) for both investigations is January 1,2003 through December 31,2003. See section 351.204(%)(2) of the Department’s regulations (Antidumping Duties; Countervailing Duties; Final Rule, 62 FR 27296,27385 (May 19.1997)). Scope of Investigations
The merchandise covered by each of these investigations is bottle-grade polyethylene terephthalate (PET) resin, defined as having an intrinsic viscosity of at least 0.68 deciliters per gram but not more than 0.86 deciliters per gram. The scope includes bottle-grade PET resin that contains various additives introduced in the manufacturing process. The scope does not include post-consumer recycle (PCR) or post- industrial recycle (PIR) PET resin; however, included in the scope is any bottle-grade PET resin blend of virgin PET bottle-grade resin and recycled PET (WET). Waste and scrap PET is outside the scope of the investigations. Fiber-grade PET resin, which has an intrinsic viscosity of less than 0.68 deciliters per gram, is also outside the sco e of the investigations.
‘&e merchandise subject to these investigations is properly classified under subheading 3907.60.0010 of the
Harmonized Tariff Schedule of the United States (HTSUS); however, merchandise classified under HTSUS subheading 3907.60.0050 that otherwise meets the written description of the scope is also subject to these investigations. Although the HTSUS subheadings are provided for convenience and customs purposes, the written description of the merchandise under investigation is dispositive.
During our review of the petition, we discussed the scope with the petitioner to ensure that it is an accurate reflection of the products for which the domestic industry is seeking relief. As discussed in the preamble to the Department’s regulations (Antidumping Duties; Countervailing Duties; Final Rule, 62 FR 27296,27323 (May 19,1997)), we are setting aside a period for parties to raise issues regarding product coverage. The Department encourages all parties to submit such comments within 20 calendar days of publication of this notice. Comments should be addressed to Import Administration’s Central Records Unit, Room 1870, U.S. Department of Commerce, 14th Street and Constitution Avenue, NW. Washington, DC 20230. The period of scope consultations is intended to provide the Department with ample opportunity to consider all comments and consult with parties prior to the issuance of the preliminary determinations. Consultations
Agreement on Subsidies and Countervailing Measures and section 702(%)(4)(A)(ii) of the Act, we held separate consultations regarding this petition with the Government of India (“GO,”) and the Government of Thailand on April 7,2004. See Memomndum to the File from Douglas Kirby: Consultations with the Government of India Regarding the Countervailing Duty Petition on PET Resin. dated April 9, 2004; see also Memomndum to the Filefrom Christian Hughes: Consultations with the Government of Thailand Regarding the Countervailing Duty Petition on PET Resin, dated April 8,2004. Following consultations, the GO1 provided information to support its statements at consultations regarding several of the GO1 programs alleged by the petitioner. This information was placed in the record and provided to petitioner. See Memomndum to the File from Dana Mermelstein, “Petition for the Imposition of Countervailing Duties on Bottle-Grade Polyethylene Terephthalate (PET) Resin fiom India: Information Submitted by the
In accordance with Article 13.1 of the

Federal Registi
Government of India,” April 12,2004, on file in the Import Administration Central Records Unit , Room B-099 of the Department of Commerce Building. The Department’s consideration of this information is fully discussed in the Countervailing Duty Investigation Initiation Checklist: Bottle-Grade Polyethylene Terephthalate (PET) Resin from India (April 13,2004) (India CVD Initiation Checklist). Determination of Industry Support for the Petition
Section 702(b)(l) of the Act requires that a petition be filed on behalf of the domestic industry. Section 702(c)(4)(A) of the Act provides that the Department’s industry support determination, which is to be made before the initiation of the investigations, be based on whether a minimum percentage of the relevant industry supports the petition. A petition satisfies this requirement if the domestic producers or workers who support the petition account for (1) at least 25 percent of the total production of the domestic like product: and (2) more than 50 percent of the production of the domestic like product produced by that portion of the industry expressing support for, or opposition to, the petition. Moreover, section 702(c)(4)(D) of the Act provides that, i f the petition does not establish support of domestic producers or workers accounting for more than 50 percent of the total production of the domestic like product, the Department shall either poll the industry or rely on other information in order to determine if there is support for the petition.
the “industry” as the producers of a domestic like product. Thus, to determine whether a petition has the requisite industry support, the statute directs the Department to look to producers and workers who produce the domestic like product. The U.S. International Trade Commission (ITC), which is responsible for determining whether “the domestic industry” has been injured, must also determine what constitutes a domestic like product in order to define the industry. While both the Department and the ITC must apply the same statutory definition regarding the domestic like product (section 771(10) of the Act), they do so for different purposes and pursuant to separate and distinct authority. In addition, the Department’s determination is subject to limitations of time and information. Although this may result in different definitions of the like product, such differences do not
Section 771(4)(A) of the Act defines
?r/VoI. 69, No. 76/Tuesday, April 20
render the decision of either agency contrary to the law.’
domestic like product as “a product which is like, or in the absence of like, most similar in characteristics and uses with, the article subject to an investigation under this title.” Thus, the reference point from which the domestic like product analysis begins is “the article subject to an investigation.” i.e., the class or kind of merchandise to be investigated, which normally will be the scope as defined in the petition.
In this case, the petition covers a single class or kind of merchandise, bottlegrade PET resin, as defined in the “Scope of Investigations” section, above. The petitioner does not offer a definition of domestic like product distinct from the scope of the investigations. Further, based on our analysis of the information presented to the Department by the petitioner, we have determined that there is a single domestic like product, also bottlegrade PET resin, which is consistent with the definition in the “Scope of Investigations” section above and have analyzed industry support in terms of this domestic like product.
The Department has determined that the petitioner has established industry support representing over 50 percent of total production of the domestic like product. See India CVD Initiation Checklist; see also Countervailing Duty Investigation Initiation Checklist: Bottle-Grade Polyethylene Terephthalate (PET] Resin from Thailand (Thailand CVD Initiation Checklist] (April 13,2004). Thus, no polling of the domestic industry by the Department pursuant to section 702(c)(4)(D) of the Act is required. In addition, the Department received no opposition to the petition from domestic producers of the like product. Therefore, the petitioner and the domestic producers who support the petition account for at least 25 percent of the total production of the domestic like product, and the requirements of section 702(~)(4)(A)(i) of the Act are met. Furthermore, the petitioner and the domestic producers who support the petition account for more than 50 percent of the production of the domestic like product produced by that portion of the industry expressing support for or opposition to the petition.
Section 771(10) of the Act defines the
See USEC, hc., v. United States. 132 F. Supp. 2d 1.8 (CIT 2001). citing Algoma Steel Cop. Ltd., v. United States, 688 F. Supp. 638,64244 (UT 1988). See also High Information Content Flat Panel Displays and Display Glass from Japan: Final Determination; Rescission of Investigation and Partial Dismissal af Petition, 56 FR 32376,32380- 81 Duly 16. legl).
I , 2004 /Notices 21087
Thus, the requirements of section 702(c)(4)(A)(ii) of the Act also are met.
Accordingly, we determine that the petition is filed on behalf of the domestic industry within the meaning of section 702(b)(l) of the Act. See India CVD Initiation Checklist at Attachment 11; see also Thailand CVD Initiation Checklist, at Attachment II, on file in the Central Records Unit, Room B-099 of the Department of Commerce. Injury Test
Both India and Thailand are “Subsidies Agreement Countries” within the meaning of section 701(b) of the Act. Therefore, section 70l(a)(2) applies to each investigation. Accordingly, the ITC must determine whether imports of the subject merchandise from India and Thailand are materially injuring, or are threatening material injury to, an industry in the United States. Allegations o f Subsidies
Section 702(b) of the Act requires the Department to initiate a countervailing duty proceeding whenever an interested party files a petition, on behalf of an industry, that; (1) alleges the elements necessary for an imposition of a duty under section 701(a), and (2) is accompanied by information reasonably available to petitioner supporting the allegations. India
We are initiating an investigation of the following programs alleged in the petition to have provided countervailable subsidies to manufacturers, producers and exporters of the subject merchandise in India (a full description of each program is provided in the India CVD Initiation ehecklist):
1. The Duty Entitlement Passbook Scheme (DEPS)/ Post-Export Credits
2. PreShipment and Post-Shipment Export Financing
Scheme (EPCGS)
(Sections 10A, IOB, and 80 HHC)
Interest Taxes
Oriented Units Program
(MDA)
3. Export Promotion Capital Goods
4. Income Tax Exemption Scheme
5. Exemption of Export Credit from
6. Export Processing Zones/Export-
7. Market Development Assistance
8. Status Certificate Program 9. Loan Guarantees from the GO1 10. State of Maharashtra Program:
Industrial Policy 2001 11. State of Gujurat Program: Sales-
Tax Incentive Scheme 12. State of West Bengal Program:
New Economic Policy on Industrial Development

21088 Federal Register / Vol. 69, No. 76 / Tuesday, April 20, 2004 / Notices
Thailand We are initiating an investigation of
the following programs alleged in the petition to have provided countervailable subsidies to manufacturers, producers and exporters of the subject merchandise in Thailand (a full description of each program is provided in the Thailand CVD Initiation Checklist):
1. Section 28 of the Investment Promotion Act: Exemption from Payment of Import Duties on Machinery
2. Section 30 of the Investment Promotion Act: Reduction of Import Duties on Raw or Essential Materials
3. Section 31 of the Investment Promotion Act: Income Tax Exemptions
4. Section 35 of the Investment Promotion Act: Special Rights and Benefits Granted to Promoted Activities Located in Investment Promotion Zones Critical Circumstances Allegation
In the petition, the petitioner claims that, following the initiation of these countervailing duty investigations, there is a reasonable basis to believe or suspect that critical circumstances will exist with regard to imports of bottle- grade PET resin from India and Thailand.
Section 703(e)(l) of the Act states that, if a petitioner alleges critical circumstances, the Department will find that such critical circumstances exist, at any time after the date of initiation, when there is a reasonable basis to believe or suspect that, under paragraph (A), the alleged countervailable subsidies are inconsistent with the Subsidies Agreement, and that, under paragraph (B), there have been massive imports of the subject merchandise over a relatively short period of time. Section 351.206(h) of the Department’s regulations defines “massive imports” as imports that have increased by at least by 15 percent over the imports during an immediately preceding period of comparable duration. Section 351.206(i) of the regulations states that the “relatively short period” will normally be defined as the period beginning on the date the proceeding begins and ending at least three months later. To date, the petitioner has not demonstrated that the requirement of “massive imports . . . over a relatively short period” has been met.
to section 702(e) of the Act, the Department request U.S. Customs and Border Protection (CBP) to compile information on an expedited basis regarding entries of subject merchandise. We note that section 702(e) of the Act states that if, at any
The petitioner requests that, pursuant
time after initiation, there is a reasonable basis to believe or suspect that the alleged countervailable subsidies are inconsistent with the Subsidies Agreement, the Department may request the Commissioner of Customs to compile such information on an expedited basis. The petitioner alleges that certain programs listed in the petition with respect to both India and Thailand constitute export subsidies, which would be inconsistent with the Subsidies Agreement.
As noted above, the petitioner has not met the criteria for a finding of critical circumstances. Therefore, at this time, we have no reasonable basis to believe or suspect that critical circumstances exist. However, the petitioner can resubmit its request for a finding of critical circumstances and, i f the criteria for such a finding are met, we will issue a critical circumstances finding at the earliest possible date. See Policy Bulletin 98/4, 63 FR 55364 (October 15, 1998) (determination of critical circumstances may be made any time after initiation). In addition. we are considering the petitioner’s request to obtain information from CBP for monitoring purposes, and will inform interested parties of our determination as soon as practicable. Allegations and Evidence of Material Injury and Causation
The petitioner alleges that the US. industry producing the domestic like product is being materially injured, or is threatened with material injury, by reason of subsidized imports from India and Thailand of the subject merchandise.
The petitioner contends that the industry’s injured condition is evident in lost sales and customers, in the declining trends in prices, profits, and domestic market share, and in its reduced ability to reinvest and pursue research and development activities. The allegations of injury and causation are supported by relevant evidence including U.S. import data, affidavits supporting claims of lost sales and declining revenues, and pricing information. The petitioner also alleges the imminent threat of further material injury based on the likely increases in foreign production volume of bottle- grade PET resin, the likelihood of substantially increased imports, and the prices of these imports having the likely effect of depressing or suppressing domestic prices.
The Department has assessed the allegations and supporting evidence regarding material injury and causation and threat of material injury, and has determined that these allegations are
properly supported by accurate and adequate evidence and meet the statutory requirements for initiation. See India CVD Initiation Checklist; see also Thailand CVD Initiation Checklist. Initiation o f Countervailing Duty Investigations
petition on bottle-grade PET resin, and petitioner’s responses to our requests for supplemental information clarifying the petition, we have found that the petition meets the requirements of section 702(b) of the Act. Therefore, in accordance with section 702(b) of the Act, we are initiating two countewailing duty investigations to determine whether manufacturers, producers, or exporters of bottle-grade PET resin from India and from Thailand receive countervailable subsidies. Unless the deadline is extended, we will make our preliminary determinations no later than 65 days after the date of this initiation.
Distribution of Copies of the Petition
702(b)(3)(A) of the Act, a copy of the public version of each petition has been provided to the representatives of the governments of India and Thailand. We will attempt to provide a copy of the public version of the petition to each known exporter as provided for under 19 CFR 351.203(~)(2).
ITC Notification
initiations, as required by section 702(d) of the Act. Preliminary Determination by the ITC
The ITC will determine no later than May 10, 2004, whether there is a reasonable indication that imports of bottle-grade PET resin from India and Thailand are materially injuring, or threatening material injury to, a U.S. industry. A negative ITC determination will result in these investigations being terminated; otherwise, these investigations will proceed according to statutory and regulatory time limits. This notice is issued and published pursuant to section 777(i) of the Act.
J e h y May, Acting Assistant Secretary for Import Administration. [FR Doc. 04-8937 Filed P14-04; 8:45 am]
Based on our examination of the
In accordance with section
We have notified the ITC of our
Dated A p d 13,2004.
BlLuNa CODE 351O-US-S
APPENDIX B
CONFERENCE WITNESSES
B- 1

CALENDAR OF THE PUBLIC CONFERENCE
Those listed below appeared as witnesses at the United States International Trade Commission’s conference:
Subject: Polyethylene terephthalate (PET) resin from India, Indonesia, Taiwan, and Thailand
Invs Nos: 701-TA-439-440 and 73 1-TA-1077-1080 (Preliminary)
Date and Time: April 14,2004 - 9:30 a.m.
The conference in connection with these investigations was held in the Main Hearing Room, 500 E Street, SW, Washington, DC.
In Support of the Imposition of Countervailing and Antidumping Duties:
Howery, Simon Arnold and White Washington, DC
on behalf of
The U.S. PET Resin Producers’ Coalition
Ricky Lane, DAK Americas LLC Chris Petersen, Assistant Section Manager, Nan Ya Plastics Corp. America Mike Dewsbury, Vice President, PET Resins, Wellman, Inc. Robert Taylor, Business Operations Manager, PET Resins, Wellman, Inc. Hans Kinner, Business Director, Polyester Products North America, Voridian Division
Mark Adlam, Americas Commercial Manager, M&G Polymers USA LLC Susan H. Manning, Ph.D., CapAnalysis LLC
of Eastman Chemical Co.
Michael A. Hertzberg ) Juliana M. Cofrancesco ) - OF COUNSEL David B. Weinberg )
B-3
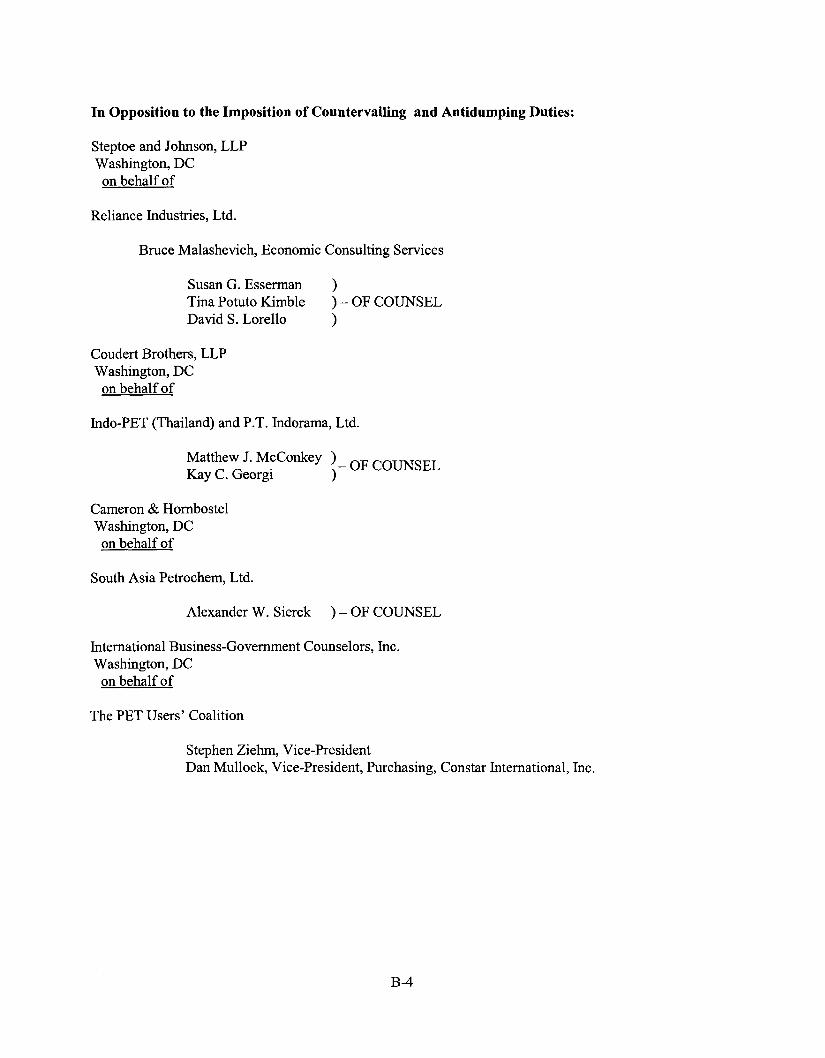
In Opposition to the Imposition of Countervailing and Antidumping Duties:
Steptoe and Johnson, LLP Washington, DC on behalf of
Reliance Industries, Ltd.
Bruce Malashevich, Economic Consulting Services
Susan G. Esserman ) Tina Potuto Kimble David S. Lorello )
) - OF COUNSEL
Coudert Brothers, LLP Washington, DC on behalf of
Indo-PET (Thailand) and P.T. Indorama, Ltd.
- OF COUNSEL Matthew J. McConkey ) Kay C. Georgi )
Cameron & Hornbostel Washington, DC on behalf of
South Asia Petrochem, Ltd.
Alexander W. Sierck ) - OF COUNSEL
International Business-Government Counselors, Inc. Washington, DC
on behalf of
The PET Users’ Coalition
Stephen Ziehm, Vice-president Dan Mullock, Vice-president, Purchasing, Constar International, Inc.
B-4
APPENDIX C
SUMMARY DATA
c- 1
Table C-I PET resin: Summary data concerning the U.S. market, 2001-03
(Quantity= 7,000 pounds; value= 7,000 dollars; unit values, unit labor costs, and unit expenses are per pound; and period changes=percent, except where noted)
I Calendar yea
Item 2001 U.S. consumption quantity:
Amount 3,955,822 Producers’ share‘ 84.1 Importers’ share:’
*** India
2002
4,412,087 84.5
***
r - 2003 1 2001-2W:
4,878,130 I
80.9 I -3.2
*** I ***
eriod changes
*** ***
Producers’ share
I Other sources I 10.9 I 10.0 I 9.2 I -1.7 I -0.9 I -0.8 I Total I 15.4 I 16.2 I 18.6 I 3.2 I 0.9 I 2.3 U.S. imports from--
100.4 25.6 59.5 Quantity
92.5 -2.1 96.7 Value
-3.9 -22.1 23.3 Unit value
Ending inventory 3,907 3,089 25,276 546.9 -20.9 718.2
India: *** *** *** *** *** ***
*** *** ***
Indonesia: Quantity
Value
Unit value
26.8 24.4 2.0 21.9 11.5 9.3 -3.9 -10.4 7.2
Ending inventory 1,436 5,641 2,297 60.0 292.8 -59.3
*** *** *** *** *** *** *t* *** ***
Taiwan: Quantity 3,555 10,545 64,467 1713.2 196.6 51 1.3 Value 1,711 4,406 30,054 1656.9 157.6 582.1 Unit value $0.48 $0.42 $0.47 -3.1 -13.2 11.6 Ending inventory 375 396 1,989 430.4 5.6 402.3
Thailand: Quantity
Value
Unit value
232.5 105.8 61.6 190.8 71.5 69.5 -12.6 -16.7 4.9
*** **t *** *** *** *** *** *** ***
I Ending inventory I 4,468 I 7,080 I 10,467 I 134.3 I 58.5 I 47.8 1 Table continued on next page. I
c-3

(Quantity= 1,000 pounds; value=1,000 dollars; unit values, unit labor costs, and unit expenses are per pound; and period changes=percent, except where noted)
Item
Subtotal: Quantity
Value
Unit value
I Calendar year I Period changes I 2001 2002 2003 2001-2003 2001-2002 2002-2003
197,863 312,512 497,616 151.5 57.9 59.2
90,818 121,695 214,222 135.9 34.0 76.0
$0.46 $0.39 $0.43 -6.2 -15.2 10.6
U.S. producers’-- Capacity quantity
Production quantity Capacity utilization’
U S . shipments: Quantity
Value
I Ending inventory I 10,186 I 16,206 I 40,028 I 293.0 I 59.1 I 147.01
5.034,335
41 07,153
81.6
3,327,414
1.712.378
Other sources:
5,597,045
I 4,696,264
83.9
11.2 -0.4 11.6
14.3 7.6 6.3
2.3 6.5 -4.2
Unit value I $0.51
Productivity (pounds per hour)
Export shipments: Quantity
1033.7 I 1083.4 I 1145.4 I 10.8 I 4.8 I 5.7
1 763,757
5,016,061
4,417.262
88.1
3,726,331
1,623,513
$0.44
629,162
3,945,942
1,848,825
$0.47 -1 5.3
732,926 -4.0 -17.6 16.5
I Value I 347,701 I 257,996 I 328,345 I -5.6 I -25.8 I 27.3 I
I Table continued on next page.
c-4
Item
Calendar year Period changes
2001 I 2002 I 2003 2001-2003 I 2001-2002 I 2002-2003
8.2 I I $0.48 I $0.43 I $0.46 I -4.3 I -11.6 I I Unit value
~
Net sales: Quantity
Value
I COGS I 1,720,721 I 1,624,454 I 2,025,045 I 17.7 I -5.6 I 24.7 I
~ ~~
4,218,525 4,451,565 4,858,365 15.2 5.5 9.1
2.032.672 1.896.065 2.239.897 10.2 -6.7 18.1
I Gross profit or (loss) I 311,951 I 271,611 I 214,852 I -31.1 I -12.9 I -20.91
I SG&A expenses I 147,994 I 130,782 I 142,194 I -3.9 I -11.6 I 8.7 I
Note.-Because of rounding, figures may not add to the totals shown.
, Source: Compiled from data submitted in response to Commission questionnaires and from official Commerce statistics. I
c-5
Source
Calendar year
2001 2002 2003
Thailand I 60,626 I 133,266 I 233,943 I
India 15,978
Indonesia 110,512
Taiwan 4,373
I Subtotal I 191,488 I 365,344 I 521,460 I
35,283 79,213
185,553 143,707
1 1,242 64,597
I All other sources I 619,521 I 629,834 I 715,980 I
India
Indonesia
Taiwan
Thailand
r Total I 81 1,010 I 995,178 I 1,237,440 I
7,768 13,164 36,207
50,229 71,052 61,874
2,226 4,739 30,143
29,398 53,200 98,532
India $0.49 $0.37 $0.46
1 Indonesia 0.45 0.38 0.43
Taiwan 0.51 0.42 0.47
Thailand 0.48 0.40 0.42
, Subtotal 0.47 0.39 0.43
All other sources 0.51 0.49 0.48
Total 0.50 0.45 0.46
Share of quantity (percent)
Subtotal I 89,620 I 142,155 I 226,757
~ ~ ~
Indonesia 13.6 18.6 11.6
All other sources I 315,426 I 307,331 I 344,443
Taiwan
Thailand
Subtotal
All other sources
Total
Total I 405,046 I 449,486 I 571,201
0.5 1 .I 5.2
7.5 13.4 18.9
23.6 36.7 42.1
76.4 63.3 57.9
100.0 100.0 100.0
I Unit value (perpound) I
India I 2.0 I 3.5 I 6.4 I
Table continued on next page.
C-6

Source
Calendar year
2001 2002 2003
India
Indonesia
’ Landed, duty-paid.
Note.-Because of rounding, figures may not add to the totals shown.
Source: Compiled from official Commerce statistics (HTS numbers 3907.60.0010 and 3907.60.0050).
1.9 2.9 6.3
12.4 15.8 10.8
c-7
Taiwan
Thailand
Subtotal
All other sources
Total
0.6 1 .I 5.3
7.3 11.8 17.3
22.1 31.6 39.7
77.9 68.4 60.3
100.0 100.0 100.0

APPENDIX D
WEIGHTED-AVERAGE PRICES OF PRODUCTS 1,2, AND 4 FOR IMPORTS FROM ALL SUBJECT COUNTRIES COMBINED
D- 1
Table D-1 PET resin: Weighted-average f.0.b. prices of imports from all subject countries of products 1,2, and 4, and margins of underselling (overselling) by quarters, 2001- 03
* * * * * * *
D-3

APPENDIX E
ALLEGED EFFECTS OF IMPORTS OF PET RESIN FROM INDIA, INDONESIA, TAIWAN, AND THAILAND ON U.S. PRODUCERS’ EXISTING DEVELOPMENT AND PRODUCTION EFFORTS, GROWTH, INVESTMENT,
AND ABILITY TO RAISE CAPITAL
E- 1
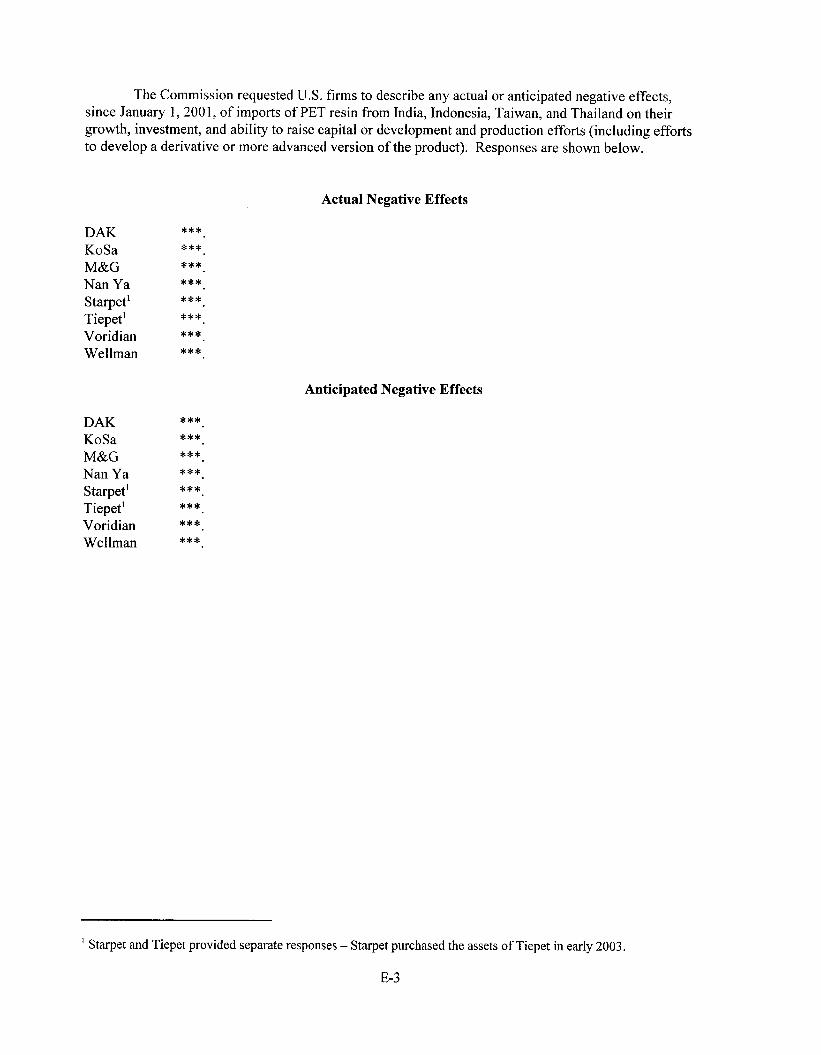
The Commission requested U.S. firms to describe any actual or anticipated negative effects, since January 1,200 1, of imports of PET resin from India, Indonesia, Taiwan, and Thailand on their growth, investment, and ability to raise capital or development and production efforts (including efforts to develop a derivative or more advanced version of the product). Responses are shown below.
Actual Negative Effects
DAK KoSa M&G Nan Ya Starpet' Tiepet' Voridian Wellman
DAK KoSa M&G Nan Ya Starpet' Tiepet' Voridian Wellman
***. *** ***. ***. ***. *** ***. ***.
Anticipated Negative Effects
***. ***. **** *** ***. ***. ***. ***
' Starpet and Tiepet provided separate responses - Starpet purchased the assets of Tiepet in early 2003.
E-3