polymer conversions in the γ-ray polymerization of urethane-substituted diacetylenes
TRANSCRIPT
Polymer Conversions in the y -ray Polymerization o f Urethan e-Su bs tit u ted Dia ce tylen es
Numerous methods have been employed for the analysis of the kinetics of the solid-state poly- merization of diacetylene~l-~:
n(RC=C-C=CR) - [ (R)C-C-C-C(R)],
where R is a substituent group. Most have limitations which severely restrict their applicability. The most commonly used technique is monomer extraction.1*2*6 This is a rather tedious gravimetric technique in which the partially polymerized crystal is exposed to a solvent for the monomer. Though the applicability of this technique is quite general, there are certain problems associated with monomer extraction (e.g., finite polymer solubility and trapping of monomer in the polymer lat- tice).3.6
These problems can generally be overcome with careful experimental methods and crosschecks. However, the most serious drawback for this technique is the large amount of material required in order to achieve reasonable accuracy in the measurements. In this note we present two additional analysis methods applicable to urethane-substituted diacetylenes and discuss briefly their advantages and limitations.
The first method requires that the polydiacetylene be soluble. This is obviously a very restrictive requirement, since high molecular weight polydiacetylenes are generally quite insoluble.' However, a new class of polydiacetylenes has recently been discovered which shows high solubility in certain common organic solvent^:^ The substituent group R is a urethane
H For the cases to be considered here n is 3 or 4 and Z is n-butyl (C4H9): poly-3BCMU ( n = 3) and poly-4BCMU (n = 4). The synthesis of these materials has been described elsewhere.8 Though they are quite reactive to y-ray irradiation, they exhibit no significant thermal reactivity. (No satisfactory explanation is known for this, though it is generally true of urethane-substituted dia- cetylenes.) Polymer-CHCla solutions are yellow; absorption spectra are shown in Figure l. The lowest energy optical transition in crystalline polydiacetylenes is normally a t about 620-650 nm.9 The large blue shift for these polymer solutions is due to interruptions of the planar conjugated se-
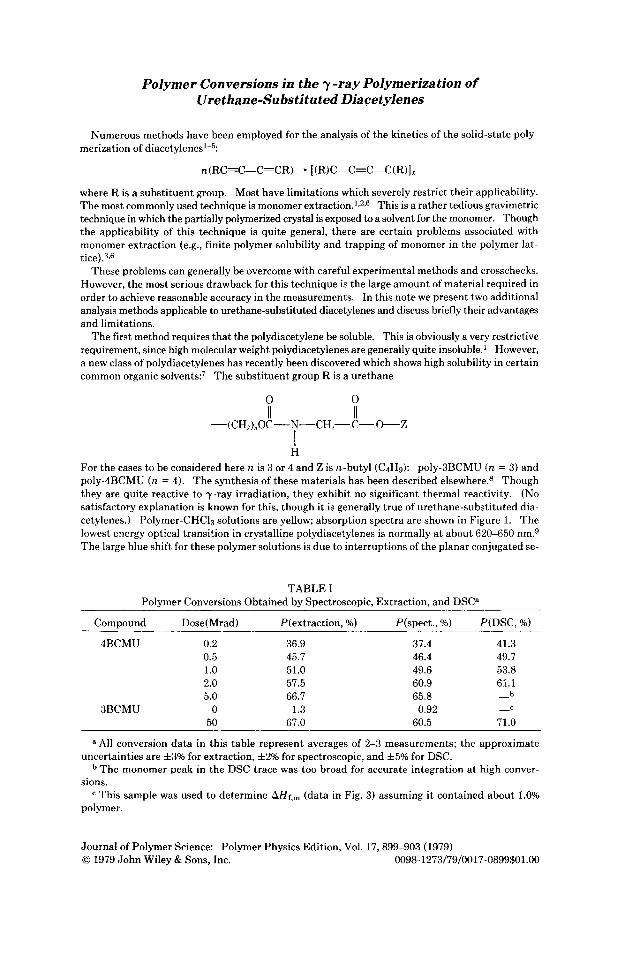
TABLE I Polymer Conversions Obtained by Spectroscopic, Extraction, and DSC"
Compound Dose(Mrad) P(extraction, %) P(spect., %) P(DSC, %)
4BCMU 0.2 36.9 37.4 41.3 0.5 45.7 46.4 49.7 1.0 51.0 49.6 53.8 2.0 57.5 60.9 61.1
b 5.0 66.7 65.8 -
3BCMU 0 1.3 0.92 -
50 67.0 60.5 71.0 c
* All conversion data in this table represent averages of 2-3 measurements; the approximate
The monomer peak in the DSC trace was too broad for accurate integration a t high conver-
This sample was used to determine AHf,m (data in Fig. 3) assuming it contained about 1.0%
uncertainties are f 3 % for extraction, 42% for spectroscopic, and f 5 % for DSC.
sions.
polymer.
Journal of Polymer Science: Polymer Physics Edition, Vol. 17,899-903 (1979) 0 1979 John Wiley & Sons, Inc. 0098-1273/79/0017-0899$01.00

900 J. POLYM. SCI.: POLYM. PHYS. ED., VOL. 17 (1979)
0 .7
0.6
* 0.5 k cn z W 0 0.4
a 0
% 0.3 I-
0.2
0.1
CONJUGATION L E N G T H
3 4 5 6 7 8 10 12 15 25 I , f , I I ,
/ /
\ \ i 400 4 50 500 ‘. 550
WAVELENGTH ( nm 1 Fig. 1. Absorption spectra for poly-3BCMU (solid line) and poly-4BCMU (dashed line). The
mole/l for both spectra. The approximate correspondence polymer concentration is 3.7 X between conjugation length and absorption peak7 is also indicated.
quence by rotation about the single bond of the polymer b a ~ k b o n e . ~ Shorter average conjugation lengths ( 1 ) result and lead to higher-energy optical transitions. As indicated in Figure 1, (1) is about 6 or 7 repeat units. As long as the actual chain length is much greater than ( l ) , absorption spectra should be relatively insensitive to molecular weight. If a nonsolvent, such as hexane, is added, a conformational transition to an ordered, planar structure occurs along with dramatic changes in the optical spectra ( ( 1) increases to ca. 15 units for poly-4BCMU and more than 30 units for poly- 3BCMU). Our special interest in this class of polymers is due in part to this “visual conformational transition.”7
The conversions determination involves the simple measurement of a visible absorption spectrum, as illustrated in Figure 1. The polymer conversion P is obtained from the absorption maximum as P = c,/c, where c. is the apparent molar extinction coefficient for the partially polymerized ma- terial (in terms of moles of polymer repeat units) and t,, is the extinction coefficient for the polymer as obtained from carefully extracted samples. We find tp = 17500 f 500 1 mole-’ cm-I for both poly-3BCMU and poly-4BCMU.
Table I shows a comparison of polymer conversion results obtained by the present spectroscopic method and careful extraction experiments. [The differential scanning colorimetry (DSC) results will be discussed later.] The results are in reasonably good agreement. The main advantages of the spectroscopic method are the precision of the measurements and the small amounts of sample required, less than 0.04 g for all of the Table I experiments. The extraction experiments required a total of about 25 g.
Another advantage of the spectroscopic technique is that some information on molecular weights,

NOTES 901
$1 I-
s W
0
W
7OoC
A H f , m = 29.6coVg
---- _ _ _ _ _ _ _ _ _ _ A H f , u =22.5cal/g
‘..-AHf,u=Ocal/g \ / v ‘, /
\- L- 154OC .-.-
\
Fig. 2. Typical DSC thermograms of 3BCMU: (A) monomer, (B) partially polymerized, 10 Mrad, and (C) poly-BBCMU, 50 Mrad. Complete extraction of monomer was achieved by extraction of monomer by acetone followed by selective precipitation of polymer from its solution in chloroform. Instruments: Perkin-Elmer DSC-2,1O0C/min. heating rate, 5.0-mg sample in sealed A1 pans, Ar atmosphere.
and in particular how they change with conversion, can be inferred from the data. For example, if there were any substantial concentrations of dimer, trimers, etc., this would be evident in the ab- sorption spectra. In fact, the shapes and location of the absorption spectra for both poly-4BCMU and poly-SBCMU are completely independent of conversion. This suggests that a t all conversions, the molecular length (which correlates with the number average molecular weight) is much greater than ( 1 ) or much greater than 7 repeat units. Also, for example in the case of the two poly-3BCMU experiments of Table I, the spectra produced after addition of hexane (Ama = 630 nm) are identical for the two samples; therefore, the molecular length must be much greater than 30 repeat units a t all conversions. In the case of poly-BBCMU, the degree of polymerization has been shown by Pate1 and Walsh’O to be approximately lo00 at about 70% polymer conversion.
The second technique involves measurement of the heat of fusion of the residual monomer in the partially polymerized crystals using differential scanning calorimetry. The principal requirement for DSC is that the material display separate monomer and polymer melting endotherms. A number of diacetylenes exhibit this behavior including all urethane-substituted diacetylenes that we have investigated; 3BCMU and 4BCMU are the examples considered here. Either the monomer or the polymer melting endotherms could be used to monitor the polymer fraction P. We choose to use the monomer peak so that we have
(1)
where AHf,” is the heat of fusion for the partially polymerized sample and AHf,m is that for the pure monomer.
P = 1 - AHf,u/AHf,m

902 J. POLYM. SCI.: POLYM. PHYS. ED., VOL. 17 (1979)
.5 1 = EXTRACTION
DOSE (Mrads)
Fig. 3. Plot of fractional polymer conversion by DSC and the extraction techniques versus 6OCo
y-ray dose for 3BCMU.
Typical DSC scans for 3BCMU are illustrated in Figure 2. Thermogravimetric analysis (TGA) indicates no weight loss up to 215OC. Thus monomer and polymer degradation need not be con- sidered as a complicating factor in these experiments. The residual monomer melts between 60°C and 7OoC depending on polymer conversion. The polymer melt temperature also varies from 15OOC to 182OC. The observation of two melting endotherms suggests that monomer-polymer phase separation has occurred. This point was examined further by a visual observation of the melting. A sample of 3BCMU (2% polymer) was sandwiched between two glass slides on a melting-point ap- paratus. The flakelike crystals started collapsing a t about 65 OC and the molten monomer segregated as a transparent liquid leaving behind the blue polymer matrix. This blue color is a clear demon- stration that the polymer chains remain ordered after the monomer matrix collapse^.^ (The same is true of 4BCMU except the polymer matrix is red.I7 There are two possible explanations for the DSC behavior depending on whether or not crystalline phase separation of monomer and polymer occurs during polymerization." If there is phase separation during polymerization, the first (ca. 70°C) and second (ca. 15OOC) endotherms can be attributed to monomer and polymer melting, re- spectively. If there is true solid-solution formation throughout our conversion range, the first en- dotherm corresponds to the transformation from the solid solution of monomer and polymer to molten monomer and intramolecularly ordered polymer chains. The polymer chains remained ordered, as they do in CHClhexane solution: due to strong intramolecular hydrogen bonding. In this case, the second endotherm would correspond to the melting of the polymer chains, i.e., largely to the disruption of the hydrogen bond network. More x-ray structural information is required to decide between these possibilities. In either case AHf,, should scale approximately to the residual monomer content.
Curve A of Figure 2 shows results for 3BCMU monomer after recrystallization and drying. It rapidly turns blue during this period due presumably to thermal initiation of polymer chains a t crystalline defects or impurities.12 Our extraction and spectroscopic analysis shows that it contains ca. 1% polymer a t this stage so that the observed heat of fusion, 29.6 cal/g, can be corrected to give A H s , = 30 cal/g (ro 14.4 kcal/mole). We have measured AHf,, for several partially polymerized samples of 3BCMU obtained by y-ray irradiation. The polymer conversion was obtained from eq. (1) and also by extraction. The results are shown in Figure 3. The agreement between the two techniques is quite good. Similar results have been obtained for 4BCMU (AHf,, = 26.4 cal/g or 13.4 kcal/mole) and are shown in Table I. Though the agreement is satisfactory, the DSC technique is generally less accurate than either the spectroscopic technique or careful extraction. However, for insoluble urethane-substituted diacetylenes it could be the most convenient method, particularly when limited amounts of material are available.
Some final comments on the shapes of the conversion versus dosage curves are in order. Unlike

NOTES 903
two previously investigated diacetylenes,6J1 there is no evidence of an autocatalytic effect. The strain theory of reaction kinetics developed by Baughman13 suggests that this is a consequence of a near-zero mismatch in the monomer and polymer crystallographic repeat distances in the chain propagation direction. X-ray diffraction studies are in progress to investigate this possibility. The difference in reactivity for 3BCMU and 4BCMU would seem to be a consequence of molecular packing. With the assumption that hydrogen bonding will dictate the monomer packing, molecular models suggest that 4BCMU will produce the more reactive phase, on the hasis of simple least-motion arguments.
References
1. G. Wegner, Mukromol. Chem., 145,85 (1971). 2. D. Bloor, L. Koski, G. C. Stevens, F. H. Preston, and D. J. Ando, J . Muter. Sci., 10, 1678
3. R. R. Chance and J. M. Sowa, J . Am. Chem. Soc., 99,6703 (1977). 4. R. R. Chance, G. N. Patel, E. A. Turi, and Y. P. Khanna, J . Am. Chem. SOC., 100, 1307
5. G. N. Patel, R. R. Chance, E. A. Turi, and Y. P. Khanna, J. Am. Chem. Soc., 100, 6644
6. R. R. Chance and G. N. Patel, J. Polym. Sci., Polym. Phys. Ed., 16,859 (1978). 7. G. N. Patel, R. R. Chance, and J. D. Witt, J. Polym. Sci., Polym. Lett . Ed., 16,607 (1978). 8. G. N. Patel, ACS Meeting, Miami, Sept., 1978. 9. See, for example, R. R. Chance, R. H. Baughman, H. Miiller, and C. J. Eckhardt, J. Chem.
(1975).
(1978).
(1978).
Phys., 67,3616 (1977), and references therein. 10. G. N. Patel and E. Walsh, J . Polym. Sci., Polym. Lett . Ed., to appear. 11. K. C. Yee and R. R. Chance, J . Polym. Sci., Polym. Phys. Ed., 16,431 (1978). 12. W. Sherman, G. Wegner, J . 0. Williams, and J . M. Thomas, J. Polym. Sci., Polym. Phys. Ed.,
13. R. H. Baughman, J . Chem. Phys., 68,3110 (1978). 14. R. H. Baughman, J . Appl . Phys., 43,4362 (1972); J. Polym. Sci., Polym. Phys. Ed., 12,1511
G. N. PATEL Y. P. KHANNA
D. M. IVORY
R. R. CHANCE
13,753 (1975).
(1974).
J. M. SOWA
Corporate Research Center Allied Chemical Corporation Morristown, New Jersey 07960
Received November 8,1978 Revised January 15,1979