polymer liquid crystal (plc) and polypropylene …/67531/metadc5838/m2/1/high_res_dpolymer liquid...
TRANSCRIPT
POLYMER LIQUID CRYSTAL (PLC) AND POLYPROPYLENE INTERLAYERS IN
POLYPROPYLENE AND GLASS FIBER COMPOSITES: MECHANICAL PROPERTIES
Syed Maswood
Problem in Lieu of Thesis Prepared For the Degree of
MASTER OF SCIENCE
UNIVERSITY OF NORTH TEXAS
December 2000
APPROVED: Witold Brostow, Major Professor Nandika D’Souza, Committee Member Bruce Gnade, Chair of the Department of
Materials Science C. Neal Tate, Dean of the Robert B. Toulouse
School of Graduate Studies
Maswood, Syed. Polymer Liquid Crystal (PLC) and Polypropylene Interlayers in
Polypropylene and Glass Fiber Composites: Mechanical Properties. Master of Science
(Materials Science), December 2000, 41 pp., 1 table, 29 figures, references, 20 titles.
In recent developments of composite materials, scientists and engineers have come up
with fibers as well as matrices for composites and techniques of blending high cost components
with low cost materials. Thus, one creates cost effective composite materials that are as efficient
as space age components. One of the major breakthroughs in this area is the innovation of
molecular composites, specifically polymeric liquid crystals (PLCs). These materials have
excellent mechanical properties such as tensile impact and bending strength. They have
excellent chemical resistance, low thermal expansivity, and low flammability. Their low
viscosity leads to good processability One major setback in using space age composite
technology in commercial applications is the price. Due to the complexity of processing, the cost
of space composite materials is skyrocketing. To take the same concept of space age composite
materials to create a more economical substitute has become a serious concern among scientists
and engineers around the world. The two issues that will be resolved in this thesis are: (1) the
potential impact of using PLCs (molecular reinforcement) can have on macro reinforced
(heterogeneous composite, HC) long fiber systems; and (2) how strategic placement of the
reinforcing layers can affect the macromechanical properties of the laminates.

TABLE OF CONTENTS LIST OF TABLES ........................................................................................................... iv LIST OF FIGURES ......................................................................................................... v Chapters
1. INTRODUCTION ............................................................................................. 1
2. LITERATURE REVIEW .................................................................................. 5
2.1 Glass-fibers 2. 1.1 Polypropylene commingled yarn 2.1.2 Impregnation 2.1.3 Composite industry process of commingled yarn 2.1.3.1 Low pressure vacuum or pressure bag consolidation 2.1.3.2 Thermoforming 2.1.3.3 Pultrusion 2.2 Polymer Liquid Crystals (PLCs) 2.2.1 Blends of PLCs and their properties 2.2.2 Melt processing of blends 2.2.3 Polypropylene and PLC blends
3. EXPERIMENTAL............................................................................................. 18
3.1 Materials 3.2 Chemical composition of materials 3.3 Sample preparation 3.4 Composites
ii
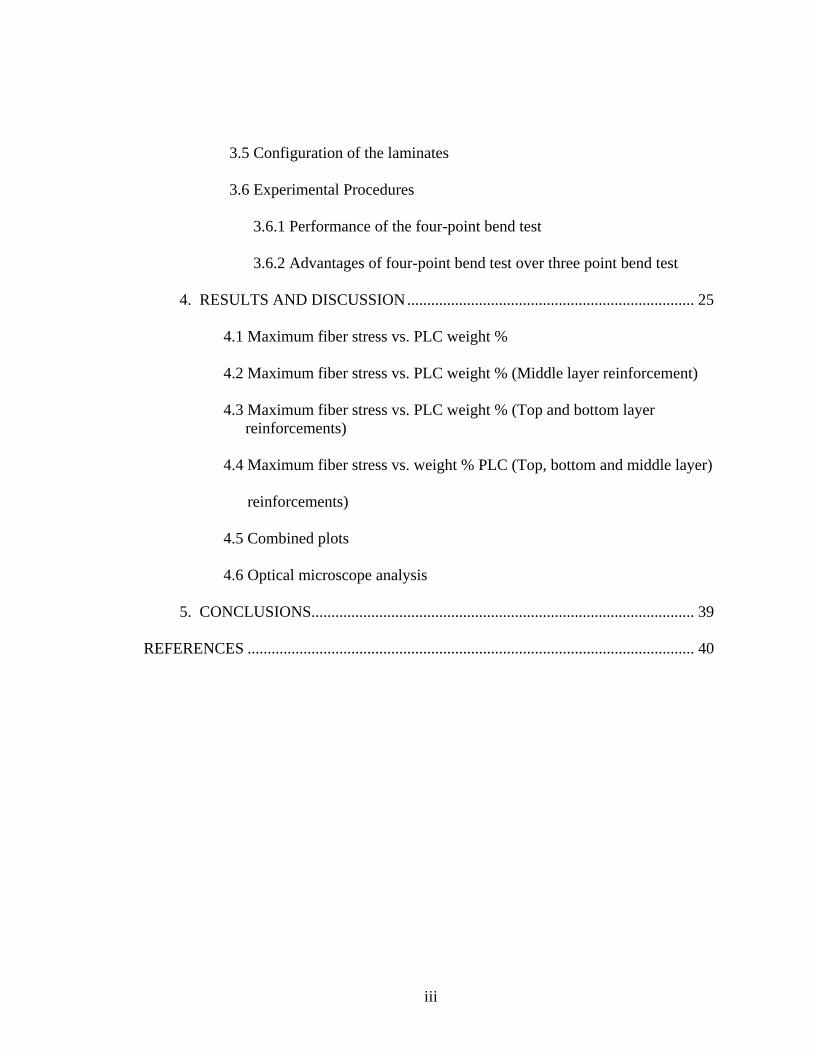
3.5 Configuration of the laminates 3.6 Experimental Procedures 3.6.1 Performance of the four-point bend test 3.6.2 Advantages of four-point bend test over three point bend test
4. RESULTS AND DISCUSSION........................................................................ 25
4.1 Maximum fiber stress vs. PLC weight % 4.2 Maximum fiber stress vs. PLC weight % (Middle layer reinforcement) 4.3 Maximum fiber stress vs. PLC weight % (Top and bottom layer
reinforcements) 4.4 Maximum fiber stress vs. weight % PLC (Top, bottom and middle layer) reinforcements) 4.5 Combined plots 4.6 Optical microscope analysis
5. CONCLUSIONS................................................................................................ 39 REFERENCES ................................................................................................................ 40
iii

LIST OF TABLES
Table 1 Materials Used For My Research ....................................................................................18
iv
LIST OF FIGURES
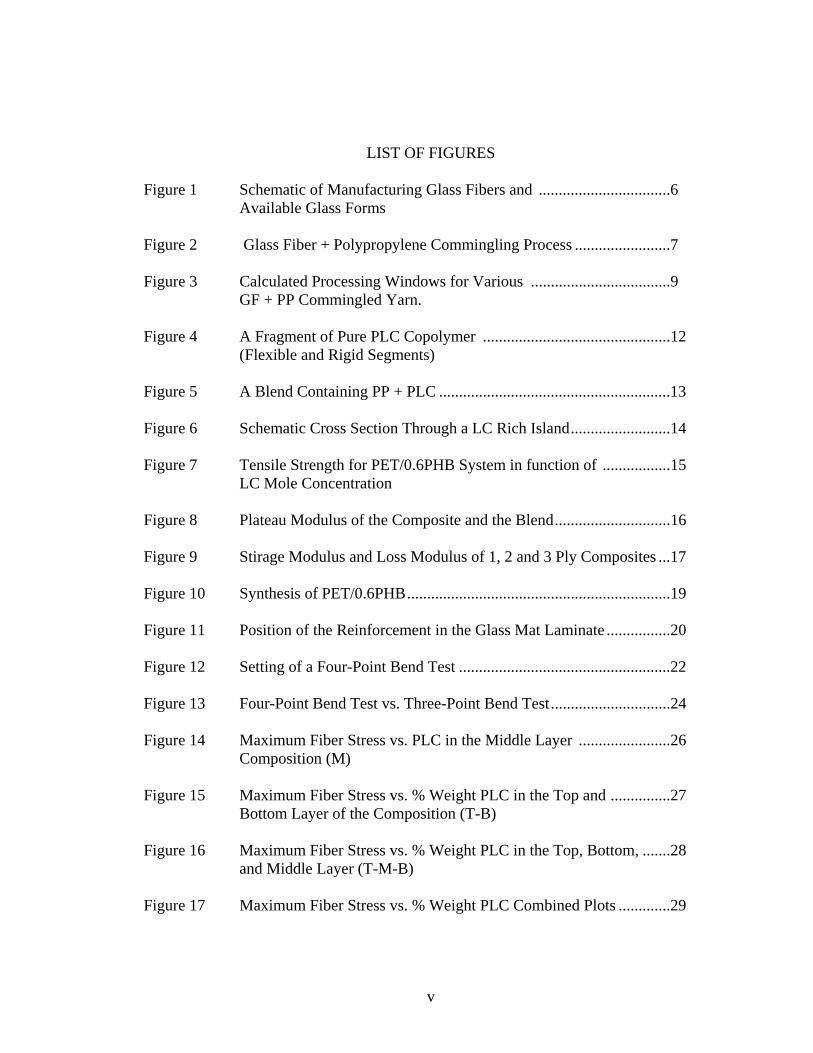
Figure 1 Schematic of Manufacturing Glass Fibers and .................................6 Available Glass Forms Figure 2 Glass Fiber + Polypropylene Commingling Process ........................7 Figure 3 Calculated Processing Windows for Various ...................................9 GF + PP Commingled Yarn. Figure 4 A Fragment of Pure PLC Copolymer ...............................................12 (Flexible and Rigid Segments) Figure 5 A Blend Containing PP + PLC ..........................................................13 Figure 6 Schematic Cross Section Through a LC Rich Island.........................14 Figure 7 Tensile Strength for PET/0.6PHB System in function of .................15 LC Mole Concentration Figure 8 Plateau Modulus of the Composite and the Blend.............................16 Figure 9 Stirage Modulus and Loss Modulus of 1, 2 and 3 Ply Composites ...17 Figure 10 Synthesis of PET/0.6PHB..................................................................19 Figure 11 Position of the Reinforcement in the Glass Mat Laminate ................20 Figure 12 Setting of a Four-Point Bend Test .....................................................22 Figure 13 Four-Point Bend Test vs. Three-Point Bend Test..............................24 Figure 14 Maximum Fiber Stress vs. PLC in the Middle Layer .......................26 Composition (M) Figure 15 Maximum Fiber Stress vs. % Weight PLC in the Top and ...............27 Bottom Layer of the Composition (T-B) Figure 16 Maximum Fiber Stress vs. % Weight PLC in the Top, Bottom, .......28 and Middle Layer (T-M-B) Figure 17 Maximum Fiber Stress vs. % Weight PLC Combined Plots .............29
v
Figure 18 Normal and Shear Stresses at the Interface of Bottom Surface .........31 of Top Ply in a 4-Ply Laminate Figure 19 Normal Stress and Shear Stress Components ....................................32 Figure 20 Optical Microscope of 0% PLC in the Middle ..................................33 Figure 21 Optical Microscope of 15% PLC in the Middle Layer ......................33 Figure 22 Optical Microscope of 25% PLC in the Middle Layer ......................34 Figure 23 Optical Microscope of 15% PLC in the Top and Bottom Layer .......35 Figure 24 Optical Microscope of 25% PLC in the Top and Bottom Layer .......35 Figure 25 Optical Microscope of 35% PLC in the Top and Bottom Layer .......36 Figure 26 Optical Microscope of 0% PLC in the Top, Bottom, ........................36 and Middle Layer Figure 27 Optical Microscope of 15% PLC in the Top, Bottom, ......................37 and Middle Layer Figure 28 Optical Microscope of 25% PLC in the Top, Middle,.......................37 and Bottom Layer Figure 29 Optical Microscope of 35% PLC in the Top, Bottom, ......................38 and Middle Layer
vi
CHAPTER 1
INTRODUCTION
1.1 Definition of Composite Materials
Fiber-reinforced composite materials consist of fibers of high strength and modulus
embedded in or bonded to a matrix, with distinct interfaces between them [1]. Fibers are the
main load bearing members while the matrix keeps the fibers in desired locations and acts as a
load-distributing component.
There are five major classes of composite materials, namely: polymer matrix composites
(PMCs), metal matrix composites (MMCs), ceramic matrix composites (CMCs), carbon-carbon
composite (CCCs), and inter-metallic composites (IMCs).
1.2 Advantages of Composite Materials Over Metals and Steels
Some of the advantages of composite materials over steels or other metals are high
strength to weight ratio, low isobaric expansivity (also called the coefficient of thermal
expansion, CTE), and good mechanical properties including tensile, bending, and impact and
also corrosion resistance.
In recent developments of composite materials, scientists and engineers have come up
with fibers as well as matrices for composites and techniques of blending high cost components
with low cost materials. Thus, one creates cost effective composite materials that are as efficient
as space age components. One of the major breakthroughs in this area is the innovation of
molecular composites, specifically polymeric liquid crystals (PLCs).
1
These materials have excellent mechanical properties such as tensile impact and bending
strength. They have excellent chemical resistance, low thermal expansivity, and low
flammability. Their low viscosity leads to good processability [15].
1.3 Applications
Fiber-reinforced composite materials are used in various commercial and industrial
applications that include aircraft and military, space, automotive, sporting goods, and marine
applications. These classes of applications will now be discussed in some detail.
• Aircraft and military applications: Weight reduction is the main issue for using
composite materials in aircrafts. Boron fiber + epoxy and carbon fiber + epoxy composites
are used in various structural components of F-14 and F-11 fighter planes. Kevlar is used in
Stealth bombers and carbon fibers with epoxy materials are used in rotor blades for military
helicopters. Kevlar-49 or S-glass reinforcement epoxies are used in filament wound missile
motor cases. Using composite materials reduces weight of the missile and increases the
firing range.
• Space applications : Payload bay door for spacecraft uses carbon fiber-reinforced
epoxy facesheets, long ultra-high-modulus carbon fiber-reinforced epoxy tubes for the
remote manipulator arm and Kevlar 49 fiber-reinforced epoxy pressure vessels [1].
• Automotive applications: Fiber-reinforced composite materials are used in the
automotive industry for body components, chassis components, and engine components.
Polyurethane resins are used in hoods and door panels of the cars. Applications of these
composites in engine components are still at early stages of development. High temperature
polymers can greatly increase the potential for composites in this area.
2
1.4 Disadvantages of Fiber-reinforced Composite Materials
One major setback in using space age composite technology in commercial applications
is the price. Due to the complexity of processing, the cost of space composite materials is
skyrocketing. To take the same concept of space age composite materials to create a more
economical substitute has become a serious concern among scientists and engineers around the
world.
The two issues that will be resolved in this thesis are:
1) The potential impact of using PLCs (molecular reinforcement) can have on macro
reinforced (heterogeneous composite, HC) long fiber systems.
2) How strategic placement of the reinforcing layers can affect the macromechanical
properties of the laminates.
PLCs have already shown potential in blends with other engineering thermoplastics.
Strategic placement of fiber layers with different orientation is the premise of Micromechanical
laminate theory approach. However, the selective matrix reinforcement has not been studied
sufficiently.
Before I started my work, it has been known that macroscopic composite deformation
failure modes are due to top ply normal stresses or poor matrix-fiber adhesion leading to failure
by shear stresses. Therefore, I investigate composites so as to be able also to demarcate the
weakest regions prone to failure.
There has been a fairly extensive research on PLCs and their blends. Using low cost
thermoplastics such as polypropylene, commingled with high modulus glass fibers can give a
composite material comparable to steel and metals in their flexural properties.
In order to improve the mechanical properties of the PP + glass fiber commingled yarn
3
composite, we have studied systematic addition of certain layers into the composite. In
developing micro and macro reinforced PP, we are concerned with the potential changes in
damage mechanism. Therefore we have studied beams in flexure [2].
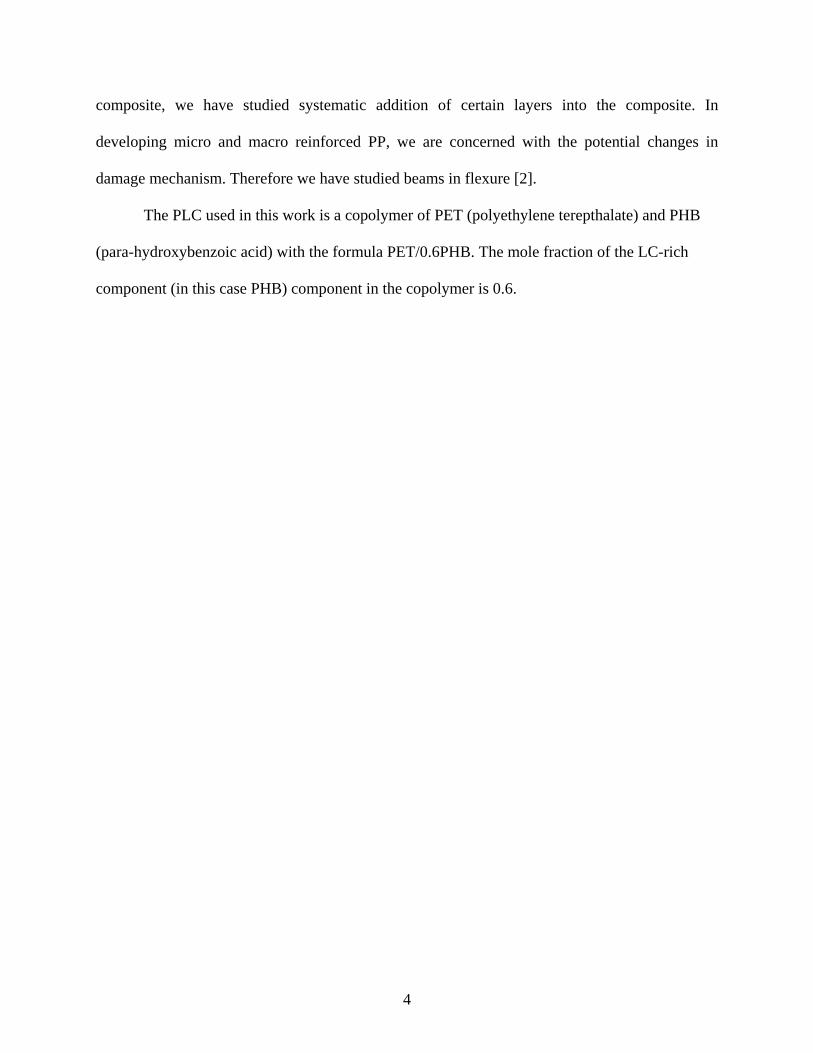
The PLC used in this work is a copolymer of PET (polyethylene terepthalate) and PHB
(para-hydroxybenzoic acid) with the formula PET/0.6PHB. The mole fraction of the LC-rich
component (in this case PHB) component in the copolymer is 0.6.
4
CHAPTER 2
LITERATURE REVIEW
2.1 Glass Fibers
Glass is the most common fiber used in PMCs. Its advantages include its high strength,
low cost, high chemical resistance, and good insulating properties. The drawbacks include low
elastic modulus, poor adhesion to polymers, high specific gravity, sensitivity to abrasion
(reduces tensile strength), and low fatigue strength.
Types: The main types are E-glass (also called "fiberglass") and S-glass. The E-glass
stands for electrical as it was designed for electrical applications. However, it is used for many
other purposes now such as decorations and structural applications. The S in S-glass stands for
higher content of silica. It retains its strength at high temperatures as compared to E-glass and
has higher fatigue strength. It is used mainly for aerospace applications.
Other types available commercially are C-glass (C stands for corrosion) used in chemical
environments such as storage tanks, R-glass used in structural applications such as storage tanks,
D-glass (D stands for dielectric) used for applications requiring low dielectric constants such as
radomes, and A-glass (A stands for appearance) used to improve surface appearance.
Combination types such as E-CR glass (E-CR stands for electrical and corrosion resistance) and
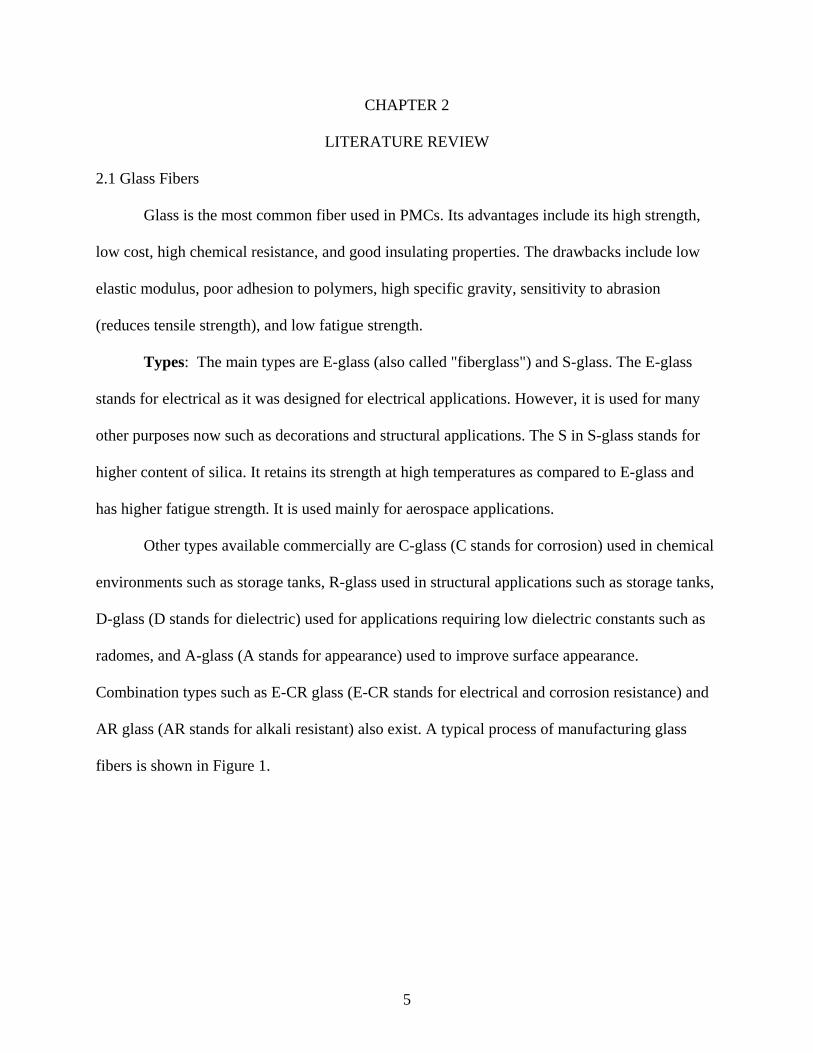
AR glass (AR stands for alkali resistant) also exist. A typical process of manufacturing glass
fibers is shown in Figure 1.
5
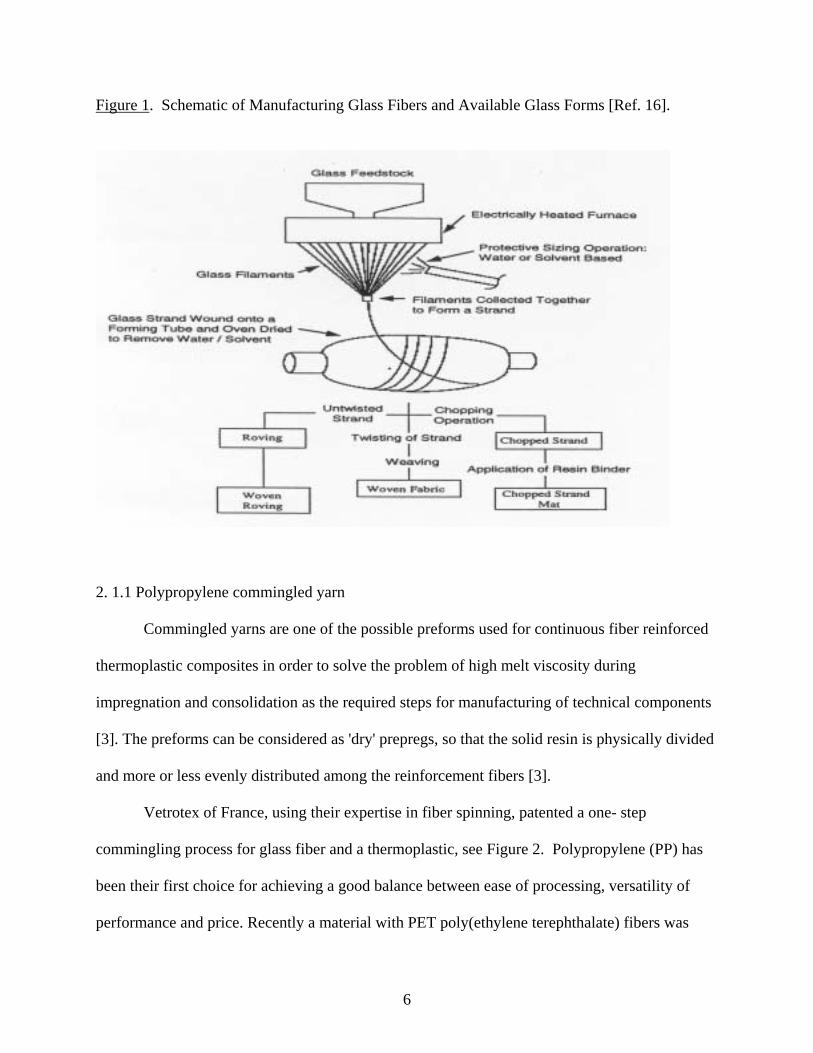
Figure 1. Schematic of Manufacturing Glass Fibers and Available Glass Forms [Ref. 16].
2. 1.1 Polypropylene commingled yarn
Commingled yarns are one of the possible preforms used for continuous fiber reinforced
thermoplastic composites in order to solve the problem of high melt viscosity during
impregnation and consolidation as the required steps for manufacturing of technical components
[3]. The preforms can be considered as 'dry' prepregs, so that the solid resin is physically divided
and more or less evenly distributed among the reinforcement fibers [3].
Vetrotex of France, using their expertise in fiber spinning, patented a one- step
commingling process for glass fiber and a thermoplastic, see Figure 2. Polypropylene (PP) has
been their first choice for achieving a good balance between ease of processing, versatility of
performance and price. Recently a material with PET poly(ethylene terephthalate) fibers was
6
developed for applications in which better thermal resistance and higher strength than PP were
required [3].
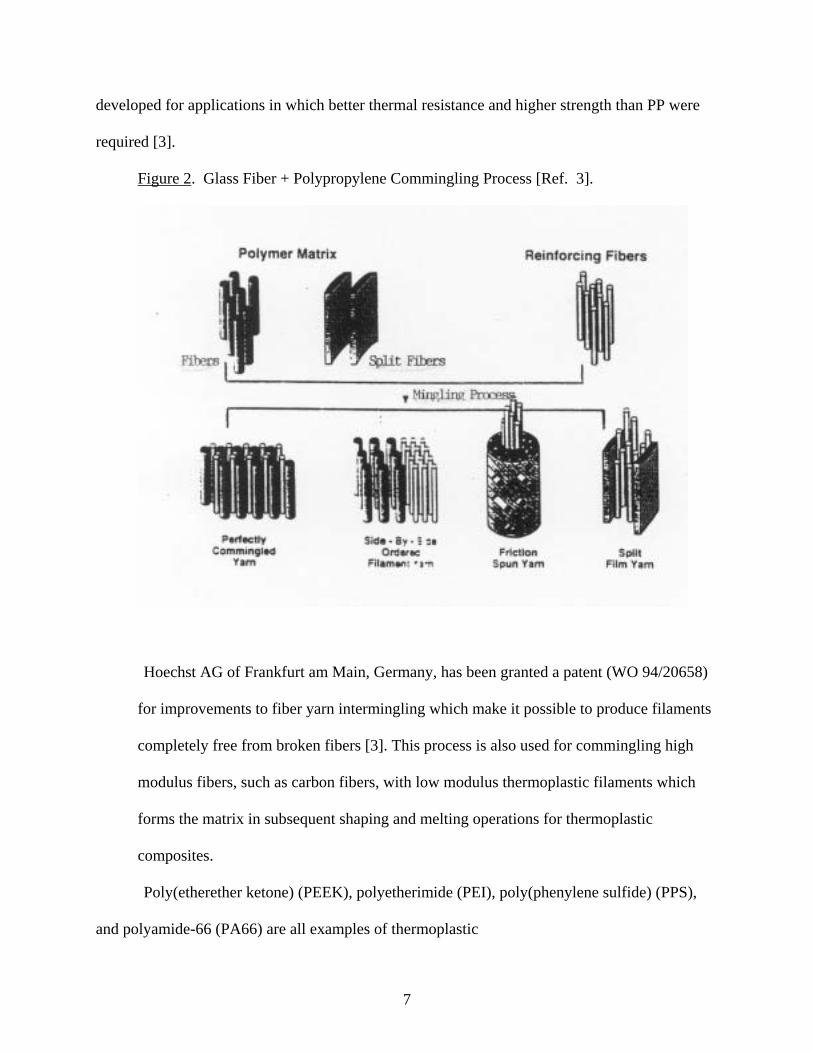
Figure 2. Glass Fiber + Polypropylene Commingling Process [Ref. 3].
Hoechst AG of Frankfurt am Main, Germany, has been granted a patent (WO 94/20658)
for improvements to fiber yarn intermingling which make it possible to produce filaments
completely free from broken fibers [3]. This process is also used for commingling high
modulus fibers, such as carbon fibers, with low modulus thermoplastic filaments which
forms the matrix in subsequent shaping and melting operations for thermoplastic
composites.
Poly(etherether ketone) (PEEK), polyetherimide (PEI), poly(phenylene sulfide) (PPS),
and polyamide-66 (PA66) are all examples of thermoplastic
7
polymers that have been used in filament form in the past for the production of dry,
flexible, prepreg fabrics [4-6].
2.1.2 Impregnation
To form a composite using a commingled yarn, it is important to evaluate the extent of
impregnation of the PP into the glass mat. Such a study was performed by Gillian et al [7] , on
glass-fiber + PP commingled yarn. The void content in the preform was taken into consideration,
in order to define the optimum processing condition for the composite.
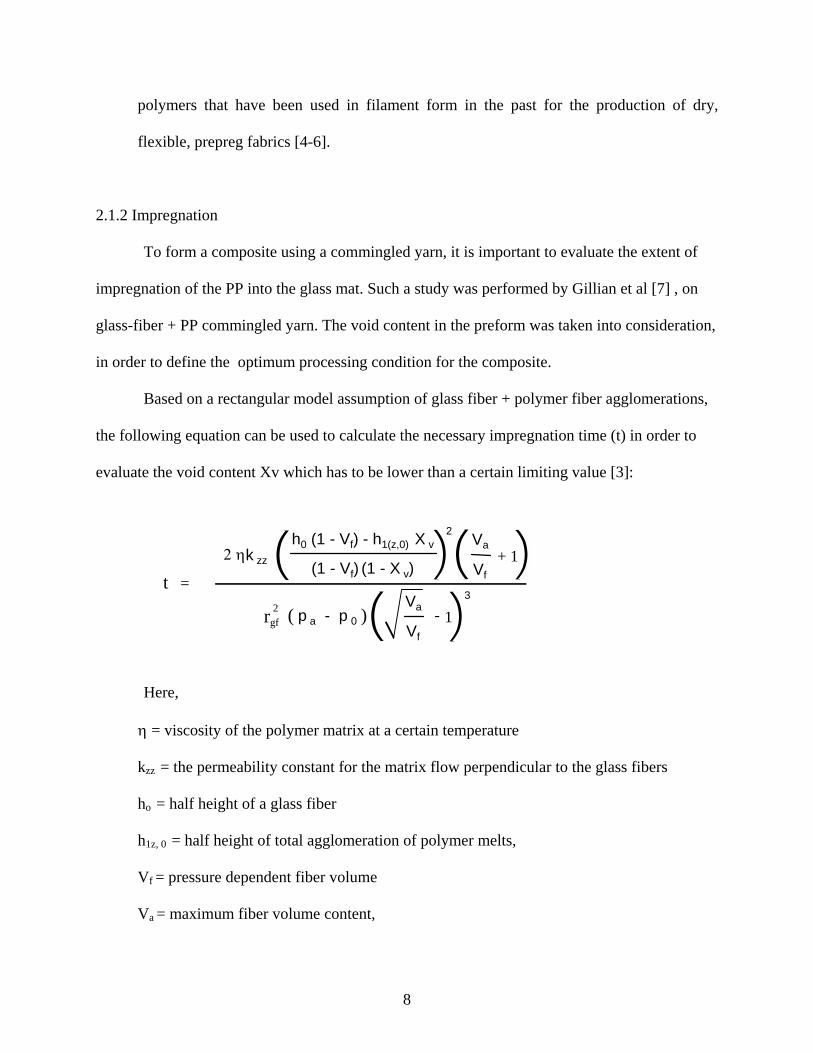
Based on a rectangular model assumption of glass fiber + polymer fiber agglomerations,
the following equation can be used to calculate the necessary impregnation time (t) in order to
evaluate the void content Xv which has to be lower than a certain limiting value [3]:
t =(( Va
Vf+ 1))
(( ))Va
Vf
- 1rgf2 ( p a - p 0 )
3
2 ηk zz
h0 (1 - Vf) - h1(z,0) X v
(1 - Vf) (1 - X v)(( ))2
Here,
η = viscosity of the polymer matrix at a certain temperature
kzz = the permeability constant for the matrix flow perpendicular to the glass fibers
ho = half height of a glass fiber
h1z, 0 = half height of total agglomeration of polymer melts,
Vf = pressure dependent fiber volume
Va = maximum fiber volume content,
8
Pa = Applied pressure,
P0 = atmospheric pressure,
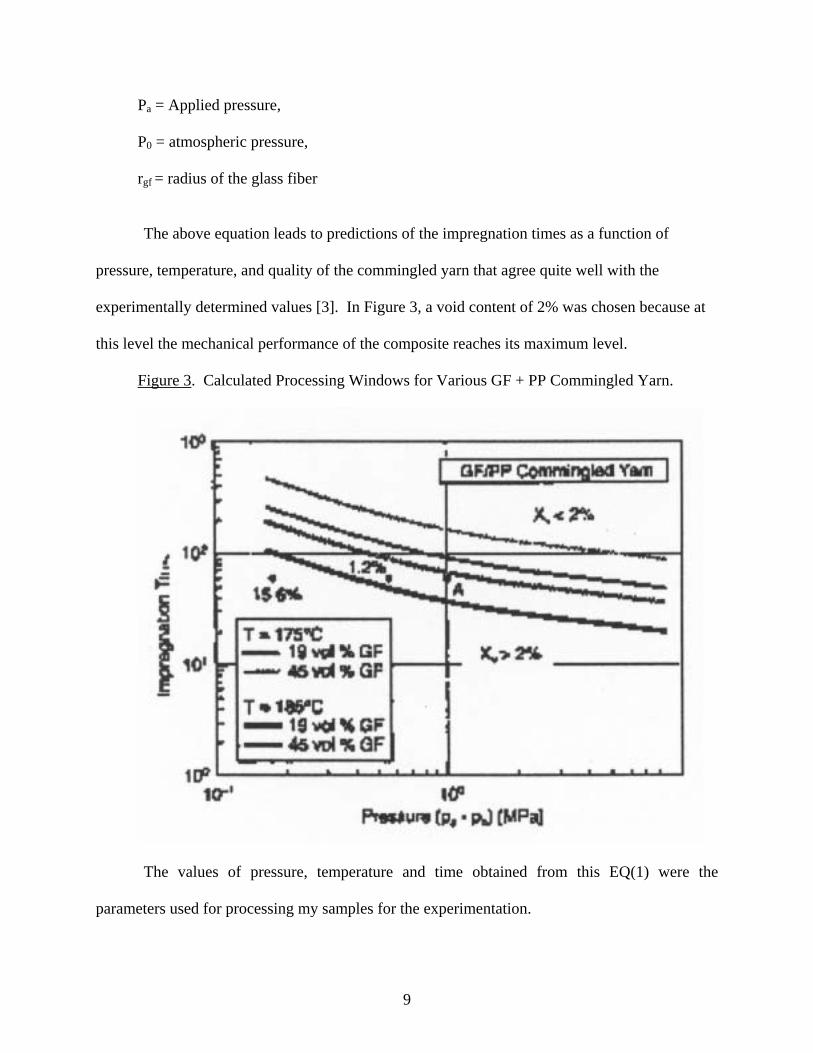
rgf = radius of the glass fiber The above equation leads to predictions of the impregnation times as a function of
pressure, temperature, and quality of the commingled yarn that agree quite well with the
experimentally determined values [3]. In Figure 3, a void content of 2% was chosen because at
this level the mechanical performance of the composite reaches its maximum level.
Figure 3. Calculated Processing Windows for Various GF + PP Commingled Yarn.
The values of pressure, temperature and time obtained from this EQ(1) were the
parameters used for processing my samples for the experimentation.
9

2.1.3 Composite Industry Processing of Commingled Yarn Composites
Various processing routes specially used for thermoplastic industries can also be used for
commingled yarns or prepegs. Several techniques are discussed below.
2.1.3.1 Low Pressure Vacuum or Pressure Bag Consolidation
This type of manufacturing technique takes full advantage of the easy impregnation
quality of commingled yarns, as long as the filaments are evenly distributed. With pressure
applied for 1 minute, a pressure of as low 4-5 bar is enough to achieve good quality
consolidation with the standard material discussed above (i.e., the void content of less than 2 %,
Figure 3 [3]).
During this process, however, care must be taken so that the materials used for the mold,
bag or bleeder film withstand the melting temperature of the thermoplastic resin [7]. When being
used as drapable fabrics, this process is well adapted to low volumes and large parts [7].
2.1.3.2 Thermoforming
This process has been developed specifically for thermoplastic composite plate materials,
and is well suited for commingled fabrics, especially when they are pre-consolidated by the use
of a double belt press into continuous organic sheets [8].
2.1.3.3 Pultrusion
This is an increasingly used industrial process for thermoplastic materials, which is
applied for commingled yarn. Rod-like composite structures are produced from this application.
The process is very simple. The continuous strands are pretreated by passing through a resin-
10
curative bath and then pulled through a die of a suitable profile [9].
The die is heated externally along with the compacted profile coming out. The cured
profile is continuously pulled out of the die, which provides the driving force for the impregnated
strands to be forced through the die. This process is similar to extrusion except that, in extrusion,
the polymeric material is forced through the die from inside by a rotating screw, while in
pultrusion the material is actually pulled through the die orifice from the outside [9].
2.2 Polymer Liquid Crystals (PLCs)
As already stated, these materials have been the focus of recent research because of their
excellent thermal and mechanical properties as well as their ease of processing and chemical
resistance. Much promise has been revealed in the area of molecular composites created by
blending a PLC with an engineering polymer, preferably with compatible or homogeneous
structures [10,11,12,13,14,15,17].
The properties of various commercial thermoplastic polymers can be improved greatly,
by addition of PLCs, with the added benefit of improved melt processability. The LC properties
of the PLCs are a result of a rigid section in the molecule connected by flexible chains. Figure 4
describes such a structure [15]. In effect, these alternating sections create "molecular
composites" which offer properties surpassing those of either the rigid or flexible section alone
[10].
11

Figure 4. A Fragment of Pure PLC Copolymer (Flexible and Rigid Segments) [Ref. 10].
Since the rigid and flexible sections are connected through primary chemical bonds, this
eliminates reinforcement pullout and delamination, the problem noted above common in fiber
reinforced HCs. In addition, molecular composites possess several processing advantages, such
as conventional thermoplastic processing, low die swell, and low melt viscosity [18].
2.2.1 PLC containing blends
Cost and availability demands necessitate the
blending these with low cost engineering thermoplastics. Processing of the blends and
advantages of the resulting materials are discussed in section 2.2.2. One aspect of this field of
study is the evaluation of AB + C melt processing, which blends an AB PLC copolymer (A is the
flexible and B is the LC constituent) with another engineering polymer, C [10]. Much success
12
has been realized for certain combinations in the areas of lower melt viscosity, and considerable
improvement of tensile strength and modulus as well as flexural strength [11].
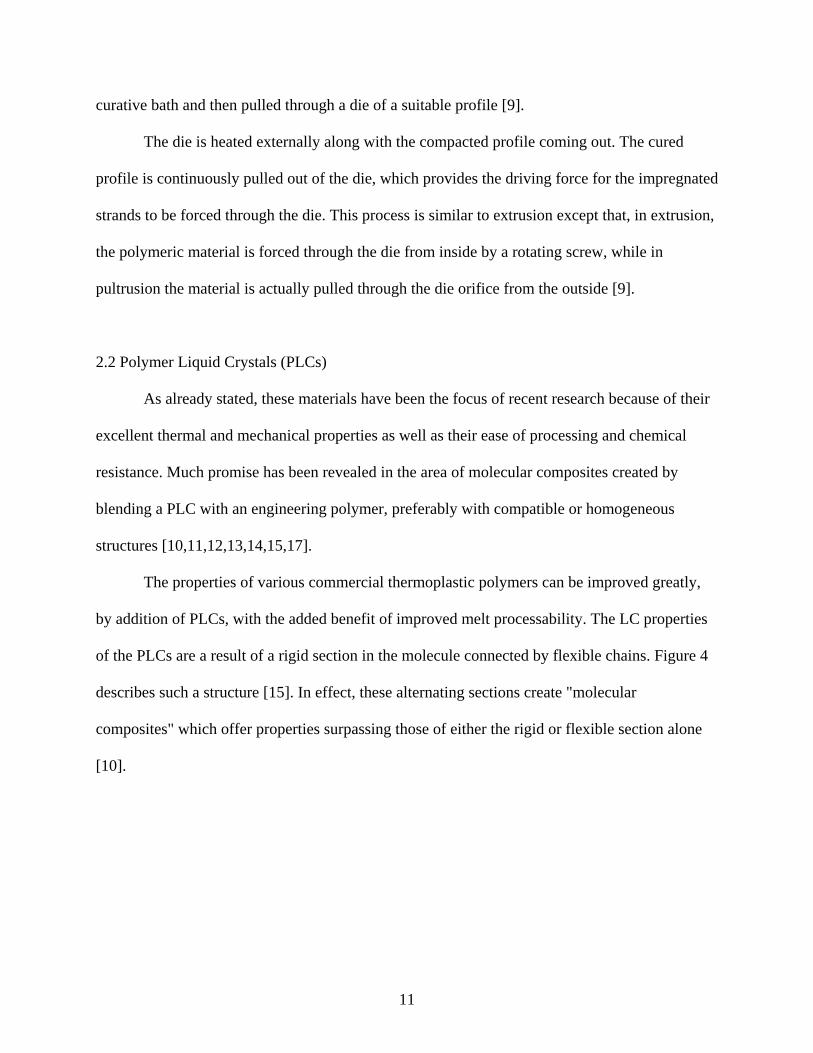
In the previous work done partly at Drexel University, a simpler system of AB + A is was
studied [12], utilizing the PET/xPHB of Jackson and Kuhfuss and adding PET as the engineering
polymer component [10]. The results revealed that both the copolymer and the blend are two
phase systems [12]. Figure 5 shows how structures representing the same overall composition of
PET.PHB differ between copolymer and the blend. Due to the structural differences, the modes
of energy transfer under mechanical load should also differ [15].
Figure 5. A Blend Containing PP + PLC [Ref. 10].
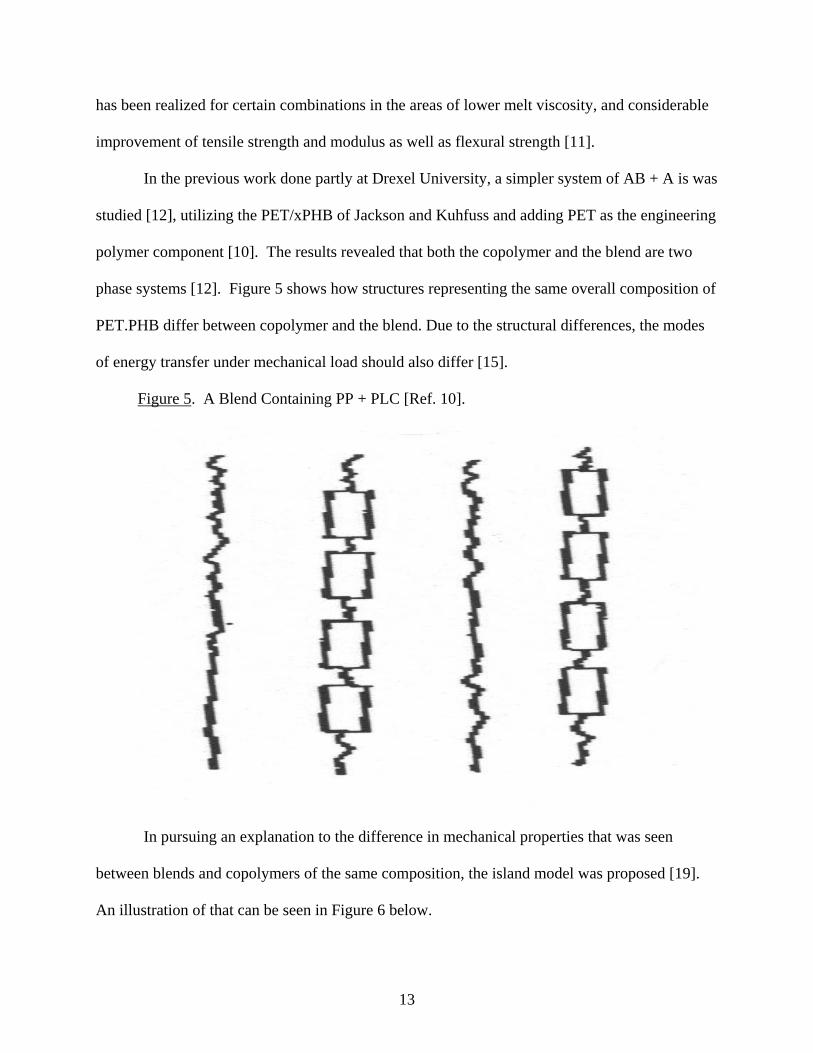
In pursuing an explanation to the difference in mechanical properties that was seen
between blends and copolymers of the same composition, the island model was proposed [19].
An illustration of that can be seen in Figure 6 below.
13

Figure 6. Schematic Cross Section Through a LC Rich Island [Ref. 10].
The PET + PET/xPHB blends exhibit PET-rich and PHB rich areas, due to both thermodynamic
reasons and the affinity that the rigid sections have for each other [10]. This causes the
formation of small LC-rich islands lines of force are able to easily avoid this areas, and to stress
areas of lower modulus (PET-rich areas) [10]. When the concentration of PHB is high enough ,
these islands become so large and numerous that lines of force begin to match those of the pure
copolymer [10]. The mechanical properties of the blends cannot avoid them. The relationship of
the tensile strength for blends vs. the pure copolymer of similar composition is shown in Figure
7.
14

Figure 7. Tensile Strength for PET/0.6PHB System in function of LC Mole
Concentration.
2.2.3 Polypropylene and PLC blends
Polypropylene can be a viable candidate for structural application by blending it with
PLCs. In general, PLC addition to polypropylene provides mechanical reinforcement which is
seen almost linearly increased strength and stiffness with increasing PLC content.
PLC such as PET/0.6PHB blends with polypropylene has been studied as well. Earlier
studies done in our laboratory indicate that the plateau modulus of the blends as well as the
composite is affected by simultaneous molecular reinforcements of polypropylene by the PLC
(PET/0.6PHB) [13]. Figure 8 shows the values increase at low concentrations of PLCs with a
strong negative deviation with regard to the constituents at mid compositions [1].
15
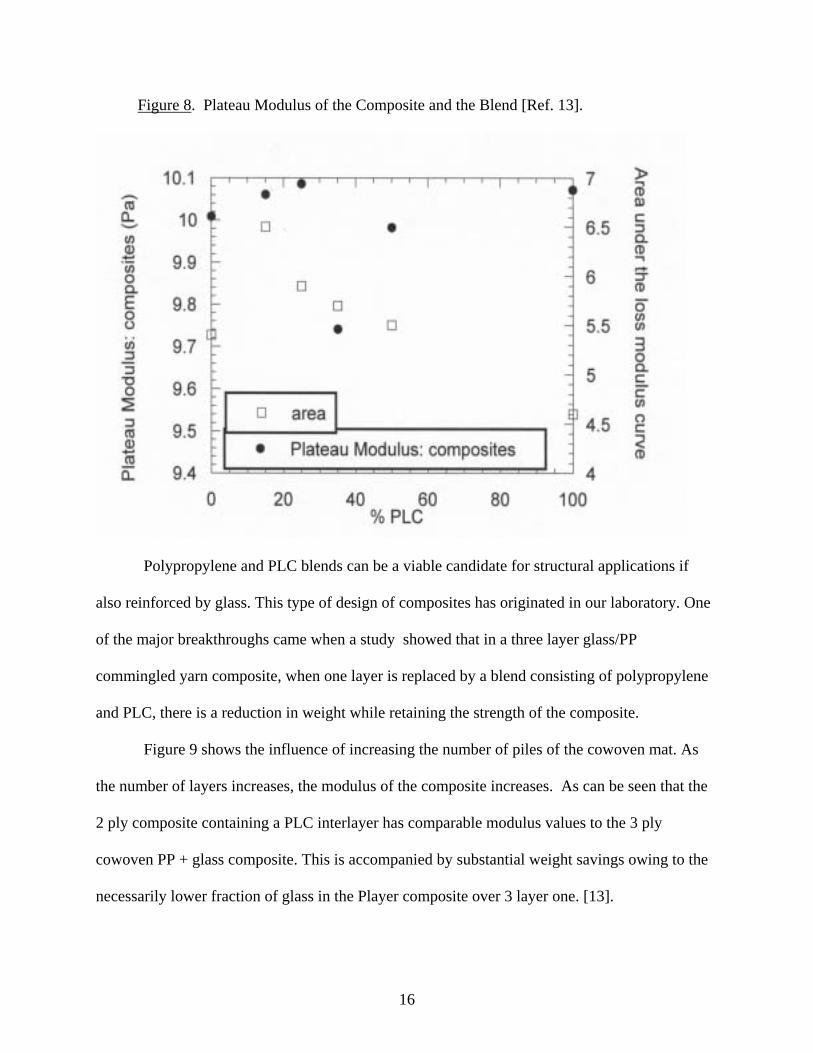
Figure 8. Plateau Modulus of the Composite and the Blend [Ref. 13].
Polypropylene and PLC blends can be a viable candidate for structural applications if
also reinforced by glass. This type of design of composites has originated in our laboratory. One
of the major breakthroughs came when a study showed that in a three layer glass/PP
commingled yarn composite, when one layer is replaced by a blend consisting of polypropylene
and PLC, there is a reduction in weight while retaining the strength of the composite.
Figure 9 shows the influence of increasing the number of piles of the cowoven mat. As
the number of layers increases, the modulus of the composite increases. As can be seen that the
2 ply composite containing a PLC interlayer has comparable modulus values to the 3 ply
cowoven PP + glass composite. This is accompanied by substantial weight savings owing to the
necessarily lower fraction of glass in the Player composite over 3 layer one. [13].
16

Figure 9. Storage Modulus and Loss Modulus of 1, 2 and 3 Ply Composites.
To extend this concept of PP + PLC reinforcement of laminate further, I have studied
systematic reinforcement of 10 layer GFPP composites by PP+PLC blends at various locations
of the beam. These different orientations of the beams are mentioned in section 3.5 of my thesis.
17
CHAPTER 3
EXPERIMENTAL
3.1 Materials
The materials used in this research are the Polymer Liquid Crystal PET/0.6PHB, these
symbols have already been explained, the commercial thermoplastic used as the matrix was
isotatic polypropylene. I also used glass fiber and polypropylene commingled yarn. Table 1
summarizes the materials used in my experiments, including names of companies from which
they were purchased.
Table 1
Materials Used For My Research
Materials Description Supplier
Glass fiber + Polypropylene Cowoven bi-directional mat Vetrotex Certainteed
Wichita Falls , TX
Polypropylene Pellets Rexene corporation
PET/0.6PHB Polymer Liquid Crystal Unitika Corp, Japan
3.2 Chemical Composition (Synthesis of PET/0.6PHB)
The PET/0.6PHB copolymers were originally synthesized by Jackson and Kuhfuss by
polycondensation through the acetate and carbonyl groups [20]. This is a two step process
involved in the preparation of the copolyester: first, cleavage of Poly(ethylene terepthalate) by
p-acetoxybenzoic acid at 275E C in an inert atmosphere, and second, condensation under vacuum
of the carboxyl-terminated and acetate-terminated segments to form the high molecular weight
copolyester.
18
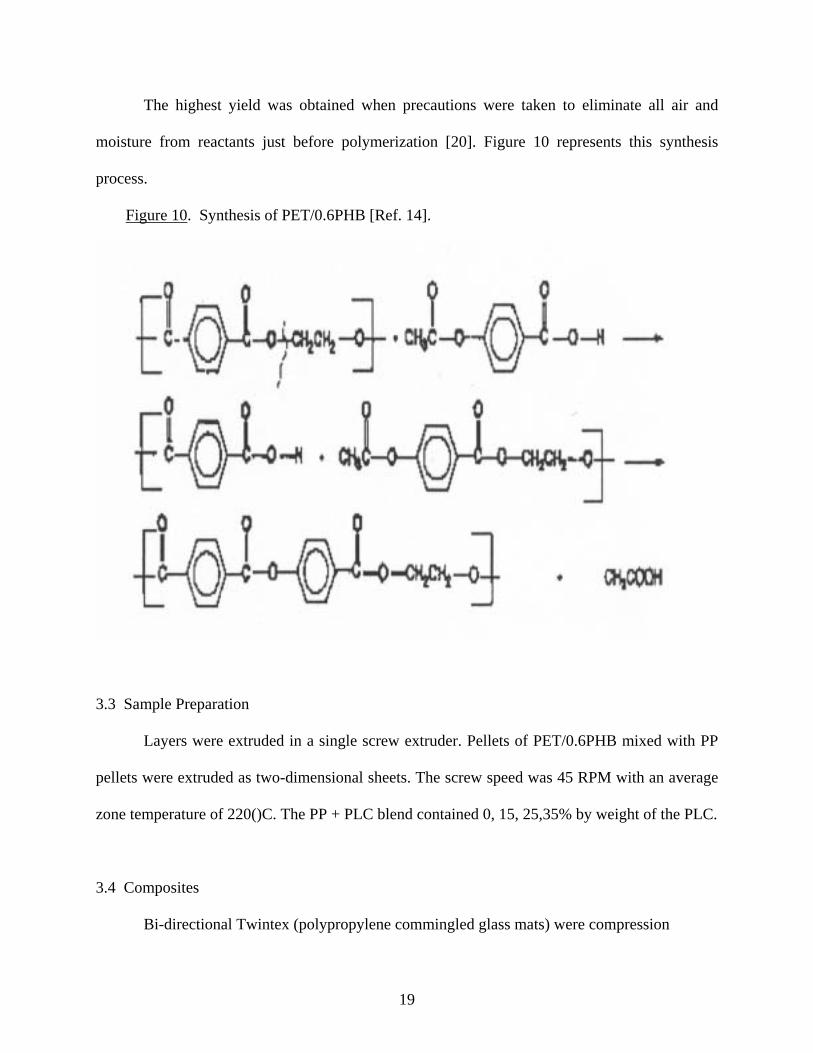
The highest yield was obtained when precautions were taken to eliminate all air and
moisture from reactants just before polymerization [20]. Figure 10 represents this synthesis
process.
Figure 10. Synthesis of PET/0.6PHB [Ref. 14].
3.3 Sample Preparation
Layers were extruded in a single screw extruder. Pellets of PET/0.6PHB mixed with PP
pellets were extruded as two-dimensional sheets. The screw speed was 45 RPM with an average
zone temperature of 220()C. The PP + PLC blend contained 0, 15, 25,35% by weight of the PLC.
3.4 Composites
Bi-directional Twintex (polypropylene commingled glass mats) were compression
19
molded at 180E C under the constant pressure of 3 tons in a 10" x 10" aluminum mold. The
sample was then quenched to room temperature. A band saw cutter according to the ASTM
standards cut molded samples. Subsequently, samples were polished and tested.
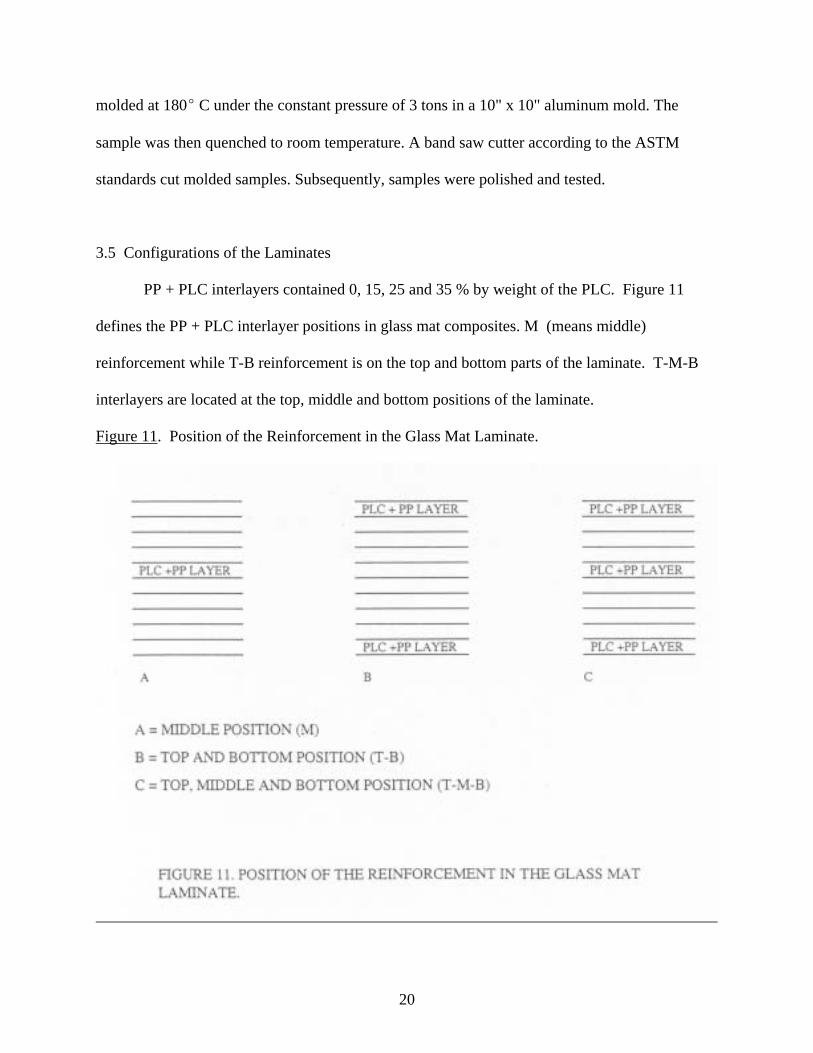
3.5 Configurations of the Laminates
PP + PLC interlayers contained 0, 15, 25 and 35 % by weight of the PLC. Figure 11
defines the PP + PLC interlayer positions in glass mat composites. M (means middle)
reinforcement while T-B reinforcement is on the top and bottom parts of the laminate. T-M-B
interlayers are located at the top, middle and bottom positions of the laminate.
Figure 11. Position of the Reinforcement in the Glass Mat Laminate.
20

3.6 Experimental Procedures
3.6.1 Four-point Bend Test
The 4-point bend test method was used to determine the flexural properties of the
composites. In this test, the specimen rests on two supports and is loaded at two points, each at
an equal distance from the adjacent support point. The distance of the support span in this case is
based on the depth of the sample.
The sample is then loaded by a loading nose, which in this case is taken as 1/3 the
distance of the support span, to allow for largest volume of material subjected to constant
bending moment. Rate of the loading nose motion is c calculated from the following formula:
R= ZL2 / 6d (2)
where L is the length of the support span, d is the depth of the beam and Z is the rate of straining
of the outer fiber, in this case = 0.01. The load on the sample was applied and simultaneously
load strain data was obtained. The apparatus that was used for this test purpose was a NITS
machine having 810-load frame. Figure 12 represents the 4-point bend testing procedure.
21
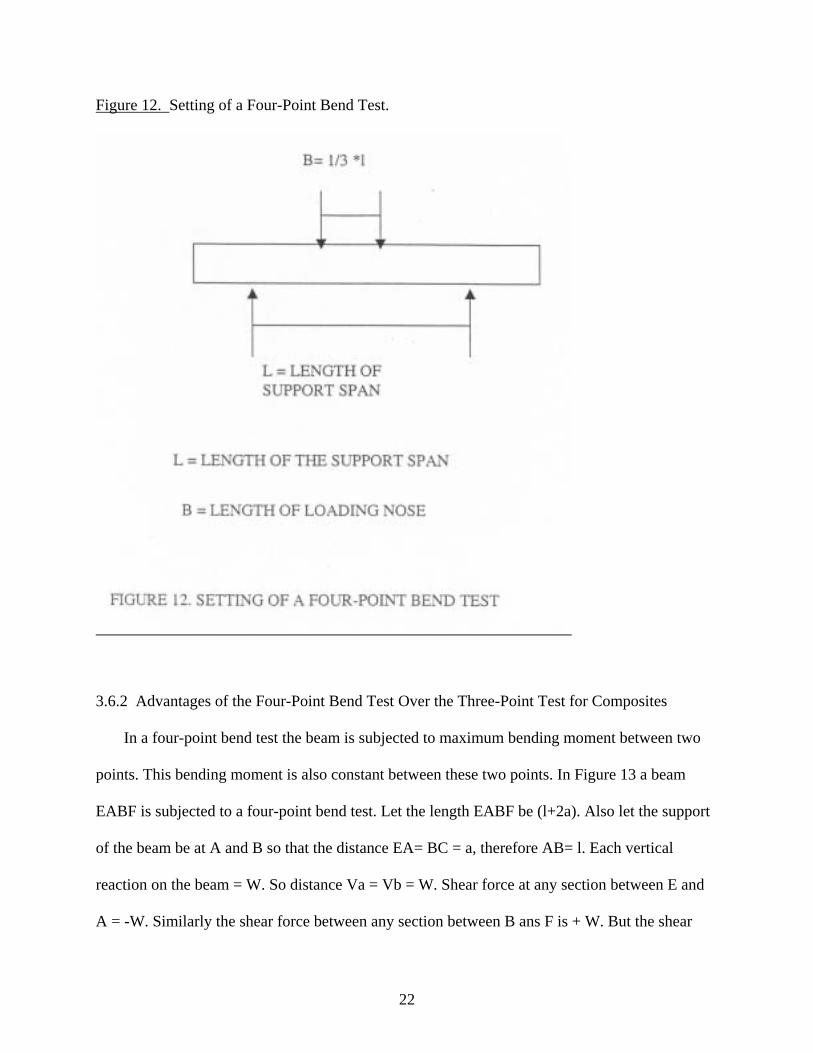
Figure 12. Setting of a Four-Point Bend Test.
3.6.2 Advantages of the Four-Point Bend Test Over the Three-Point Test for Composites
In a four-point bend test the beam is subjected to maximum bending moment between two
points. This bending moment is also constant between these two points. In Figure 13 a beam
EABF is subjected to a four-point bend test. Let the length EABF be (l+2a). Also let the support
of the beam be at A and B so that the distance EA= BC = a, therefore AB= l. Each vertical
reaction on the beam = W. So distance Va = Vb = W. Shear force at any section between E and
A = -W. Similarly the shear force between any section between B ans F is + W. But the shear
22
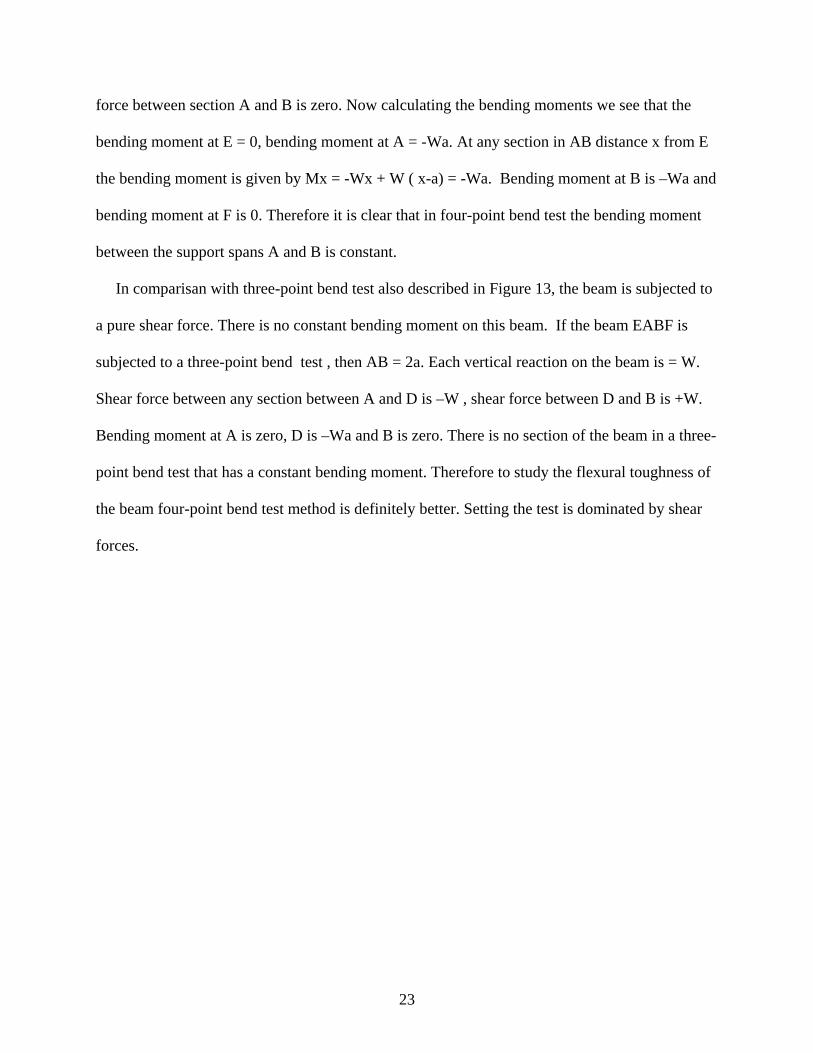
force between section A and B is zero. Now calculating the bending moments we see that the
bending moment at E = 0, bending moment at A = -Wa. At any section in AB distance x from E
the bending moment is given by Mx = -Wx + W ( x-a) = -Wa. Bending moment at B is –Wa and
bending moment at F is 0. Therefore it is clear that in four-point bend test the bending moment
between the support spans A and B is constant.
In comparisan with three-point bend test also described in Figure 13, the beam is subjected to
a pure shear force. There is no constant bending moment on this beam. If the beam EABF is
subjected to a three-point bend test , then AB = 2a. Each vertical reaction on the beam is = W.
Shear force between any section between A and D is –W , shear force between D and B is +W.
Bending moment at A is zero, D is –Wa and B is zero. There is no section of the beam in a three-
point bend test that has a constant bending moment. Therefore to study the flexural toughness of
the beam four-point bend test method is definitely better. Setting the test is dominated by shear
forces.
23
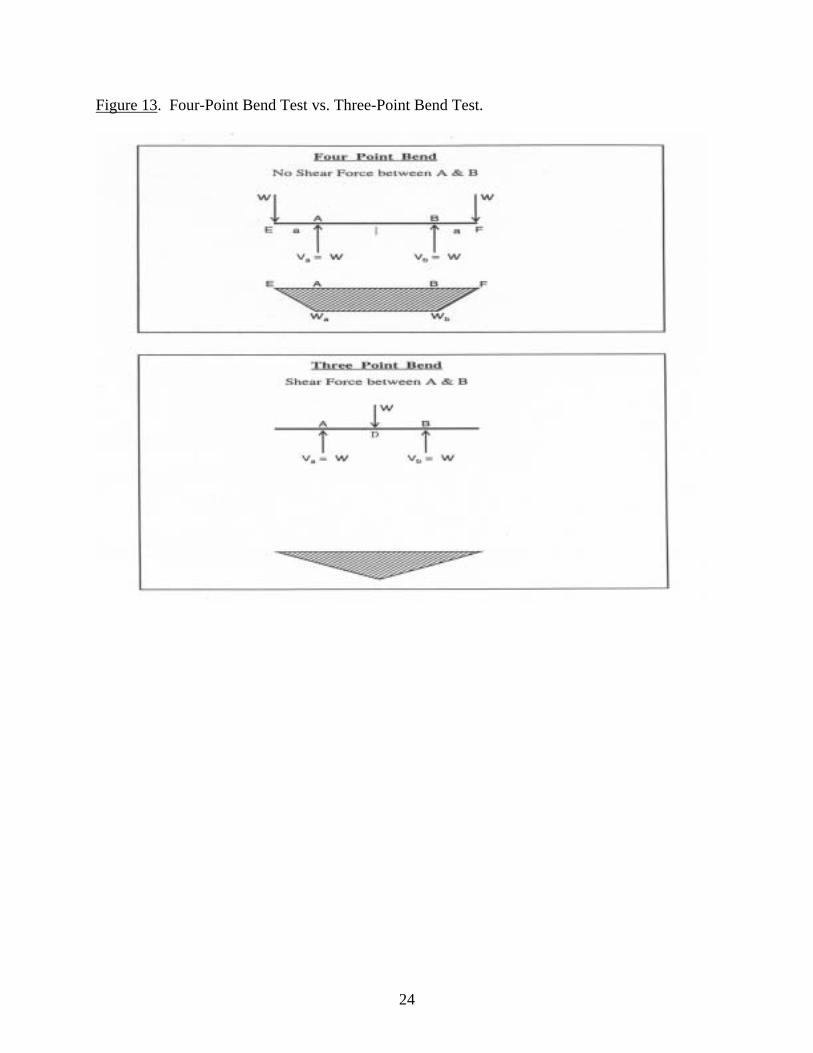
Figure 13. Four-Point Bend Test vs. Three-Point Bend Test.
24
CHAPTER 4
RESULTS AND DISCUSSION
4.1 Maximum Fiber Stress vs. Weight Percent PLC
When a beam is loaded in flexion at two central points and supported at two outer points,
the maximum stress in the outer fibers occurs between the two central loading points that defines
the load span; see Figure 13. This stress may be calculated for any point on the load-deflection
curve for relatively small deflections, by the following equation for a load span which is one-
third of the support span:
S = PL/bd2 (3)
where
S = stress in the outer fiber throughout the load span, N/m2
P = load at a given point on the load -deflection curve, N(Newtons)
I = support span in m (meters)
b = width of the beam in m (meters)
d = depth of the beam
4.2 Maximum Fiber Stress vs. Weight % PLC (M Layer Reinforcement)
In Figure 14 the maximum fiber stress of the beam increases as the PLC content in the
blend increases. The maximum value of this stress occurs for the sample containing 25 % weight
PLC. There is a sharp decline of the stress value for higher PLC concentrations.
25
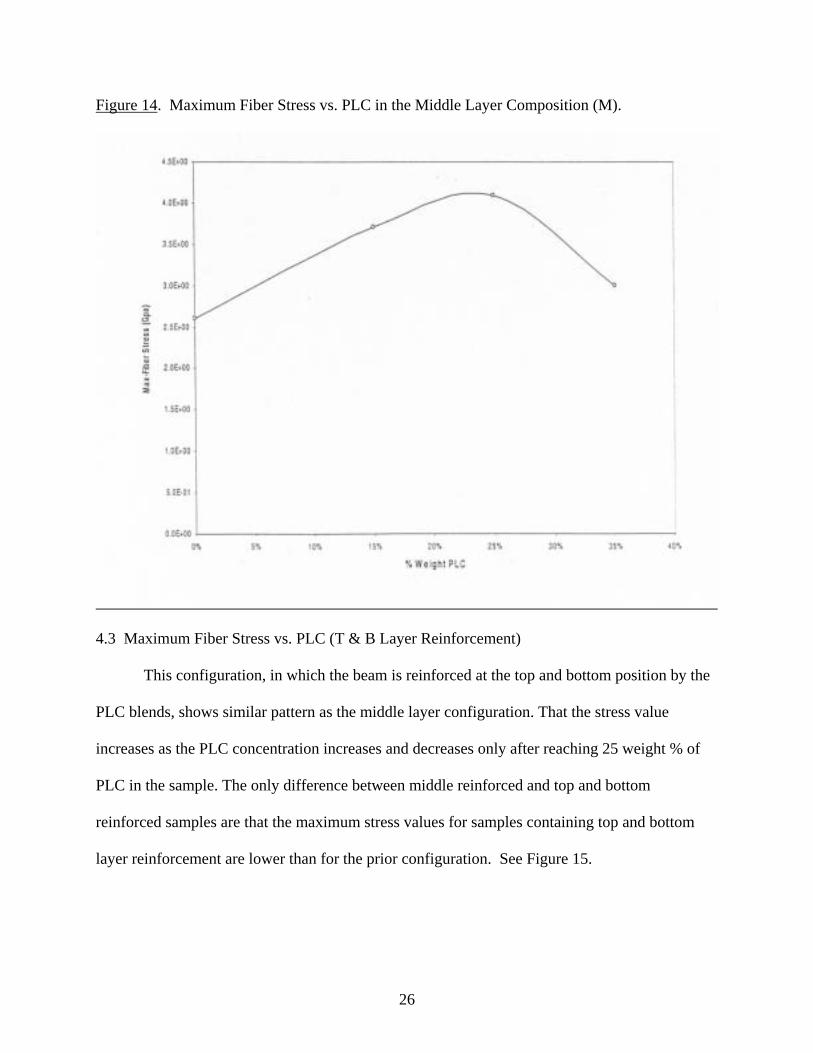
Figure 14. Maximum Fiber Stress vs. PLC in the Middle Layer Composition (M).
4.3 Maximum Fiber Stress vs. PLC (T & B Layer Reinforcement)
This configuration, in which the beam is reinforced at the top and bottom position by the
PLC blends, shows similar pattern as the middle layer configuration. That the stress value
increases as the PLC concentration increases and decreases only after reaching 25 weight % of
PLC in the sample. The only difference between middle reinforced and top and bottom
reinforced samples are that the maximum stress values for samples containing top and bottom
layer reinforcement are lower than for the prior configuration. See Figure 15.
26
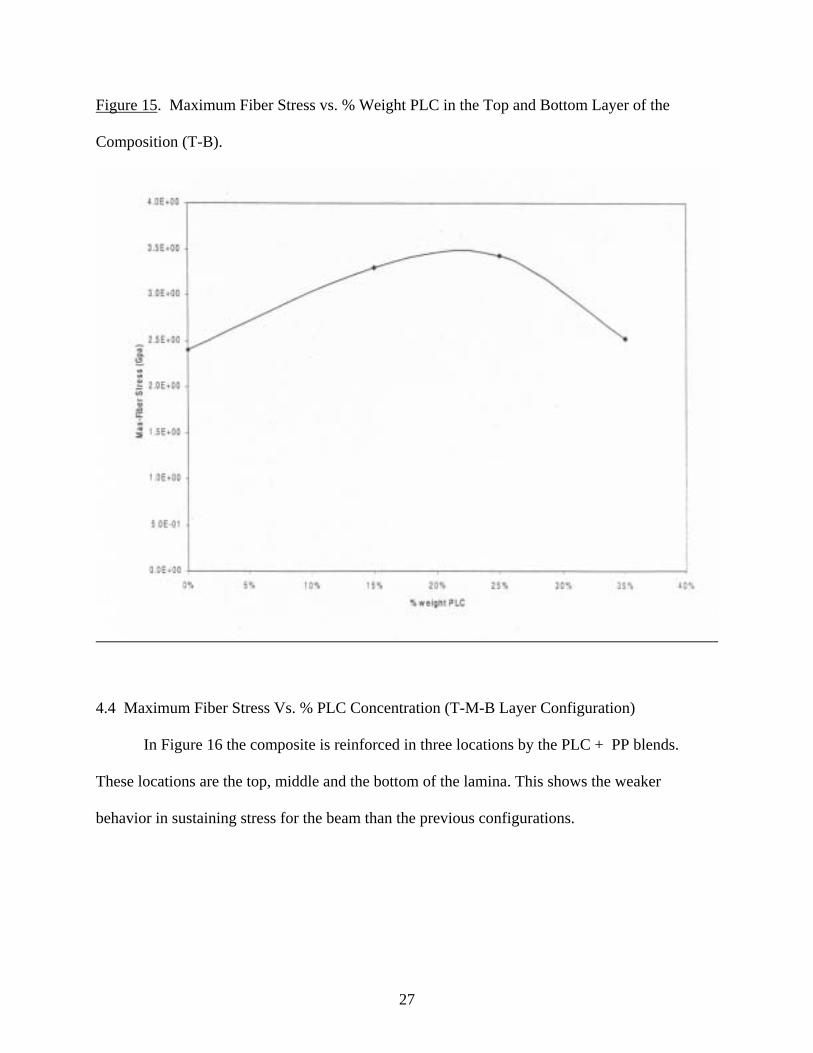
Figure 15. Maximum Fiber Stress vs. % Weight PLC in the Top and Bottom Layer of the
Composition (T-B).
4.4 Maximum Fiber Stress Vs. % PLC Concentration (T-M-B Layer Configuration)
In Figure 16 the composite is reinforced in three locations by the PLC + PP blends.
These locations are the top, middle and the bottom of the lamina. This shows the weaker
behavior in sustaining stress for the beam than the previous configurations.
27
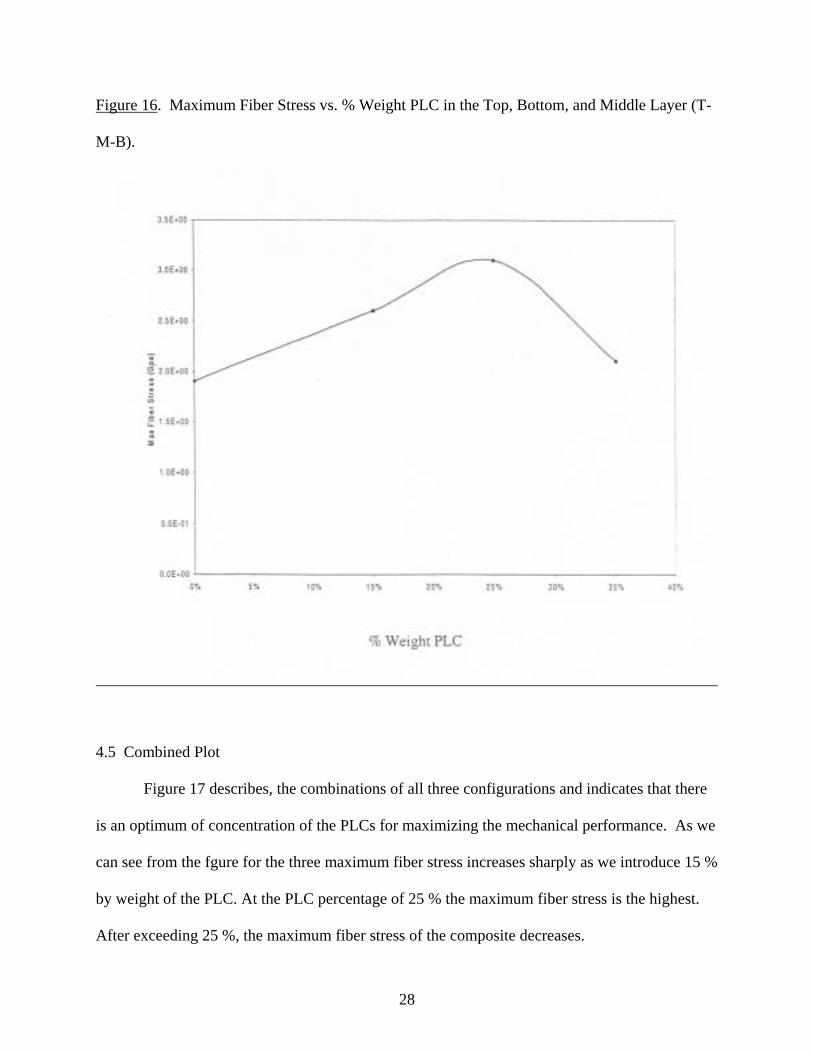
Figure 16. Maximum Fiber Stress vs. % Weight PLC in the Top, Bottom, and Middle Layer (T-
M-B).
4.5 Combined Plot
Figure 17 describes, the combinations of all three configurations and indicates that there
is an optimum of concentration of the PLCs for maximizing the mechanical performance. As we
can see from the fgure for the three maximum fiber stress increases sharply as we introduce 15 %
by weight of the PLC. At the PLC percentage of 25 % the maximum fiber stress is the highest.
After exceeding 25 %, the maximum fiber stress of the composite decreases.
28
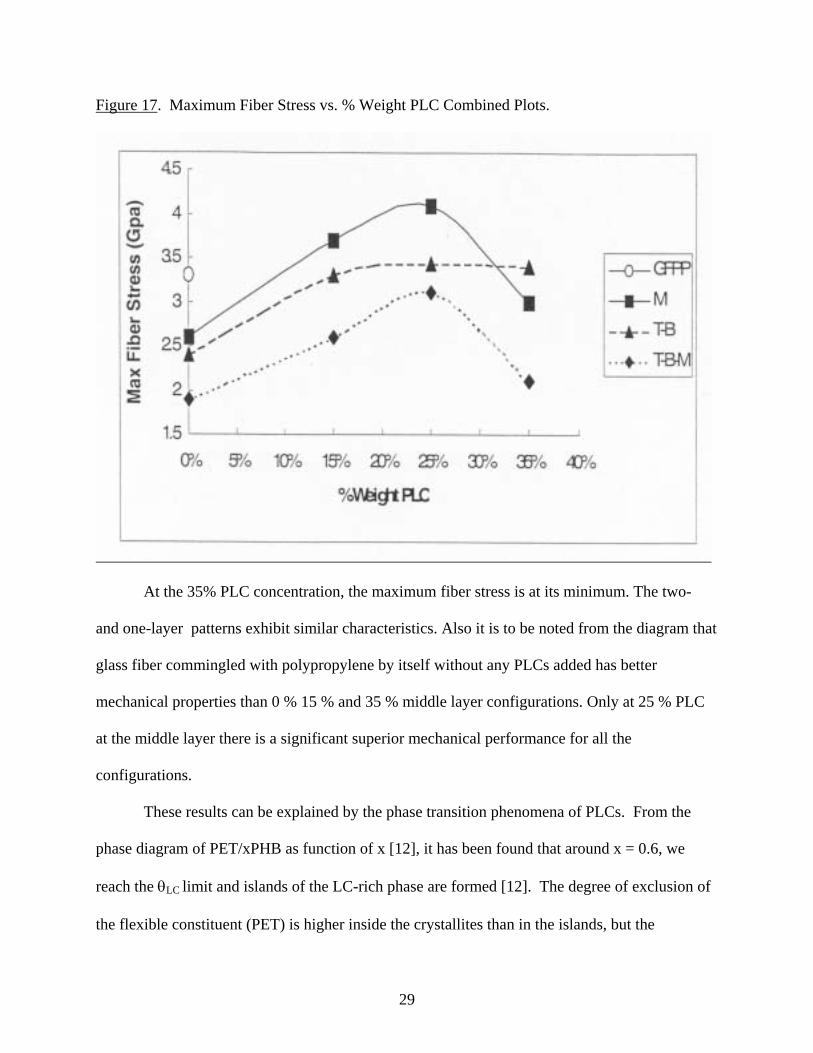
Figure 17. Maximum Fiber Stress vs. % Weight PLC Combined Plots.
At the 35% PLC concentration, the maximum fiber stress is at its minimum. The two-
and one-layer patterns exhibit similar characteristics. Also it is to be noted from the diagram that
glass fiber commingled with polypropylene by itself without any PLCs added has better
mechanical properties than 0 % 15 % and 35 % middle layer configurations. Only at 25 % PLC
at the middle layer there is a significant superior mechanical performance for all the
configurations.
These results can be explained by the phase transition phenomena of PLCs. From the
phase diagram of PET/xPHB as function of x [12], it has been found that around x = 0.6, we
reach the θLC limit and islands of the LC-rich phase are formed [12]. The degree of exclusion of
the flexible constituent (PET) is higher inside the crystallites than in the islands, but the
29
connectedness also produces increasing PHB concentrations in the matrix along with increasing
overall PLC contents [12].
We see that for x < θLC the LC component (PHB sequences in PET/0.6PHB) in the
interlayer provides reinforcement to PP. The newly formed islands only disturb the structure of
PP matrix (due to limited solubility of the PLC in PP) [12]. Hence the significant lowering of the
maximum fiber stress of the 35 % weight containing composite.
The present results indicate that reinforcing the glass + PP composites by micro-
mechanical means through the interlayers can be interpreted through lamina lay-up analysis. Let
us now take into consideration that a beam in bending experiences maximum normal, tensile and
compressive stress at the outer layers and maximum shear stresses in the middle.
For composites, failure occurs through transverse and shear and normal modes. Thus,
reinforcing the outer layers with a weaker interlayer results in lowering the sustainable maximum
fiber stresses compared to the base non-reinforced material.
Second, the reinforcing lamina with a middle layer shows maximum fiber stress for a
given composition of interlayer. It becomes apparent from the results of the top middle-bottom
reinforced composite that failure originates from the outer fiber layers. Failures at outer layers
dominate fracture and represent the limit to property improvements for the composites
investigated in this work.
4.6 Optical Microscope Analysis
The mismatch between the elastic moduli and angles between the layers of a laminated
composite creates interlaminar stresses in the material. These stresses--which are both normal
and shear--can be high enough to cause delamination between the layers [16]. Delamination
30
ultimately reduces the life of a laminated structure.
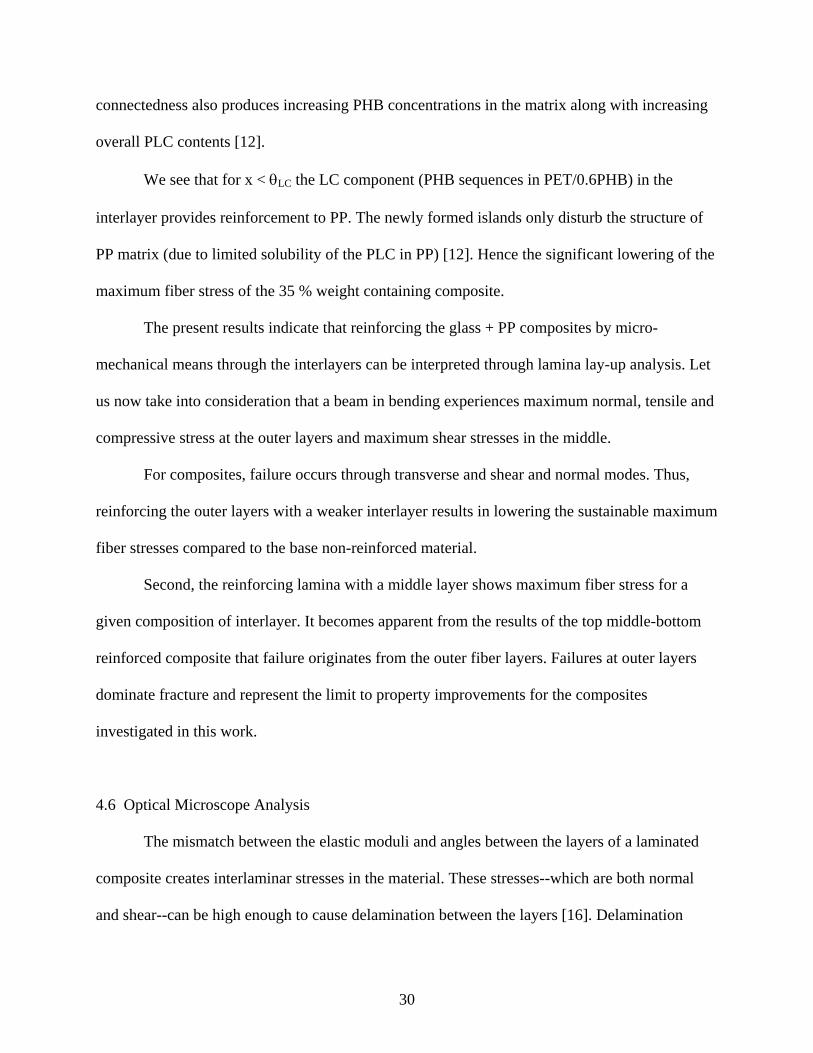
Using optical microscopy, I have studied the delamination and the crack propagation of
our composite surfaces. In Figure 18, theoretical interlaminar shear and normal stresses are
plotted as a function of normalized distance, zero at the center line and one at the free edge, from
the center line of a [ " 45 ]s graphite/epoxy laminate [16].
Figure 18. Normal and Shear Stresses at the Interface of Bottom Surface of Top Ply in a 4-Ply
Laminate [Ref. 17].
Away from the edges these stresses are the same however, near the edges the normal
shear stress τxy decreases to zero, while the out of the plane shear stress τxz (not seen) becomes
infinite. In a simple state of stress on the angle ply laminate, the classical lamination theory
predicts nonzero values for the stresses σxx, σyy and τxy for each ply [16]. However is not true at
31
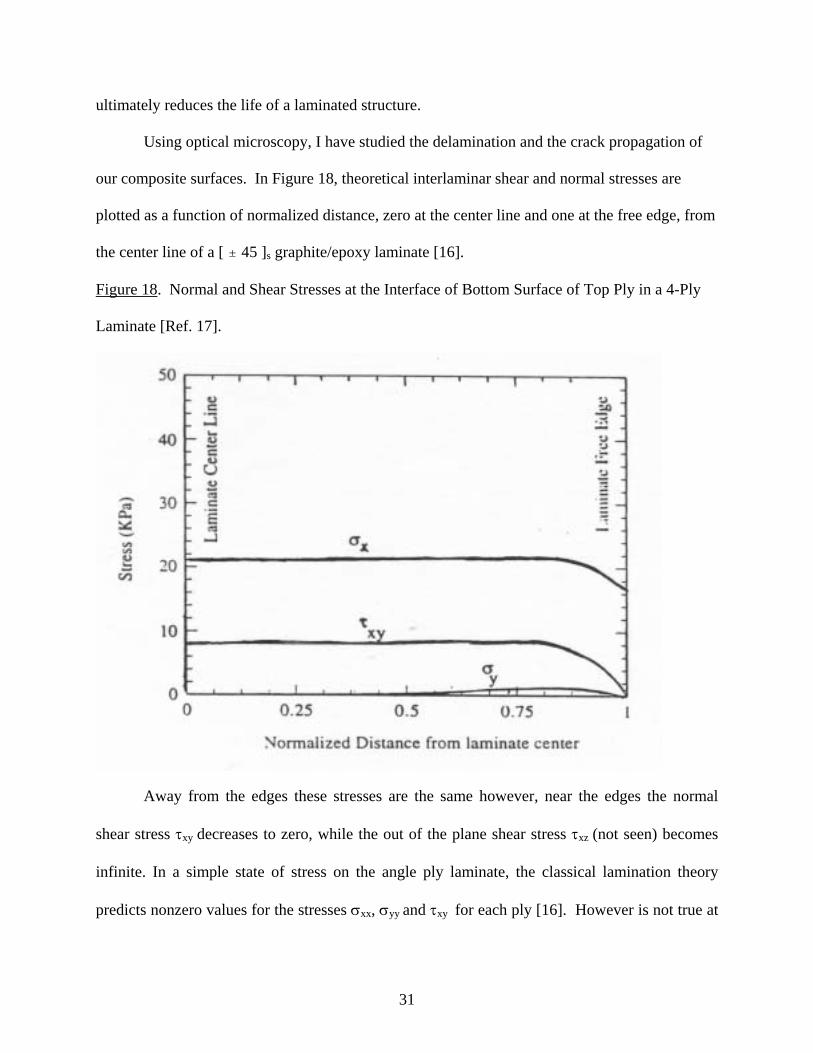
the edges, where σy and τxy are actually zero and normal stress σx is high as they are free
boundaries. Figure 19 shows the normal stress and shear stress components on a composite.
Figure 19. Normal Stress and Shear Stress Components.
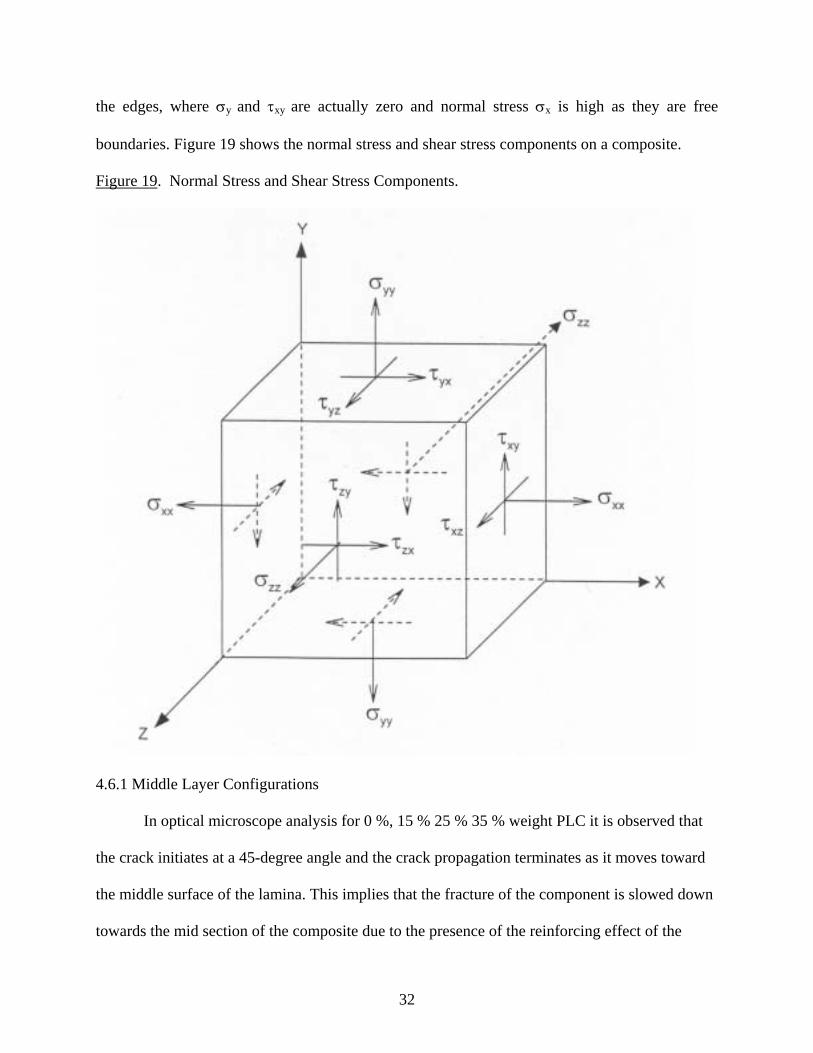
4.6.1 Middle Layer Configurations
In optical microscope analysis for 0 %, 15 % 25 % 35 % weight PLC it is observed that
the crack initiates at a 45-degree angle and the crack propagation terminates as it moves toward
the middle surface of the lamina. This implies that the fracture of the component is slowed down
towards the mid section of the composite due to the presence of the reinforcing effect of the
32
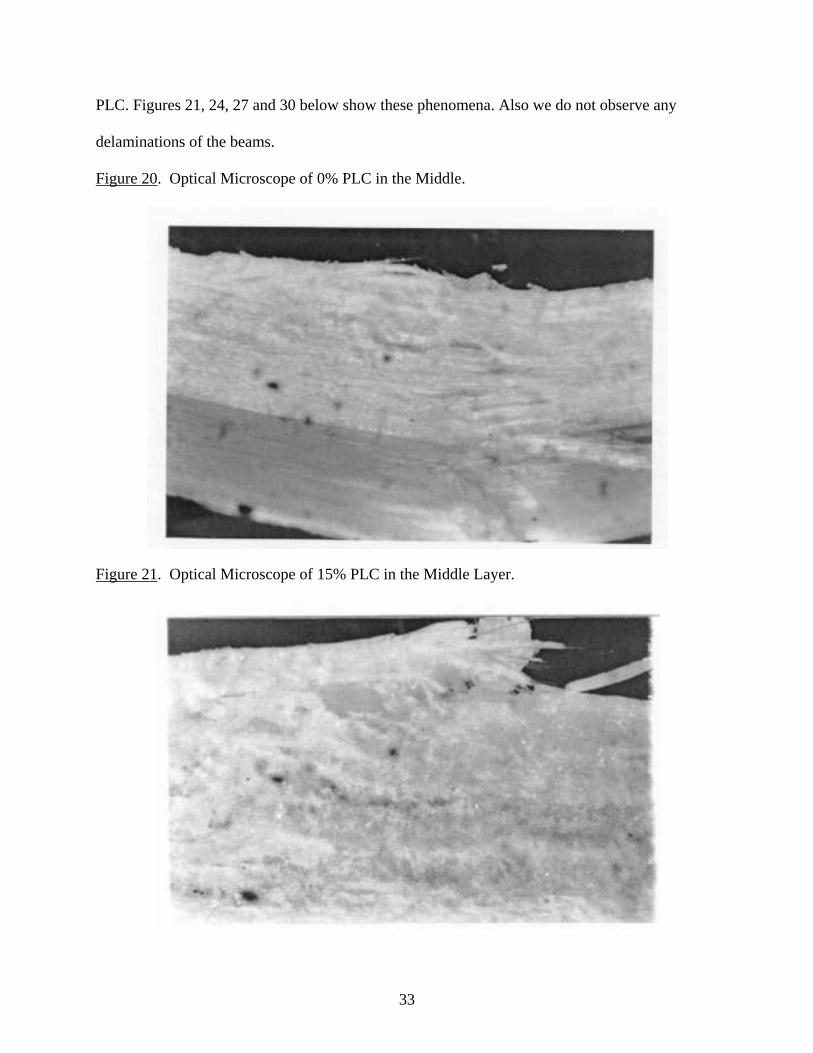
PLC. Figures 21, 24, 27 and 30 below show these phenomena. Also we do not observe any
delaminations of the beams.
Figure 20. Optical Microscope of 0% PLC in the Middle.
Figure 21. Optical Microscope of 15% PLC in the Middle Layer.
33
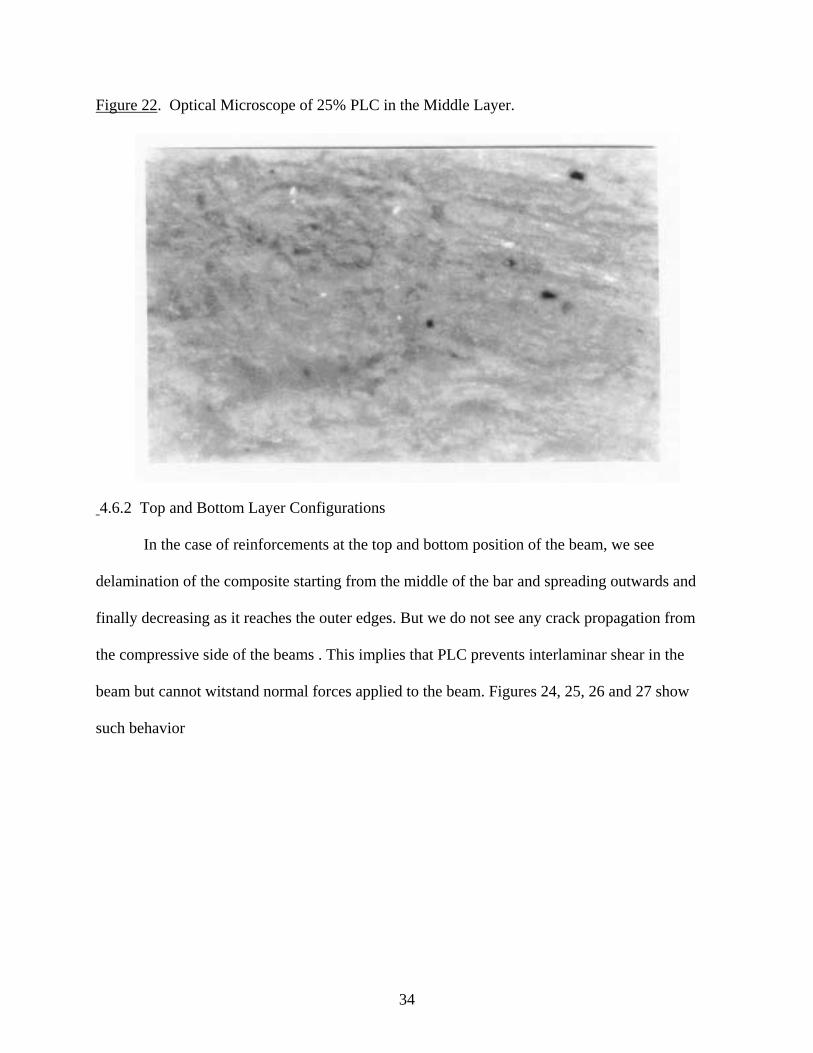
Figure 22. Optical Microscope of 25% PLC in the Middle Layer.
4.6.2 Top and Bottom Layer Configurations
In the case of reinforcements at the top and bottom position of the beam, we see
delamination of the composite starting from the middle of the bar and spreading outwards and
finally decreasing as it reaches the outer edges. But we do not see any crack propagation from
the compressive side of the beams . This implies that PLC prevents interlaminar shear in the
beam but cannot witstand normal forces applied to the beam. Figures 24, 25, 26 and 27 show
such behavior
34
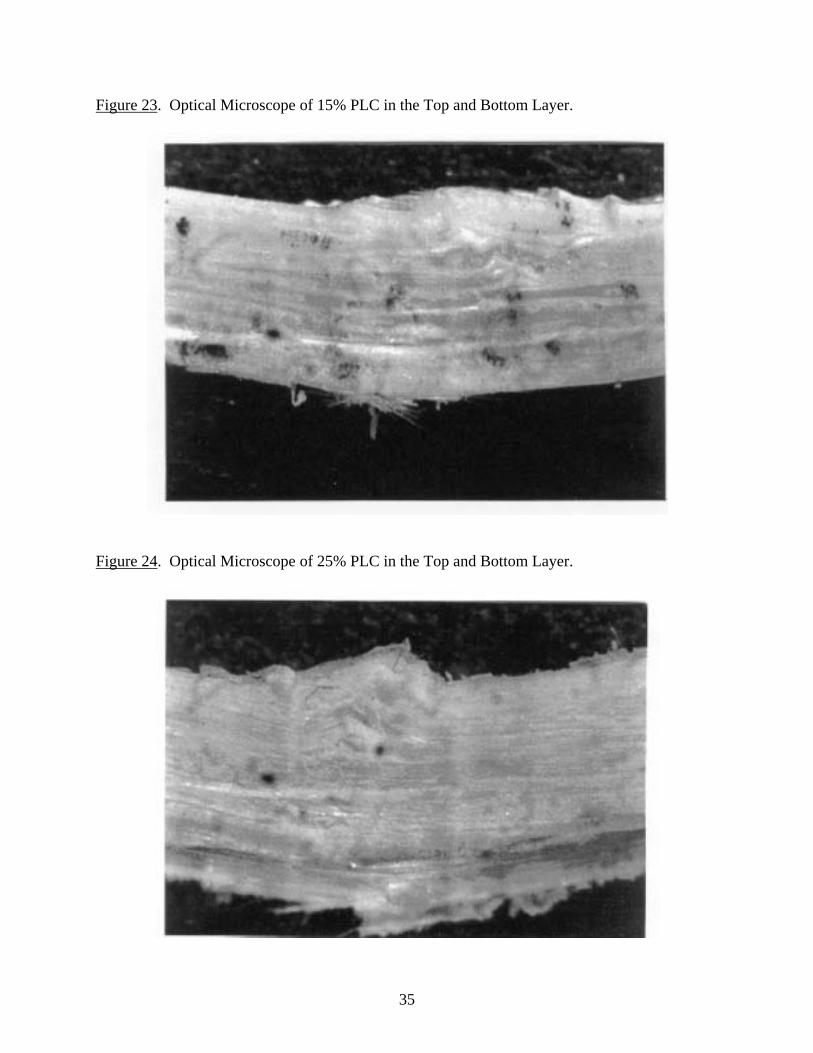
Figure 23. Optical Microscope of 15% PLC in the Top and Bottom Layer.
Figure 24. Optical Microscope of 25% PLC in the Top and Bottom Layer.
35
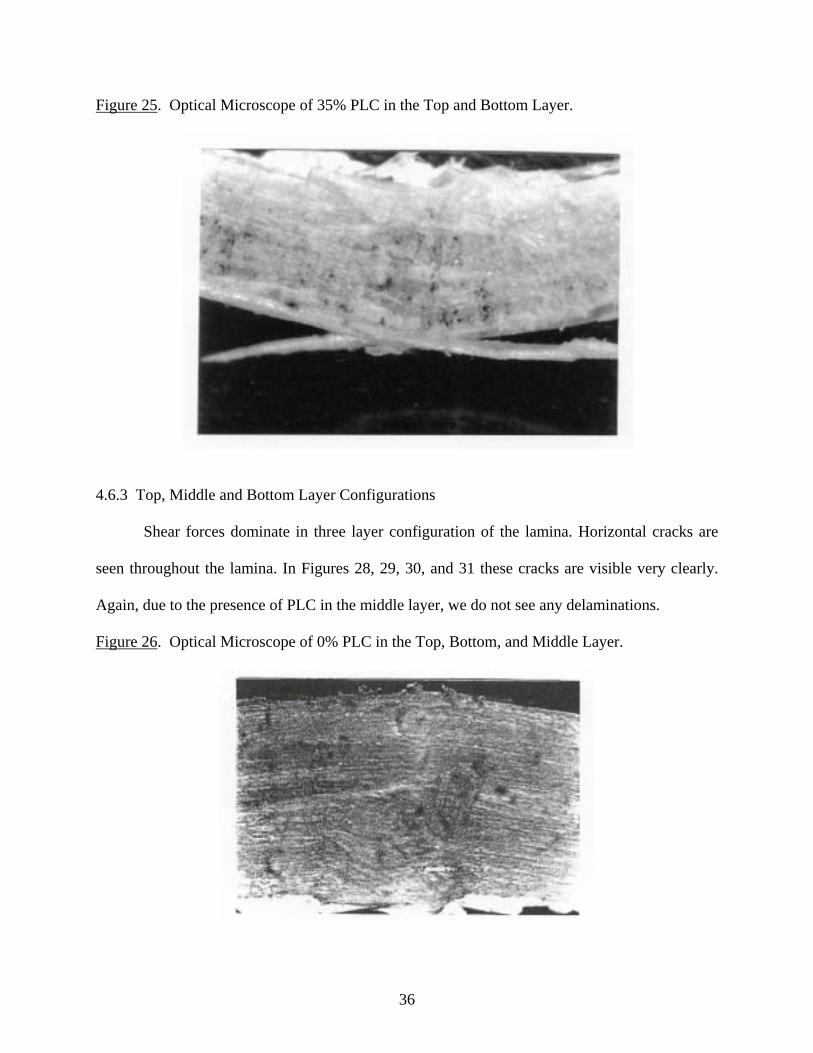
Figure 25. Optical Microscope of 35% PLC in the Top and Bottom Layer.
4.6.3 Top, Middle and Bottom Layer Configurations
Shear forces dominate in three layer configuration of the lamina. Horizontal cracks are
seen throughout the lamina. In Figures 28, 29, 30, and 31 these cracks are visible very clearly.
Again, due to the presence of PLC in the middle layer, we do not see any delaminations.
Figure 26. Optical Microscope of 0% PLC in the Top, Bottom, and Middle Layer.
36
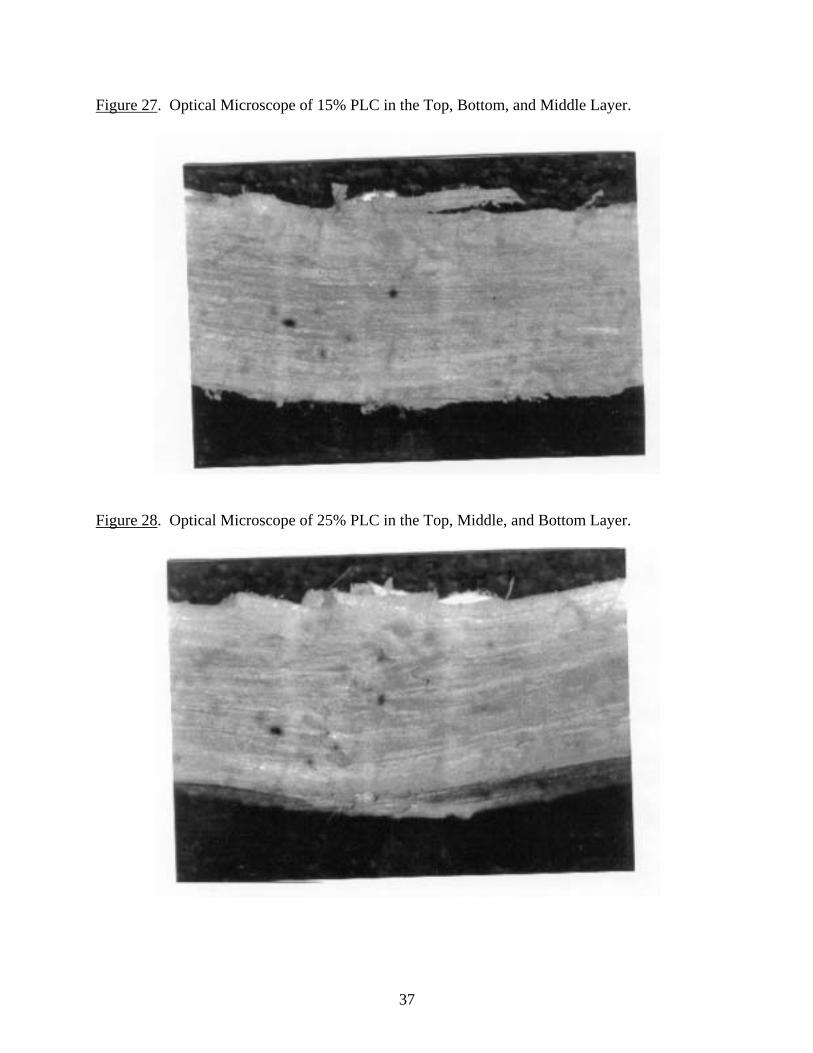
Figure 27. Optical Microscope of 15% PLC in the Top, Bottom, and Middle Layer.
Figure 28. Optical Microscope of 25% PLC in the Top, Middle, and Bottom Layer.
37

Figure 29. Optical Microscope of 35% PLC in the Top, Bottom, and Middle Layer.
38
CHAPTER 5
CONCLUSIONS
It is important to realize that in comparing macroscopic reinforcement (glass-fibers) to
the molecular reinforcement (PLCs) we have synergically obtained the benefits of higher
modulus of the former and lower specific weight of the latter. By increasing the number of piles
in the cowoven mat, we can increase the modulus of the material.
To expand on this idea more, I have strategically placed extruded PP + PLC blends in the
middle, top and bottom and top, bottom and middle position of the composite. The present
results indicate that at a relatively low PLC concentration in the middle layer configuration we
obtain the best results.
The improvement can be explained by the fact that, a beam in bending experiences
maximum tensile and compressive stresses at the outer edges due to normal forces and maximum
shear force at the middle section of the beam. By reinforcing, the middle layer with a low PLC
concentration one mitigates the shear stress effects on the component. By contrast, reinforcing
outer edges by PLCs causes delamination to the composite.
Optical microscopy shows that only in the mid-layer reinforced composition there is no
delamination in the beam. In this laminate the crack propagates from the outer edges into the
beam and is significantly weakened as it extends towards the middle. This implies that PLC
prevents delamination when it is used as the reinforcement at the mid section of the beam. It also
reduces crack propagations at the outer edges of the beam. However PLC does not perform well
when normal forces are applied to the beam in a four–point bend test configuration.
39
REFERENCES
1. Mallick, P. K. (1996). Fiber-Reinforced Composites: Materials, Manufacturing and Design (Ed.). New York: Marcel Dekker.
2. Maswood, S., Brostow, W., D’Souza, N. A. (1988). Polymer Liquid Crystal (PLC) + Polypropylene interlayers in polypropylene + glass fiber composite: mechanical properties. Antec Paper, 1996.
3. Karger-Kocsis, J. Polypropylene: An A-Z reference. J. Karger-Kocsis (Ed.). London: Kluwer Academic Publishers.
4. Hamada, H., Maekawa, Ikegawa, Z.I. (1993). Influence of the impregnating property on mechanical properties of commingled yarn composites. Polymer Composites, 14, 308-313.
5. Van West, B.P., Pipes, RIB and Advani, B.G. (1991). The consolidation of commingle thermoplastic fabrics. Polymer Composites, 12, 417-427.
6. Svensson, N., Shishoo I, and Gilchrist, M. (1998). Manufacturing of thermoplastic composites from commingled yarns-a review. J. Thermoplast. Composite Mater, 11, 22-56.
7. Guiliano D. (1995). Twintex, a material for the composite industry. Personal communication at IVW in 1996.
8. Ostgathe, M., Breuer, U., Mayer, C. and Neitzel (1996). Fabric reinforced thermoplastic composites-Processing and Manufacturing, Proceedings of the European Conference on Composite Materials ECCM-7, (Vol. 1, pp. 195-200), M Bader (Ed.), London: Woodhead Publishing.
9. Gowariker, V. R., Viswanathan, N. V., Sreedhar, J. (1997). Polymer Science, New Delhi: New Age International Limited Publishers.
10. Saboe, S. H. Jr, (1988). Materials Engineering Senior Thesis, Drexel University, Philadelphia, PA.
11. Kiss, G. (1987). In-situ Composites: Blends of Isotropic Polymers and Thermotropic Liquid Crystalline Polymers. Polymer Engineering & Science. 27, 410-414.
12. Brostow, W., Hess, M., and Lopez, B.L. (1994). Macromolecules, 27, 2262.
13. Own, C., Seader, D., D’Souza, N. A., Brestow, W. (1998). Cowoven Polypropylene/Glass Composites with Polypropylene + Polymer Liquid Crystal Interlayers: Dynamic mechanical and thermal analysis.
14. Lopez, B. (1994). Ph.D Dissertation, University of North Texas, Denton, TX.
40
15. Brostow, W. (1985). Science of Materials Malabar, Florida: Robert E. Krieger.
16. Kaw, A. K. (1997). Mechanics of Composite Materials New York: CRC Press.
17. Brostow, W., Sterzynski, T., Triouleye, S. (1996). Polymer, 37, 1561.
18. Browstow, W. (1996). Physical Properties of Polymer Handbook, Mark, J. E. (Ed.), New York: American Institute of Physics Press, Woodburry.
19. Browstow, W., Dziemianowica, T.S., Romanski, J., Werber, W. (1988). Polymer Engineering Science 28, 785.
20. Jackson, Jr., W. J. Kuhfuss, (1976). Polymer Science Physics, 14, 2043.
41