polymer optimization for centrifuge dewatering - cwea polymer optimization for... ·...
TRANSCRIPT

POLYMER OPTIMIZATION FORCENTRIFUGE DEWATERINGCENTRIFUGE DEWATERING
CWEA SeminarMath, Operations, and Maintenance for
Biosolids Systems
Steve Walker
September 13, 2011
Senior Operations Specialist
sw51
0s1.
pptx
/1

Learning Objectives• Why optimize
• Dewatering basics
• Centrifuge basics• Centrifuge basics
• Polymer considerations
• Sludge considerations
• Optimization approach
P tti ti i ti i ti
sw51
0s1.
pptx
/2
• Putting optimization in action

DewateringSludge Dewatering • The removal of a portion of the water contained in sludge
by means of a filter press, centrifuge, or otherby means of a filter press, centrifuge, or other mechanism.
Process optimizationProcess optimization • The discipline of adjusting a process so as to optimize a
set of parameters without violating a constraint
• The most common goals are minimizing cost, maximizing throughput, and/or efficiency
• The goal is to maximize one or more of the process paramrters, while keeping all others within their constraints
sw51
0s1.
pptx
/3
constraints

WHY OPTIMIZEWHY OPTIMIZE
sw51
0s1.
pptx
/4

Polymer Costs
57%57%
sw51
0s1.
pptx
/5
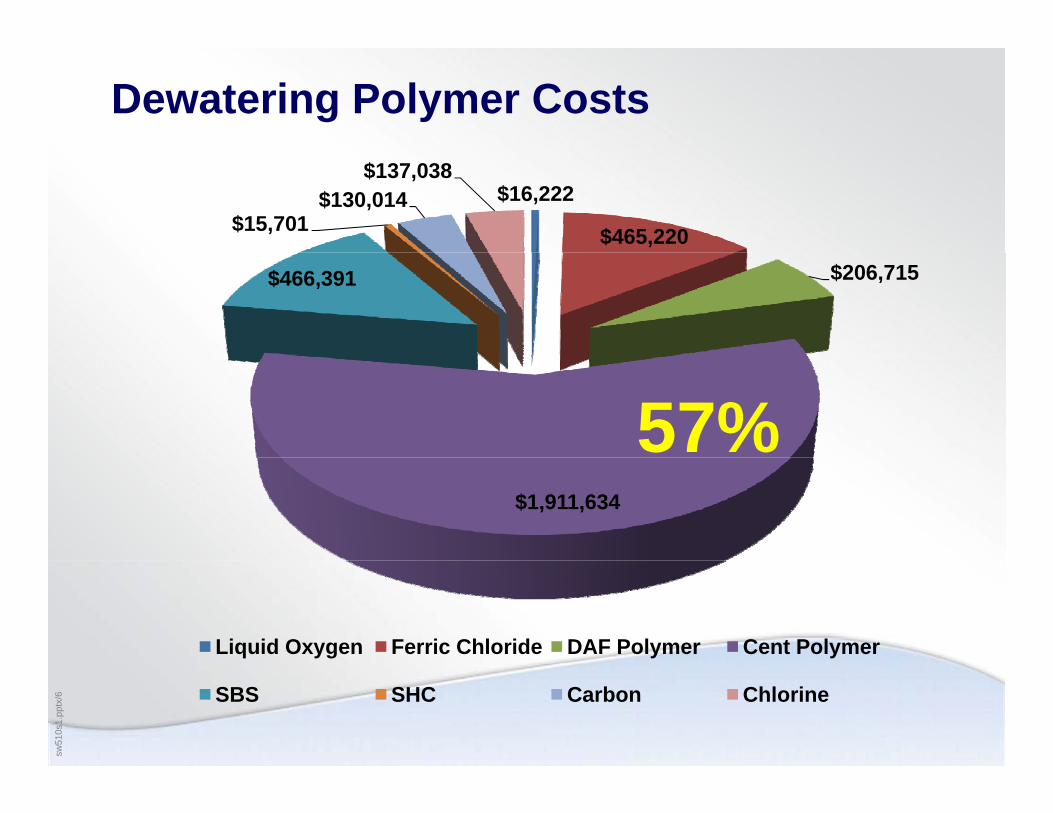
Dewatering Polymer Costs
$16,222
$465,220 $15,701 $130,014
$137,038
$206,715 $466,391
57%$1,911,634
Liquid Oxygen Ferric Chloride DAF Polymer Cent Polymer
sw51
0s1.
pptx
/6 SBS SHC Carbon Chlorine

Polymer – Raw Material Costs40
20
25
30
35
ntag
e Ch
ange
Producer Price Index for Plastics Material and Resins Manufacturing
Source: Bureau of Labor Statistics http://stats.bls.gov/ppi
5
10
15
20
Mont
hly P
erce
Index includes:PropyleneAcrylonitrileEpichlorhydrinMethyl acrylateMethyl methacrylateFormaldehyde
0
Month
6
4
5 US No. 2 DieselRetail Sales
1
2
3
sw51
0s1.
pptx
/7
01/1/2001 1/1/2002 1/1/2003 1/1/2004 1/1/2005 1/1/2006 1/1/2007 1/1/2008 1/1/2009 1/1/2010 1/1/2011
$/gal

DEWATERINGDEWATERING
sw51
0s1.
pptx
/8

Dewatering Considerations
• Centrifuge components
• Centrifuge adjustments
• Operational targets• Operational targets
• Throughput
• Sludge makeup
sw51
0s1.
pptx
/9

Water in SludgeGallons of Water in 10 tons of Sludge
600 000
500,000
600,000
er
300,000
400,000
ns o
f Wat
e
100,000
200,000
Gal
lo
Focus Area
0
1 3 5 7 9 11 13 15 17 19 21 23 25 27 29 31 33 35
Percent Solids
sw51
0s1.
pptx
/10
Percent Solids

Centrifuge Components
Sludge Feed Weir PlatesScrollBowl
SIEBTECHNIK GmbH
sw51
0s1.
pptx
/11
Solids DischargeLiquid Discharge

Centrifuge FactorsBowl speed
Adj t d th h th PLC• Adjusted through the PLC
• The faster the speed, the greater the shear f t fl l t d l dfactor on flocculated sludge
• Can impact cake dryness, centrate quality, and polymer dose
sw51
0s1.
pptx
/12

Centrifuge FactorsConveyor (scroll) speed
• Controlled by the PLC• Controlled by the PLC
• Modern centrifuges are controlled using a %torque setpoint%torque setpoint
• To obtain the desired torque, the PLC adjusts th ll dthe scroll speed
• Can impact cake dryness, centrate quality, and polymer dose
sw51
0s1.
pptx
/13

Centrifuge FactorsDifferential
Th diff b t th b l d d th• The difference between the bowl speed and the scroll speed
Th diff ti l h th PLC hi• The differential changes as the PLC achieves the desired torque
sw51
0s1.
pptx
/14

Centrifuge FactorsWeir depth
M h i l dj t t t l t t th d f• Mechanical adjustment to plates at the end of the bowl
S t th l d th ithi th b l• Sets the pool depth within the bowl
• Can impact cake dryness, centrate quality, and polymer dose
sw51
0s1.
pptx
/15

Operational TargetsCriteria Units Importance
Cake dryness %TS Disposal costs y
Water equals weight and takes up volume
Centrate quality %TS Impact on liquid treatment processesCentrate quality %TS or TSS, mg/L
Impact on liquid treatment processes
Re-treatment of solids (thickening, digestion and dewatering)
Impact of inert solids on activatedImpact of inert solids on activated sludge mass calculations
Throughput Pounds per How centrifuges are sized and soldhour
Polymer dose Active pounds per
Operating costs
sw51
0s1.
pptx
/16
pounds per dry ton

Throughput Calculationgallon x 8.34 pounds x %TS x 60 minutes = pounds
min gallon hour hour
gpm 100 150 200%TS0.020 1001 1501 20020.022 1101 1651 22020.024 1201 1801 24020.026 1301 1952 26020.028 1401 2102 28020.030 1501 2252 3002
Notice the large change in throughput ith ll h i d it fl
sw51
0s1.
pptx
/17
with small change in density or flow

Impact of Sludge Density
4000
4500
3000
3500
n lb
/hr 2250 lb/hr
2000
2500
roug
hput
in
1000
1500Thr
1500 lb/hr
0
500
100 125 150 175 200 225 250 275
0.02 0.022 0.024 0.026 0.028 0.03
sw51
0s1.
pptx
/18
100 125 150 175 200 225 250 275
gpm

SLUDGE CONSIDERATIONSSLUDGE CONSIDERATIONS
sw51
0s1.
pptx
/19

Primary To Secondary Sludge Ratio• The ratio is determined by primary solids in pounds
divided by secondary solids in pounds – Do not use gallons / gallonsDo not use gallons / gallons
• There is a direct correlation between primary solids to secondary solids (P/S) ratio and polymer required forsecondary solids (P/S) ratio and polymer required for dewatering
• A reduced P/S ratio reduces centrate and cake quality• A reduced P/S ratio reduces centrate and cake quality
• An increased P/S ratio reduces the amount of polymer required to meet centrate and cake qualityrequired to meet centrate and cake quality
sw51
0s1.
pptx
/20

Primary to Secondary Solids Blend sw
510s
1.pp
tx/2
1

Economic Impact
Product Unit Cost Usage I t
$ per 1,000 d tImpact dry tons
Emulsion A $2.50/active lb 7.5 lb/ton $18,750
Emulsion B $2.30/active lb 8.0 lb/ton $18,400
Dry A $2 20/lb 9 5 lb/ton $20 900Dry A $2.20/lb 9.5 lb/ton $20,900
Dry B $2.00/lb 10.5 lb/ton $21,000
sw51
0s1.
pptx
/22

Primary to Secondary Solids Blend Suggested operational considerations
• Optimize primary sludge removal efficiencyOptimize primary sludge removal efficiency
• Optimize primary BOD removal efficiency
• Plan for impacts when taking activated sludge basins or primary clarifiers out of servicep y
• Understand impacts of secondary wasting adjustmentsadjustments
sw51
0s1.
pptx
/23

POLYMERPOLYMER
sw51
0s1.
pptx
/24

Polymer Factors• Polymer types
• Polymer solution strength• Polymer solution strength
• Batching considerations
• Mixing considerations
• Solution injection point• Solution injection point
• Purchasing flexibility
sw51
0s1.
pptx
/25

Polymer Characteristics
Type Appearance Primary Ingredients
Active Content
Liquid - emulsion Opaque Polymer, oil, inverting
surfactant, water
25% - 40%
su ac a , a e
Liquid - dispersion White Polymer, oil, inverting surfactant
40% - 75%
Liquid - mannich Clear, highly viscous
Polymer, water 3% - 8%viscous
Dry White granules, spheres, or
Polymer, dry surfactant
50% – 98%
sw51
0s1.
pptx
/26
powder

Polymer CharacteristicsType Charge Typical Molecular Weight
Cationic Positive Medium to very highy g
Anionic Negative Medium to very high
Non-ionic Neutral Medium to very high
• Higher charge = more active sites on a molecule
• Molecular weight dictates the length of the molecule; higher = longer
• Higher molecular weight = harder to get into solution and more viscous when in solution
sw51
0s1.
pptx
/27

Polymer Characteristics
Solution Strength 0.3% +/- 0.1
• Calculated by dividing the pounds of polymer added to a batch by the sum of pounds of polymer + pounds ofbatch by the sum of pounds of polymer + pounds of water in a batch
• Downstream dilution water increases the surface contact• Downstream dilution water increases the surface contact area
sw51
0s1.
pptx
/28
Batching • Aging time• Aging time
– Need enough time to allow the polymer molecules to uncoil
– Water temperature can impact aging time
sw51
0s1.
pptx
/29

Potable or Non-Potable Water
• During aging, solids in non-potable water take up charge sites and can decrease polymer performance
• Expense of potable water likely offsets the lossExpense of potable water likely offsets the loss of polymer performance
M k d t t t• Makedown water temperature– Warmer is better
• Chlorine residual– High chlorine content can decrease performance
sw51
0s1.
pptx
/30

Polymer Mixing SystemsI ffi i i i l l d• Insufficient mixing energy causes polymer to gel, and prevents effective polymer activation
Excessive high mixing energy causes polymer to shear• Excessive high mixing energy causes polymer to shear
- Increased polymer dosage
- Decreased process performance
sw51
0s1.
pptx
/31

Solution Injection Point
• Before centrifuge feed pump– Blended with sludge feed
– Mixed through travel time, in piping and elbows
Can shear molecules going through the pump– Can shear molecules going through the pump
• Upstream of rotating assembly– Allows for some mixing
• Inside the rotating assembly• Inside the rotating assembly– Injected at the splash plate and diffuses into sludge
S t t ti lt t i t i ll
sw51
0s1.
pptx
/32
Suggest testing alternate points occasionally

Contract Flexibility• Establish Primary and Alternate supplies
– Use two different suppliers rather than two different ppproducts from the same supplier
• Determine if seasonal constraints supportDetermine if seasonal constraints support alternatives– An emulsion polymer may be more cost effective in
winter months
– A dry polymer may be more cost effective in the y p y yother months
sw51
0s1.
pptx
/33

APPROACHAPPROACH
sw51
0s1.
pptx
/34

Putting It All Together
• Centrifuge adjustments
• Throughput
• Polymer batchingPolymer batching
• Polymer solution feed rates
• Operational targets
Operational planning• Operational planning
sw51
0s1.
pptx
/35

Optimization - Premise• The readily apparent visual clue is centrate
quality
• Within an operating range, optimum dosage results in quality centrate
• When in the optimal dosing range, the driest cake will be producedcake will be produced
• With excessive dosages, both cake dryness and t t lit ill d licentrate quality will decline
Goal is to determine guidelines to achieve the optimal range
sw51
0s1.
pptx
/36
for a variety of conditions

Test Methodology – Phase 1• Batch polymer at preferred solution strength
• Set sludge feed rate
• Enter typical torque setpoint and bowl speed
• Set lowest polymer feed rate• Set lowest polymer feed rate
• Run for a standard time (i.e., 45 minutes)
S l f d t t d k f TSS F d TSS• Sample feed, centrate and cake for TSS. Feed TSS is used to calculate throughput.
• Run through sequence for at least 5 polymer feed• Run through sequence for at least 5 polymer feed rates
• Plot results
sw51
0s1.
pptx
/37
Plot results

Performance Curve
98
10035Dose v. % Recovery
94
9630
S
88
90
92
20
25
ton
or %
TS
24 lb/ton
84
86
88
15
20
lb/t
80
82
101 2 3 4 5 6
sw51
0s1.
pptx
/38 Dose, lb/ton Cake Recovery

Test Methodology – Phase 2S f• Set sludge feed rate
• Set polymer solution feed rate for the “ideal” polymer dose
• With sludge and polymer feed rates “locked in”, g yadjust % torque setpoint
• Run for a standard time (i.e., 45 minutes)( , )
• Sample feed, centrate and cake for TSS. Feed TSS is used to calculate throughput.g p
• Run through sequence for at least 5 torque setpoint
sw51
0s1.
pptx
/39 • Plot results

Performance Curve 2
98
100
45
50Torque v. % Recovery
94
96
35
40
45
ue
88
90
92
30
35
S o
r Tor
qu
84
86
88
20
25
%TS
39% Torque
80
82
10
15
1 2 3 4 5 6
sw51
0s1.
pptx
/40 Torque Cake Recovery

Outcome• Determine what dose is effective under what
conditions
• Determine what torque is effective at what throughput
• Provide general guidelines to “dial in” centrifuges
If i th l d t i d• If using more than one polymer, determine under what conditions each is most effective
• Forecast usage to establish budget projections
C id h d li f ll f t ti t l t 6
sw51
0s1.
pptx
/41
Consider scheduling full range of testing at least every 6 months

Operating Rangesw
510s
1.pp
tx/4
2
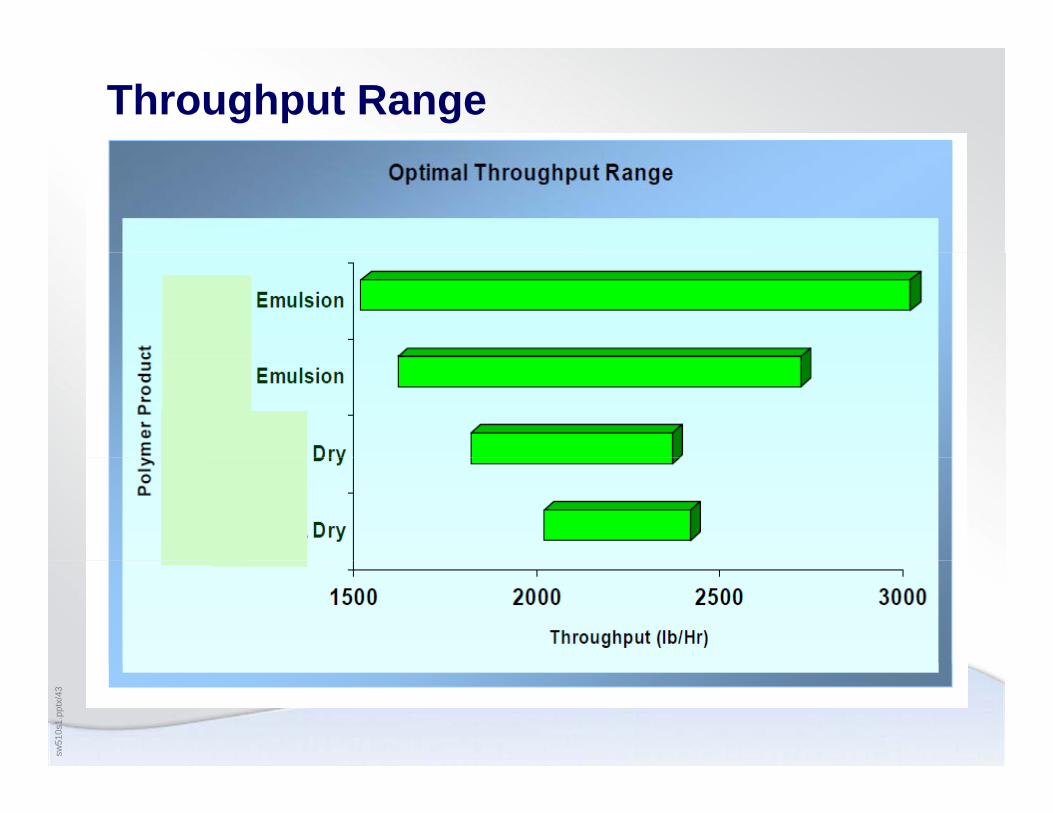
Throughput Rangesw
510s
1.pp
tx/4
3

Polymer Dose Ratesw
510s
1.pp
tx/4
4

Guidelines With Budgetary Impacts
Polymer Projected Throughput
Cake Dryness Centrate Capture
Emulsion Greater than X Consistently falls Consistently falls belowEmulsion Greater than X lb/hr per machine
Consistently falls below target
Consistently falls below target
Dry Less than X Consistently stays Consistently stays aboveDry Less than X lb/hr per machine
Consistently stays above target
Consistently stays above target
or seasonally
Polymer Time of YearEmulsion ~Dec 15 – Apr 15
Dry ~ April 16 – Dec 14
sw51
0s1.
pptx
/45
Dry April 16 Dec 14

Dewatering – Operating Targetssw
510s
1.pp
tx/4
6

What Was Covered• Why optimize dewatering polymer use
f• What impacts centrifuge output
• What impacts polymer batchingy g
• The impact of P/S blend
A th d l t d fi ti• A methodology to define operating ranges
• Putting optimization in action
sw51
0s1.
pptx
/47

Polymer Optimization for Centrifuge Dewatering
Thank you for being a wastewater treatment professional. Be proud of your contributions.
sw51
0s1.
pptx
/48
professional. Be proud of your contributions.