poorer children’s educational attainment: how … · poorer children’s educational attainment:...
TRANSCRIPT

Poorer children’s educational attainment: how important are attitudes and behaviours?
Report for the Joseph Rowntree Foundation
Edited by Alissa Goodman and Paul Gregg
Contributors from IFS, CMPO and University of Oxford
Centre for Market and Public
Organisation

Background and Motivation
• Children growing up in poor families end up with lower educational attainment than children growing up in rich families
• Strong contributor to patterns of social mobility
– Low income poor attainment low income
• Gaps start very early in life, but tend to widen throughout school
© Institute for Fiscal Studies

What we do
• Chart socio-economic gradient in attainment across childhood
• Investigate contribution of parent and child behaviours, attitudes to education and aspirations to the evolution of this gradient:
– Early years: home learning environments, parenting styles, health-related behaviours
– Primary school: lasting influence of early years, maternal aspirations, child’s own ability beliefs
– Teenage years: young person’s own attitudes and behaviours; lasting influence of parents; material resources in the home
– Intergenerational factors: parents’ and grandparents’ attitudes; transmission of ability
• Assess implications for policy
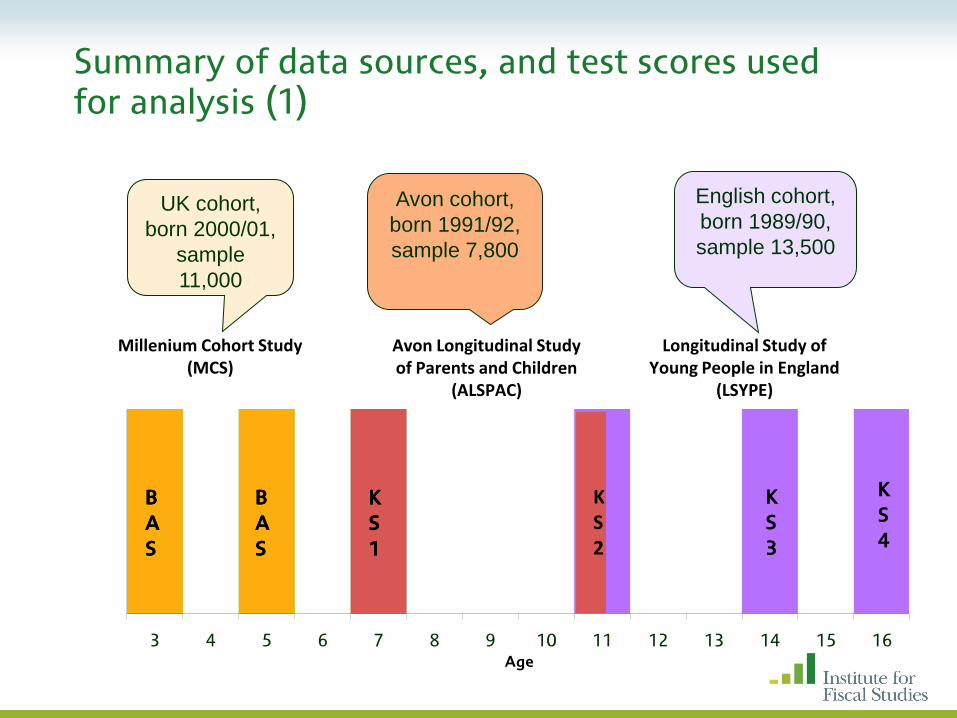
Summary of data sources, and test scores used for analysis (1)
3 4 5 6 7 8 9 10 11 12 13 14 15 16Age
B
A
S
K
S
1
B
A
S
KS2
K
S
3
K
S
4
B
A
S
K
S
1
B
A
S
UK cohort,
born 2000/01,
sample
11,000
Avon cohort,
born 1991/92,
sample 7,800
English cohort,
born 1989/90,
sample 13,500
KS2
Millenium Cohort Study (MCS)
Avon Longitudinal Study of Parents and Children
(ALSPAC)
Longitudinal Study of Young People in England
(LSYPE)

Summary of data sources, and test scores used for analysis (2)
3 4 5 6 7 8 9 10 11 12 13 14 15 16Age
Everyone born in
Great Britain in one
week in April 1970
interviewed
British Cohort Study (BCS)
Age 34 – Half of those
with children randomly
selected for parent-child
interviews
Children of BCS
Age Normalised
BAS Scores

Measuring socio-economic position
• Aim is to capture the longer-term material resources of the household
– Log equivalised household income (averaged across points in time)
– Reported experience of financial difficulties
– Mother’s and father’s occupational class
– Housing tenure
• The measure is constructed using principal-components analysis
• Individuals are then placed into quintiles (fifths) of the population
ranked by this measure.
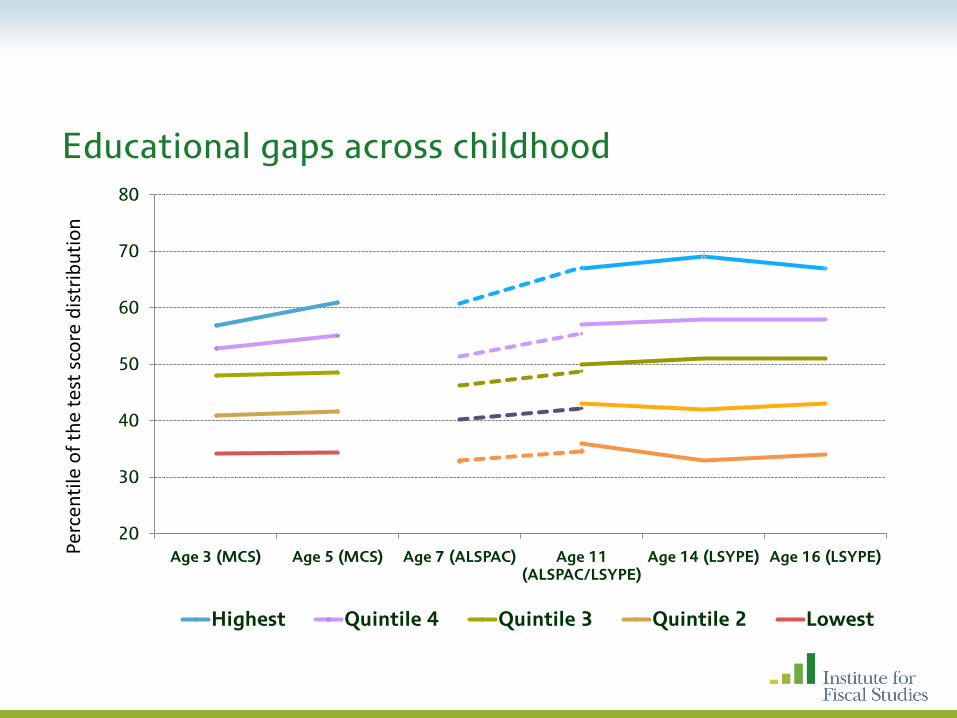
Educational gaps across childhood
20
30
40
50
60
70
80
Age 3 (MCS) Age 5 (MCS) Age 7 (ALSPAC) Age 11 (ALSPAC/LSYPE)
Age 14 (LSYPE) Age 16 (LSYPE)
Perc
enti
le o
f th
e te
st s
core
dis
trib
uti
on
Highest Quintile 4 Quintile 3 Quintile 2 Lowest

Decomposing these gaps: framework for analysis
• Starting point is relationship between SEP and attainment at each age
• Decompose the gap between rich and poor students into the ‘direct effects’ of:
– Family background: parental education, family demographics
– Aspirations, attitudes and behaviours: varying at each age
• Factors will explain a larger proportion of the gap if:
– Factors is highly correlated with socio-economic position
– Factor has a large effect upon outcomes conditional on all observables
• Development from previous age assessed through inclusion of prior attainment
• Important note: this study highlights statistical associations, and does not imply causation.

Preview of findings
• The gaps between rich and poor children is already large at age 3 continues to widen until age 14
• The following factors seem to have an important role in explaining the perpetuation of these gaps:
– Early home learning environment
– Expectations/ aspirations for education
– Beliefs in own actions making a difference
– Behaviour
– Material factors
• Suggests a potentially important role for policy if it can be shown that:
– More positive attitudes and behaviours cause higher attainment
AND
– Attitudes and behaviours can be influenced

From birth to age 5
Lorraine Dearden, Luke Sibieta (IFS) and Kathy Sylva (University of Oxford)

Explaining the socio-economic gradient in the early years
• Define set of family background and possible transmission mechanisms (“early childhood caring environment”)
• Family background
– Socioeconomic position (SEP)
– Parental education
– Demographic, and other family background
• Early childhood caring environment
– Family Interactions (mother-chid and between parents)
– Health and Well-being (birth-weight, gestation, post-natal depression)
– Childcare usage
– Home-learning environment (reading, ABCs, numbers, nursery rhymes)
– Parenting Style/Rules (bed-times, meal-times)
© Institute for Fiscal Studies

Selected differences in characteristics at age 3 & 5
© Institute for Fiscal Studies
25.0
32.2
0
5
10
15
20
25
30
35
Mother's age at birth
Mo
the
r's a
ge
at
bir
th
1.6
1.1
0
0.5
1
1.5
2
Number of siblings at age 5
Nu
mb
er o
f sib
lin
gs
14%
42%
68%
85%
22%
79%
92% 98%
0%
20%
40%
60%
80%
100%
Highest HLE Quintile at age 3 Read to everyday at age 3 Regular bed times at age 3 Regular meal times at age 3
Pe
r ce
nt

How much of the socio-economic gap in cognitive outcomes at age 3 is explained by these factors?
34%
16%
25%
4%
3%
1%
16%
0% 1% Residual Gap
Parental Education
Family Background/Demographics
Family Interactions
Health and Well-Being
Childcare
Home-Learning Environment
Parenting Style/Rules
Missing Data
© Institute for Fiscal Studies
Total gap to be explained:
23 percentile points

How much of the socio-economic gap in cognitive outcomes at age 5 is explained by these factors?
8%
17%
21%
1%0%
52%
Residual Gap
Parental Education
Family Background/Demographics
Early childhood caring environment
Missing Data
Prior Ability
© Institute for Fiscal Studies
Total gap to be explained:
27 percentile points

How much of the socio-economic gap in socio-emotional development at age 3 is explained by these factors?
© Institute for Fiscal Studies
Total gap to be explained:
22 percentile points

How much of the socio-economic gap in socio-emotional development at age 5 is explained by these factors?
© Institute for Fiscal Studies
Total gap to be explained:
23 percentile points

How much of the socio-economic gap in cognitive outcomes at age 5 is explained by these factors?
© Institute for Fiscal Studies
• Gap widens at age (from 23 to 27 percentile points)
• Half of the gap is explained by prior cognitive ability
– Direct effect only: excludes impact via other factors
• 20% via parental education and 17% from family background
• Less than 1% from the early childhood caring environment
• What role for the Home-Learning Environment?
– HLE at age 3 explains age 5 cognitive outcomes through its impact on age 3 cognitive outcomes
– No impact of age 5 HLE on age 5 cognitive outcomes
• Demonstrates importance of largely pre-determined factors for outcomes at age 5

Summary of early years findings
• Big differences in cognitive development between rich and poor at age 3, widens by age 5
• Children from poor backgrounds face much less advantageous “early childhood caring environments” than children from better off families.
• Differences in the home learning environment at the age of 3 explain a substantial proportion of socio-economic gradient
• Larger proportion of the gap remains unexplained, or appears directly related to other aspects of family background
• Suggests policies to improve parenting skills and home learning environments in isolation cannot possibly eliminate the cognitive skills gap between rich and poor young children.
• Wide gaps in socio-emotional development more strongly explained by differences in early childhood caring environment
© Institute for Fiscal Studies

Primary school years
Paul Gregg and Elizabeth Washbrook (CMPO)
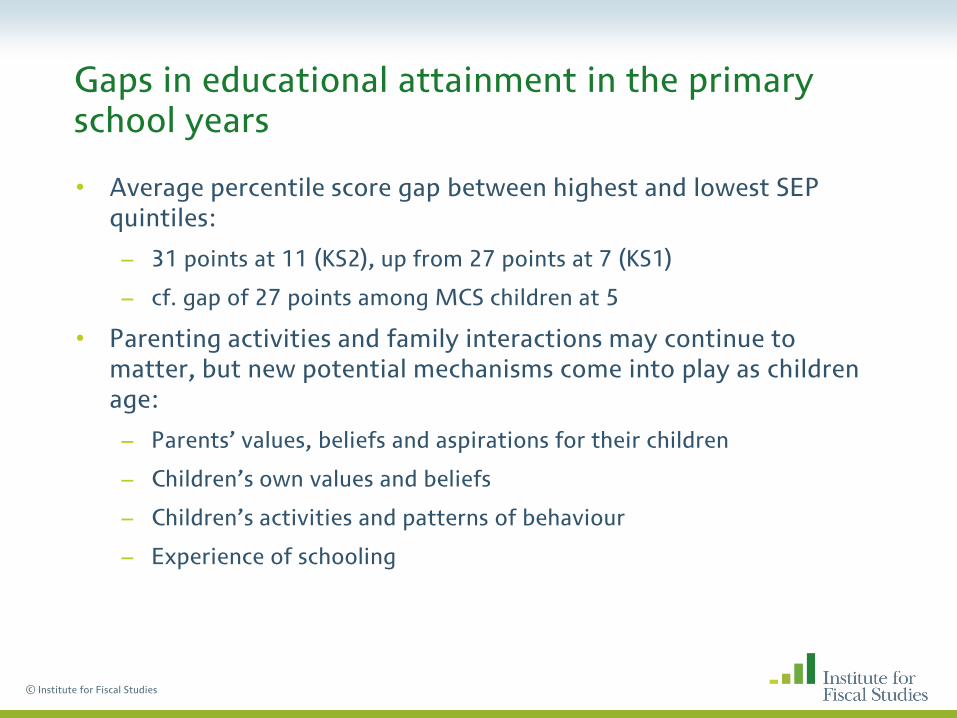
Gaps in educational attainment in the primary school years
• Average percentile score gap between highest and lowest SEP quintiles:
– 31 points at 11 (KS2), up from 27 points at 7 (KS1)
– cf. gap of 27 points among MCS children at 5
• Parenting activities and family interactions may continue to matter, but new potential mechanisms come into play as children age:
– Parents’ values, beliefs and aspirations for their children
– Children’s own values and beliefs
– Children’s activities and patterns of behaviour
– Experience of schooling
© Institute for Fiscal Studies

Children from poor backgrounds are disadvantaged across all the mechanisms we consider
• Mother’s locus of control; mother’s valuation of own schooling; mother’s aspirations for child’s eventual attainment
© Institute for Fiscal Studies
81% of the highest SEP mothers hope their child will go to
university, compared with 37% of the lowest SEP mothers
• Child’s locus of control; beliefs about own ability; life values
67% of the highest SEP children believe school results are
important in life, compared with 51% of the lowest SEP children
• Anti-social behaviours; hyperactivity and conduct problems; engagement in leisure activities
• Average Key Stage results and social mix of schools attended
• BUT a few exceptions: mother-child shared activities; child’s enjoyment of school; teacher-child relations

How much of the socio-economic gap at age 11 is explained by these factors?
© Institute for Fiscal Studies
14%
29%
19%
20%
3%
14%
-1%
Residual gap
Parental education and family background
Child attitudes and behaviours
Parental attitudes and behaviours
Pre-school environments
Schools
Missings
Total gap to be explained:
31 percentile points

How much of the socio-economic gap at age 11 is explained by these factors net of prior ability?
7%
13%
4%
6%
0%6%
-1%
63%
Residual Gap
Parental Education and Family Background
Child's attitudes and behaviours
Parent's attitudes and behaviours
Pre-school environments
Schools
Missing Data
Prior Ability
© Institute for Fiscal Studies
Total gap to be explained:
31 percentile points
Summary of primary years study
• Poor children are much more likely to begin primary school behind their better-off peers, but even given identical test scores at 7, poor children fall further behind by age 11
• A wide variety of observable “family process factors” help to explain the socio-economic gaps at 11 left unaccounted for by demographic and schooling differences between rich and poor
• Among the multitude of factors identified, some we highlight are
– Mother’s hopes that the child will go to university
– The belief that one’s own actions can make a difference (among both parents and children)
– Socio-emotional difficulties such as inattention and conduct problems
• Unsurprisingly, positive beliefs and behaviours are strongly related to test performance at 7 as well as at 11. Nevertheless, the factors identified appear to contribute to the slower progress of disadvantaged children even taking their starting point as given.
Secondary school years
Haroon Chowdry, Claire Crawford and Alissa Goodman (IFS)

Outcomes in the secondary school years: evidence from the LSYPE
• Now focus on educational attainment at 16
• See if gap can be explained by the following characteristics:
– Prior attainment (at 11 and 14)
– Parental education and family background
– School characteristics
– Children’s attitudes and behaviours
• Beliefs and values about being at school
• Aspirations/expectations towards future education
• Behavioural problems
– Parental attitudes and behaviours
• Provision of educational material resources
• Aspirations/expectations about child’s future education
• Home relations and educational interactions with the child
© Institute for Fiscal Studies

Selected differences in characteristics by SEP
© Institute for Fiscal Studies
6% 5%
10%
41%
24%
1%
8% 8%
21%
8%
0%
10%
20%
30%
40%
50%
Frequent smoker
Frequent drinker
Ever tried cannabis
Ever involved in anti-social
behaviour
Ever played truant
Pe
r ce
nt
Risky behaviours by SEP
10%
71%
46%45%
99% 97%
0%
25%
50%
75%
100%
Private tuition Computer access
Internet access
Pe
r ce
nt
Material resources by SEP
76%
53%
91%81%
0%
25%
50%
75%
100%
Parent wants YP to stay on in FTE at 16
Parent thinks YP likely to go to HE
Pe
r ce
nt
Parental expectations by SEP
79%
49%
63%70%
93%
77% 86%67%
0%
25%
50%
75%
100%
Wants to stay on in FTE at 16
Likely to apply to HE, and likely
to get in
Most friends likely to stay on
at 16
A job that leads somewhere is
important
Pe
r ce
nt
Child expectations by SEP

How much of the socio-economic gap in cognitive outcomes at age 16 is explained by these factors?
7%
6%
15%
8%
1%
4%
59%
Residual Gap
Parental Education and Family Background
Child's attitudes and behaviours
Parent's attitudes and behaviours
Schools
Missing Data
Prior Ability
© Institute for Fiscal Studies
Total gap to be explained:
33 percentile points

Summary of secondary years analysis
• Attainment gap at 16 a continuation of earlier gaps
• But might be reduced if poorest children:
– Have access to computer/internet
– Avoid problematic/risky behaviour (in and outside school)
– Expect to go to HE, or have parents who expect them to go
– Believe that they do well in school
• What role for policies to raise education aspirations?
– Aspirations are strongly associated with educational attainment
– Poorest children have lower expectation of going to HE than rich children, even after taking into account prior attainment
– Suggests an ‘aspirations deficit’ that ought to be alleviated
© Institute for Fiscal Studies

Summary of secondary years analysis
• However:
– HE expectations are already very high across all SEP groups
– Poor children most likely to over-estimate chances of going to HE
© Institute for Fiscal Studies
50% 51%58%
64%
78%
13%20%
29%
37%
52%
0
10
20
30
40
50
60
70
80
90
Poorest 2 3 4 Richest
Expectations at age 14 Reality at age 18/19

© Institute for Fiscal Studies
Children’s cognitive skills: intergenerational transmission and the socio-economic gap Claire Crawford, Alissa Goodman and Robert Joyce (IFS)

© Institute for Fiscal Studies
Background and motivation
Studies of cognitive skills have looked at:
1. Explanations for the rich-poor socio-economic gap (the rest of this
session!).
2. Intergenerational transmission (Anger and Heineck, 2009; Bjorklund
et al, 2009; Black et al, 2009).
Clearly, 1 and 2 could be related. Ideally would like to integrate them
in empirical work.

© Institute for Fiscal Studies
0
5
10
15
20
25
30
35
40
45
1 3 5
Parental cognitive ability quintile
% in lowest SEP quintile
% in middle SEP quintile
% in highest SEP quintile
Parental cognitive ability and socio-economic position

© Institute for Fiscal Studies
Background and motivation
Studies of cognitive skills have looked at:
1. Intergenerational transmission (Anger and Heineck, 2009; Bjorklund
et al, 2009; Black et al, 2009).
2. Explanations for the rich-poor socio-economic gap (the rest of this
session!).
Clearly, 1 and 2 could be related. Ideally would like to integrate them
in empirical work.
If the other papers in this series had observed (e.g.) parental
cognitive ability, would it have...
• ... been an important predictor of cognitive skills, conditional on
other observables?
• ...changed the apparent relative importance of those observables in
explaining the SEP gap?

© Institute for Fiscal Studies
Data
British Cohort Study (BCS): everyone born in Great Britain
in one week in April 1970 interviewed every few years.
In age-34 wave, half those who had children were
randomly selected for parent-and-child questionnaires and
children took cognitive tests (BAS).
So we have:
•Info about the environment children are growing up in.
•Their cognitive test scores.
•Info about the cognitive ability, social skills and attitudes
of their parents when they were children.

© Institute for Fiscal Studies
Measures of parental characteristics
Cognitive skills
• BAS scores (word associations, word definitions, pattern
recognition, recall) plus tests of reading, writing, vocab,
maths, copying, sequence recognition at age 10.
• Also smaller range of similar tests at age 5.
Noncognitive skills
• Rutter behaviour scale, ages 5 and 10; Conners behaviour
scale, age 10 (mother-reported).
Attitudes
• Self-esteem and self-concept measures, ages 10 and 16;
attitudes towards education, age 16 (self-reported).

© Institute for Fiscal Studies
Sample selection issues
All children in sample have parent aged 34.
So children of cohort members who have them after age 34
(31 in our estimation sample) are not included.
Skews the sample of cohort members (parents)
towards those of lower SEP backgrounds, lower
cognitive ability, lower education levels.
On other hand, attrition pre-2004 tends to do opposite.
In terms of observables, these two aspects of non-
random selection tend to offset each other.

© Institute for Fiscal Studies
Defining the outcome (1)
We observe BAS scores, as with other papers in series.
Want to age-standardise them.
Would typically regress scores on age, and take residuals.
In our sample, age of child is collinear with age of (a)
parent at child’s birth – and that’s correlated with lots of things
that may affect cognitive test scores.
Age-standardising in normal way would involve ‘partially’
standardising with respect to SEP, parental ability, etc.
But we’re interested in the effects of those things!

© Institute for Fiscal Studies
Defining the outcome (2)
We want to strip out variation in cognitive ability that’s just
due to age. 2 steps:
1. Estimate equation: cogi = agei ’ α + Xi ’ β + ui
2. Define: cogi - agei ’ α
We take percentile ranks of this.

© Institute for Fiscal Studies
The SEP gap in cognitive test scores: first decomposition
Residual gap16%
CM's gender0%
Parental Education
9%
Social Skills14%
Family Background
16%Home-learning Environment
4%
Educational Attitudes and Aspirations
23%
Young Person's
Behaviours10%
Other As and Bs
8%

© Institute for Fiscal Studies
The SEP gap in cognitive test scores: adding new information about parents
Residual gap16% CM's gender
0%
Parental Education
9%
Social Skills14%
Family Background
16%Home-learning
Environment4%
Educational Attitudes and Aspirations
23%
Young Person's
Behaviours10%
Other As and Bs8%
Residual gap6%
CM's gender4%
Parental Education
5%
Social Skills11%
Family Background
12%
Home-learning Environment
4%
Educational Attitudes and Aspirations
20%
Young Person's
Behaviours10%
Other As and Bs4%
Parental Cognitive
Ability16%
Parental Attitudes and Social Skills
8%
© Institute for Fiscal Studies
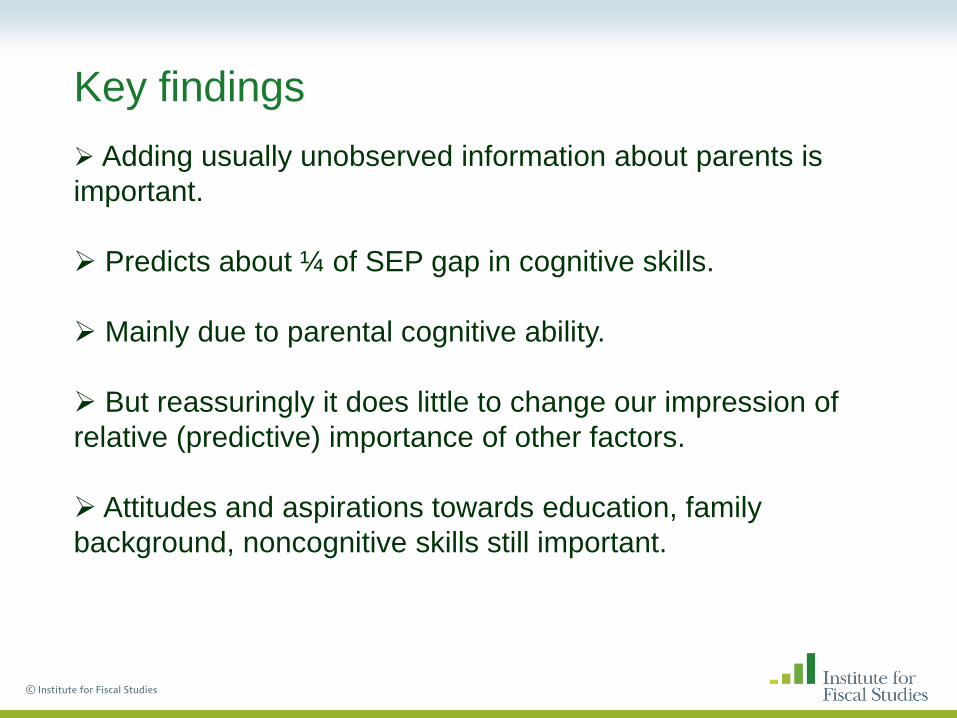
Key findings
Adding usually unobserved information about parents is
important.
Predicts about ¼ of SEP gap in cognitive skills.
Mainly due to parental cognitive ability.
But reassuringly it does little to change our impression of
relative (predictive) importance of other factors.
Attitudes and aspirations towards education, family
background, noncognitive skills still important.

© Institute for Fiscal Studies
General conclusions from session (1)
Suggests socio-economic gap in attainment may be reduced
by improving attitudes and behaviours amongst poor children
•Optimistic take would suggest 25% reduction in GCSE
attainment gap
But not a causal analysis. More robust evidence needed to
establish that:
a) attitudes and behaviours can be changed
b) such changes cause improvements in attainment
© Institute for Fiscal Studies
General conclusions from session (2)
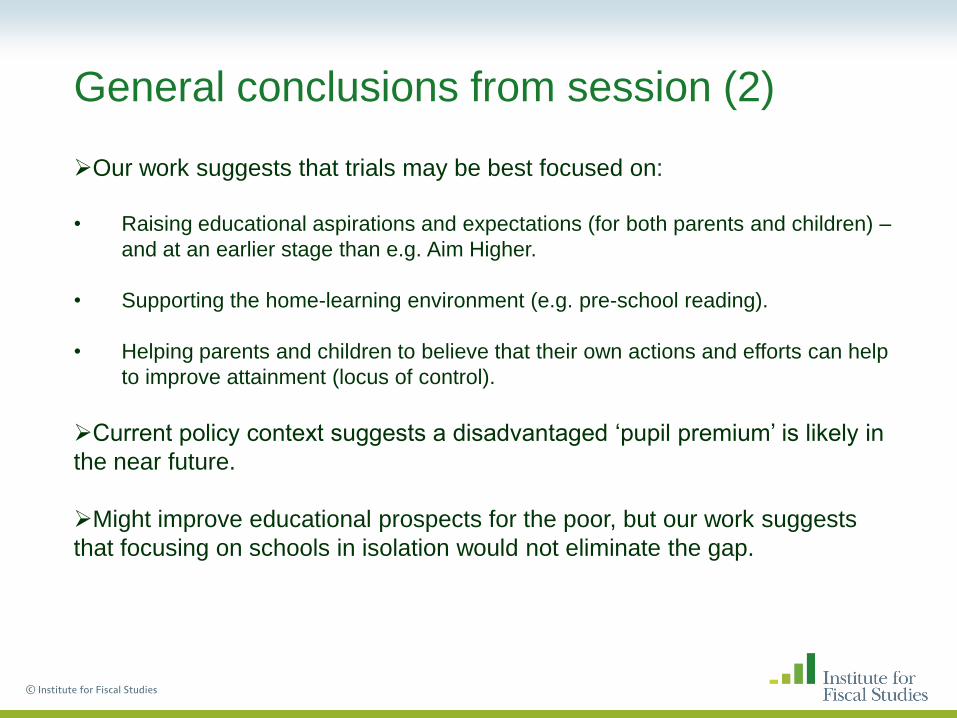
Our work suggests that trials may be best focused on:
• Raising educational aspirations and expectations (for both parents and children) –
and at an earlier stage than e.g. Aim Higher.
• Supporting the home-learning environment (e.g. pre-school reading).
• Helping parents and children to believe that their own actions and efforts can help
to improve attainment (locus of control).
Current policy context suggests a disadvantaged ‘pupil premium’ is likely in
the near future.
Might improve educational prospects for the poor, but our work suggests
that focusing on schools in isolation would not eliminate the gap.

© Institute for Fiscal Studies
General conclusions from session (3)
Key message: more evidence needed!