pope of lnms a49 hereford to ross-on-wye lnms … · chi-square - a statistical test to determine...
TRANSCRIPT

POPE of LNMS A49 Hereford to Ross-on-Wye LNMS Evaluation Report Highways Agency
January 2015

A49 Hereford to Ross-on-Wye LNMS | January 2015 | 5107696 2
Notice
This document and its contents have been prepared and are intended solely for Highways Agency’s information and use in relation to POPE of LNMS.
Atkins Limited assumes no responsibility to any other party in respect of or arising out of or in connection with this document and/or its contents.
This document has 43 pages including the cover.
Document history
Job number: 5107696 Document ref: M9046 A49 Hereford to Ross-on-Wye LNMS v4.0.docx
Revision Purpose description Originated Checked Reviewed Authorised Date
Rev 1.0 First Draft RA LS LS LS 04/12/14
Rev 2.0 Comments Included RA LS EH EH 15/12/14
Rev 3.0 Comments Included RA LS JB EH 12/01/15
Rev 4.0 Final Version RA LS EH EH 21/01/15
Client signoff
Client Highways Agency
Project POPE of LNMS
Document title A49 Hereford to Ross-on-Wye AIP
Job no. 5107696
A49 Hereford to Ross-on-Wye LNMS | January 2015 | 5107696 3
Table of contents
Chapter Pages
Glossary 5
1. Introduction 9 Background 9
Purpose of this report 10
2. Scheme Detail 11 Introduction 11
Background 11
Location 11
Pre Scheme Opening 13
Post Scheme Opening 14
Site Observations 20
3. Traffic Volumes 21 Introduction 21
Data Source 21
Long Term Traffic Trends 22
Directly Before and After Traffic Trends 23
Daily Traffic Patterns 25
Summary 26
4. Journey Time Analysis 27
5. Safety Impacts 28 Introduction 28
Data Source 28
Analysis 30
Accident Causation 30
Accident Location 31
Accident Time 32
Summary 33
6. Economy 34 Introduction 34
PAR and Outturn Comparison 34
Summary 35
7. Other Impacts 36 Journey Quality 36
Landscape 36
8. Conclusions and Recommendations 37 Summary of Scheme Impacts 37
Scheme Specific Objectives 38
Lessons Learnt 38
Appendices 39
Appendix A. AST 40

A49 Hereford to Ross-on-Wye LNMS | January 2015 | 5107696 4
Appendix B. EST 42
Tables
Table 2-1 – Summary of A49 Hereford to Ross-on-Wye AIP LNMS .................................. 11 Table 2-2 – Summary of Works Undertaken ...................................................................... 15 Table 5-1 – Summary of Pre and Post Scheme Accidents ................................................ 30 Table 5-2 – Summary of Predicted and Outturn Accident Savings .................................... 30 Table 5-3 – Weekday Accident Times ............................................................................... 32 Table 5-4 – Weekend Accident Times ............................................................................... 32 Table 6-1 – PAR and Outturn Economy Comparison ........................................................ 34 Table 8-1 – Scheme Specific Objectives ........................................................................... 38
Figures
Figure 1-1 Location Plan ................................................................................................... 9 Figure 2-1 Junction Location Context Plan ...................................................................... 12 Figure 2-2 Pre scheme at Site 1, Redhill to Rotherwas Roundabout .............................. 13 Figure 2-3 Pre-Scheme at Site 5, Bends North of Much Birch ........................................ 14 Figure 2-4 Location of Works Sites ................................................................................. 14 Figure 2-5 Anti-skid surfacing near Withybrook ............................................................... 16 Figure 2-6 Road markings near Grafton Lane Junction ................................................... 16 Figure 2-7 Chevron signage near the bends north of Much Birch ................................... 17 Figure 2-8 Speed camera signs near Much Birch Village ................................................ 18 Figure 2-9 New footway at Much Birch Village ................................................................ 18 Figure 2-10 Road markings between Much Birch and Harewood End .............................. 19 Figure 2-11 Signs to Bridstow ........................................................................................... 20 Figure 3-1 Traffic Count Locations, TRADS database..................................................... 21 Figure 3-2 Long Term Traffic Volumes on the Scheme Section ...................................... 22 Figure 3-3 DfT Statistics on the Growth in Traffic (Vehicle Kilometres) ........................... 23 Figure 3-4 Before and After Opening Traffic Volumes on the A49 .................................. 24 Figure 3-5 Average Hourly Traffic Northbound ................................................................ 25 Figure 3-6 Average Hourly Traffic Southbound ............................................................... 26 Figure 5-1 Accident Analysis Area .................................................................................. 29 Figure 5-2 Pre-Scheme Accident Locations .................................................................... 31 Figure 5-3 Post-Scheme Accident Locations ................................................................... 31

A49 Hereford to Ross-on-Wye LNMS | January 2015 | 5107696 5
Glossary
Term a.k.a. Definition
Accessibility - Accessibility can be defined as ‘ease of reaching’. The
accessibility objective is concerned with increasing the
ability with which people in different locations, and with
differing availability of transport, can reach different
types of facility.
Annual Average
Daily Traffic
AADT The 24 hour total traffic flow for the average day of the
year
Automatic Number
Plate Recognition
ANPR A mass surveillance method using optical character
recognition on images to read vehicle registration
plates.
Asset Support
Contractor
ASC Responsible for the operation, maintenance, and
improvement of the motorway and trunk road network of
a HA area
Appraisal Summary
Table
AST This records the impacts of the scheme according to the
Government’s five key objects for transport, as defined
in DfT guidance contained on its Transport Analysis
Guidance web pages, WebTAG
Automatic Traffic
Count
ATC An automated method of recording the volume (and
sometimes classification) of vehicles passing a
particular point on a road.
Average Daily
Traffic
ADT The 24 hour total traffic flow on an average day over a
certain time period (Monday – Sunday)
Average Weekday
Traffic
AWT The 24 hour total traffic flow on an average weekday
over a certain time period (Monday – Friday)
Benefit Cost Ratio BCR Benefit Cost Ratio is a ratio identifying the relationship
between cost and benefits of a proposed project
Bank Holiday
Monday
BHM UK Public Holidays that fall on a Monday
Capitalisation - The process by which benefits for a scheme are
factored to give an estimate for the appropriate
appraisal period
Chi-Square - A statistical test to determine whether the observed

A49 Hereford to Ross-on-Wye LNMS | January 2015 | 5107696 6
values of a variable are significantly different from those
expected on the basis of a null hypothesis. Variables
are categorised to determine whether a distribution of
scores is due to chance or experimental factors and
tests whether one variable is independent of another
Design Build
Finance and
Operate
DBFO The Design, Build, Finance and Operate project is part
of the Government's Public Private Partnership initiative.
The aim is to forge closer co-operation between the
public and private sectors and introduce private sector
skills and disciplines into the management of projects
and services traditionally undertaken by the public
sector. By applying this to the trunk road network the
HA is seeking to improve highways maintenance and
obtain better value for money in the delivery of large
improvement schemes
Department for
Transport
DfT A Government department whose objective is to
oversee the delivery of a reliable, safe and secure
transport system that responds efficiently to the needs
of individuals and business whilst safeguarding our
environment. The HA is an executive of the DfT
Discounting - A technique used to compare costs and benefits that
occur in different time periods and is the process of
adjusting future cash flows to their present values to
reflect the time value of money, e.g. £1 worth of benefits
now is worth more than £1 in the future. A standard
base year needs to be used which is 2002 for the
appraisal used in this report
Dis-benefit - A negative benefit or something that detracts from the
performance.
Evaluation
Summary Table
EST In POPE studies, this is a summary of the evaluations of
the TAG objectives using a similar format to the
forecasts in the AST
First Year Rate of
Return
FYRR First Year Rate of Return is the ratio of money gained
on an investment relative to the amount of money
invested.
Highways Agency HA An Executive Agency of the DfT, responsible for
operating, maintaining and improving the strategic road
network in England
Killed or Seriously
Injured
KSI A term used to describe the number of people killed or
seriously injured as a result of PICs.

A49 Hereford to Ross-on-Wye LNMS | January 2015 | 5107696 7
Journey Time
Database
JTDB A HA database of average vehicle journey times on the
trunk road network
Local Network
Management
Scheme
LNMS LNMS are improvement schemes where total overall
estimated cost (including design, land, works,
supervision, risk and VAT) is less than £10 million. They
are categorised by the Government under Safety,
Economy, Accessibility, Integration and Environment
Non-Motorised
User
NMU Includes pedestrians, cyclists, horse riders and disabled
people, whose needs must be addressed. An NMU
audit considers the specific needs of these vulnerable
road users
Optimism Bias - Is a demonstrated systematic, tendency for project
appraisers to be overly optimistic, and in effect, results
in an underestimation of scheme costs. The base cost
estimate is adjusted to account for optimism bias in
order to obtain more accurate cost estimates.
PARAMICS - Microsimulation software package. PARAMICS uses the
car-following and lane-changing model to show the
correlation of numerical data for road networks under
differing conditions through the use of computer
graphics
Project Appraisal
Report
PAR A key document summarising the need for a project,
plus its costs and benefits (including those that cannot
be quantified in monetary terms)
Personal Injury
Collision
PIC A term commonly used to refer to road accidents
Post-Opening
Project Evaluation
POPE Before and after monitoring of all highway schemes in
England
Public Right of Way PRoW Public Rights of Way are highways that allow the public
a legal right of passage
Professional
Services
Framework
PSF Frameworks provide better value for money compared
with the procurement on an individual project basis.
They allow long-term relationships to be developed
which allow better programming of work and planning of
resources
Present Value of
Costs
PVC Present Value of Costs is a term used in cost-benefit
analysis and project appraisal that refers to the
discounted sum, or Present Value, of a stream of costs

A49 Hereford to Ross-on-Wye LNMS | January 2015 | 5107696 8
associated with a project or proposal
Regional
Intelligence Unit
RIU The Regional Intelligence Unit sits within the Business
Management Teams for each HA region. They provide
intelligence analysis and assessments from a variety of
data sources, generating and interpreting data sets in
order to support the decision making process.
Risk Allowance - Risk refers to identifiable future situations that could
result in an over spend or under spend occurring. The
base cost estimate is adjusted to account for risk in
order to obtain more accurate cost estimates
Severance - Community severance is the separation of adjacent
areas by road or heavy traffic, causing negative impact
on non-motorised users, particularly pedestrians
- STATS19 A database of injury accident statistics recorded by
police officers attending accidents
Traffic Database
System
TRADS Traffic count database developed by the HA, to hold
data from traffic monitoring sites on the strategic
network
TUBA TUBA Computer program used for undertaking transport
economic appraisals. TUBA draws information directly
from transport models, and applies economic
parameters to calculate benefits and costs associated
with travel time, vehicle operating cost and emissions
changes
Web-based
Transport Analysis
Guidance
WebTAG The Department for Transport’s appraisal guidance and
toolkit and is used for scheme appraisal. It was first
introduced in 2003.

A49 Hereford to Ross-on-Wye LNMS | January 2015 | 5107696 9
1. Introduction
Background 1.1. This report is the Post Opening Project Evaluation (POPE) of the A49 Hereford
to Ross-on-Wye Accident Investigation and Prevention (AIP) Local Network Management Scheme (LNMS), hereafter called ‘the scheme’.
1.2. The scheme was implemented on the A49 between Hereford and Ross-on-Wye in Herefordshire. This section of the A49 is significant to the region as there are no practical alternative routes to travel between the two towns. The location of the scheme is indicated in Figure 1-1.
Figure 1-1 Location Plan

A49 Hereford to Ross-on-Wye LNMS | January 2015 | 5107696 10
1.3. The scheme section is approximately 13 miles in length and is a single carriageway with 2 lanes. The scheme was developed to address the high accident1 rates and high number of Killed and Seriously Injured (KSI) accidents on this stretch of the A49.
1.4. The scheme involved the implementation of a number of low cost accident prevention measures including new signage, lining and surfacing and minor highway improvements. The overall scheme consisted of 11 sites, along the A49, where targeted accident prevention measures were implemented.
1.5. Scheme construction began on 10th March 2011 and the scheme was completed on the 26th April 2012.
Purpose of this report 1.6. As part of an ongoing programme, whereby the Highways Agency (HA)
evaluates the impacts of trunk road schemes, Atkins is commissioned to undertake post-opening evaluations of LNMS with an implementation cost between £25k and £10m.
1.7. This report specifically sets out the results of the POPE of the A49 Hereford to Ross-on-Wye AIP LNMS. More specifically, this report examines largely the safety impacts resulting from the improvements, with consideration also given to the main economy, environmental and society impacts.
1.8. It is intended that the findings from this report will feed into a wider summary of the outcomes of POPE of LNMS. This is a document (namely the POPE of LNMS Annual Evaluation Report) produced in the 4th quarter of each year outlining the key messages from the entire POPE of LNMS process.
1 All references to accidents in this report refer to Personal Injury Collisions (PICs).

A49 Hereford to Ross-on-Wye LNMS | January 2015 | 5107696 11
2. Scheme Detail
Introduction 2.1. This section of the report outlines the pre-scheme and post-scheme layout and
details of specific sites along the scheme section. This section uses photos, diagrams and site observations to illustrate the changes made to the highway network. In addition, it contains the views and feedback on the scheme from key stakeholders, where available.
Background 2.2. The A49 Hereford to Ross-on-Wye LNMS implemented a number of minor
preventative measures to reduce the number of accidents. Table 2-1 summarises the scheme details.
Table 2-1 – Summary of A49 Hereford to Ross-on-Wye AIP LNMS
Scheme name A49 Hereford to Ross-on-Wye
Area 9
Opening date 26th April 2012 (construction began 10th March 2011)
Category Safety
Reason for scheme
The scheme’s primary focus was safety and was designed and implemented to reduce the high accident rates and KSIs along the scheme section of the A49. Low cost accident prevention measures were implemented at 11 targeted sites along the scheme section. Preventative measures included road and hazard signage, resurfacing, improved lining and minor highway improvement measures.
Objective Reduce the number of accidents.
Location 2.3. The A49 is a key route in western England. It begins at Ross-on-Wye and runs
north to Wigan via a number of towns and cities, including Hereford, Leominster, Shrewsbury and Warrington.
2.4. A number of important roads branch off the section of the A49, between Hereford and Ross-on-Wye, and serve villages and small towns including Peterstow, Harewood End, Llanware, Much Birch, Wormelow, Kingsthorne and Much Dewchurch. The villages and towns rely on the A49 for access either because they fall on the scheme section or are accessed via one of the branch roads, which include the B4399, B4348, A465, A466 and the A413 (see Figure 2-1).

A49 Hereford to Ross-on-Wye LNMS | January 2015 | 5107696 12
Figure 2-1 Junction Location Context Plan
Junction with A4137
Junction with B4521
Junction with B4348 Junction
with A466
Junction with A465
Junction with B4399

A49 Hereford to Ross-on-Wye LNMS | January 2015 | 5107696 13
Pre Scheme Opening 2.5. Some of the key issues on this section of the A49 prior to the introduction of the
scheme included:
1) High accident rate: the section of the A49 between Hereford to Ross-on-Wye had a high accident rate prior to the scheme due to poor signage, inadequate road surfacing and a lack of advanced hazard signs. The PAR recorded 112 Personal Injury Collisions (PICs) during a five year period prior to the scheme (01/01/2005 – 31/12/2009).
2) Limited sections of high friction surfacing: There were only limited sections of high friction surfacing at various locations along the scheme length.
2.6. Figure 2-2 and Figure 2-3 show images indicating the condition of the road at specific sections along the scheme section.
2.7. Figure 2-2 shows the A49/Grafton Lane junction. The image is looking south towards Ross on Wye with Bullingham Lane on the left and the bridge over Withy Brook before the junction. The picture clearly highlights the lack of signage including maximum speed and directional signposts.
Figure 2-2 Pre scheme at Site 1, Redhill to Rotherwas Roundabout
© 2014 Google
2.8. Figure 2-3, captured October 2011, of the bends north of Much Birch. The image clearly shows the sharp bend ahead.

A49 Hereford to Ross-on-Wye LNMS | January 2015 | 5107696 14
Figure 2-3 Pre-Scheme at Site 5, Bends North of Much Birch
© 2014 Google
Post Scheme Opening 2.9. The scheme opened on schedule on 26th April 2012. The scheme included a
number of targeted sites along the route of the A49 scheme section. Figure 2-4 shows the 11 scheme sites.
Figure 2-4 Location of Works Sites

A49 Hereford to Ross-on-Wye LNMS | January 2015 | 5107696 15
2.10. Below are the summarised details of the accident prevention measures implemented at each site.
Table 2-2 – Summary of Works Undertaken
Site Name Works Undertaken
1 Redhill to Rotherwas Roundabout
Anti-skid surfacing and road markings; and
Hazard markers and road traffic signs.
2 Rotherwas Roundabout to Portway
Additional road studs and red road markings.
3 Grafton Lane Junction Anti-skid surfacing and road markings; and
Additional road studs, hazard markers and road traffic signs.
4 Callow Hill Anti-skid surfacing and red road markings; and
Additional road studs, hazard markers and road traffic signs.
5 Bends North of Much Birch
Carriageway surfaced planed and anti-skid surfacing applied;
Road markings applied; and
Hazard posts, glass road studs and road traffic signs installed.
6 Much Birch Village
A new footway installed at the corner of Tump Lane;
Vegetation cleared;
Anti-skid surfacing and road markings applied; and
Additional road studs applied and traffic signage relocated.
7 Much Birch to Harewood End
Anti-skid surfacing and road markings applied; and
Additional road studs, hazard markers and road traffic signs installed.
8 Harewood End Village Anti-skid surfacing and red road markings applied.
9 Harewood End to Pengethley
At the Kynaston cross-roads drainage/service ducts installed; widening of the carriageway and new footway installed;
Anti-skid surfacing, road markings applied; and
Vegetation cleared.
10 Pengethley to Peterstow Landscape works including the removal of trees and
the lifting of tree crown; and
Signpost and hazard markers installed.
11 Peterstow to Wilton Anti-skid surfacing applied;
Asphalt pavement works; and
Road traffic signs installed.
2.11. Below are detailed descriptions of the works undertaken at the various sites
along the scheme section.
1. Redhill to Rotherwas Roundabout: Sections of the carriageway were surface planed and re-surfaced. Road markings were applied to the surface of the carriageway including ‘SLOW’ road markings. Additionally, glass road studs, road signs and hazard posts were installed, which included ‘side road ahead’ signs, directional signs and speed limit signs.
A49 Hereford to Ross-on-Wye LNMS | January 2015 | 5107696 16
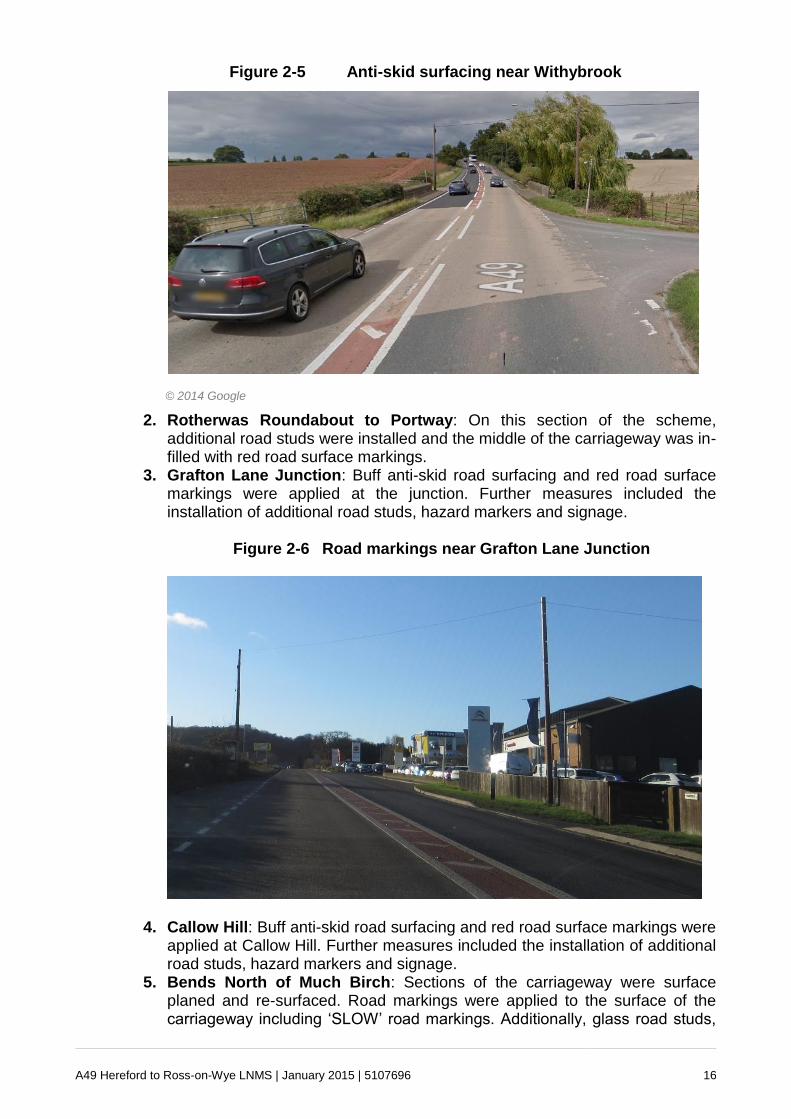
Figure 2-5 Anti-skid surfacing near Withybrook
© 2014 Google
2. Rotherwas Roundabout to Portway: On this section of the scheme, additional road studs were installed and the middle of the carriageway was in-filled with red road surface markings.
3. Grafton Lane Junction: Buff anti-skid road surfacing and red road surface markings were applied at the junction. Further measures included the installation of additional road studs, hazard markers and signage.
Figure 2-6 Road markings near Grafton Lane Junction
4. Callow Hill: Buff anti-skid road surfacing and red road surface markings were applied at Callow Hill. Further measures included the installation of additional road studs, hazard markers and signage.
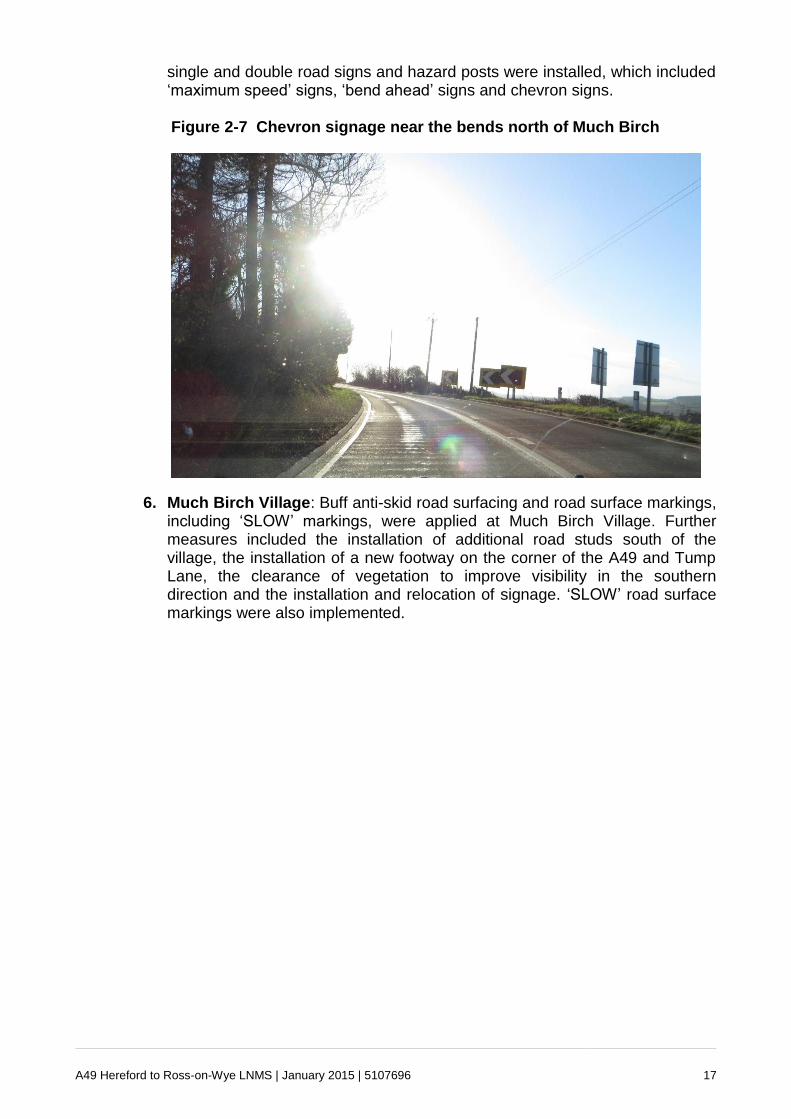
5. Bends North of Much Birch: Sections of the carriageway were surface planed and re-surfaced. Road markings were applied to the surface of the carriageway including ‘SLOW’ road markings. Additionally, glass road studs,
A49 Hereford to Ross-on-Wye LNMS | January 2015 | 5107696 17
single and double road signs and hazard posts were installed, which included ‘maximum speed’ signs, ‘bend ahead’ signs and chevron signs. Figure 2-7 Chevron signage near the bends north of Much Birch
6. Much Birch Village: Buff anti-skid road surfacing and road surface markings, including ‘SLOW’ markings, were applied at Much Birch Village. Further measures included the installation of additional road studs south of the village, the installation of a new footway on the corner of the A49 and Tump Lane, the clearance of vegetation to improve visibility in the southern direction and the installation and relocation of signage. ‘SLOW’ road surface markings were also implemented.

A49 Hereford to Ross-on-Wye LNMS | January 2015 | 5107696 18
Figure 2-8 Speed camera signs near Much Birch Village
Figure 2-9 New footway at Much Birch Village
© 2014 Google
7. Much Birch to Harewood End: Sections of the carriageway were surface planed and re-surfaced north of the junction at Yew Lane. Road markings were applied to the surface of the carriageway including ‘SLOW’ road markings. Additionally, glass road studs, single and double road signs and hazard posts were installed, which included ‘cross road ahead’, ‘slippery road’, ‘no stopping’, directional and distance road signs.

A49 Hereford to Ross-on-Wye LNMS | January 2015 | 5107696 19
Figure 2-10 Road markings between Much Birch and Harewood End
8. Harewood End Village: Buff anti-skid surfacing was applied to the section of the carriageway passing through the village as well as the application of road markings on both the northbound and southbound approaches to the village, which included ‘SLOW’ road surface markings.
9. Harewood End to Pengethley: The carriageway was widened and a new footway was installed at the Kynaston crossroads. Further measures at the crossroads included the installation of drainage and associated service ducts and tactile paving. Buff anti-skid road surfacing and red road surface markings were applied on this section, also. Further measures included the installation of additional glass road studs and directional signposts. Landscape works were undertaken to improve visibility and allow construction of the new footway. This included the removal of trees and undergrowth and the lifting of the tree crown to provide the 2.5m minimum headroom over the newly constructed footway.
10. Pengethley to Peterstow: On this section of the scheme, hazard markers and signposts were installed, which included ‘pedestrians crossing’ signs, directional signs and chevron signs. Landscape works were also undertaken, which included the removal of trees and the lifting of the tree crown to provide a minimum 5m headroom clearance.
11. Peterstow to Wilton: Buff anti-skid surfacing was applied to sections of the carriageway. Further measures included asphalt concrete pavement works and the installation of single and double posted signs. These included camera signs, maximum speed signs, national speed limit signs, ‘crossroads ahead’ signs, ‘no stopping at any time’ signs and advance direction signs (ADS).

A49 Hereford to Ross-on-Wye LNMS | January 2015 | 5107696 20
Figure 2-11 Signs to Bridstow
Site Observations 2.12. A site visit was undertaken between 11am and 12pm on Monday 8th December
2014. The scheme appeared to have been implemented as described in the PAR throughout.

A49 Hereford to Ross-on-Wye LNMS | January 2015 | 5107696 21
3. Traffic Volumes
Introduction 3.1. This section of the report considers the impact that the A49 Hereford to Ross-on-
Wye LNMS has had on traffic volumes. In order to do this, traffic volumes before and after the scheme implementation period have been compared.
Data Source
3.2. Traffic volume data from the HA database, TRADS, has been obtained for various locations along the scheme length. Figure 3-1 shows the locations of the TRADS data available. Please note that not all of the available TRADS data were used in the analysis.
Figure 3-1 Traffic Count Locations, TRADS database

A49 Hereford to Ross-on-Wye LNMS | January 2015 | 5107696 22
Long Term Traffic Trends
3.3. As scheme planning and construction is a process that takes a number of years, it is important to understand how traffic volumes have changed over time. Any significant long term changes may impact the way a scheme performs. To understand this, long-term traffic data has been evaluated. Figure 3-2 shows the average weekday traffic (AWT) on a monthly basis at a TRADS site location north of the A466 and south of Hereford (location 10 on Figure 3-1). This location was chosen as the available traffic data stretched a number of years, therefore providing a meaningful long term trend. Additionally, the location of the site is likely to be a fair representation of the traffic trends for the remainder of the scheme section. The graph shows the combined northbound and southbound traffic data.
Figure 3-2 Long Term Traffic Volumes on the Scheme Section
3.4. The chart shows that there has been an increase in traffic from 2002 to 2010 and then a slight decrease in traffic volumes from 2010 to 2013. However, overall there has been an increase in traffic volumes between the year 2002 and 2013.
3.5. The six monthly moving average, the red line in Figure 3-2, indicates the seasonal variability in traffic volumes. Traffic volumes on the A49 is shown to experience seasonal variation with traffic relatively higher through spring to autumn, but with a reduction each winter. Lower traffic levels through winter are considered typical across the highway network as wintery bad weather tends to reduce the traffic on the network.
3.6. To understand how this trend compares with national traffic growth, DfT traffic growth statistics are used for comparison. Figure 3-3 presents DfT statistics on road traffic growth since 2002 nationally for England and then more locally for Herefordshire. The graph represents the growth in vehicle kilometres travelled indexed from 2002.

A49 Hereford to Ross-on-Wye LNMS | January 2015 | 5107696 23
Figure 3-3 DfT Statistics on the Growth in Traffic (Vehicle Kilometres)
3.7. Figure 3-3 shows that the traffic growth observed nationally and more locally in Herefordshire has increased gradually since 2002 up until 2007. It has been in decline since then and is now slightly higher than the 2002 level. Overall, there has been a slight increase in traffic volumes both in Hertfordshire and nationally between 2002 and 2013. The long term traffic data on the A49 broadly aligns with this national trend, however the percentage increase in traffic since 2002 has been higher than the national trend.
Directly Before and After Traffic Trends
3.8. Figure 3-4 overleaf shows a summary of the directly before and after traffic volumes on the A49 scheme section. The traffic volume data is AWT and has also been taken from the TRADS database, as shown previously in Figure 3-1. Monthly data from October 2009 has been selected for the ‘before’ data and October 2013 has been selected for the after data. The month of October has been selected as seasonal traffic fluctuations are likely to have minimal impacts on traffic volumes during this month. Furthermore, the TRADS database had complete traffic volume data at all of the sites during the month of October during the before and after periods.
0%
1%
2%
3%
4%
5%
6%
2002 2003 2004 2005 2006 2007 2008 2009 2010 2011 2012 2013
Na
tio
na
l T
raff
ic G
row
th S
inc
e 2
00
2
England Herefordshire

A49 Hereford to Ross-on-Wye LNMS | January 2015 | 5107696 24
Figure 3-4 Before and After Opening Traffic Volumes on the A49
3.9. Figure 3-4 shows that in general traffic flows on the A49 between Hereford and Ross-on-Wye have decreased slightly since scheme opening. In the northbound direction traffic volumes reduced between 3% and 6% and in the southbound direction traffic volumes reduced between 2% and 4%. As this is a safety related scheme, this decrease is unlikely to be related to the scheme itself. The

A49 Hereford to Ross-on-Wye LNMS | January 2015 | 5107696 25
decrease in traffic aligns with the national DfT statistics, which shows that traffic in both England and Herefordshire has decreased slightly between 2009 and 2013.
Daily Traffic Patterns
3.10. By studying the daily traffic patterns, it is possible to identify peak periods during a given day, which may relate to accompanying peaks in accidents.
3.11. The HA TRADS sites 5 (northbound) and 6 (southbound), in Figure 3-4, have been selected to give a fair representation of the traffic flows on the A49, as the site is approximately located in the middle of the scheme section. Figure 3-5 shows the flow profile of the northbound daily traffic at the scheme location and Figure 3-5 shows the southbound daily traffic.
Figure 3-5 Average Hourly Traffic Northbound

A49 Hereford to Ross-on-Wye LNMS | January 2015 | 5107696 26
Figure 3-6 Average Hourly Traffic Southbound
3.12. Figure 3-5 and Figure 3-6 show that:
AM Peak traffic occurs between 0700 and 0900 on the weekdays in both the northbound and the southbound directions;
PM Peak traffic occurs between 1700 and 1900 on the weekdays in both the northbound and the southbound directions;
In the northbound direction the weekday PM peak is slightly higher than the weekday AM peak;
In the southbound direction the weekday AM peak is slightly higher than the weekday PM peak;
On both the Saturday and the Sunday the peak is somewhat different to the weekdays. There is a sustained peak between the hours of 1100 and 1800 in both directions for both the days; and
Summary Traffic volumes, since 2002, have increased up until 2010 and have declined
slightly after that. However, there has been an overall increase in traffic volumes between 2002 and 2013;
In line with the above, traffic volumes have reduced slightly upon scheme opening when looking just at the impacts directly before and after scheme opening. The reduction has varied between 2% and 6% across the various TRADS sites in the scheme section;
During the weekdays two distinct peak traffic periods have been identified, which are between 0700 and 0900 in the AM period and 1700 and 1900 in the PM period; and
During the weekends the traffic flows are somewhat different and show a longer and sustained mid-day peak period between 1100 and 1800.

A49 Hereford to Ross-on-Wye LNMS | January 2015 | 5107696 27
4. Journey Time Analysis
4.1. The scheme objective is to reduce the number of accidents per annum and as such journey times were not analysed and evaluated within the evaluation. It is assessed that the scheme measures had minimal impacts on journey times as indicated by the PAR.
A49 Hereford to Ross-on-Wye LNMS | January 2015 | 5107696 28
5. Safety Impacts
Introduction 5.1. A critical component of any highway scheme is safety. Irrespective of whether a
scheme is intended to reduce accidents or not, it is imperative to consider the safety record pre and post scheme to understand whether the scheme has had an impact on accidents. For this scheme it is particularly important as the primary scheme objective is to improve safety at the scheme location.
5.2. As such, this chapter:
Observes any changes to the number and location of accidents; Establishes whether the scheme has achieved the safety objectives set out in
Table 2.1 of this report; and Determines whether the scheme has resulted in an overall safety benefit or
dis-benefit.
5.3. All of the above accident measures are considered in this section, and a conclusion regarding the level of accident change due to the scheme is drawn.
Data Source 5.4. The PAR uses accident data for a five year period (1st January 2005 to 31st
December 2009) as evidence for the pre-scheme conditions at the scheme site. The area over which accidents are considered is highlighted in Figure 5-1.
5.5. The PAR covers the evidence used to support the decision to proceed with the scheme, effectively outlining the business case. However, once a PAR has been completed and agreed, there can be a time delay before the start of scheme construction.
5.6. In this case, construction did not begin until March 2011, hence there was a gap between the PAR accident dates and the start of construction, during which time the accident rates could have changed.
5.7. Therefore, accident data was requested from the ASC for the same area but from March 2006 to date. Unfortunately, the data was not available in the correct format, hence the data was sourced from the Highways Agency Regional Intelligence Unit (RIU). Note that the accident data provided by the RIU does not include information on accident causation or description.

A49 Hereford to Ross-on-Wye LNMS | January 2015 | 5107696 29
Figure 5-1 Accident Analysis Area

A49 Hereford to Ross-on-Wye LNMS | January 2015 | 5107696 30
Analysis
Comparison of pre and post scheme opening data
5.8. Table 5-1 provides a summary of the number of pre and post scheme accidents, along with a comparison of accident rates and the severity index.
Table 5-1 – Summary of Pre and Post Scheme Accidents
Period Date Range
Calculation Slight Serious Fatal TOTAL Severity Index
Pre Scheme Opening
10/03/06 –
09/03/11
No. of accidents
81 16 8 105
22.9% Accident rate per
year 16.2 3.2 1.6 21.0
Post Scheme Opening
27/04/12 –
31/12/13
No. of accidents
18 3 0 21
14.3% Accident rate per
year 10.8 1.8 0 12.6
5.9. Table 5-2 provides a summary of the predicted and outturn accident savings.
Table 5-2 – Summary of Predicted and Outturn Accident Savings
Period Opening Year Scheme Life
Predicted 14.2 740
Outturn 8.4 437
5.10. The key points to note from Table 5-1 and Table 5-2 are:
The pre-scheme annual average accident rate was 21.0, which has decreased to 12.6 in the post opening period. This creates a post opening accident saving of 8.4 accidents. This is lower than the predicted accident saving of 14.2;
The post-scheme severity index of 14.3% (comprising three serious and zero fatal accidents) indicates that the scheme has also improved the area's severity index from the pre-scheme severity index of 22.9%; and
The number of post-scheme fatal accidents have been completely eradicated to zero in the opening year.
Accident Causation
5.11. Unfortunately, the data received from the RIU does not provide information on accident causation or any description of the accidents, hence it was not possible to analyse and evaluate accident causation. The PAR did not suggest which types of accidents it intended on reducing. However, due to the fairly significant accident saving achieved by the scheme it is reasonable to assume that multiple

A49 Hereford to Ross-on-Wye LNMS | January 2015 | 5107696 31
types of accidents have been reduced or eradicated through the measures introduced.
Accident Location
5.12. Figure 5-2 and Figure 5-3 show the locations of the pre-scheme and post-scheme accidents and the approximate locations of the scheme works sites.
Figure 5-2 Pre-Scheme Accident Locations
Figure 5-3 Post-Scheme Accident Locations
A49 Hereford to Ross-on-Wye LNMS | January 2015 | 5107696 32
5.13. The key points to note from Figure 5-2 and Figure 5-3 are:
Pre-scheme accident clusters are in close proximity to the 11 scheme works sites;
Some of the post-scheme accident clusters are in similar locations to pre-scheme accident clusters;
The number of fatal and serious accidents have reduced considerably and do not show any obvious clustering; and
There were obvious pre-scheme accident clusters near the scheme works sites 6, 7 and 8. However, these accident clusters have not occurred post-scheme.
Accident Time
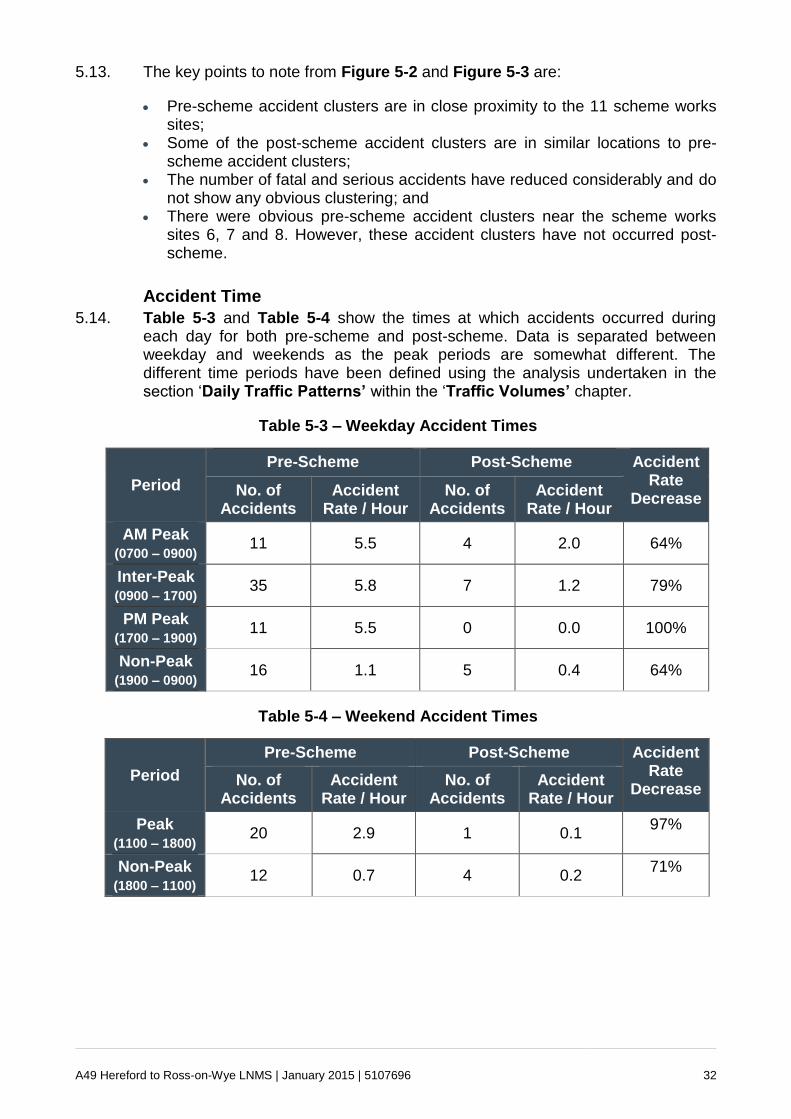
5.14. Table 5-3 and Table 5-4 show the times at which accidents occurred during each day for both pre-scheme and post-scheme. Data is separated between weekday and weekends as the peak periods are somewhat different. The different time periods have been defined using the analysis undertaken in the section ‘Daily Traffic Patterns’ within the ‘Traffic Volumes’ chapter.
Table 5-3 – Weekday Accident Times
Period
Pre-Scheme Post-Scheme Accident Rate
Decrease No. of
Accidents Accident
Rate / Hour No. of
Accidents Accident
Rate / Hour
AM Peak (0700 – 0900)
11 5.5 4 2.0 64%
Inter-Peak (0900 – 1700)
35 5.8 7 1.2 79%
PM Peak (1700 – 1900)
11 5.5 0 0.0 100%
Non-Peak (1900 – 0900)
16 1.1 5 0.4 64%
Table 5-4 – Weekend Accident Times
Period
Pre-Scheme Post-Scheme Accident Rate
Decrease No. of
Accidents Accident
Rate / Hour No. of
Accidents Accident
Rate / Hour
Peak (1100 – 1800)
20 2.9 1 0.1 97%
Non-Peak (1800 – 1100)
12 0.7 4 0.2 71%

A49 Hereford to Ross-on-Wye LNMS | January 2015 | 5107696 33
5.15. The key points to note from Table 5-3 and Table 5-4 are:
Pre-scheme accident rates during the peak periods both on the weekends and weekdays were higher than non-peak periods as suspected. This is likely to be as a result of the higher volumes of traffic during the peak periods;
The highest pre-scheme accident rate per hour (5.8) was observed during the weekday inter-peak period; and
A greater decrease in accident rates per hour is observed during the peak and inter-peak periods than in the non-peak periods both on the weekdays and weekends.
Summary The opening year accident saving is 8.4, which is lower than the predicted
opening year accident saving (14.2) in the PAR, albeit still a significant saving;
The accident severity index has reduced from 22.9% to 14.9% upon scheme completion, with no fatalities;
There are no obvious signs of clusters of serious or fatal accidents upon scheme completion;
Accident rates, in general, were higher during peak hours as suspected. This is likely to be as a result of the higher volumes of traffic during these periods; and
As the scheme was implemented to reduce the high accident rates and severity along the scheme section, it can be seen that this objective has been successfully achieved.

A49 Hereford to Ross-on-Wye LNMS | January 2015 | 5107696 34
6. Economy
Introduction 6.1. This section of the report takes the safety impacts reported in section 5, and
considers the monetary value of these impacts. These monetised benefits are then compared to the cost of scheme construction to inform two measures of value for money: the First Year Rate of Return (FYRR) and the Benefit Cost Ratio (BCR).
6.2. All monetised figures in this section are quoted in 2002 prices, discounted to opening year, unless otherwise specified.
PAR and Outturn Comparison 6.3. The evidence used in this report has been provided to consider the scheme
costs and economic benefits of the scheme provided in the PAR and to calculate the outturn costs and scheme benefits based on empirical evidence from a year after opening.
6.4. Table 6-1 provides this comparison between the PAR and outturn costs and benefits of the scheme. It also includes the opening year and scheme life costs and benefits of the scheme. Please note that, as shown in Section 4, the scheme has not had an impact on journey times and hence no monetised figures are included in the table below. The accident benefits of the scheme discussed earlier in the report have however been monetised using standard values of accidents from WebTAG.
Table 6-1 – PAR and Outturn Economy Comparison
PAR Outturn
Opening Year
(2012)
Total Cost £2.386m £1.913m
Opening Year Accident Saving (number)
14.2 8.4
Opening Year Accident Saving (£)
£1.771m £1.048m
Opening Year Vehicle Hours Saving (number)
N/A N/A
Opening Year Journey Time Benefits (£)
N/A N/A
FYRR 74% 55%
Scheme Life (60 years)
Costs £2.386m £1.913m
Safety Benefits £61.891m £36.611m
Journey Time Benefits N/A N/A
BCR 25.9 19.1
A49 Hereford to Ross-on-Wye LNMS | January 2015 | 5107696 35
Summary 6.5. The scheme is shown to have been less successful than was predicted.
However, the scheme has resulted in an overall beneficial impact.
6.6. It was anticipated that the scheme would deliver large safety benefits, which was based on an opening year accident saving of 14.2 accidents. However, the scheme did not achieve this target and achieved an opening year saving of 8.4 accidents. As a result the opening year accident benefit is lower than expected, but still high, at £1.048m.
6.7. The primary focus of the scheme was to reduce the number of accidents, hence the measures did not focus upon journey times and have not been analysed and evaluated.
6.8. The outturn scheme costs were lower than those predicted in the PAR evaluation: £1.913m outturn cost compared to the £2.386m cost that was predicted. There are no obvious reasons for the lower outturn cost.
6.9. All of the above points contribute to an outturn FYRR of 55%, which is lower than the predicted figure of 74%. The 60-year outturn BCR of 19.1 is lower than expected BCR in the PAR, but is still higher than the typical BCR of a Large LNMS, which is 15.7. The scheme’s BCR is considered ‘very high’ based on the DfT’s value for money (VfM) assessment. Therefore this BCR is indicative of a successful scheme, representing good value for money for the HA.

A49 Hereford to Ross-on-Wye LNMS | January 2015 | 5107696 36
7. Other Impacts
7.1. This section of the report presents information, on the scheme’s impact on the other WebTAG objectives which have yet to be considered in this report, namely, society and environment. This information will be compared to the forecasts made in the PAR’s Appraisal Summary Table (AST) (see Appendix A).
7.2. The comparisons are used to score the scheme against WebTAG objectives based on the first years observed findings and are recorded in the Evaluation Summary Table (EST). The EST can be found in Appendix B.
7.3. Those impacts which are not detailed below have been evaluated as neutral or not applicable for this scheme.
Journey Quality 7.4. In PAR 6.1, journey quality is an economy impact, related to traveller care, views
and stress. The scheme’s PAR assessed the impact as ‘not applicable’. However, driver frustration will have reduced following scheme opening due to improved road alignment at certain parts of the scheme; whilst fear of potential accidents would have reduced due to improved signage and road surfacing and better directional signage along the route. Each of these impacts are given a journey quality score of +1, hence giving journey quality an overall score of +3.
7.5. The combination of these aspects means the scheme has resulted in a beneficial impact in terms of journey quality.
Landscape 7.6. The PAR stated that the landscape impact to the scheme was ‘not applicable’.
However, new road signage and hazard marker posts were introduced as part of the scheme. Additionally, vegetation was cleared to improve lighting and driver visibility. Therefore, due to the implementation of these new measures, the impact on Landscape is deemed to be ‘slight adverse’.

A49 Hereford to Ross-on-Wye LNMS | January 2015 | 5107696 37
8. Conclusions and Recommendations
8.1. This report presents the POPE of the A49 Hereford to Ross-on-Wye AIP, implemented by the Area 9 ASC and opening on 26th April 2012. The scheme evaluation has considered all elements of the WebTAG criteria.
8.2. The purpose of this section is to:
Summarise the key impacts of the scheme and how these compare to forecasts; and
Consider the lessons learnt and make recommendations to improve future LNMS.
Summary of Scheme Impacts
Traffic
Traffic volume is slightly lower in post-scheme 2012 when compared to pre-scheme 2011 levels. This is in line with national traffic trends, where traffic volume has declined following the economic recession; and
Journey times were not evaluated as this safety focussed scheme was considered not to impact on journey times.
Safety
The PAR predicted an accident saving of 14.2 in the opening year as a result of the scheme;
The actual saving was calculated as 8.4 accidents per annum, from 20 months of post-scheme accident data. This equates to a reforecast saving of 437 accidents over the 60 year scheme life. This is lower than the expected 740 PIC’s, albeit still significant;
The accident severity index has reduced from 22.9% to 14.9% upon scheme completion;
There are no obvious signs of clusters of serious or fatal accidents upon scheme completion; and
Economy
The scheme was forecast to cost £2.386m (discounted to Opening Year (OY)), but came in much lower than this at £1.913m (discounted to OY);
The overall first year benefits are significant, but are lower than the PAR forecast due to lower than expected accident saving benefits;
The PAR had forecast first year accident saving benefits of £1.77m (discounted to OY) but the scheme actually delivered £1.048m (discounted to OY);
The lower cost and safety benefits have caused the FYRR to be lower than expected at 55%, which is high for a scheme of this cost;
Scheme life benefits are reforecast at £36.6m, which is lower than what was forecasted in the PAR; and
The reforecast BCR is 19.1 over the 60 year corrected assessment period. This is higher than the average Large LNMS and represents ‘very good’ value for money.

A49 Hereford to Ross-on-Wye LNMS | January 2015 | 5107696 38
Other Impacts
The scheme had a beneficial impact on journey quality due to a reduced fear of accidents due to improved signage and road surfacing and better directional signage along the route;
The impact on landscape is deemed to be ‘slight adverse’ due to the installation of new traffic signs and hazard marker posts as well the clearance of vegetation; and
All other objectives have been scored as neutral or not applicable as predicted.
Scheme Specific Objectives
8.3. Drawing on information presented in this report, a summary of the scheme’s success against the scheme specific objectives, listed in the introduction to this report, is provided in Table 8-1.
Table 8-1 – Scheme Specific Objectives
Objective Success
Safety: Reduce the number of accidents
The scheme has had a significant impact in reducing accidents, with the annual accident rate falling from 21.0 in the 5 year pre-construction period to 12.6 after the introduction of the scheme. The scheme has also successfully reduced the number of KSI accidents.
Lessons Learnt
8.4. During the course of this evaluation, a number of findings have revealed ways in which the LNMS appraisal process or the scheme could have been improved. These are summarised:
The route will need to be further assessed for potential safety improvements and accident saving measures, as the number of accidents have not reduced by as much as expected. Measures could include additional glass road studs; hazard markers; anti-skid road surfacing; traffic signposts and vegetation clearance at other potential sites along the route.

Appendices

A49 Hereford to Ross-on-Wye LNMS | January 2015 | 5107696 40
Appendix A. AST
Sub-Objective Key Points Metrics Assessment Assess
EC
ON
OM
Y
TEE (Business and Commuting Users)
Impact Not Applicable Impact Not Applicable Impact Not Applicable Not Applicable
Reliability (Business and Commuting Users)
There is no change in the capacity of the
oversaturated traffic lanes. The IRV benefits
are a result of the reduction in accidents
Not Applicable DDV Neutral
IRV Large Beneficial Beneficial
Regeneration Impact Not Applicable Not Applicable Impact Not Applicable Not Applicable
Journey Quality Impact Not Applicable Impact Not Applicable Impact Not Applicable Not Applicable
Wider Impacts Impact Not Applicable Impact Not Applicable Impact Not Applicable Not Applicable
EN
VIR
ON
ME
NT
Noise Impact Not Applicable Impact Not Applicable Impact Not Applicable Not Applicable
Air Quality Impact Not Applicable Impact Not Applicable Impact Not Applicable Not Applicable
Greenhouse gases
Impact Not Applicable Impact Not Applicable Impact Not Applicable Not Applicable
Landscape Impact Not Applicable Impact Not Applicable Impact Not Applicable Not Applicable
Townscape Impact Not Applicable Impact Not Applicable Impact Not Applicable Not Applicable
Heritage of Historic Resources
Impact Not Applicable Impact Not Applicable Impact Not Applicable Not Applicable
Biodiversity Impact Not Applicable Impact Not Applicable Impact Not Applicable Not Applicable
Water Environment
Impact Not Applicable Impact Not Applicable Impact Not Applicable Not Applicable
SO
CIE
TY
TEE (Other users)
Impact Not Applicable Impact Not Applicable Impact Not Applicable Not Applicable
Reliability (Other Users)
There is no change in the capacity of the
oversaturated traffic lanes. The IRV benefits
are a result of the reduction in accidents
Not Applicable DDV Neutral
IRV Large Beneficial Beneficial
Physical Activity Impact Not Applicable Impact Not Applicable Impact Not Applicable Not Applicable
Accidents
The predicted accident savings have been
calculated in the first year in accordance with
RoSPA guidelines
740 Accidents saved Accidents PVB = £61.9m (discounted to opening
year) Beneficial
Security Impact Not Applicable Impact Not Applicable Impact Not Applicable Not Applicable

A49 Hereford to Ross-on-Wye LNMS | January 2015 | 5107696 41
Access to Services
Impact Not Applicable Impact Not Applicable Impact Not Applicable Not Applicable
Affordability Impact Not Applicable Impact Not Applicable Impact Not Applicable Not Applicable
Severance Impact Not Applicable Impact Not Applicable Impact Not Applicable Not Applicable
Option Values Impact Not Applicable Impact Not Applicable Impact Not Applicable Not Applicable
PU
BLIC
AC
CO
UN
TS
Transport Budget
PVC Calculated within evaluation
Investment Cost PVC = £1.166m Operating
(maintenance) Cost PVC = £1.220m
Total Cost PVC = £2.386m
Adverse
Wider Public Finances
Safety Scheme. No Economic Benefits
Tax Benefit PVB = £0.00m
Tax Benefit PVB = £0.00m
Neutral

Appendix B. EST
Sub-Objective Key Points Metrics Assessment Assess
EC
ON
OM
Y
TEE (Business and Commuting Users)
No monetisation of journey times undertaken
N/A Not Assessed Not
Applicable
Reliability (Business and Commuting Users)
IRV - the assessment is the result of a reduction in accidents
PIC savings in opening year of 8.4. Which is
lower than the predicted 14.2 PIC savings in the
opening year.
DDV Neutral IRV Large Beneficial
Beneficial
Regeneration Not Applicable as set out in the PAR 6 TAME ACO Guidance Note.
N/A Not Assessed Not
Applicable
Journey Quality
o Driver frustration would have reduced due to improved road alignment at certain parts of the scheme (+1) o Fear of potential accidents reduced due to improved signage and road surfacing (+1) o Better directional signage along the route (+1)
+3 Large Beneficial Beneficial
Wider Impacts Not applicable as set out in the PAR 6 TAME ACO guidance notes
N/A Not Assessed Not
Applicable
EN
VIR
ON
ME
NT
Noise
Data not available to quantify the change in
traffic flows, numbers of HGV's & traffic speeds.
N/A Not Assessed Not
Applicable
Air Quality
Data not available to quantify the change in
traffic flows, numbers of HGV's & traffic speeds.
N/A Not Assessed Not
Applicable
Greenhouse gases
No change in total distance travelled by traffic
N/A Not Assessed Not
Applicable
Landscape
Slight adverse as the scheme involved the installation of a number of hazard marker posts, speed signs and directional signs.
N/A Slight Adverse Adverse
Townscape Not Applicable Not Applicable Not Assessed Not
Applicable
Heritage of Historic Resources
Scheme does not impact on any archaeological or
heritage sites N/A Not Assessed
Not Applicable
Biodiversity Not Applicable as scheme is within highway boundary
N/A Not Assessed Not
Applicable
Water Environment
Scheme does not impact on the water environment
N/A Not Assessed Not
Applicable
SO
CIE
TY
TEE (Other users)
No monetisation of journey times undertaken
N/A Not Assessed Not
Applicable
Reliability (Other Users)
IRV - the assessment is the result of a reduction in accidents
PIC savings in opening year of 8.4. Which is
lower than the predicted 14.2 PIC savings in the
opening year.
DDV Neutral IRV Large Beneficial
Beneficial
Physical Activity Scheme does not impact
on physical activity N/A Not Assessed
Not Applicable

Accidents
The predicted accident savings have been
calculated in the first year in accordance with RoSPA
guidelines
437 accidents saved during the scheme life
and 8.4 during the opening year.
Accidents PVB = £36.6m (discounted to opening
year) Beneficial
Security Scheme does not impact
on security N/A Not Assessed
Not Applicable
Access to Services
Not Applicable as set out in the Standard PAR
Assessment Guidance. N/A Not Assessed
Not Applicable
Affordability Impact not Applicable N/A Not Assessed Not
Applicable
Severance
Data not available to evaluate the impact of the
scheme on Physical Activity.
N/A Not Assessed Not
Applicable
Option Values Not Applicable as set out
in the Standard PAR Assessment Guidance.
N/A Not Assessed Not
Applicable
PU
BLIC
AC
CO
UN
TS
Transport Budget PVC Calculated within
evaluation
Investment Cost PVC = £0.694m
Operating (Maintenance) Cost PVC = £1.219m
Total Cost PVC = £1.913m Neutral
Wider Public Finances
Impact not Applicable N/A Not Assessed Not
Applicable