population ageing, macroeconomic crisis and policy challenges · 1 keynes, j. m., “some economic...
TRANSCRIPT

Population Ageing, Macroeconomic Crisis
and Policy Challenges
Prepared for the Panel “The General Theory and the Policy Reponses to
Macroeconomic Crisis” at the 75th Anniversary Conference of Keynes’
General Theory, University of Cambridge, June 19-21
Kiyohiko G. Nishimura
Deputy Governor, Bank of Japan
Bank of Japan J u n e 2 0 , 2 0 1 1

1
1. Introduction: Macroeconomic Crisis and Long-Run Fundamentals
I am honored and thrilled to participate in this conference commemorating the 75th
anniversary of the publication of Keynes’ General Theory. In particular, being an
academic-turned-central banker, the opportunity to participate in this panel on policy
responses to macroeconomic crisis, is a great privilege. The task before me, as a central
banker, is to describe the responses of central banks to the macroeconomic crisis of 2008,
especially their “unconventional policies”. In addition, I hope to add some color to our
discussion on the consequences of the financial crisis by drawing on the Japanese
experience, which suggests a long and winding road in the post-crisis period.
Having set the parameters of my presentation, I would like to start my presentation by
expressing my uneasiness over the smugness that I sense among commentators on macro
theory and policy. Very often, I hear that the worldwide asset market bubbles and
resulting macroeconomic crisis of 2008 was due to financial excess, and therefore
macroeconomic fundamentals have not changed, either before the crisis, or since.
Financial excesses in the bubble years accumulate on the balance sheets of those who
leverage heavily, and the prevalence of such problems may become a drag on economic
recovery for some time, but eventually time will heal the wounds and everything will be
back to normal. In other words, the issue at stake is maintaining financial stability, and all
that is required of economic theory and policy is to supplement their theoretical and policy
toolkits by adding measures to check financial excess before it builds up and to control
systemic damage when bubbles burst.
Lord Keynes, who laid the foundations of macro theory and policy three-quarters of a
century ago would most certainly have challenged such a view, if he were attending this
conference. In fact, just one year after the publication of the General Theory, in a speech

2
whose theme still resonates today, he has alluded to the issue at the root of my uneasiness1.
So let me stand on his shoulders and explain.
There is a remarkable correlation between asset market bubbles that cause macroeconomic
crisis and demographical changes. In Figures 1.1 and 1.2, I show Japan, the United States,
Spain and Ireland as examples of countries affected by the financial crisis2. In these
countries, the formation of bubbles in asset markets seems to coincide with a growing
inverse dependency ratio, which is the ratio of the working population to the non-working
(dependent) population. Meanwhile, busts in asset markets seem to happen when the
inverse dependency ratio declines noticeably.
Moreover, there also seems to exist a relation between asset market bubbles and
demographical changes at the international level, which, borrowing from Lord Keynes,
could be described as the demographic consequences of globalization. In the past decades,
once non-market economies such as Russia and China were folded into the global market
economy. As a consequence, the working population of the “market-economy world,”
which once consisted largely of the so-called industrialized economies, has expanded
dramatically, since the aggregate working population of China and others is much larger
than that of the industrialized economies. Against this background, we witnessed a truly
global asset market boom, synchronously involving many regions, and which culminated in
the crisis of 2008. Real property prices across a wide area of the globe surged nearly
threefold within a decade.
The significant point for us here is that the bubble we have experienced coincided closely
with the turning point in demographic trends. Such demographic perspective casts serious
1 Keynes, J. M., “Some Economic Consequences of Declining Population,” Eugenics Review, Vol.19, April 1937, pp.13-17. 2 I presented this correlation elsewhere some time ago (see Nishimura, K. G., “This Time May Truly Be Different: Balance Sheet Adjustment under Population Ageing,” a speech presented at the 2011 AEA Annual Meeting, Denver, January 7, 2011). Appendix updates and expands the figures, showing this correlation using newly available data on world population prospects.

3
doubts on the view that little has changed in the fundamental character of the global
economy even after the crisis of 2008. It will form the core of my argument in this
presentation. The perspective directs us to recognize the fact that we are in the midst of a
balance sheet adjustment process after the worldwide financial bubble burst, at a time when
the population is ageing. This is not the balance sheet adjustment of the past, which took
place when the population was young and growing. This is a balance sheet adjustment
when the demography is rapidly tilting toward the old. With the change (though gradual)
in demography, which is one of the long-run macroeconomic fundamentals, between the
pre-crisis and the post-crisis era, macroeconomic policy challenges are also likely to have
changed accordingly.
In Section 2, I consider the acute impact of demography on asset prices. Assets such as
residential property and company shares are stores of value enabling the transfer of
purchasing power from one period to the next, as well as productive resources creating
goods and services. I concentrate on the former characteristic of assets, namely, their role
as stores of value. A simple, rather mechanical overlapping generation model suggests a
correlation between residential property prices and the inverse dependency ratio, which is
in fact found in many of the countries suffering financial crisis. When applied to the
market-economy world as a whole, this simple model also suggests that globalization of the
scale we have experienced over the past decades is likely to produce unprecedented
increases in asset prices. Moreover, the example also suggests that the go-go age of asset
booms has passed, and ageing populations imply that the rate of return on assets will be
substantially smaller in the post-globalization era than in the globalization era. In fact, it
will be even smaller than in the pre-globalization era.
In Section 3, I begin by examining the process of balance sheet adjustment after the
bursting of a bubble and when the population is ageing, juxtaposing Japan in the 1990s and
the United States in the 2000s. Then, I summarize the consequences of severe, prolonged
balance sheet adjustment under population ageing. I identify the multi-faceted challenges

4
central banks may face as a consequence of carrying out balance sheet adjustments under
population ageing. There I explain unconventional policies to tackle these problems, taking
the Bank of Japan’s efforts as an example. In the final section, I will give some thoughts
on the population issue in the tradition of Cambridge, especially with respect to
technological innovation.
2. Background of Financial Crisis: Population Ageing and Globalization
Population Growth and Longevity After 1955
Let me first examine the changing characteristics of population dynamics. Table 2.1
shows population growth estimates for selected countries in selected years, based on the
most recent United Nations population figures. As an illustration, I take the United States,
United Kingdom, Germany, France, Italy and Japan to comprise the Developed area of the
market-economy world. I take China and Russia to represent the former communist
countries that have become incorporated into the market-economy world. In this table,
they represent the Emerging area of the market-economy world. Table 2.2 depicts
population longevity for the same countries.
These tables illustrate three facts. First, looking at each country’s population growth and
longevity, we see simultaneous declining population growth and increasing longevity.
This implies that many countries face a sizable increase in working-age population up to a
certain point in time, when the population then begins to age rapidly, with no exception, at
least for the countries in this table.
Second, if you compare the size of the Emerging population with that of the Developed, the
huge impact of globalization is immediately apparent. In 2005, the Emerging area was
more than twice as populous as the Developed. This table illustrates a big jump in the
“market-economy world population” when the Emerging is incorporated into the

5
market-economy world. As is apparent, it is the China factor that drives these dynamics.
Third, however, the incorporation of the Emerging area through globalization does not help
halt the population ageing of the market-economy world. Population growth in the
Emerging area is actually expected to be lower than that in the Developed area.
Conceptual Framework: Simple Overlapping-Generation Model with Pure Store of Value
Although ageing populations may have a sizable effect on the economy, current
sophisticated mainstream models are not particularly suited to examining the impact of the
brute force of demographic factors, globalization and ageing, on asset prices as stores of
value.3 To tackle demographic factors squarely, I take the other extreme of simplicity.
Specifically, I use a skeleton form of an overlapping generation model, in which there is
only one type of asset of no intrinsic value, and this serves as a pure store of value.
As in familiar overlapping generation models in introductory economic theory, I assume
people live in two periods, and that there are the Young and the Old at any point in time.
The Young produce one unit of non-storable consumption goods, which are the sole goods
in this world. There is only one type of asset, called Pure-Store-of-Value (PSV) assets. They
yield nothing and thus have no intrinsic value, but they are the only stores of value in this
world. That is, PSV assets are the only means to save, or to transfer purchasing power from
one period to the next. The quantity of PSV assets is fixed and constant over time. People
accumulate PSV assets in exchange for the consumption goods they produce when they are
young, and trade them for consumption goods when they are old.
3 These sophisticated models (e.g., dynamic stochastic general equilibrium models), which are now the popular workhorses of macroeconomic analysis, typically assume life-long utility-maximizing representative agents who live infinitely (or in more sophisticated settings, decease probabilistically with a constant proportion) and are endowed with ability to form true-model-consistent own macro econometric models in an economy with the rest of the world as exogenously given. Because of these settings, it is not easy to analyze the effects of the unexpected incorporation into the market-economy world of former communist countries with huge populations, and the subsequent rapid ageing of the market-world population, that is, the increase in the Old as a proportion of the population.

6
To make the analysis even more transparent and mechanical, I make the extreme
assumption that the Young are constrained not to consume but to save. Thus, unlike usual
overlapping generation models, there is no utility maximization of the Young: the Young
produce the consumption goods, trade them with the Old to get PSV assets, and save them
for the next period.
In this economy, there is only one market, in which the consumption goods produced by the
Young are traded for PSV assets possessed by the Old. The supply of consumption goods
is equal to the number of young people, since one young person produces one unit of the
consumption goods and, by assumption, she does not consume it. The supply of PSV
assets possessed by old people is fixed by definition. Thus, the purchasing power of PSV
assets, or the price of PSV assets in terms of the consumption goods is:
Price of the PSV Asset = (Number of the Young) divided by (Quantity of the Assets)
Since the quantity of PSV assets is fixed, the change in the number of the Young determines
the change in the price of PSV assets. Consequently, the PSV asset price inflation rate is:
PSV Asset Price Inflation Rate = (Ratio of the Young to the Old Population) – 1
This model is admittedly simplistic: specifically, it is stripped of consumption and saving
decisions (optimization), capital stocks (including human capital), and technological
progress. More realistic models may bring smoother generational consumption/
rate-of-return paths through capital stock formation, and so on 4 . However, the
demographic factors explained in this simple example are brute and forceful, and it seems
unlikely that incorporation of inter-temporal optimization and other adjustment processes
4 If the Young are not constrained to save, they then face inter-temporal optimization of consumption allocation. Introductory economic theory tells us that in such a case there may be multiple equilibria. However, the thrust of the following argument is generic and likely to be carried over to each of these multiple equilibria.

7
would completely undermine the basic results.
Closed Economy: Inverse Dependency Ratio and “Boom and Bust” in Property Markets
Let me now apply this model to the real world. Assets such as residential and commercial
property, equities and even art objects are essentially all “long-term stores of value,” that is,
means of transferring purchasing power from the present to the immediate as well as distant
future. And among these long-term stores of value, residential property is usually the
most popular in many countries for various reasons including preferential tax treatment.
So if the model has a reasonable explanatory power, we expect movement in real residential
property prices5 to coincide with that of the inverse dependency ratio (i.e., ratio of
working-age (15-60) population to the rest), which corresponds to the ratio of the young
working population to the old non-working dependent population in the simple OLG model,
abstracting from child-age population.
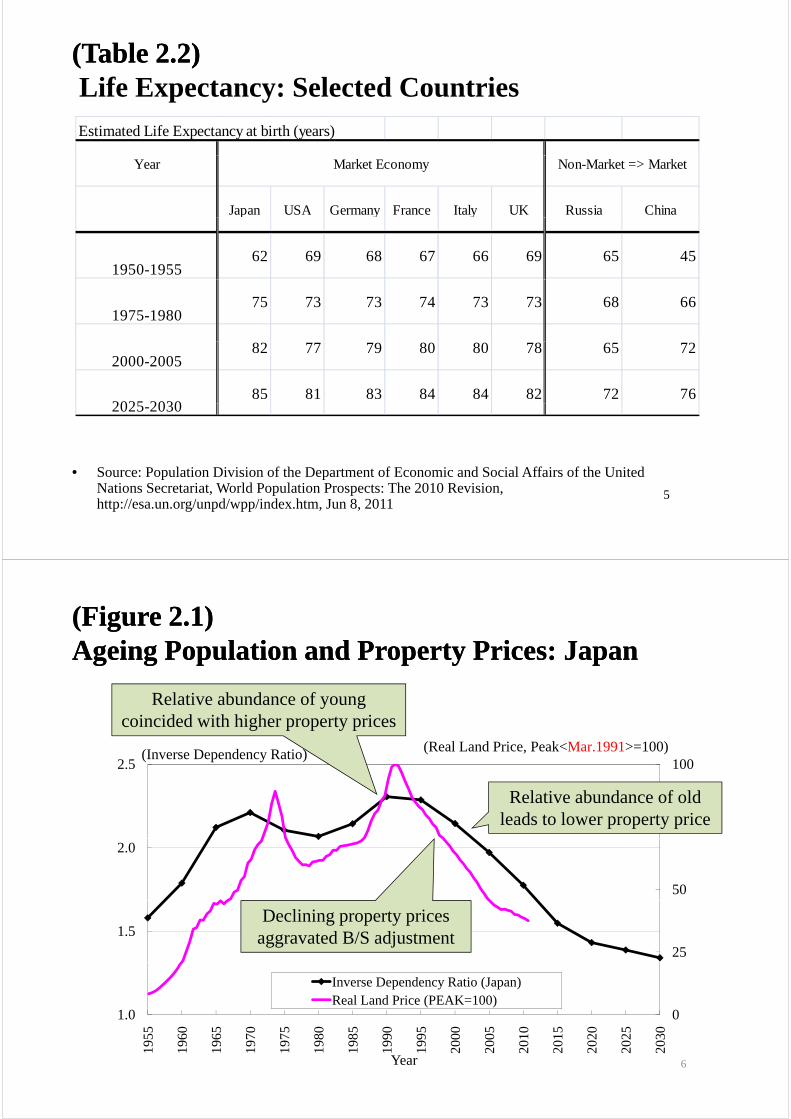
Figure 2.1 shows real land prices in Japan (national average, for all purposes) juxtaposed
with the inverse dependency ratio from 1955 to date. This figure shows, firstly, that the
relative abundance of young people coincided with sharply higher property prices.
Secondly, in contrast, the relative abundance of old people seems to be leading to lower
property prices. It should be noted here that declining property prices greatly aggravated
the balance sheet adjustments of Japanese corporations, as will be explained later. The US
case is illustrated in Figure 2.2. In the United States also, an increasing inverse
dependency ratio seems to have coincided with the property bubble. After the bubble
burst of 2007, property prices seem to have followed the long run movement of the inverse
dependency ratio, although it would be premature to draw any conclusions from this at the
moment.
5 More precisely speaking, the model implies that generation-to-generation real asset price inflation is determined by the inverse dependency ratio. This means that current generation-period real asset prices are higher than previous if the inverse dependency ratio is increased from the previous generation-period. Typically, one generation-period is considered as 25 years or longer. Thus, in order for this relationship to hold within this long generation-period, we expect a positive correlation between real property prices and the slow-moving inverse dependency ratio.

8
How about the European experience? Figure 2.3 shows the situation in Ireland. A sharp
ascent in property prices coincided with an increase in the inverse dependency ratio, and
then we see a free fall. This free fall suggests a painful adjustment is coming. Spain is
shown in Figure 2.4. Again, a sharp increase in property prices coincided with an increase
in the inverse dependency ratio, and then prices declined. Germany, having no bubble in
2008, is shown in Figure 2.5, where property price movement is depicted after 1995, when
data are available. In contrast with Ireland and Spain, property prices in Germany had
already begun to decline in 2010, coinciding with the population ageing that the country
has experienced for some time. Recovery of property markets to the previous peak seems
far away in an ageing society.
Globalization: From Exuberance to Stagnation in Global Asset Markets
Let me now consider the effects on asset prices of globalization, in particular
marketization6 of former communist countries into the market-economy world. To do
this, we apply the simple overlapping generation model just described, as if the
market-economy world were one big economy. Thus, I ignore productivity differences
between regions, immigration and emigration, uncertainty, and in particular, exchange rate
adjustments.
I illustrate the possible impact of globalization by using the numerical example of Table 2.3,
which is based on the United Nations population estimates of Table 2.1. To make the
analysis as simple as possible, I take 25 years as a one-generation period postulated in the
overlapping generation model described before. We will consider three periods: the Cold
War (Period 1, represented by 1955), pre-globalization (Period 2, by 1980), and
globalization (Period 3, by 2005). Also, to simplify the analysis but to add a realistic flavor,
we take population numbers of respective years in Table 2.1 as those of the young
6 Merriam-Webster’s Online Dictionary defines marketization as “the act or process of entering into, participating in, or introducing a free market economy.”

9
population.7 These two assumptions lead to the figures in Table 2.3. I also assume that
the quantity of PSV assets is fixed at, say, 100 million in the market-economy world.
Suppose that in the Cold War and pre-globalization periods (Periods 1 and 2), the
market-economy world consists solely of the Developed area of six industrialized
economies, as shown in Table 2.1. Then, in Period 1, the market-economy-world Young
population is the same as that of the Developed area, about 473 million. The Old
population in the Cold War period is that of the Developed area, and as a whole they
possess 100 million PSV assets. The Young population trades 473 million units of
consumption goods for 100 million PSV assets that the Old population possesses.
Consequently, the price of PSV assets is about 4.73 units of consumption goods in Period 1.
A similar situation holds true in the pre-globalization period, where the price of PSV assets
is about 5.90 units of consumption goods. Consequently, the asset price inflation rate in
the pre-globalization period is 0.89% per annum.
Then, consider globalization. The Emerging area (that is, Russia and China) is incorporated
into the market-economy world in the globalization period (Period 3). I assume
throughout a fixed exchange rate between the Developed area and the Emerging one.
Thus, there is one free worldwide market of consumption goods traded for PSV assets. Like
the Young in the Developed area, the Young in the Emerging area produce one unit of
consumption goods, and sell it to the Old to obtain PSV assets for their retirement. The
Old only exist in the Developed area in the worldwide consumption goods market, since the
Old in the Emerging area have no PSV assets and cannot buy consumption goods in the
worldwide market. The Old in the Emerging area are therefore ignored in the following
analysis. (They are assumed to be outside of the market-economy world.)
The Young population of the market-economy world is then the sum of that of the
Developed and of the Emerging area, about 2.14 billion. The Young populations of both 7 This simplifying assumption overstates the actual young population, but it does not qualitatively affect the following analysis.

10
regions want to trade their consumption goods of about 2.14 billion units for 100 million of
PSV assets. Consequently, the price of PSV assets is about 21.4 units of consumption goods
in the globalization period (Period 3), a huge increase from 5.90 in the previous period. The
price of PSV assets is nearly four times higher in the globalization period (Period 3) than in
the pre-globalization period (Period 2), leading to asset price inflation of 5.28% per annum.
The number of young people in the market-economy world, who are saving for future
retirement, increases substantially in the period of globalization. Thus, we have a global
“savings glut,” which leads to substantial asset price inflation globally. In the example of
Table 2.3, the asset price inflation rate accelerated substantially, from 0.89% to 5.28%
annually for twenty-five years.
What will happen once the boom is over? Let me extend Table 2.3 to include the
post-globalization period, in Table 2.4. Here the post-globalization period is represented
by 2030, and all population figures are the United Nations population estimates given in
Table 2.1.
If we look at Period 4, the post-globalization period, we see that the market-economy world
population will grow by only 0.28% annually from 2005 to 2030. Under my simplified
assumption, the young population in the market-economy world will produce about 2.29
billion units of consumption goods, while there will be 100 million PSV assets. This
means the price of the assets will be about 22.9 units of consumption goods in the
post-globalization period, meaning that asset price inflation decelerates quite sharply. The
asset price inflation of the post-globalization period is a mere 0.28%. In fact, the rate is
lower even than the 0.89% of the pre-globalization period.
Summing up
So far, I have suggested that the brute force of compositional change in population might be
in the background of asset market bubbles and their subsequent bust, especially those which

11
caused the global macroeconomic crisis of 2008 and after. To close this section, I would
like to draw two observations from this exercise.
First, I am not suggesting this demographic factor is the cause of the crisis, but pointing out
that this favorable demographic background (increasing inverse dependency ratio) might
have been fertile ground for the excessive optimism that led many economic agents to take
a highly leveraged position to multiply their returns. By the same token, the eventual
sharp reversal of the ratio made resolution of accumulated financial excesses particularly
difficult, resulting in the prolonged, severe balance-sheet adjustment that followed the crisis,
and which is still under way.
Second, the aftermath of globalization is likely to imply a substantial slowdown in asset
price inflation, and ultimately in the rate of return on these assets. Moreover, the
post-globalization-period rate of return is noticeably lower even than that in the
pre-globalization period, because of increased population ageing.
3. Post-Crisis World: Multifaceted Challenges and Unconventional Policy
Severe and Prolonged Balance Sheet Adjustment under Population Ageing
Let me now consider the post-crisis world. In order to determine the effect of balance sheet
adjustments after the bursting of a bubble, I first clarify who leveraged during the bubble
periods. In Japan, it was the corporate sector, especially small to medium-sized firms,
which for the first time gained access to large banks after the so-called financial
liberalization. The corporate sector’s loan-to-GDP ratio increased by 29 percentage points
in the ten years before the bubble burst in 1991. In the United States, it was the household
sector that leveraged, especially in housing. The household sector’s housing
loans-to-disposable income ratio jumped by 39 percentage points in the ten years before the

12
bubble burst in 2007.8
These sectors were interest-sensitive and thus constituted the “transmission gears” of the
ordinary monetary transmission mechanism in the periods before the bubbles burst. That is,
these leveraged sectors had been sensitive to policy rate reduction in business cycles.
However, after the bubbles burst, these leveraged sectors became insensitive to policy rate
reduction, because of the acute balance sheet adjustments. Large legacy shortfalls must be
compensated for by current profit or income, period by period, and this process is slow and
painful. This leads at least to a breakdown in the ordinary monetary transmission
mechanism of policy rate change.
What then are the long-term consequences of severe and prolonged balance sheet
adjustment under population ageing? Three adverse consequences can be identified.
Long-term Consequence 1: Declining Mobility/Flexibility
First, mobility declines, or in other words, the economy becomes “inflexible”. Since
de-leveraging firms or households have to pay back all their debts before “moving” from
their current position, they are often stuck with an “underwater” property. Population
ageing strengthens this tendency. In the case of Japan, de-leveraging took place in the
corporate sector, and thus firms became less mobile between industries and regions. In
the United States, the household sector is de-leveraging, and thus household mobility has
been reduced.
Figure 3.1 depicts declining entrepreneurial mobility in Japan. This figure shows the
creation and destruction of enterprises between pre-bubble (1981-1986), bubble
(1987-1991), and post-bubble (1992-1996). It can be seen in this figure that the creation
of new enterprises was sharply reduced after the bubble burst of 1991. In contrast, the 8 See Figures 2.1 and 2.2 in:Nishimura, K. G., “This Time May Truly Be Different: Balance Sheet Adjustment under Population Ageing,” a speech prepared for the Panel “The Future of Monetary Policy” at the 2011 American Economic Association Annual Meeting, Denver, January 7, 2011.

13
increase in the rate of destruction was relatively mild. These two imply a “sticky
industry structure,” a tendency to hang on to the past.
Declining mobility is found in the household sector in the United States. Figure 3.2 shows
changes in the householder mobility rate between 2005 and 2009. A sharp decline is
found across all age groups. Since there is no such change in renters, this sharp decline
suggests that the housing crash reduced householder mobility rates.9
Long-term Consequence 2: Loss of Non-Tangible/Human Capital
The second consequence of severe and prolonged balance sheet adjustment is the loss of
non-tangible or human capital. De-leveraging firms and households suffering long
under-utilization or under-employment tend to lose their non-tangible or human capital.
In Japan, this has been observed especially in small to medium-sized enterprises: loss of
entrepreneurship, loss of human networks in skilled manufacturing, and loss of access to
technological advances. In the United States, the long-term unemployed or
underemployed risk losing their human capital.
Long-term Consequence 3: Problems in Financial Intermediation
The third consequence of severe and prolonged balance sheet adjustment is the
deterioration in financial institutions’ efficient functioning as financial intermediaries.
This was most acutely observed in Japan during the several years after the bubble burst: a
pile-up of non-performing loans seemed to lead to a breakdown in the “market selection
mechanism” around 1997.
Figure 3.3 shows the result of a large-scale panel analysis of Japanese firms, in which the
9 It has been debated recently whether the negative equity of some homeowners significantly influences their mobility in the United States. (See, for example, Schulhofer-Wohl, S., “Negative Equity Does Not Reduce Homeowners’ Mobility,” Working Paper 682. December 2010, Federal Reserve Bank of Minneapolis.) However, the results based on past data are not yet conclusive, since in the past, negative equity was a relatively rare, idiosyncratic phenomenon. New data including the period after 2008 are needed to answer this question.

14
total factor productivity of exiting and surviving firms is compared. Survival of the fittest
is a basic premise of the natural selection mechanism. Thus, if the market mechanism
works well, the productivity of successful and surviving firms should be higher than that of
failing and hence exiting firms, at least on the average.
In this figure, the shaded areas show cases where the productivity of failing and thus exiting
firms is higher than that of surviving firms, which is an anomaly. In fact, the shaded areas
are rather exceptional most of the time. However, if we look at the period 1996-97, the
period of the financial crisis, we see many shaded areas indicating that more productive
firms were exiting in many industries. This strongly suggests a breakdown in the natural
selection mechanism.
Post-Crisis Reality
So, what will the post-crisis reality look like once the consequences of acute balance sheet
adjustment under population ageing have taken effect? Some of the post-crisis reality can
be seen in the Japanese situation in the 2000s.
(1) Decline in Prospects for Growth and Investment Returns
First, growth prospects decline. Average real GDP growth in Japan fell from 5% to 4 % in
the 70s and 80s, to around 1% in the 90s and 2000s. This implies the expected rate of
return on investment in the 2000s is low, especially for those small to medium-sized firms
that depend on domestic demand. In contrast, money (bank deposits) becomes relatively
attractive as a store of value, given the price-stability pledge of the central bank.
Ironically, this leads to an apparent breakdown of the historically-proven quantity-theoretic
relationship between real activity and money stock.10 Moreover, not only is the policy
rate very low, but so too are longer risk-free rates, judged by historical standards.
10 The quantity-theoretic relationship presupposes that non-interest-bearing money is dominated by other positive rate-of-returns assets as a store of value. However, when price is stable and expected risk-adjusted return on investment is very low, the clear rate dominance of the other assets over money may no longer hold.

15
Conventional monetary policy through the overnight policy rate is not as effective as before,
and this means the economy is more vulnerable to a downside shock.
The change is not only macroeconomic but also microeconomic and structural. The
demand structure shifts from homogenous, mass markets for the young, to more segmented
and heterogeneous markets for the old. Thus, continued focus on the young may entail
ever-declining demand and overcapacity, and could miss the opportunity of exploiting the
potential demand of the old. Here the microeconomic and structural failure of firms and
banks to accommodate new demand may have macroeconomic consequence as well.
In many discussions over the past two decades, this dramatic decline in growth and
investment prospects has often be attributed to the supposedly unique nature of the
Japanese economy, whatever that may be. However, if the demographic factors outlined
in the previous section do indeed shape the future, then declining prospects for growth and
investment returns may have more global relevance.
(2) Coordination Failure in the Financial System
Second, there are signs of coordination failure. Banks’ lending is sluggish, partly because
of their inadequate functioning as expert relationship bankers. Here a vicious circle seems
to be working. To begin with, banks lack the expertise to assess investment in new fields,
suffering as they are from problems with non-performing loans and under-investment in
their loan officers’ human capital. Consequently banks do not lend. This means that new
investments and new enterprises cannot get funding, and thus new markets falter. Then,
banks miss the opportunities to accumulate new expertise, bringing them right back to the
starting point of this vicious circle.
Another coordination failure is found in capital markets, in the form of excessive risk
aversion. Fearing unknown unknowns, investors shun investing in riskier securities.
Their market then becomes thin and vulnerable to non-fundamental shocks. This means

16
they themselves become prone to turning into unknown unknowns, thus the original fear is
self-fulfilling. These two types of coordination failure in financial markets result in an
apparent lack of “animal spirits”.
(3) Piling-up of Public Debt
Third, we see a piling-up of government debt. This is partly the result of the substitution
of public debt for private debt in the process of balance sheet adjustment, and partly due to
the substitution of public demand for private demand during this period of declining growth.
According to the OECD’s Economic Outlook, Japan’s General Government Gross
Financial Liability-to-GDP Ratio in 2010 was 198%, compared with 93% in the United
States. However, it should also be noted that, because of low long-term rates, the
Government Net Debt Interest Payments-to-GDP is 1.2% in Japan, compared with 1.7% in
the United States.
Three Challenges and Unconventional Policy
Let me now examine the challenges that central banks face in the post-crisis world.
The first challenge is that of “cycle stabilization”: ensuring a return to sustainable growth
with price stability, when the policy rate is near zero and longer-term risk-free rates are also
very low compared with their historical average.
The second challenge is to enhance the growth trend, or strengthen the foundations for
growth. In other words, the challenge is to raise long-term growth prospects, especially in
domestically-oriented growth. This should be done by solving the coordination failure in
banking and capital markets described above.
The third challenge is to avoid causing problems in national debt management. We should
design and execute carefully measures to cope with the first and the second challenge,
taking appropriate account of the current national debt situation as explained before, as well

17
as general economic conditions.
To tackle the first and second challenges, many central banks have introduced
unconventional policies, which differ from region to region depending on the particular
problems they face. Here as an example, I will explain the Bank of Japan’s recent
attempts at unconventional policies, namely, the Comprehensive Monetary Easing (CME)
in October 2010, and the Growth Foundation Strengthening Facility (GFSF) in June of the
same year.
To meet the challenge of cycle stabilization, the first part of the CME changed the guidance
for the policy rate from 0.1% to the range between 0 and 0.1%, making clear the Bank’s
Virtually Zero-Interest Rate Policy (VZIRP). For the second part of the CME, the Bank
clarified its policy duration commitment: the Bank will continue its VZIRP until it judges
price stability to be in sight on the basis of the Policy Board members’ understanding of
price stability. With Policy Board members’ announced forecasts for two years ahead, this
is similar to “forecast targeting” though not specific in numbers.
The third part of the CME is the Asset Purchase Program, which is also designed to meet
the cycle stabilization challenge. The first half of the Asset Purchase Program aims to
influence downward longer-term risk-free rates. That is, the outright purchase of JGBs
with remaining maturity of 1-2 years and T-bills is to reduce the term-premiums of risk-free
rates. The scheme to provide 3- and 6-month funds at the overnight rate already instituted
was aimed at lowering rates longer than the overnight rate, and has been continued and
included in this program. These are unconventional, but can be considered as a natural
extension of conventional monetary policy through policy rate changes.
However, the second half of the Asset Purchase Program is truly unconventional, in that the
Bank purchases riskier assets than it bought before: BBB-rated corporate bonds, and a-2
CPs. It also purchases ETFs and J-REITs directly from the market. The purchase is

18
designed to act as a catalyst to induce investment in riskier assets, and thus help solve the
coordination failure I described earlier. In other words, it is aimed at breaking another
vicious circle in capital markets, that caused by excessive risk aversion.
When there is grave anxiety about the future of the economy, as when there is so-called
Knightian uncertainty, there is a tendency that aversion to risky assets such as stocks and
real estate becomes “excessive” and demand for those assets declines, resulting in the risk
premiums of those assets remaining high.11 This excessive “flight to quality” may greatly
impede economic activity. 12 Meanwhile, there is the possibility that as Knightian
uncertainty increases, demand concentrates on assets whose risks are considered to be
simple and small, thereby lowering the risk premiums of those assets. This is known as
the “flight to simplicity,” which is different from the flight to quality. Whatever name it
has, excessive flight to simplicity also distorts the market. In these cases, there is a
possibility that the central bank's purchase of risky assets will lead to it playing the role of
“catalyst” to alleviate the tendency to excessive flight to quality and to simplicity.
To tackle the second, “trend-enhancement” challenge, or to strengthen growth potential, the
Bank of Japan instituted its Growth Foundation Strengthening Facility (GFSF) in the form
of preferential fund-provisioning to support financial institutions’ own initiatives in lending
and investing in new growth areas.
It should be made clear here that it is not the Bank of Japan but participating financial
institutions that determine which investment projects should be funded using this GFSF.
Thus, the GFSF is designed to be a catalyst to induce banks to find new firms or new
11 Here, in order to facilitate understanding, I intentionally and informally use the term “excessive” risk aversion as representing “(Knightian) uncertainty aversion” or “ambiguity aversion” over and above conventional risk aversion. For a survey of this literature of Knightian uncertainty/ambiguity, see Gilboa, I., and M. Marinacci, “Ambiguity and the Bayesian Paradigm”, mimeo., April 12, 2011. 12 For reference, please see (1) Nishimura, K.G., and H. Ozaki, “Search and Knightian Uncertainty”, Journal of Economic Theory, 119 (2004), 299-333.and (2) Nishimura, K.G., and H. Ozaki, “Irreversible Investment and Knightian Uncertainty,” Journal of Economic Theory, 136 (2007), 668-694.

19
investment projects in their perceived growth areas. In this way, the GFSF is targeted at
solving the coordination failure in the financial system mentioned earlier, by breaking the
vicious circle of no lending resulting in no new markets and thus no demand for lending to
start with.
Recently the Bank of Japan expanded the GFSF to include the new function of promoting
more effective lending methods. Banks in Japan play a central role in financial
intermediation, and small companies in particular rely on banks for most of their funding.
In the high growth era, Japanese banks responded to strong demand for funds, using their
“expert eye” to monitor closely the business performance of companies and examine their
ability to meet repayment obligations. However, through the hard process of disposing of
non-performing loans in the 1990s, banks began to rely more heavily on credit protection
measures in the form of real estate collateral and personal guarantees.
Unfortunately, this increased reliance on real estate collateral and personal guarantees
weakened banks’ ability to monitor client firms. The value of real estate and personal
assets pledged to banks as collateral bears no direct relation to changes in the client firm’s
business cash flow. Thus, there is a risk that financial institutions may overlook changes
in the cash flow of a borrower’s core business and suddenly be faced with its business
failure. Moreover, too great an emphasis on protection by real estate or personal asset
collateral makes loan officers focus on loans to companies with a long business history and
abundant assets, rather than providing funds for new companies and new business areas.
Taking these problems into consideration, the Bank of Japan decided to use this GFSF
facility to promote lending methods that do not rely on real estate collateral and personal
guarantees.
When implementing these measures to cope with cycle stability and trend-enhancing
challenges, it is very important to take appropriate account of the third challenge, that of
avoiding causing problems in national debt management. Specifically, it is crucial to

20
avoid creating an impression of the “monetization” of government debt. Otherwise, the
large scale purchase of JGBs may lead to a substantial and lasting ratcheting up of
long-term rates, which would pose a serious problem for economic recovery and the
financial position of the government. Taking this point into consideration, the Bank of
Japan has already purchased about 22 trillion yen in JGBs annually, beside the Asset
Purchase Program. By the same token, we should be very careful about the possibility
that asset purchases may lead to capital losses, which could tarnish the credibility of the
central bank.
4. Concluding Remarks: Keynes, Population Ageing and Innovation
Let me return to where I started this presentation. As I mentioned in the Introduction, it
was Keynes who, in his Eugenics Review speech, placed population once again at center
stage of macroeconomic policy in the framework of his General Theory. While in the
Malthusian tradition, growing populations and inadequate food production to feed them are
the major issue, Keynes was concerned with declining populations and inadequate capital
investment for full employment. Life expectancy was not particularly long in the time of
both Keynes and Malthus, and so population ageing was not an issue at all. Moreover,
rapid technological innovation has at least partially solved the problems they had faced for
some time.
The problem we now face stems from population change, but with a different twist. Here
composition of population has changed, inducing a large swing in asset prices as a store of
value. With this in the background, we have witnessed asset prices bubble and then
collapse spectacularly in some countries, leaving us with severe balance-sheet problems
and diminished expectations on investment returns.
One may then ask the question: Can our problems also be solved by technological

21
innovation, as they were for Keynes and Malthus? If so, we need not be particularly
worried about the present stagnation.
I do not have an answer, but I would like to make three remarks about the possibilities
presented by technological innovation.
First, the ageing society might impose unique challenges on technological innovation.
When the population is growing rapidly, as it was in the past, the demands of the young
always dominate those of the old. Thus, successful technological progress has a tendency
to be youth-oriented and quantity-oriented. In contrast, when the population is ageing
rapidly, the demands of the old dominate the market. The characteristics of technology
demanded by the old may differ substantially from those demanded by the young, and
current youth-oriented technological progress may prove to be not as value creating as
before.
Second, if the ageing world implies a substantial fall in asset returns, it would induce
curtailment of new investment, leading to a worsening of economic conditions. To prevent
investment shrinking further, we might need a new source of investment, which is not
based on high private returns. It should be noted that there are many socially desirable
projects that carry a low private rate of return, such as urban renewal projects, which might
have been crowded out in the age of high private returns. To counter possible shortfalls in
private investment, we might be obliged to adopt some form of public-private partnership
to mobilize these innovation-based projects.13
Third, in an ageing world, the financial needs of an older population are often very different
from the risk and return profiles of existing assets. We would then need financial
innovation, as one form of technological innovation. Specifically, securitization might be 13 Some years ago, I proposed a scheme elsewhere for this purpose called Socially-Oriented Investment Trusts. See: Nishimura, K. G., and M. Saito, “On Alternatives to Aggregate Demand Policy to Revitalize the Japanese Economy”, Asian Economic Papers 2:2 (2003), 87-126.

22
helpful in tailoring financial products to the particular needs of an older population.
However, recent experience in securitized products markets has shown the need for care in
the design of such securitization, to ensure the necessary regulations and adequate oversight
for prospective practitioners of these schemes.
Now it is time for me to stop here. Thank you for your kind attention.

Bank of Japan
Population Ageing, Macroeconomic Crisis and Policy Challengesand Policy Challenges
~ Prepared for the Panel “The General Theory and the Policy Reponses to Macroeconomic Crisis” at the 75th Anniversary Conference of Keynes’
General Theory, University of Cambridge, June 19-21 ~
Kiyohiko G. NishimuraD t G f th B k f JDeputy Governor of the Bank of Japan
(Figure 1.1) Population Change and Bubble: Japan and USPopulation Change and Bubble: Japan and US
Inverse Dependency Ratio: Ratio of Working-Age Population to the Rest
= H l f ki h t id f d d t ?
3
= How many people of working age have to provide for one dependent person?
Peak of Japanese Peak of US sub
2.5Japan
property bubbleca 1990
Peak of US sub-prime bubble
ca 2007+
2
p
US
ca 2007
1.5
US
1Source: United Nations World Population Prospects:
1950
1960
1970
1980
1990
2000
2010
2020
2030
2040
2050
Year2
World Population Prospects: The 2010 Revision Population Database

(Figure 1.2) Population Change and Bubble: Spain and IrelandPopulation Change and Bubble: Spain and Ireland
Inverse Dependency Ratio: Ratio of Working-Age Population to the Rest
= H l f ki h t id f d d t ?
3
P k f S i h
= How many people of working age have to provide for one dependent person?
2.5
Peak of Spanish property bubble
ca 2008
2
Spain
Ireland
1 5
Ireland
Peak of Irish
1
1.5
Source: United Nations World Population Prospects:
The 2010 Revision
Peak of Irish property bubble
ca 2006+1
1950
1960
1970
1980
1990
2000
2010
2020
2030
2040
2050
Year
3
The 2010 Revision Population Database
(Table 2.1) (Table 2.1) Population Growth: Selected Countries Estimated Population as of July 1 (in thousands)
Year Developed Emerging Non-Market => MarketMarket Economy
Population Growth: Selected Countries
Japan USA Germany France Italy UK Russia China
1955 472,617 88,390 171,151 70,325 43,434 48,131 51,186 719,760 111,401 608,359
1980 590 434 115 916 229 826 78 289 53 879 56 220 56 304 1 121 824 138 653 983 1711980 590,434 115,916 229,826 78,289 53,879 56,220 56,304 1,121,824 138,653 983,171
2005 685,627 126,394 296,820 82,540 60,999 58,672 60,202 1,451,435 143,842 1,307,593
2030 759,998 120,217 361,679 79,469 68,468 60,852 69,313 1,529,506 136,431 1,393,075
Estimated Population Growth
Period Developed EmergingMarket Economy Non-Market => MarketPeriod Developed Emerging
Japan USA Germany France Italy UK Russia China
1955-1980 0.89% 1.09% 1.19% 0.43% 0.87% 0.62% 0.38% 1.79% 0.88% 1.94%
y
1980-2005 0.60% 0.35% 1.03% 0.21% 0.50% 0.17% 0.27% 1.04% 0.15% 1.15%
2005-2030 0.41% -0.20% 0.79% -0.15% 0.46% 0.15% 0.57% 0.21% -0.21% 0.25%
4
• Source: Population Division of the Department of Economic and Social Affairs of the United Nations Secretariat, World Population Prospects: The 2010 Revision, http://esa.un.org/unpd/wpp/index.htm, May 30, 2011
(Table 2.2) (Table 2.2) Life Expectancy: Selected CountriesEstimated Life Expectancy at birth (years)
Life Expectancy: Selected Countries
Year
Japan USA Germany France Italy UK Russia China
Market Economy Non-Market => Market
p y y
1950-195562 69 68 67 66 69 65 45
1975-198075 73 73 74 73 73 68 66
2000-200582 77 79 80 80 78 65 72
2025 203085 81 83 84 84 82 72 76
2025-2030
5
• Source: Population Division of the Department of Economic and Social Affairs of the United Nations Secretariat, World Population Prospects: The 2010 Revision, http://esa.un.org/unpd/wpp/index.htm, Jun 8, 2011
(Figure 2.1) (Figure 2.1) Ageing Population and Property Prices: JapanAgeing Population and Property Prices: Japan
Relative abundance of young i id d i h hi h i
Ageing Population and Property Prices: Japan Ageing Population and Property Prices: Japan
1002.5(Inverse Dependency Ratio) (Real Land Price, Peak<Mar.1991>=100)
coincided with higher property prices
75
Relative abundance of old leads to lower property price
50
2.0
25
1.5Declining property prices
aggravated B/S adjustment
01.0
Inverse Dependency Ratio (Japan)Real Land Price (PEAK=100)
1955
1960
1965
1970
1975
1980
1985
1990
1995
2000
2005
2010
2015
2020
2025
2030
Year 6

(Figure 2.2) (Figure 2.2) A i P l ti d P t P i USA i P l ti d P t P i USAgeing Population and Property Prices: US Ageing Population and Property Prices: US
1002.5(Inverse Dependency Ratio) (Real Property Price, Peak<Dec.2005>=100)
In US also, increasing IDR coincided
75
2.0
with the property bubble
50
25
1.5
Inverse Dependency Ratio (US)Declining IDR may also coincide with decline in
01.0
Real House Price (US 10 cities, Case-Shiller Composite)
property prices
1955
1960
1965
1970
1975
1980
1985
1990
1995
2000
2005
2010
2015
2020
2025
2030
Year 7
(Figure 2.3) (Figure 2.3) Ageing Population and Property Prices: IrelandAgeing Population and Property Prices: Ireland
1002.5
(Inverse Dependency Ratio) (Real Property Price, Peak<Dec.2006>=100)
A Sharp Ascent and then Free Fall
75
2.0
Means Painful B/S Adjustment
50
25
1.5
Inverse Dependency Ratio (Ireland)
01.0
5 0 5 0 5 0 5 0 5 0 5 0 5 0 5 0
p y ( )
REAL PP (Ireland)
1955
1960
1965
1970
1975
1980
1985
1990
1995
2000
2005
2010
2015
2020
2025
2030
Year

(Figure 2.4) Ageing Population and Property Prices: Spain
1002.5
(Inverse Dependency Ratio) (Real Property Price, Peak<Sep.2007>=100)
75
Inverse Dependency Ratio (Spain)REAL PP (Spain)
50
2.0
251.5
Price decline has not halted yet,i l d B/S dj
01.0
suggesting prolonged B/S adjustmentfor households and SMEs ?
1955
1960
1965
1970
1975
1980
1985
1990
1995
2000
2005
2010
2015
2020
2025
2030
Year
(Figure 2.5) Ageing Population and Property Prices: Germany
1002.5(Inverse Dependency Ratio) (Real Property Price, Data start at Dec.1995 (=100))
75
2 0
50
2.0
25
1.5Property price decline has already
coincided with population ageing in Germany for some time
01.0
Inverse Dependency Ratio (Germany )REAL PP (Germany)
y
1955
1960
1965
1970
1975
1980
1985
1990
1995
2000
2005
2010
2015
2020
2025
2030
Year

(Table 2.3) Impact of GlobalizationImpact of GlobalizationNumerical Example Based on UN Population Estimates
Y P l ti A P i
Period Developed EmergingMarketW ld
Young Population Asset PriceInflation
Rate
1:
p g gWorld Rate
unit = thousands per annum
1:Cold War
(1955)472,617 472,617
2 P2: Pre-
Globalization
(1980)590,434 590,434 0.89%
(1980)3:
Globalization 685,627 1,451,435 2,137,062 5.28%
11
(2005)
<Note: Fixed Exchange Rate Between Regions in Period 3>
(Table 2.4)Aftermath of GlobalizationAftermath of Globalization
Young Population Asset PriceInflation
RatePeriod Developed EmergingMarketWorld
1: Cold War472 617 472 617
unit = thousands per annum
(1955)472,617 472,617
2: Pre-Globalization590 434 590 434 0 89%
(1980)590,434 590,434
3: Globalization685 627 1 451 435 2 137 062
0.89%
5 28%(2005)
685,627 1,451,435 2,137,062
4: Post-Globalization
5.28%
0 28%12
4: Post Globalization(2030) 759,998 1,529,506 2,289,504 0.28%

(Figure 3.1) Declining Mobility: JapanDeclining Mobility: Japan
<Enterprise Creation and Destruction>
After the bubble burst, creation of enterprises is h l d dsharply reduced.
In contrast, relatively mild increase in d t tidestruction.
“Why Does the Problem Persist?: “Rational Rigidity” and the Plight of Japanese Banks ” The World Economy 26 (2003) 301-324
--“Sticky industry structure,” hanging on to the past 13
Banks, The World Economy, 26 (2003), 301 324
(Figure 3.2) Declining Mobility: USDeclining Mobility: US
<Changes in Householder Mobility Rate, 2005–9 (Percent)>
Sharp difference between owners
d tand renters
Figure 13, The State of the Nation’s Housing 2010, Joint Center of Housing Studies of H d U i it
--The housing crash reduced mobility rates. 14
Harvard University

(Figure 3.3)Breakdown
TFP of survivingand exiting firms
Breakdown of Natural SelectionSelection Mechanism 1997: many industries saw more
productive firms exiting.in Japanese Financial
p gBreakdown of natural selection
Crisis of 1997
Shaded: exiting firms are more productiveare more productive than surviving firms
Nishimura, Nakajima, Kiyota (2005) “Does
15
Nishimura, Nakajima, Kiyota (2005) Does Natural Selection Mechanism Still Work in Severe Recessions? –Examination of the Japanese Economy in the 1990s- “ Journal of Economic Behavior and Organization, 58:1 (2005), 53-78
End of PresentationEnd of Presentation
View of the BOJ courtyard around sunset
16

Appendix: Financial Crisis and Inverse Dependency Ratio: An Update
In a speech in January 2011,1 I presented some telling figures on the correlation of financial crisis, or so-called bubbles, and the inverse dependency ratio in Japan, United States, Greece, Portugal, Spain, Ireland and China. The figures were based on the 2008 revision of the United Nations World Population Prospects. Since then, the United Nations has published its 2010 revision. This appendix updates these figures and expands on them by including more European and Asian countries. The Japanese inverse dependency ratio peaked around 1990, and it was in the very next year, 1991, that the Japanese Bubble peaked. The peak of the US ratio was between 2005 and 2010, and the peak of the US Subprime Bubble was 2007 (Figure A.1 [same as Figure 1.1]). The economically troubled countries of the eurozone present a similar pattern to Japan and the United States. The ratios for Greece, Portugal and Spain have almost the same time profile, and all of them peaked around 2000-2005. The peak of the Spanish property boom was just after the ratio’s peak, and the financial problems of Greece also started at the same time. A particularly interesting case is Ireland, which showed a sharp rise in the ratio until around 2005. The bursting of the country’s property market bubble was just a few years around the corner (Figure. A.2). How about other European countries? The so-called Core Europe, Germany, France and Italy, passed the peak 10+ years ago, and seemingly, did not have any particularly alarming property bubbles around 2010 (Figure A.3). However, new and potential members of the eurozone show similar patterns to Greece, Spain, Portugal, and Ireland (Figure A.4). Their ratios peaked around 2005-2010, and some have their own problems. In contrast to advanced countries, emerging Asia has shown remarkable resilience against the financial crisis of 2008. In fact, their inverse dependency ratio is still rising, as exemplified by China’s ratio (Figure A.5). The inverse dependency ratios of many other Asian countries have a quite similar time profile to that of China (Figure A.6). However, their ascent will be checked in a relatively short period, and the peak will be around 2010-15 in many of these countries. After that, the ratio will fall as rapidly as it is now rising.
1 See footnote 2.

(Figure A.1[same as Figure 1.1]) Population Change and Bubble: Japan and USp g p
Inverse Dependency Ratio: Ratio of Working-Age Population to the Rest
= How many people of working age have to provide for one dependent person?
3 Peak of Japanese Peak of US sub
= How many people of working age have to provide for one dependent person?
2.5Japan
property bubbleca 1990
Peak of US sub-prime bubble
ca 2007+
2
p
US
ca 2007
1.5
US
1
Source: United Nations World Population Prospects: The 2010 Revision Population Database
1950
1960
1970
1980
1990
2000
2010
2020
2030
2040
2050
Year
11
(Figure A.2) Population Change and Bubble: Periphery Europe
Inverse Dependency Ratio: Ratio of Working-Age Population to the Rest
= How many people of working age have to provide for one dependent person?
3
Spain
G
Periphery Europe(Spain, Portugal, Greece, and Ireland)
2.5
Greece
Portugal
Ireland
Peak of Spanish property bubble
2
Ireland
1.5
Source: United Nations World Population Prospects:
The 2010 Revision
Peak of Irish property bubble
1
1950
1960
1970
1980
1990
2000
2010
2020
2030
2040
2050
Year2
The 2010 Revision Population Database

(Figure A.3) Core Europe compared with Periphery Europe Inverse Dependency Ratio: Ratio of Working-Age Population to the Rest
= How many people of working age have to provide for one dependent person?
3 Core Europe (Germany, France, Italy) compared with Spain
2.5Core Europe already passed
the peak 10+ years ago
2
Germany
France
1 5
Italy
Spain1.5
Source: United Nations World Population Prospects:
1
1950
1960
1970
1980
1990
2000
2010
2020
2030
2040
2050
Year
Prospects:
The 2010 Revision Population Database
3
(Figure A.4) New and Potential Members of EU
Inverse Dependency Ratio: Ratio of Working-Age Population to the Rest
= How many people of working age have to provide for one dependent person?
3Hungary
Almost all peak around 2010!
2.5
Poland
Chech Republic
Bulgaria
around 2010!
2
Bulgaria
Slovania
Slovakia
1 5
Lithuania
Estonia
1.5 Latvia
Romania
1
1950
1960
1970
1980
1990
2000
2010
2020
2030
2040
2050
Year
Source: United Nations World Population Prospects: The 2010 Revision Population Database 4

(Figure A.5) China compared with Japan and US
Inverse Dependency Ratio: Ratio of Working-Age Population to the Rest
= How many people of working age have to provide for one dependent person?
3
Japan
Chinese peak?
2.5
Japanca 1990
US
2
ca 2007+
China
1.5
ca 2010-2015
1
Source: United Nations World Population Prospects:
The 2010 Revision
1950
1960
1970
1980
1990
2000
2010
2020
2030
2040
2050
Year
The 2010 Revision Population Database
5
(Figure A.6) Asia: Some Will See a Sharper Turn
Inverse Dependency Ratio: Ratio of Working-Age Population to the Rest
= How many people of working age have to provide for one dependent person?
3 2010-2015:Sh i i
y p p g g p p p
2.5
Sharp turning pointfor Korea, Hong Kong,
Singapore, Thailand
2China
1 5
Korea
Hong Kong
Singapore1.5 Singapore
Thailand
Indonesia
1
1950
1960
1970
1980
1990
2000
2010
2020
2030
2040
2050
Year
Malaysia
6