population biology of dab limanda limanda in the southeastern
TRANSCRIPT

MARINE ECOLOGY PROGRESS SERIES Mar. Ecol. Prog. Ser. Published December 31
Population biology of dab Limanda limanda in the southeastern North Sea
A. D. ~ijnsdorp', A. D. V e t h a a k 2 , P. I. van ~eeuwen'
' Netherlands Institute for Fisheries Research, PO Box 68, 1970 AB Ijmuiden, The Netherlands Rijkswaterstaat, Tidal Waters Division. Ecotoxicology Section. PO Box 20907.2500 EX The Hague. The Netherlands
ABSTRACT: This paper presents data on the length distribution and age composition of male and female dab Limanda limanda L, as observed in the German Bight in March 1990 during the Bremerhaven Workshop. Further data on distribution and seasonal movements from tagging experi- ments are reviewed with regard to the interpretation of the results of the studies carried out during the workshop. It is shown that highest densities of dab coincided with the main centre of egg production in the inner German Bight. Within the spawning period the spatial distribution changed significantly in a period of 2 wk between mid and late March: the abundance of dab increased in the inner German Bight and decreased at the offshore stations. The dab population was dominated by 4 and 5 yr old fish. Growth of dab was higher at the inner stations and on the Dogger Bank compared with the intermedi- ate stations. The results of the tagging experiments suggest that the dab population at one sampling site is a temporary aggregation of fish originating from a large area. The significant change in the spa- tial distribution between mid-March and late March implies that even within a period of 3 wk substan- tial movements of dab occur. The results of the biological effects studies during the workshop, there- fore, can only be interpreted In very general terms, especially when dealing with responses that are slowly induced, such as gross pathology (liver tumors) and the tissue residue data.
INTRODUCTION
In the North Sea, dab Limanda limanda L. is the most abundant flatfish species with an estimated biomass of about 2 million tonnes (Sparholt 1987, Daan et al. 1990). It is distributed over the whole of the North Sea in waters down to a depth of about 100 m, although it can occasionally be found down to depths of 150 m. Main concentrations of dab occur in the southeastern North Sea (Daan et al. 1990).
Because of their high abundance, wide distribution and high disease frequency, the dab has become an important species in pollution monitoring programmes in the North Sea, e.g. analysis of tissue residues (Dethlefsen et al. 1987), occurrence of embryonic de- formities (Cameron et al. 1992) and epidemiological surveys (Vethaak & ap Rheinallt 1992). The frequency of disease (gross pathology) and EROD induction in dab have been adopted by the North Sea Task Force in its Master Monitoring Plan.
The present paper will focus on those aspects of the general biology of dab that are relevant to the interpre- tation of the data from the various studies carried out during the workshop. First, a general introduction into the distribution and population structure of dab within the North Sea will be given, based on the literature and new information. Second, the migration of dab will be considered from available tagging data and from in- ferences made from distribution patterns of various life history stages. Third, an analysis will be made of the distribution, age composition and growth of the dab population in the German Bight between the Elbe and the Dogger Bank, as observed during the workshop research.
MATERIAL AND METHODS
Bremerhaven Workshop. During the workshop 3 cruises were carried out. The sampling stations are
Q Inter-Research 1992
BREMERHAVEN WORKSHOP: BACKGROUND PAPERS
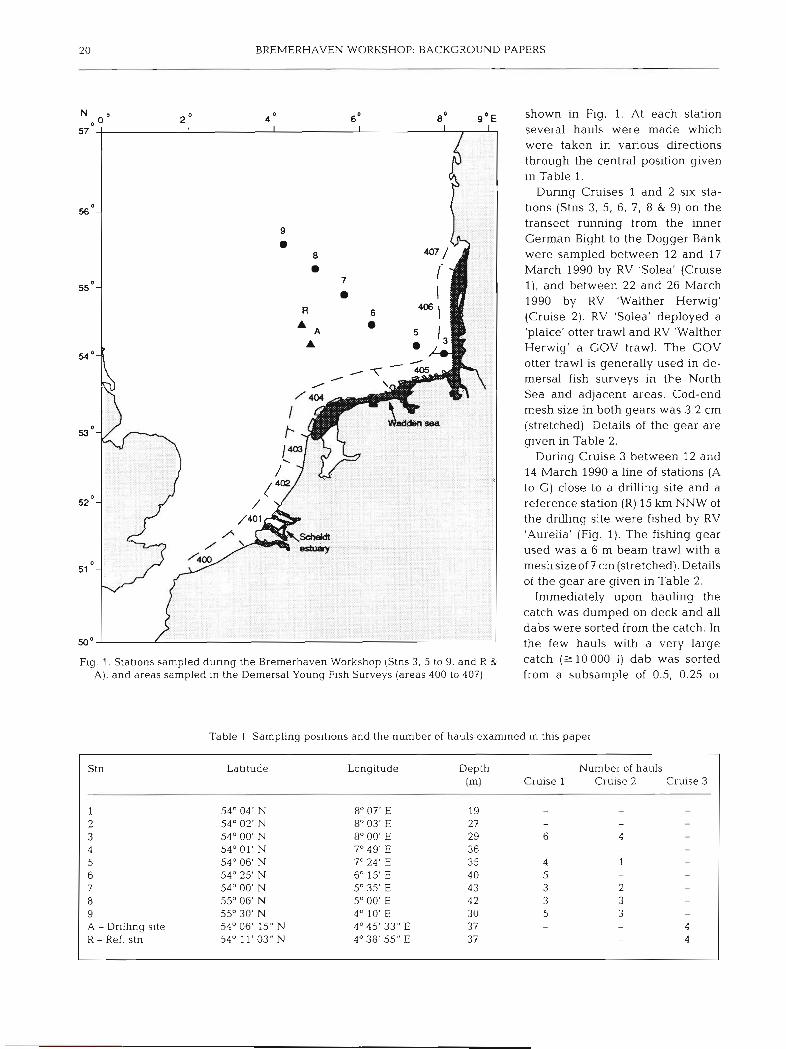
shown in Fig. 1. At each station several hauls were made which were taken in various directions through the central position given in Table 1.
During Cruises 1 and 2 six sta- tions (Stns 3, 5, 6, 7, 8 & 9) on the transect running from the inner German Bight to the Dogger Bank were sampled between 12 and 17 March 1990 by RV 'Solea' (Cruise l), and between 22 and 26 March 1990 by RV 'Walther Herwig' (Cruise 2). RV 'Solea' deployed a 'plaice' otter trawl and RV 'Walther Herwig' a GOV trawl. The GOV otter trawl is generally used in de- mersal fish surveys in the North Sea and adjacent areas. Cod-end mesh size in both gears was 3.2 cm (stretched). Details of the gear are glven in Table 2.
During Cruise 3 between 12 and 14 March 1990 a line of stations (A to G ) close to a drilling site and a reference station (R) 15 km NNW of the drilling site were fished by RV 'Aurelia' (Fig. 1). The fishing gear used was a 6 m beam trawl with a meshsize of? cm (stretched). Details of the gear are given in Table 2.
Immediately upon hauling the catch was dumped on deck and all dabs were sorted from the catch. In the few hauls with a very large
Fig. 1. Stations sampled dunng the Bremerhaven Workshop (Stns 3 . 5 to 9. and R & catch 000 1) dab was sorted A), and areas sampled In the Demersal Young Fish Surveys (areas 400 to 407) from a subsample of 0.5, 0.25 or
Table 1 Sampling poslt~ons and the number of hauls examined in this paper
Stn Latitude Longitude Depth Number of hauls (m) Cruise 1 Cruise 2 Cruise 3
1 2 3 4 5 6 7 8 9 A - Dr~lling site R - Ref. stn

Rijnsdorp et al.: Population biology of dab 2 1
0.125 of the total catch. Care was taken that the subsample was rep- resentative for the total catch. After sorting the dab the sample weight was measured (kg) and the length distribution (cm below) was recorded of male and female sep- arately. Otholiths were removed from 10 fish per cm group of both sexes for age determination.
Additional trawl surveys. In ad- dition to the data collected during the Bremerhaven Workshop, the distribution of dab was analysed using data from 3 trawl survey pro- grammes: (1) the International Young Fish Survey (IYFS), (2) Demersal Young Fish Survey (DYFS) and (3) the Beam Trawl Survey (BTS).
The IYFS is carried out each year in February-March under the aus- pices of ICES. A total of about 500 hauls are made which are distrib- uted over 30 X 30 mile rectangles covering the whole of the North Sea. Each rectangle is trawled at least twice. The fishing gear used is a GOV otter trawl similar to the one used on Cruise 2 of the work- shop. The data analysed in t h ~ s paper cover the period 1985 to 1989.
The DYFS is carried out annually in September-October and covers the nursery areas of flatfish be- tween 51" 00' and 55" 30' N along
Fig. 2. Lirnanda Umanda. Distribution of dab eggs in March and April 1989 (based on data from van der Land 1991). Open squares indicate sampling Stns
3 to 9 of the present study. Values are no. of eggs per m2
Table 2. Details of the fishing gear used during the 3 cruises of the Bremerhaven Workshop
Cruise 1 Cruise 2 Cruise 3
Date Vessel Fishing gear Ground rope Tickler chains Mesh size (cm) Towing speed (knots) Haul duration (min)
a See ICES (1 986)
12-17 March 1990 RV 'Solea'
Otter trawl" Standardd
0 3.2 5-6 60
22-26 March 1990 12-14 March 1990 RV 'Walther Herwig' RV 'Aurelia'
Otter trawld 7 m beam trawl Standarda Light
0 3 3.2 7.0 5-6 3.5 60 15

BREMERHAVEN WORKSHOP: BACKGROUND PAPERS
Depth
Fig. 3. Limanda hmanda. Mean density (no. oi ind. per 1000 m2) of 0-, 1 - and 2-group dab in relation with water depth (m) as observed in the Demersal Young Fish Surveys
carried out in September-October between 1986 and 1988
the continental coast. Sampling areas are indicated in Fig. 2 and include shallow coastal grounds as well as estuaries. The gear used is a 3 m shrimp trawl in the es- tuaries and a 6 m shrimp trawl in the coastal shallows with a cod-end mesh of 2 cm (stretched). Further
0 - o r o u ~ . c10 metre
4 0 0 SCheldl a01 602 403 W L l l l l 404 LOS 406 407 Sea
0-group, 10-20 metre
jS0 0
details are given in van Beek et al. (1989). The data analysed in this paper cover the period 1986 to 1988.
The BTS was conducted in the southeastern North Sea by the Netherlands between 20 August and 21 September 1990 as part of an international pro- gramme. This survey deployed an 8 m beam trawl with a 40 mm cod-end and 8 tickler chains. Fishing speed was 4 knots and haul duration was 30 min. Details of the survey method and gear are given in ICES (1990).
Age determination. The age was determined from burned otholith-sections by counting the dark bands. January 1 was assumed to be the birth date of dab.
GENERAL BIOLOGY
Maturation and spawning
Male and female dab become sexually mature at 2 yr of age and 11 cm and 2 to 3 yr and 14 cm, respectively (Bohl1957). The spawning period runs from January to September with a broad peak from February to April (Harding & Nicholls 1987, van der Land 1991). In March and April 1989 spawning occurred all over the southeastern North Sea with major concentrations of eggs in the German Bight and north of the Friesian Is- lands and along the southern edge of the Dogger Bank
l-group, c10 metre 60 ;
I I 5 0 - I
?
l -group, 10-20 . . . -- ... metre
Fig. 4 . Limanda limanda. Mean densities of 0- and l-group dab in September-October (1986 to 1988) in waters < 10 m and 10 to 20 m from the Dernersal Young Fish Surveys carned out in 1986. 1987 and 1988. Area codes are indicated in Fig. 1
Rqnsdorp et a1 Population biology of dab 23
E7 E8 E9 F0 FI F? F! F4 F' F I - I':
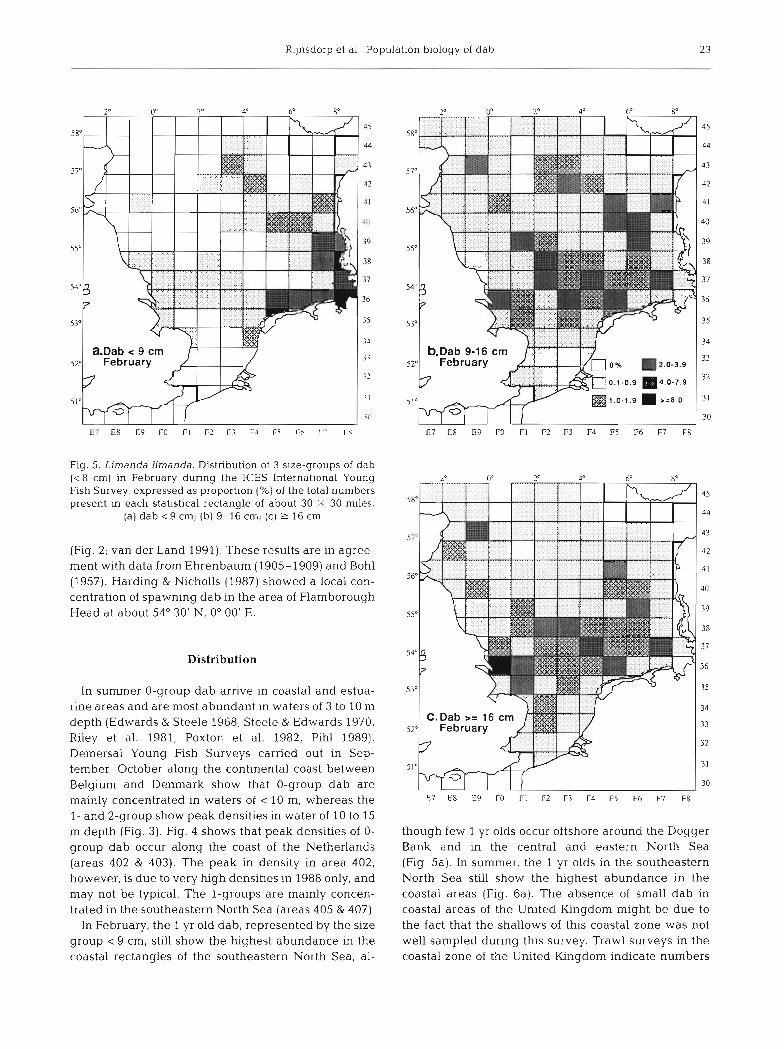
Fig. 5. Limanda Limanda. Distribution of 3 size-groups of dab (c8 cm) in February during the ICES International Young Fish Survey, expressed as proportion (%) of the total numbers present in each statistical rectangle of about 30 X 30 m~les .
(a) dab c 9 cm; (b) 9-16 cm; (c) 2 16 cm
(Fig. 2; van der Land 1991). These results are in agree- ment with data from Ehrenbaum (1905-1909) and Bohl (1957). Harding & Nicholls (1987) showed a local con- centration of spawning dab in the area of Flamborough Head at about 54' 30' N, 0" 00' E.
Distribution
In summer 0-group dab arrive In coastal and estua- rine areas and are most abundant in waters of 3 to 10 m depth (Edwards & Steele 1968, Steele & Edwards 1970, Riley et al. 1981, Poxton et al. 1982, Pihl 1989). Demersal Young Fish Surveys carried out in Sep- tember-October along the continental coast between Belgium and Denmark show that 0-group dab are mainly concentrated in waters of < 10 m, whereas the 1- and 2-group show peak densities in water of 10 to 15 m depth (Fig. 3). Fig. 4 shows that peak densities of 0- group dab occur along the coast of the Netherlands (areas 402 & 403). The peak in density in area 402, however, is due to very high densit~es In 1988 only, and may not be typical. The l-groups are mainly concen- trated in the southeastern North Sea (areas 405 & 407)
In February, the 1 yr old dab, represented by the size group < 9 cm, still show the highest abundance in the coastal rectangles of the southeastern North Sea, al-
though few 1 yr olds occur offshore around the Dogger Bank and in the central and eastern North Sea (Fig 5a). In summer, the 1 yr olds in the southeastern North Sea still show the highest abundance in the coastal areas (Fig. 6a). The absence of small dab in coastal areas of the United Kingdom might be due to the fact that the shallows of this coastal zone was not well sampled dunng this survey. Trawl surveys in the coastal zone of the United Kingdom indicate numbers

24 BREMERHAVEN WORKSHOP: BACKGROUND PAPERS
Fig. 6. Limanda limanda. Distribution of dab of 1 yr old (a) and 3 yr and older (b) in August-September during the Beam Trawl Survey, expressed as proportion (%) of the total numbers present in each statistical rectangle of about 30 X 30 miles
of 0-group dab in densities of 0.1 m-2 in depths of 2 to 4w 2' 0' 2' 4 . 6' 8' IO.E
12 m (Riley et al. 1981). The spatial distribution of larger dab indicates that
they leave the inshore coastal waters in February and are concentrated in the southeastern North Sea near Helgoland, west of the Horns Riff and around the Dogger Bank area with local concentrations in the cen- tral North Sea (Fig. 5b, c). The spatial distribution of eggs in March 1989 (Fig. 2) corresponds with the distri- bution of adult dab in February (Fig. 5c), although the distribution of adult dab tended to be less concentrated than that of the eggs. In summer the largest concentra- tion of larger dab is found in the southeastern North Sea with appreciable numbers in the eastern central North Sea and the western central North Sea (Fig. 7). Within the southeastern North Sea they show a dense concentration in the German Bight off Sylt (Fig. 6b).
I t is still unknown whether the I - , 2- and 3-group dab that occur in the open sea (size-group 9 to 16 cm; Fig. 5b), sometimes several hundred miles away from the coast, originate from the coastal nursery grounds or originate from open sea nursery grounds. The occur- rence of such an open sea nursery grounds might be inferred from the February distribution of < 9 cm dab, which showed a wide distribution around the Dogger Bank and in the eastern central North Sea (Fig. 5a). A similar observation was made by Bohl(1957). Since the l=ig, 7, ~ i ~ ~ ~ d ~ h a n d a , Average catch rate of dab (kg h- ' ) in numbers of small dab in the open sea are much the English Groundfish survey in August between 1977 and lower than in the coastal areas we tentatively conclude 1986 (from Daan et al. 1990)

Rijnsdorp et al.: Population blology of dab 25
Fig. 8. Limanda limanda. Recapture positions of dab tagged as adults (> 15 cm) in 3 areas: (a) German Bight (December);
(b) Terschelling grounds (June); (c ) Southern Bight (July)
that the majority of the dab in the North Sea are re- cruited from coastal nursery grounds and that only a small proportion living offshore originate from larval fish that settled in the open sea.
Migration
The spatial segregation of eggs and young dab im- plies that at some stage dab must be transported from the open sea spawning areas to the coastal nursery areas. No information exists on the transport mecha- nism that concentrates larvae and early juveniles in the shallow coastal nursery areas.
In winter it is known that dab leave the Wadden Sea and shallow coastal areas as the sea cools down (see also Fig. 5). In winter small dab (10 to 15 cm) are some- times caught in large numbers in deeper areas off the Wadden Sea at 2S°C, but they seem to avoid waters at lower temperatures (Bohl 1957, Creutzberg & Fonds 1971). Bohl (1957) reports that fishermen have seen large swarms of pelagic dab leaving the Wadden Sea after the first period of frost.
Bohl (1957) inferred from seasonal differences in the length distribution and age composition of dab in vari- ous depth zones that after spawning part of the adult population migrates back to the coastal waters. Female dab are the first to return to the coastal feeding grounds followed by males. Also large fish precede the smaller ones. De Veen (1978) demonstrated that dab
make use of tidal transport to return to the Wadden Sea.
Tagging experiments with dab > 15 cm have been carried out in 3 geographical areas: (1) German Bight, (2) north of the west Friesian Islands, (3) southern coast of the Netherlands (Darnm et al. 1991). The results indicate that dab can exhibit substantial migrations away from the place of tagging (Fig. 8a to c).
Examination of the individual experiments made it clear that dab tagged in December in the German

26 BREMERHAVEN WORKSHOP: BACKGROUND PAPERS
Bight migrate in all directions without a clear prefer- ence (Fig. 8a). During the spawning months between February and Apnl, 7 from a total of 17 recaptures were made in the Southern Bight, 2 at the southern edge of the Dogger Bank, 4 in the German Blght and 4 near the coast of Denmark.
The dab tagged in July in the area north of the Friesian Islands were recaptured in the following sum- mer and autumn in a small area around the tagging position, but had migrated a long distance southwest into the Southern Bight prior to spawning (Fig. 8b). The 4 recaptures between May-August after spawn- ing were also made near the tagging position.
The dab tagged along the southern part of the Dutch coast were mainly recaptured in the Southern Bight, although one fish was recorded in the eastern English
Channel. No clear seasonal pattern emerges from the data. During the spawning period only 3 recaptures were reported: 2 from the area itself and 1 from the eastern English Channel (Fig. 8c). These results are in agreement with de Clerck (1984) who tagged dab along the Belgian coast.
Comparison of the recaptures during the spawning period indicate that the spawning population of dab in a particular area may originate from individuals that are widely dispersed over a large area of the southern North Sea during the summer feeding period. For in- stance, in the spawning period recaptures made in the Southern Bight originated from all 4 tagging sites. However, during the spawning period in the German Bight no recaptures were made of fish from other tag- ging experiments than the German Bight itself, sug-
Table 3. Limanda limanda. Abundance of male and female dab, sex ratio, number of hauls and total trawl duration along the transect from the inner German Bight towards the Dogger Bank (Stns 3 to 9) and on the drilling site (Stn A) and reference station
(Stn R)
Stn Nrna~e Nferna~e NCO,. Ntat. h-' % male No. of Catch hauls weight
(kg)
Cruise 1: 12-17 March 1990 3 13 5 7265 6 3555 7 1567 8 2128 9 1639
Cruise 2: 22-25 March 1990 3 49 5 307 0 6 3871 7 7 95 8 756 9 236 A - Drilling site 99 R - Ref. stn 299
Raising factor to the total catch is unknown
Table 4. Results of ANOVA of log,-transformed catch rates of dab ( Y ) according to the model: Y = S + C + S.C + e; where S: station; C: cruise; and S.C: interaction between station and cruise; e is the normally distributed error term
S C S.C Error Total
I ' After adjusting far main effects l
Rijnsdorp et al.: Populat~on biology of dab 27
gesting that the spawning population in the German Bight originates from the German Bight and probably from more northern areas.
The spatial and temporal pattern of recaptures will not only be determined by the migration, but also by the seasonal changes in fishing effort. Clusters of re- captures in particular months therefore, might be due to local concentrations of fishing effort rather than a local concentration of tagged fish. Overall the fishing effort for flatfish, dominated by the Dutch beam trawl fleet, shows a high intensity all over the southern and southeastern North Sea (see Fig. 6 in Rijnsdorp et al. 1991). The patterns of recaptures, therefore, will in general give a realistic but necessarily crude picture of the distances and directions travelled by dab. The re- captures of experiment c (southern coast of the Nether- lands; Fig. 8c), however, may be biased by the larger fishlng effort in the southern North Sea compared with the eastern English Channel.
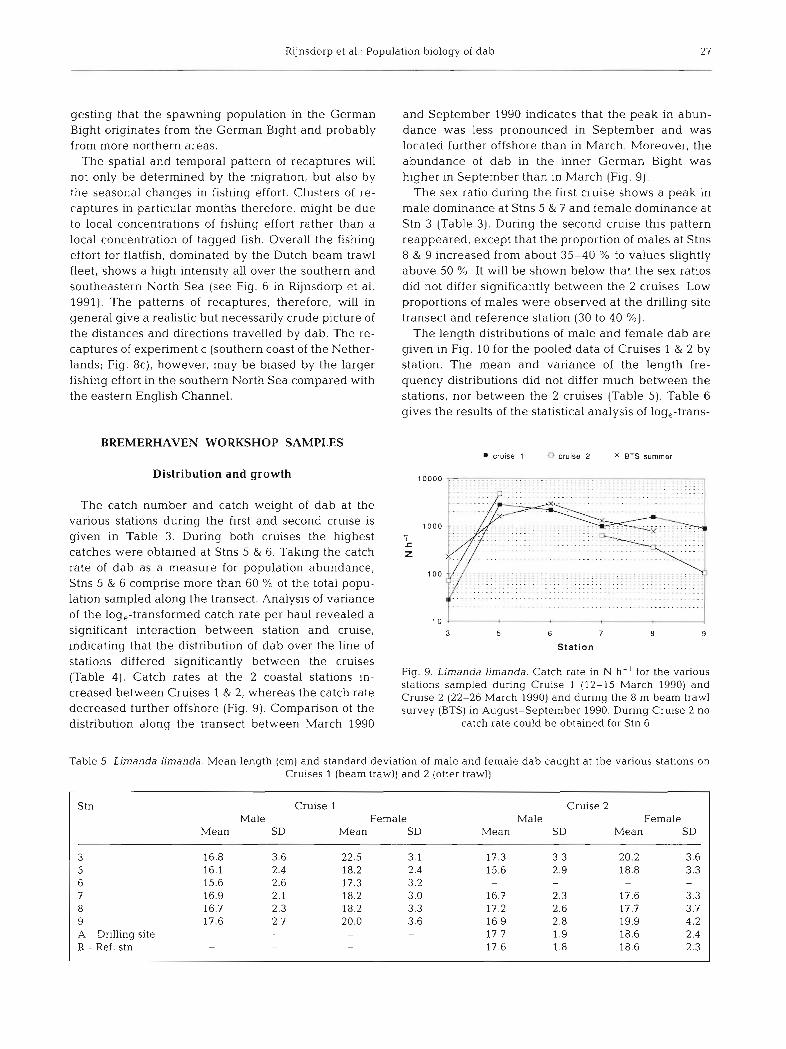
and September 1990 indicates that the peak in abun- dance was less pronounced in September and was located further offshore than in March. Moreover, the abundance of dab in the inner German Bight was higher in September than in March (Fig. 9).
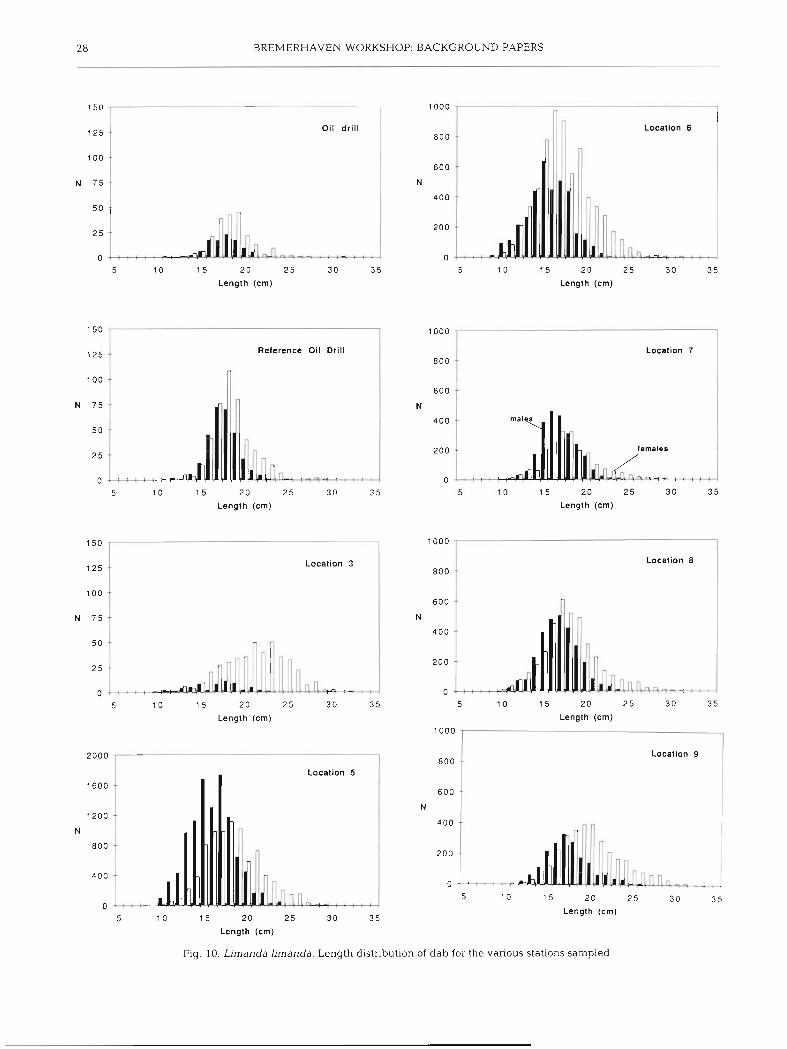
The sex ratio during the first cruise shows a peak in male dominance at Stns 5 & 7 and female dominance at Stn 3 (Table 3). During the second cruise this pattern reappeared, except that the proportion of males at Stns 8 & 9 increased from about 35-40 % to values slightly above 5 0 %. It will be shown below that the sex ratios did not differ significantly between the 2 cruises. Low proportions of males were observed at the drilling site transect and reference station (30 to 40 %).
The length distributions of male and female dab are given in Fig. 10 for the pooled data of Cruises 1 & 2 by station. The mean and variance of the length fre- quency distributions did not differ much between the stations, nor between the 2 cruises (Table 5). Table 6 gives the results of the statistical analysis of log,-trans-
BREMERHAVEN WORKSHOP SAMPLES * cruise l 0 cruise 2 X BTS summer
Distribution and growth
The catch number and catch weight of dab at the various stations during the first and second cruise is given in Table 3. During both cruises the highest catches were obtained at Stns 5 & 6. Taking the catch rate of dab as a measure for population abundance, Stns 5 & 6 comprise more than 60 % of the total popu- lation sampled along the transect. Analysis of variance of the log,-transformed catch rate per haul revealed a significant interaction between station and cruise, indicating that the distribution of dab over the line of
1 0 1- F--------- - I 3 5 6 7 B 9
Station
stations differed significantly between the cruises (Table 4), Catch rates at the coastal stations in- Fig. 9. Lirnanda limanda. Catch rate in N h- ' for the various
stations sampled during Cruise 1 (12-15 March 1990) and creased between Cruises 1 & 2, whereas the catch rate Cruise 2 (22-26 March 1990) and during the 8 m beam trawl decreased further offshore (Fig. 9). Comparison of the survey (BE) in ~ugust-September 1990. During Cruise 2 no distribution along the transect between March 1990 catch rate could be obtained for Stn 6
Table 5. L m a n d a limanda. Mean length (cm) and standard deviation of male and female dab caught at the various stations on Cruises 1 (beam trawl) and 2 (otter trawl)
Stn Cruise 1 Cruise 2 Male Female Male Female
Mean SD Mean SD Mean SD Mean SD
3 5 6 7 8 9 A - Drilling site R - Ref. stn

Rijnsdorp et al.. Population biology of dab 29
formed catch rates per 5 cm size-class by station, cruise shown by the first order interaction terms (Table 6). and sex. The analysis revealed that the length distribu- This indicates that the length distributions of both male tions differed significantly between the sexes, as well and female differed between the stations and between as between the stations, but not between the cruises as Cruise 1 & 2. Mean length was highest at Stns 3 & 9
Table 6. Results of ANOVA of length distribution of male and female dab at the 6 transect stations during Cruises 1 & 2 according to the model: Y = L + S + C + SX + SX L + SX.S + SX.C + L.S + L.C + S.C + SX.S.C + e; where Y: log, number of dab; L: 5 cm size class (6 levels); S: station (6 levels); C: cruise (2 levels). SX: sex (2 levels); SX.L: interaction of sex and size-class; SX C: interaction of sex and cruise; SX.S: interaction between sex and station; L.S: interaction of size-class and station; L.C: interaction of size-class and cruise; S-C: interaction of station and cruise; and SX.S.C: interaction between sex, cruise and station. e is a normally
distributed error term
df SS MS F P
SX.La 4 4308 1077 39.0 c 0.01 SX.Cd 1 245.1 245.1 8.9 < 0.01 SX.S 4 1585 317.0 11.5 c 0.01 L.S 20 2320 116.0 4.2 < 0.01 L.C 4 116.2 29.05 1.05 ns S.C 4 3608 902.0 32.7 c 0.01 Error 418 11540 27.61
SX.S.C 4 53.21 13.30 0.48 ns Error 414 11480 27.73
Total 4 67 142200
a After adjusting for main effects
Table 7. Lirnanda limanda. Mean length at age (cm below) of male and female dab per sampling station in March 1990. Pooled data for Cruises 1 & 2
Station number 3 5 6 7 8 9
Males
1 - 2 13.07 3 15.80 4 17.41 5 19.15 6 22.92 7 21.84 8 23.91 9 20.00 10 - 11 -
Females
1 - - - - - 11.40 2 12.90 12.27 13.08 12.47 12.62 13.79 3 17.25 15.50 15.36 15.17 16.06 17.49 4 20.29 18.59 17.58 17.57 18.30 19.37 5 23.17 21.93 20.99 20.02 19.49 22.23 6 24.27 23.54 22.25 22.81 20.69 24.34 7 27.21 27.20 25.50 26.24 22.90 25.80 8 26.83 26.20 26.88 23.38 26.10 27.20 9 28.00 25.53 26.00 27.06 24.22 27.86 10 - - - 24.00 26.94 32.00 11 - - - - 27.46 -
30 BREMERHAVEN WORKSHOP: BACKGROUND PAPERS
* Station 3 - Station 5-8
- - * - Station 9
Age (years)
25 - 5 20 - 5 0 ' 5 - C W A
W' 10 -
: Station 3 - Station 5-8
* - Station 9
0 4 6 8 1 0 1 2
Age (years)
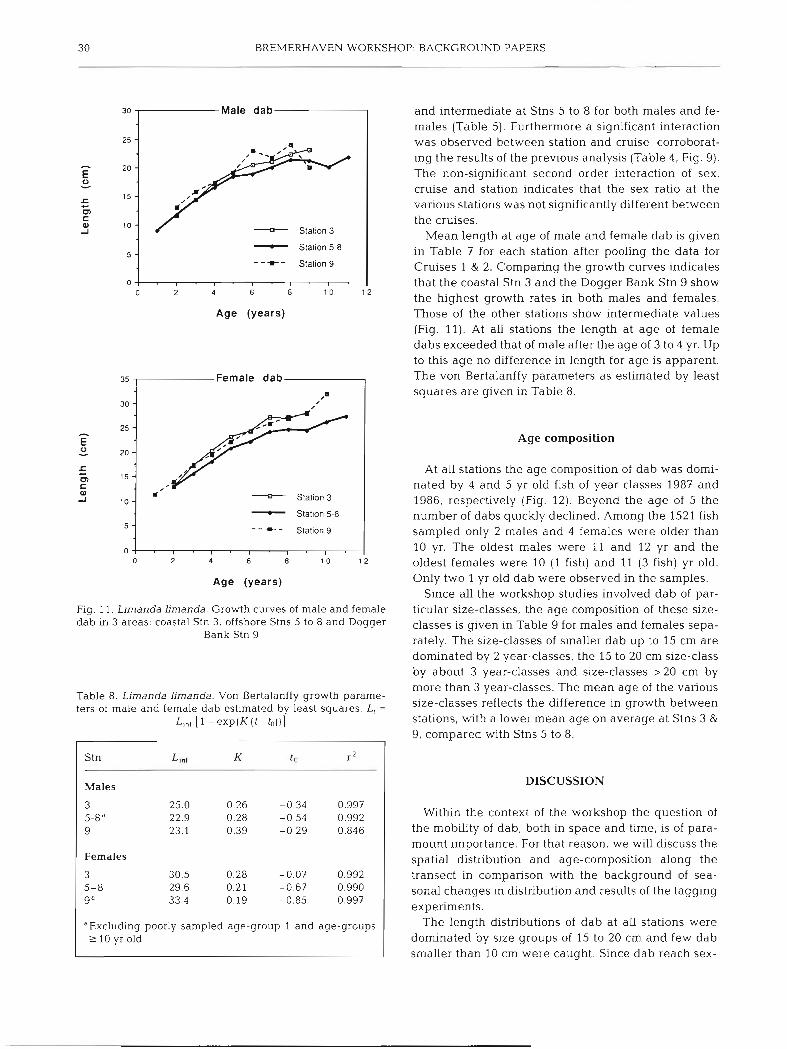
Fig. 11. Limanda l imanda. Growth curves of male and female dab in 3 areas: coastal Stn 3, offshore Stns 5 to 8 and Dogger
Bank Stn 9
Table 8. Limanda hmanda. Von Bertalanffy growth parame- ters of male and female dab estimated by least squares L, =
L,,,, [ l - exp(K(t-to))]
I Males
Females
3 5-8 gd
aExcluding poorly sampled age-group 1 and age-groups 2 l0 yr old
and intermediate at Stns 5 to 8 for both males and fe- males (Table 5). Furthermore a significant interaction was observed between station and cruise, corroborat- ing the results of the previous analysis (Table 4 , Fig. 9). The non-significant second order interaction of sex, cruise and station indicates that the sex ratio at the various stations was not significantly different between the cruises.
Mean length at age of male and female dab is given in Table 7 for each station after pooling the data for Cruises 1 & 2. Comparing the growth curves indicates that the coastal Stn 3 and the Dogger Bank Stn 9 show the highest growth rates in both males and females. Those of the other stations show intermediate values (Fig. 11). At all stations the length at age of female dabs exceeded that of male after the age of 3 to 4 yr. Up to this age no difference in length for age is apparent. The von Bertalanffy parameters as estimated by least squares are given in Table 8.
Age composition
At all stations the age composition of dab was domi- nated by 4 and 5 yr old fish of year classes 1987 and 1986, respectively (Fig. 12). Beyond the age of 5 the number of dabs quickly declined. Among the 1521 fish sampled only 2 males and 4 females were older than 10 yr. The oldest males were 11 and 12 yr and the oldest females were 10 (1 fish) and l1 (3 fish) yr old. Only two 1 yr old dab were observed in the samples.
Since all the workshop studies involved dab of par- ticular size-classes, the age composition of these size- classes is given in Table 9 for males and females sepa- rately. The size-classes of smaller dab up to 15 cm are dominated by 2 year-classes, the 15 to 20 cm size-class by about 3 year-classes and size-classes >20 cm by more than 3 year-classes. The mean age of the various size-classes reflects the difference in growth between stations, with a lower mean age on average at Stns 3 & 9, compared with Stns 5 to 8.
DISCUSSION
Within the context of the workshop the question of the mobility of dab, both in space and time, is of para- mount importance. For that reason, we will discuss the spatial distribution and age-composition along the transect in comparison with the background of sea- sonal changes in distribution and results of the tagging experiments.
The length distributions of dab at all stations were dominated by size groups of 15 to 20 cm and few dab smaller than 10 cm were caught. Since dab reach sex-

Rijnsdorp et al.: Population biology of dab
Fig. 12. Limanda limanda. Age composition of (a) male, and (b) female dab at the various stations of the tran- sect between Helgoland and
the Dogger Bank
a. Male dab
Age (years)
6 0 b. Female dab
5 0 station-3
4 0 0 station-5
station-6 % 30
station-7
2 0 station-8
1 0 H station-9
0 3 4 5 6 7 8
Age (years)
ual maturity at a length of 11 cm and 14 cm in males and females, respectively, the catches represent mainly the mature part of the population. The decline in the catch-rate with increasing length of dab > 15 cm can be attributed to mortality. The absence of small dab along the transect may be due to 2 successive poor year-classes, mesh selection or the process of recruit- ment from the shallow coastal waters to the open sea. Although no firm conclusion can be drawn from one year's data, the absence of these size- and age-groups from offshore trawl catches was also reported by Bohl (1957). Mesh-size selection is partly responsible for the absence of dab smaller than about 7 cm, which is the length at which 50 % of the dab are retained in the cod-end with the current mesh size of 32 mm, given the selection factor of 2.2 (Bohl 1964).
According to van der Land (1991), the spawning of dab in the southern and southeastern North Sea starts in January and reaches a peak in March and April. Consequently, the Workshop cruises were carried out during the first of the 2 months of peak spawning.
The spatial distribution of dab along the transect from the inner German Bight to the Dogger Bank showed a peak in abundance at Stn 5. This peak coin- cided with the area of highest egg density as observed by Bohl (1957) and van der Land (1991). The peak in abundance and the dominance of male dab at Stn 5 is likely to be related to spawning, since it fits the general pattern observed in flatfish (Hefford 1916, Wirnpenny 1953). Bohl (1957) reported that after spawning female dab return to the coastal areas earlier than males, just as the older fish return earlier than the younger ones. He also demonstrated that males spend longer in spawning condition than females, which agrees with the general pattern observed in flatfish. In plaice the males are present at the spawning grounds at the be- ginning of the spawning period and stay there until the end. Female plaice, however, are thought to visit the spawning grounds several times to shed a batch of eggs and aggregate in the areas adjacent to the actual spawning grounds in between the spawnings (Sirnpson 1959, Rijnsdorp 1989). The average duration

NN
-M
E
WN
Nr
rL
n
Cn
oc
no
N
N-
+p
N
r-
U
NN
++
V)
N
N-
-E
!!
-+W
N
N-
-L
nW
N
rr
w
Nr
rI
I)
l l
l I
D
?Y
?Y
'?S
m
Oy
0E
I
I o
cn
o-
I
I I
C m
o-
0
I I
l,
0
om
o*
o
oc
no
l N
N-
+C
~
WN
N~
~W
I
I 1
3
I I
I 1 a
s
?Y
OS
1
1 1
.
"P
W*
P
"P
?=
*
NN
rr
Wm
N
rr
~n
N
rr
~
E$
6g
w E
%2Zr
n w
ww
w
ww
ww
w
ww
ww
3
WW
WQ
ww
ww
w
ww
w~
ww
w
P"
?
P"
?
ww
w
nn
nn
n
nn
nn
3
33
3
33
33
9
nn
nn
n
nn
nm
n
nn
n
33
33
;
33
3g
3
33
3
nn
nn
n
n n
n
oo
n3
3
33
3
33
3
33
33
ss
: 55s
e -
W
r
4m
N
rw
rO
C
"O
?
!y
gz
O
WO
O
00
0
r
W
W
4 N
m
cn
m
mm
~n
A
WN
+
oa
4
ww
7
0"
PV
Y'J'
N
W"
-
W?
g
wo
o
04
4
W
OW
W
4 m
4 C
I P
)P
).
J~
l
?p
m l
o
om
w
NO
W
N-
N
- C
n m
N
m
r
cn
P
O"
"'
0O
m?
l
ow
-W
O
WW
W
N r
N ,-
N -
h)
N
1 P
P)
l
N P
N
I N
O I
I W
C?
N
W0
3
4
W
YY
I
WO
K y
4w
4 N
cn
e
W
N
m
I F
P)
I v
lr l
ova1
I +
I
I W
W
W
W
O
NW
iD
2:
1 C
n r
"'
"I
I
W
W
-0
00
&
&E
g
=':
: O
CD
WP
-
+m
w
Cn
Cn
w
mo
ww
?
-0
-
00
r-0
00
-
00
T
OO
m
Nm
W
WW
O
N-
-1
m4
L
&&
N
.lm
0
mm
r
ow
04
W
-4
W
NW

Rijnsdorp et al.: Population biology of d a b 3 3
Table 9 (continued)
N h - ' Year class and a g e group Mean a g e SD 1989 1988 1987 1986 1985 1984 1983 1982 1981 1980 1979
1 2 3 4 5 6 7 8 9 10 11
Stn 6 10-14.9 cm 223.4 - 53.8 46.2 - - - - - - - - 2.5 0 50 15-19.9 cm 785 6 - 4.0 33.8 55.7 6.5 - - - - - - 3.6 0.66 20-24.9 cm 260 0 - - - 11.9 62 4 25.7 - - - - 5.1 0.60 25-29.9 cm 24.4 - - 1.6 11.7 47 1 27.0 9 .0 2.8 0 .8 - - 5.4 1.02 30-34.9 cm 1.4 - - - 33.3 - 66.7 - - - - - 5.3 0.95
Stn 7 10-14 9 cm 38.1 - 50.9 49.1 - - - - - - - - 2.5 0.50 15-19.9 cm 278.6 - - 22.7 63.3 14.0 - - - - - - 3.9 0.60 20-24.9 cm 96.2 - - - 12.5 52.5 24.2 0.9 9 1 - 0.9 - 5.5 1.12 25-29 9 cm 15.9 - 26.0 15.2 28.9 2.9 20 3 6.7 - 6.0 1.63 30-34.9 cm 0.4 - - - - - 100.0 - - - - 7.0 0.00
Stn 8 10-14.9 cm 71.5 - 68.9 3 1 1 - - - - - - - - 2 3 0.47 15-19.9 cm 388.5 - 36 8 36.2 22.5 4.4 - - - - - 3.9 0.88 20-24.9 cm 143.5 - 30.8 24.5 31.6 6.4 - 6.7 - - 5.4 1.35 25-29.9 cm 30.5 - 7.9 13.0 21.6 12.1 19.7 14.4 7.5 3 .9 7 .2 1.88 30-34.9 cm 1.8 - - - 20.0 20.0 - 20.0 40.0 - 8.4 1.63
Stn 9 10-14.9 cm 17.1 2 9 83.9 13.1 - - - - - - - - 2.1 0 39 15-19.9 cm 179.0 - 1.7 26.8 57 3 9.6 4.6 - - - - - 3.9 0 78 20-24.9 cm 154 8 - - 12.2 49.2 33.2 1.9 3 .5 - - - 4.4 0 85 25-29.9 cm 44.0 - - 6.3 46.1 28.7 8.6 5 8 4.5 - - 5.7 1 18 30-34.9cm 4.1 - - 1 1 9 32.7 36.1 1 4 7 3 6 - 1 .O 6.7 1 08
Drilling site 10-14.9 cm 5 0 - 52.0 48.0 - - - - - - - - 2 5 0.50 15-19.9 cm 154.0 - 0.8 18.7 68.8 5.8 5.8 - - - - - 4.0 0.72 20-24.9 cm 49 0 - - 12 6 61.6 20.2 5 6 - - - 5 2 0 72 25-29.9 cm 4.0 - - - 12.0 59.3 20 3 4.3 2 0 2.0 - - 5.3 0 99 30-34.9 cm 1.0 - - 8.0 38.0 31.0 23 0 - - - 6.7 0 92
Reference station 10-14.9 cm 9.6 - 52.0 48.0 - - - - - - - 2 5 0.50 15-19.9 cm 320.0 - 0.9 22.0 52.6 24.4 - - - - - - 4 0 0.71 20-24.9 cm 112.0 - - 6 5 26.8 62.5 0.9 3.3 - - - - 4.7 0.76 25-29.9 cm 5.0 - - - 4 8 32 8 36.0 12.0 6.6 7 8 - - 6 .1 1 27
of the spawning period was estimated at 11 wk and 5 wk in male and female plaice respectively and the spawning of older fish is earlier and of slightly longer duration (Rijnsdorp 1989). If a similar pattern applies to dab, the males will be stationary during the spawning period, whereas the females may move within a re- stricted area around the actual spawning grounds. The increase in the abundance at the 2 coastal Stns 3 & 5 between Cruise 1 (mid-March) and Cruise 2 (late March), however, suggests that dab were still migrat- ing to the centre of spawning around Stn 5.
The results of the tagging experiments suggest that dab migrate seasonally between spawning and feed- ing areas. A seasonal shift in the centre of distribution of the recaptures was clearly observed in the tagging
experiment north of Terschelling (Fig. 8b), indicating a southward migration towards the spawning grounds and a northward migration towards the feeding grounds. The results of the tagging experiments in the Southern Bight and Belgian coast are less clear but do not contradict this interpretation. Dab tagged in the German Bight, however, deviate from this pattern as they exhibited a wide spread of recaptures in the spawning period over a sea area north and west of the tagging site (Fig. 8a). Care should be taken in inter- preting the pattern of recaptures since not only the migration of the fish but also the relative distribution of fishing effort will strongly influence the pattern of recaptures. A detailed analysis of the tagging results is given by Damm et al. (1991).

BREMERHAVEN WORKSHOP: BACKGROUND PAPERS
The seasonal migration of dab in the German Bight may be inferred from changes in spatial distribution of dab, assuming that there is no spatial difference in the catchability within size- or age-groups. Seasonal movements of adult dab are suggested from a compari- son of the distribution of fish > 16 cm in February (Fig. 5), September (age-group 3+; Fig. 6) and that of the eggs in March (Fig. 2). In summer a distinct peak in abundance of dab is observed in the area between 54O 30' and 55" 30' N and east of 6" E. In February the location of the peak in abundance seems to have moved offshore west of 7" E. High abundance of older dab was observed in a relatively large area between the west Friesian Islands and the Dogger Bank. The peak in egg production in March was again highly concentrated in a zone along the coasts of Germany and Denmark between 7" and 8" E. This suggests that between February and March an east- or southeast- ward migration predominates, which agrees with the changes in distribution observed between Cruise 1 & 2 as shown in Fig. 8. The relative decrease in abundance of dab at the offshore stations near the Dogger Bank suggests that there is a net emigration from the offshore waters towards the coastal spawning grounds.
Differences in growth were observed between the coastal Stn 3 and the Dogger Bank Stn 9 and the inter- mediate stations (Fig. 11). These differences are in agreement with the observations of Bohl (1957), who found that the dab in the most shallow areas in the German Bight grew faster compared with dab at the offshore grounds. The higher growth rate on the Dogger Bank station was comparable to dab at the offshore grounds. The higher growth rate on the Dogger Bank is in contradiction with Lozan (1989), who observed a reduced growth on the Dogger Bank and in the central North Sea. The differences in growth nevertheless support the conclusion that fish from the offshore stations will have a different history compared to the fish in the inner German Bight and the inter- mediate stations.
CONCLUSIONS RELEVANT TO THE BREMERHAVEN WORKSHOP
The results of the tagging experiments suggest that at any time the dab population at a sampling site is a transient aggregation of fish originating from a large area. The generally high scatter of individual recap- tures suggests that groups of fish do not stay together permanently. A significant change in the spatial distri- bution occurred between Cruise 1 in mid-March and Cruise 2 in late March, which implies that even withn a period of 3 wk substantial movements of dab occur.
Results of the biological effect studies in the workshop, therefore, can only be interpreted in general terms, es- pecially when dealing with responses that are induced slowly, such as gross pathology (liver tumors) and tis- sue residue data.
The relative stability in the spatial distribution of dab in the German Bight during spring and summer suggests that most of the dab caught at the offshore stations during spawning will have lived in offshore waters after leaving the coastal nursery grounds. The tagging data showed that some dab migrated from the inner German Bight and the Dogger Bank area between December and the spawning period. Dab caught in the inner German Bight during the spawning period represent mixtures of fish including those from offshore and coastal waters. Overall, fish from Stn 9 will reflect the relatively clean conditions offshore, whereas fish from the inner stations will represent the more polluted waters of the Ger111dri Bight.
LITERATURE CITED
Bohl, H. (1957). Die Biologie der Kliesche (Limanda limanda L.) in der Nordsee. Ber. dt. wiss. Kommn Meeresforsch. 15: 1-57
Bohl, H. (1964). Investigations on the selection of dab and plaice by cod-end meshes of flatfish trawls. ICES C.M. 1964/Comparative Fishing Committee 5 (mimeo.)
Cameron, P,, Berg, J. Dethlefsen, V., von Westernhagen, H. (1992). Developmental defects in different species of pelagic flatfish embryos in the southern North Sea. Neth. J . Sea Res. 29: 239-256
Creutzberg, F., Fonds, M. (1971). The seasonal distribution of some demersal fish species in the Dutch Wadden Sea. Thalassia jugosl. 7: 13-23
Daan, N., Bromley, P. J., Hislop, J. R. G., Nielsen, N. A. (1990). Ecology of North Sea fishes. Neth. J. Sea Res. 26: 343-386
Damm, U. , Lamb, F., Rijnsdorp, A. D. (1991). Tagging of dab in the southern North Sea. ICES C.M. 1991/E:22 (mimeo.)
d e Clerck. R. (1984). Tagging results of mature dab in the Southern Bight. ICES C.M. 1984/G:11
Dethlefsen, V., Watermann, B., Hoppenheit, M. (1987). Diseases of North Sea dab (Limanda limanda L.) in relation to biological and chemical parameters. Arch. FischWiss. 37(3): 107-237
de Veen, J . F. (1978). On the selective tidal transport in the migration of North Sea plaice (Pleuronectes platessa) and other flatfish species. Neth. J. Sea Res. 12: 115-147
Edwards, R., Steele, J. H. (1968). The ecology of 0-group plaice and common dabs at Loch Ewe. I. Population and food J. exp. mar. Biol Ecol. 2: 215-238
Ehrenbaum, E. (1905-1909). Eier und Larven von Fischen des Nordischen Planktons. Nord. Plankt. 1: 1-413
Harding, D., Nicholls, J. H. (1987). Plankton surveys off the north-east coast of England in 1976: an introductory report and summary of the results. Fish. Res. Tech. Rep. 86, MAFF Direct. Fish. Res., Lowestoft, 56 pp.
Hefford, A. E. (1916). Report on the sexual differentiation in the biology and distnbution of plaice in the North Sea. Fishery Invest., Lond., Ser. 2, Vol. 3(2)
ICES (1986). Manual for the international young fish surveys

Rljnsdorp et al.: Population biology of dab 3 5
in the North Sea, Skagerrak and Kattegat. ICES CM/H:2 (mimeo.)
ICES (1990). Report on the study group on beam trawl surveys in the North Sea and eastern Engllsh Channel, Ostende 5-8 June 1990. ICES C.M. 1990/G.59 (mimeo.)
Lozan, J. L (1989). Investigations on the growth of dab (Limanda hrnanda L.) in eight areas of the North Sea and comparisons with earlier findings. Arch. Fischereiwiss. 39: 111-146
Pihl, L. (1989). Abundance, biomass and production of juve- nile flatfish in the southeastern Kattegat. Neth. J Sea Res. 24. 69-81
Poxton, M. G., Eleftherlou, A., Mclntyre, A . D (1982). The population dynamics of 0-group flatflsh on nursery grounds in the Clyde Sea area. Estuar. coast. Shelf Sci. 14: 265-282
Rijnsdorp, A. D. (1989). Maturation of male and female North Sea plaice (Pleuronectes platessa L.) J . Cons. int. Explor. Mer 46: 35-51
Rijnsdorp, A. D., Groot, P. J., van Beek, F. A. (1991). The microdistribution of beam trawl effort in the southern North Sea. ICES C.M. 1991/G:49 (mimeo.)
Rlley, J. D., Symonds, D. J. , Woolner, L. E. (1981). On the fac- tors influencing the distribution of 0-group demersal fish
in coastal waters. Rapp. P.-v. Reun. Cons. int. Explor. Mer 178: 223-228
Slmpson, A. C . (1959). The spawning of the plaice (Pleu- ronectes platessa L.) in the North Sea . Fishery Invest., Lond , Ser. 2, Vol. 22(7)
Sparholt, H. (1987). An estimate of the total biomass of fish in the North Sea, with special reference on fish eating species not included in the MSVPA model. ICES C.M. 1987/G:52 (mimeo.)
Steele, J. H., Edwards, R. R. C . (1970). The ecology of 0-group plaice and common dabs in Loch Ewe. IV. Dynamics of the plaice and dab populations. J exp. mar. Biol. Ecol 4 174-187
van Beek, F. A., Rijnsdorp, A D., de Clerck, R. (1989). Monitoring juvenile flatfish in the Wadden Sea and the coastal areas of the southeastern North Sea. Helgolander Meeresunters. 43: 461-477
van der Land, M. A. (1991). Distribution and mortality of flat- fish eggs in the 1989 egg surveys in the southern North Sea. Neth. J. Sea Res. 27: 273-286
Vethaak, A. D., ap Rheinallt, T. (1992) Fish disease a s a mon- Itor of marine pollution: the case of the North Sea Rev. Fish Biol. Fish. 2: 1-32
Wimpenny. R. S. (1953). The plaice Arnold, London