population exposure to pm2.5 in europe - rivm€¦ · · 2009-05-13rural:urban:traffic = 2 :5 : 4...
TRANSCRIPT

Population exposure to PM2.5 in Europe
Measurements and modelling of PM2.5, 23-24 April 2009, Bilthoven
Frank de Leeuw, Jan Horálek

PM2.5 workshop, Bilthoven, 23-24 April 2009, Frank de Leeuw 2
PM2.5 monitoring data
� Limited information in
AirBase
� 224 “valid“ stations
� rural:urban:traffic = 2 :5 : 4
� additional informationfrom reporting under
FWD
0 - 15 ug/m3
15 - 25 ug/m3
25 - 30 ug/m3
> 30 ug/m3
source: ETC/ACC-AIRBASE March 2009
PM2.5
annual mean
2007all stations, data coverage > 75%
PM2.5 workshop, Bilthoven, 23-24 April 2009, Frank de Leeuw 3
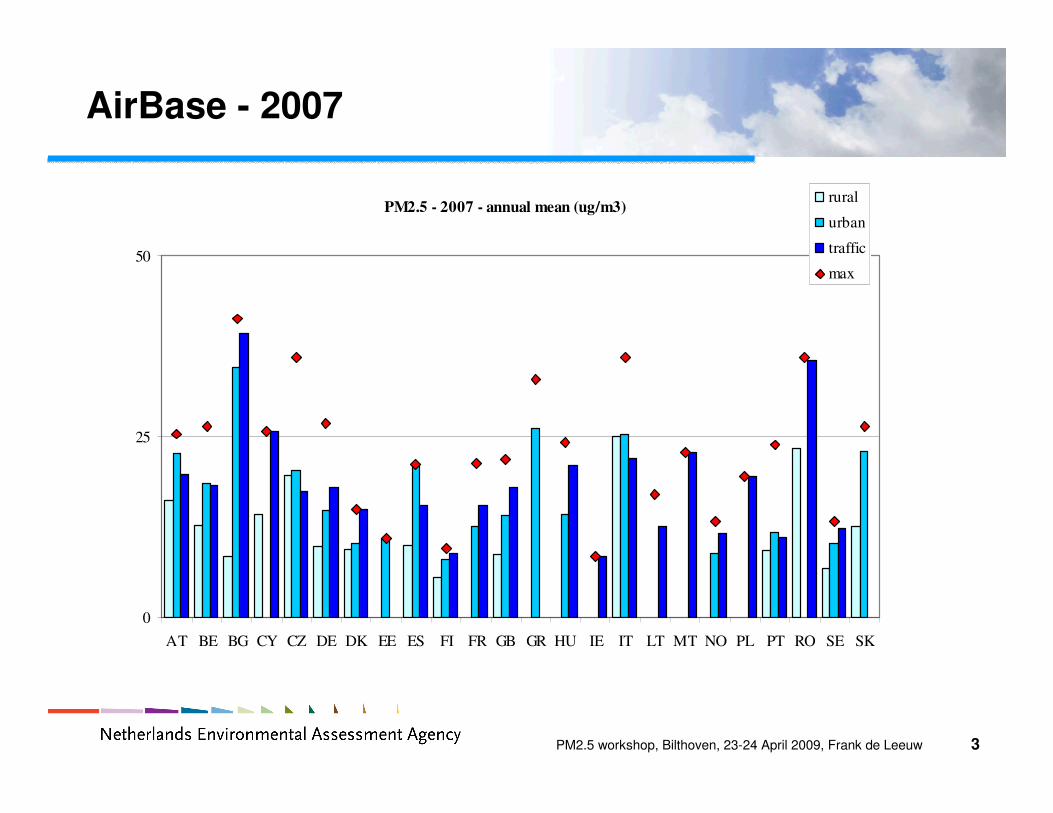
AirBase - 2007
PM2.5 - 2007 - annual mean (ug/m3)
0
25
50
AT BE BG CY CZ DE DK EE ES FI FR GB GR HU IE IT LT MT NO PL PT RO SE SK
rural
urban
traffic
max

PM2.5 workshop, Bilthoven, 23-24 April 2009, Frank de Leeuw 4
Exceedance of PM2.5 LV 25 ug/m3 - 2007
PM2.5 annual mean
0
25
50
75
rural urban traffic
co
ncen
trati
on
(m
g/m
3)
aver aver>LV max
39
97
15
79
84
PM2.5 workshop, Bilthoven, 23-24 April 2009, Frank de Leeuw 5
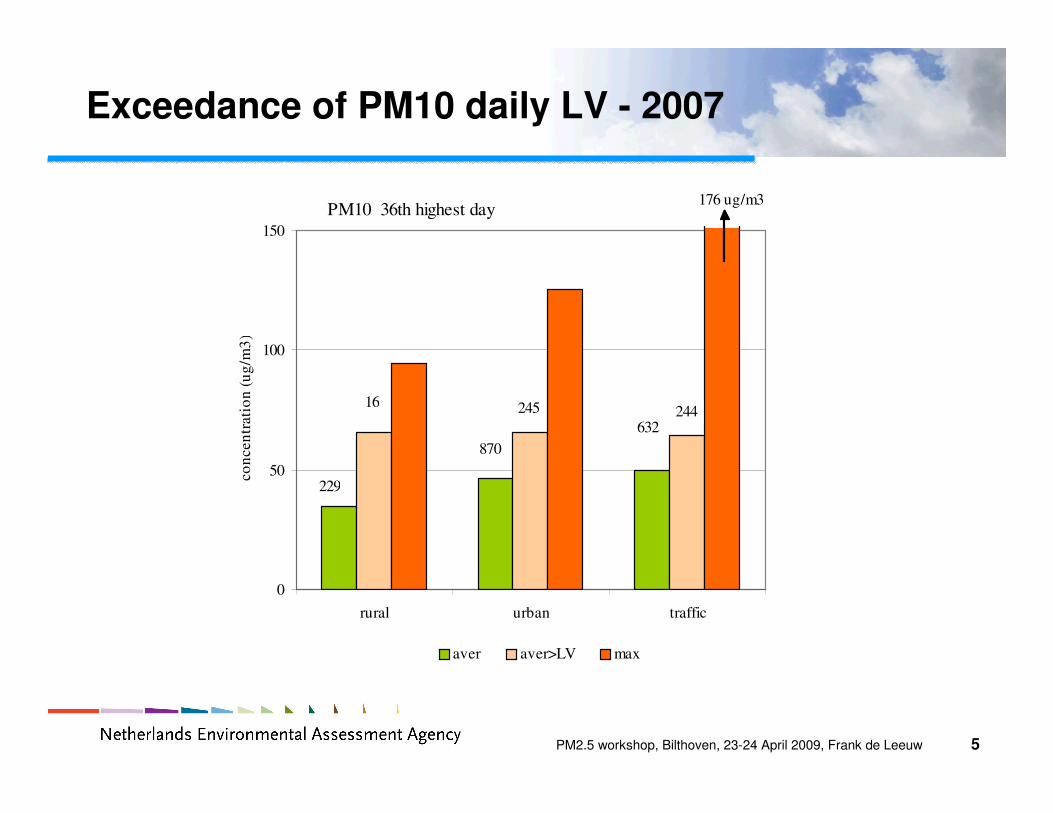
Exceedance of PM10 daily LV - 2007
PM10 36th highest day
0
50
100
150
rural urban traffic
co
ncen
trati
on
(u
g/m
3)
aver aver>LV max
229
16
870
245
632244
176 ug/m3

PM2.5 workshop, Bilthoven, 23-24 April 2009, Frank de Leeuw 6
Recent trend ?
PM2.5 annual mean
0
10
20
30
2001 2003 2005 2007
urban traffic rural

PM2.5 workshop, Bilthoven, 23-24 April 2009, Frank de Leeuw 7
Creating “new” data
� Conversion based on PM2.5/PM10 ratio
i. from ratio annual mean
ii. mean of daily ratios
iii. from regression on daily values:
bCratioCPMPM
+= 1025
∑∑ ⋅= 10,2
10,25,
11PMkPMkPMk
Ck
CCk
ratio
PM2.5 workshop, Bilthoven, 23-24 April 2009, Frank de Leeuw 8
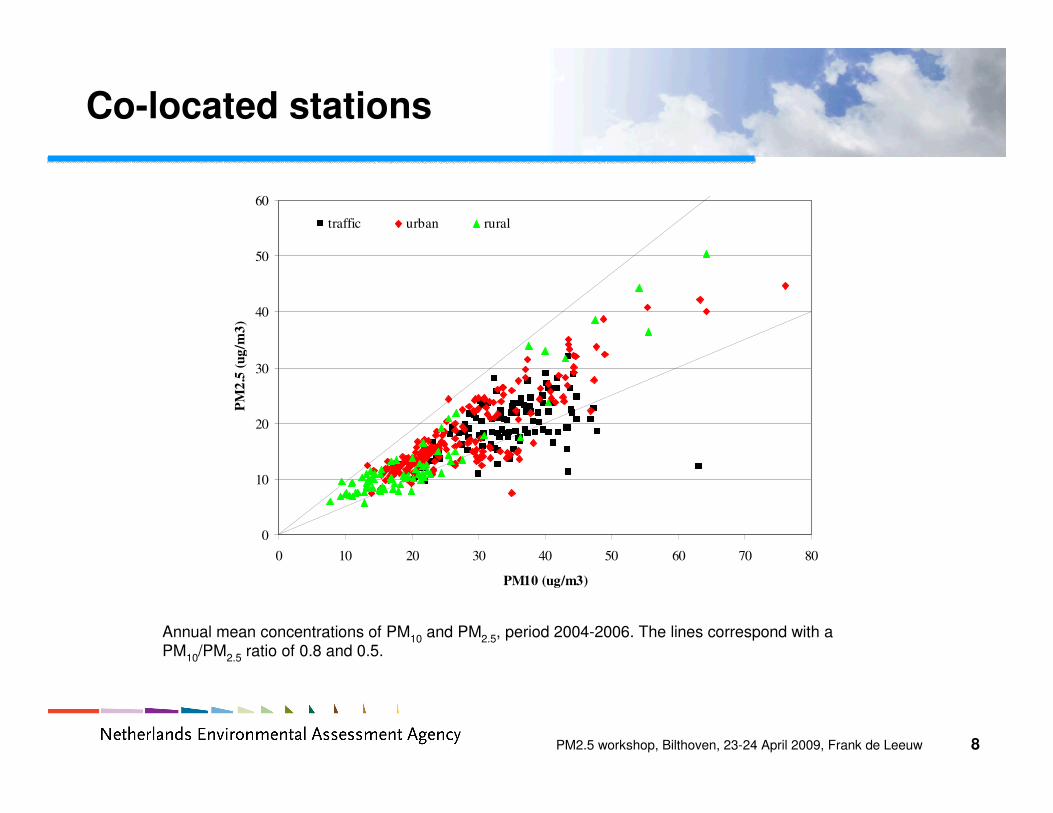
Co-located stations
0
10
20
30
40
50
60
0 10 20 30 40 50 60 70 80
PM10 (ug/m3)
PM
2.5
(u
g/m
3)
traffic urban rural
Annual mean concentrations of PM10
and PM2.5
, period 2004-2006. The lines correspond with a PM
10/PM
2.5ratio of 0.8 and 0.5.

PM2.5 workshop, Bilthoven, 23-24 April 2009, Frank de Leeuw 9
PM2.5 / PM10 ratios averaged for Europe and averaged per region and station type. The error bars indicate
plus/minus one standard deviation. The marked rural dots correspond to the adjusted ratios.
0.00
0.20
0.40
0.60
0.80
1.00
0 1 2 3 4 5Europe north north-west central-east south
rati
orural
urban
traffic
0.00
0.20
0.40
0.60
0.80
1.00
0 1 2 3 4 5Europe north north-west central-east south
rati
orural
urban
traffic
0.00
0.20
0.40
0.60
0.80
1.00
0 1 2 3 4 5Europe north north-west central-east south
rati
orural
urban
traffic

PM2.5 workshop, Bilthoven, 23-24 April 2009, Frank de Leeuw 10
Comparing with observations
(A) recalculated using European parameters
0
10
20
30
40
50
0 10 20 30 40 50
PM25 (ug/m3)
pse
ud
o-P
M2
.5 (
ug
/m3
)
rural
traffic
urban
(C) recalculated using country parameters
0
10
20
30
40
50
0 10 20 30 40 50
PM25 (ug/m3)
pse
ud
o-P
M2
.5 (
ug
/m3
)
rural
traffic
urban
(B) recalculated using regio parameters
0
10
20
30
40
50
0 10 20 30 40 50
PM25 (ug/m3)
pse
ud
o-P
M2
.5 (
ug
/m3
)
rural
traffic
urban

PM2.5 workshop, Bilthoven, 23-24 April 2009, Frank de Leeuw 11
PM10 map, 2005 (ETC/ACC technical paper 2007/7)

PM2.5 workshop, Bilthoven, 23-24 April 2009, Frank de Leeuw 12
PM2.5, 2005

PM2.5 workshop, Bilthoven, 23-24 April 2009, Frank de Leeuw 13
Comparing with observations
0
10
20
30
40
50
0 10 20 30 40 50
observed PM2.5 (ug/m3)
inte
rp
ola
ted
PM
2.5
(u
g/m
3)

PM2.5 workshop, Bilthoven, 23-24 April 2009, Frank de Leeuw 14
Population exposure
0
10
20
30
40
50
60
70
CYP PRT ESP AUT GRC BGR ROU ITA POL CZE SVK HUN
ex
po
sed
fra
cti
on
of
po
pu
lato
n (
%)
europe
regio
country
0
5
10
15
20
25
30
35
PRT CYP ESP AUT GRC BGR ROU ITA POL CZE SVK HUN
ex
ceed
an
ce a
rea
(in
% o
f la
nd
area
)
europe
regio
country
Extent of exceedance of 25 ug/m3 LV as fraction of
area population

PM2.5 workshop, Bilthoven, 23-24 April 2009, Frank de Leeuw 15
Population exposure
0
5
10
15
20
25
30
35
40
CYP PRT ESP AUT GRC BGR ROU ITA POL CZE SVK HUN
po
pu
lati
on
weig
hte
d P
M2
.5 c
on
cen
tra
tio
n
europe
regio
country
Concentration in exceedance areas

PM2.5 workshop, Bilthoven, 23-24 April 2009, Frank de Leeuw 16
Average Exposure Index
PM2.5 in urban areas
0
10
20
30
40
AU
T
BE
L
BG
R
CY
P
CZ
E
DE
U
DN
K
ES
T
ES
P
FIN
FR
A
GR
C
HU
N
IRL
ITA
LT
U
LU
X
LV
A
ML
T
NL
D
PO
L
PR
T
RO
U
SW
E
SV
N
SV
K
GB
R
PM
2.5
an
nu
al
mea
n (
ug
/m3
)
modelledPM2.5 in urban areas
0
10
20
30
40
AU
T
BE
L
BG
R
CY
P
CZ
E
DE
U
DN
K
ES
T
ES
P
FIN
FR
A
GR
C
HU
N
IRL
ITA
LT
U
LU
X
LV
A
ML
T
NL
D
PO
L
PR
T
RO
U
SW
E
SV
N
SV
K
GB
R
PM
2.5
an
nu
al
mea
n (
ug
/m3
)
modelled observed 2007

PM2.5 workshop, Bilthoven, 23-24 April 2009, Frank de Leeuw 17
Requirements AEI reduction
10%
15%
20%
>25%

PM2.5 workshop, Bilthoven, 23-24 April 2009, Frank de Leeuw 18
Health Impact Assessment
� Premature deaths attributable to PM2.5 exposure:
� Exposed populaltion are adults > 30 year
� all causes; RR=1.06
� Lung cancer; RR= 1.13
� Cardiopulmonary diseases; RR=1.08
� Country-specific demographic data from WHO and
UN Population Division

PM2.5 workshop, Bilthoven, 23-24 April 2009, Frank de Leeuw 19

PM2.5 workshop, Bilthoven, 23-24 April 2009, Frank de Leeuw 20
Sensitivity runs
1. Compliance with LV of 25 ug/m3 (effective value
for 10x10 okm grid= 20.8 ug/m3)
2. Realizing the exposure reduction target

PM2.5 workshop, Bilthoven, 23-24 April 2009, Frank de Leeuw 21
Reducing YOLL
0
10
20
30
40
50
BG
R
HU
N
PO
L
CZ
E
RO
U
SV
K
NL
D
CY
P
GR
C
BE
L
ML
T
PR
T
ITA
LT
U
FIN
ES
P
DN
K
LV
A
GB
R
AU
T
DE
U
FR
A
ES
T
LU
X
SW
E
SV
N
NO
R
LIE
ISL
IRL
percen
tag
e
LV compliance AEI reduction target
0
10
20
30
40
50
BG
R
HU
N
PO
L
CZ
E
RO
U
SV
K
NL
D
CY
P
GR
C
BE
L
ML
T
PR
T
ITA
LT
U
FIN
ES
P
DN
K
LV
A
GB
R
AU
T
DE
U
FR
A
ES
T
LU
X
SW
E
SV
N
NO
R
LIE
ISL
IRL
percen
tag
e
LV compliance AEI reduction target
0
10
20
30
40
50
BG
R
HU
N
PO
L
CZ
E
RO
U
SV
K
NL
D
CY
P
GR
C
BE
L
ML
T
PR
T
ITA
LT
U
FIN
ES
P
DN
K
LV
A
GB
R
AU
T
DE
U
FR
A
ES
T
LU
X
SW
E
SV
N
NO
R
LIE
ISL
IRL
percen
tag
e
LV compliance AEI reduction target
PM2.5 workshop, Bilthoven, 23-24 April 2009, Frank de Leeuw 22
Conclusions
� PM2.5 network still not in place
� PM10 LV more stringent than PM2.5 LV
� last five years no trend in PM2.5
� meeting the AEI reduction target requires
reductions of 10 to more than 25%
� 456000 premature deaths attributabale to PM2.5
� meeting the PM2.5 LV will reduce YOLL with 5%
� meeting the exposure reduction target: 17%