population genetics of the honduran spiny-tailed iguana ctenosaura melanosterna
TRANSCRIPT
ENDANGERED SPECIES RESEARCHEndang Species Res
Vol. 14: 113–126, 2011doi: 10.3354/esr00342
Published online June 22
INTRODUCTION
We are in the midst of an extinction crisis, in whichbiodiversity is being lost at a rate that greatly exceedsthat of the natural rate at which species have goneextinct throughout time (e.g. Pimm et al. 1995, Myers &Knoll 2001, Wake & Vredenburg 2008). Habitat de -struction, overexploitation, pollution, invasive species,disease, and climate change are among the top threatsto biodiversity. The development and enforced protec-tion of designated areas, and programs for captivebreeding and re-introduction, are among the principalmeans by which conservation biologists combat thisloss. In principle, and given the limited amount offunding available for such conservation initiatives,
these efforts should be prioritized so as to maximizewhat is protected.
Large-scale methods of prioritizing areas in order toprotect the greatest amount of biodiversity have beendeveloped using the criteria of vulnerability and irre-placeability. These methods include the developmentof ‘biodiversity hotspots’ (Myers et al. 2000), ‘crisisecoregions’ (Hoekstra et al. 2005), ‘last of the wild’(Sanderson et al. 2002), and ‘high biodiversity wilder-ness areas’ (Mittermeier et al. 2003) (see Brooks et al.2006 for a complete review). Controversy has beenraised over these various methods of prioritization dueto confusion over their criteria, resulting in target mapsthat overlap as little as one-tenth of each other (Brookset al. 2006). In addition, these methods have been crit-
© Inter-Research 2011 · www.int-res.com*Email: [email protected]
Population genetics of the Honduran spiny-tailediguana Ctenosaura melanosterna: implications for
conservation and management
Stesha A. Pasachnik1, 2,*, Arthur C. Echternacht1, Benjamin M. Fitzpatrick1
1University of Tennessee, Department of Ecology and Evolutionary Biology, Knoxville, Tennessee 37996, USA2Bay Islands Foundation, Roatan, Bay Islands, Honduras
ABSTRACT: In conservation, difficult decisions concerning prioritization of different geographicareas must be made. Large-scale prioritization methods such as defining biodiversity hotspots andcrisis ecoregions have paved the way; however, these efforts then need to be localized. Variousapproaches have been taken, such as defining evolutionarily significant units (ESUs), managementunits, and core habitat areas within the range of a taxonomic species. These units can then be rankedas candidates for conservation, with the goal of preserving a given species by protecting only a sub-set of populations. Here we used a combination of amplified fragment length polymorphisms (AFLPs)and DNA sequence data to elucidate the relationships within and among populations of the spiny-tailed iguana Ctenosaura melanosterna throughout its range in Honduras. Our findings indicate thatthere are 2 ESUs corresponding to geographically and ecologically distinct island and mainland habi-tats. Management strategies consisting of translocation or captive breeding and release should notconsider the island and mainland populations exchangeable. In addition, the narrow geographicrange of each group suggests that no region or subpopulation is likely expendable. This studydemonstrates a situation, most likely increasingly common in conservation, in which it seems thatonly the high priority areas remain.
KEY WORDS: Evolutionarily significant unit · ESU · Conservation genetics · Prioritization · AFLPs ·BayeScan · Ctenosaura melanosterna · STRUCTURE
Resale or republication not permitted without written consent of the publisher
OPENPEN ACCESSCCESS
Endang Species Res 14: 113–126, 2011114
icized for not incorporating clear guidance on a localscale and thus for inherent weakness when applied tothe implementation of conservation actions on theground (Mace 2000, Brummitt & Lughadha 2003).
In practice, decisions regarding reserve establish-ment center around flagship or charismatic threatenedspecies (Caro et al. 2004), and a variety of socio -economic factors (Davis 2005, Stewart & Possingham2005). Even so, 2 questions should be addressed inthese cases so that funds are allocated in the mosteffective way. First, are the individuals to be protectedrepresentative of the target species, or will a givenreserve system fail to protect an irreplaceable compo-nent of the group’s evolutionary diversity? Second, arethe populations to be protected viable in the long term,or will efforts be wasted by setting aside marginal sitesthat are not likely to be self-sustaining?
To address the first question, conservation biologistshave developed concepts like distinct population seg-ments (DPSs, as defined under the US EndangeredSpecies Act [ESA]) and evolutionarily significant units(ESUs; Ryder 1986, Waples 1991, Dizon et al. 1992,Moritz 1994, Crandall et al. 2000). Protecting such vari-ation might be important for aesthetic or cultural rea-sons, but also for preserving the evolutionaryprocesses that create diversity (Ryder 1986, Waples1991, Crandall et al. 2000). Thus, focusing on intraspe-cific variation, or the preservation of multiple popula-tions, by defining these units is a vital component toconservation and management, and is critical to thelong-term persistence of a species (Hughes et al. 1997,Hobbs & Mooney 1998, Luck et al. 2003, Avise 2005).Although there is ample evidence for this, there arestill issues surrounding how to define and identifythese intraspecific units (Woinarski & Fisher 1999).
Ryder (1986) proposed that ESU status should begiven to populations that represent significant adap-tive variation based on concordance between datasets, such as natural history, distribution, and genetics,and that gene flow should be considered and pro-tected. Under the ESA, protection can be granted toDPSs; however, the definition of a DPS is unclear.Waples (1991) proposed that DPSs be equivalent toESUs, and 2 criteria were given: populations must havebeen reproductively isolated and must be adaptivelydistinct, thus representing distinct components of an‘evolutionary legacy.’
In 1994, another framework was proposed, whichstated that populations must be reciprocally mono-phyletic for mtDNA and show significant divergence atnuclear loci in order to be given ESU status (Moritz1994, Moritz & Cicero 2004). This approach focuses onputatively neutral loci and thus ignores adaptive dif-ferences in favor of protecting history. Under thisframework, small populations that have been greatly
affected by a bottleneck, for example, might be theones that are given ESU status. In addition, the evolu-tionary process will not necessarily be protected be -cause of the explicit focus on phylogeographic historyrather than local adaptation and gene flow. Similarly,groups that have gone through rapid diversificationwill not necessarily be given the chance to persist inde-pendently under this framework.
Crandall et al. (2000) proposed criteria for ESUs thatfocus on genetic and ecological exchangeability in thepast and present, emphasizing a continuum of possibil-ities. ESU status comes from rejecting exchangeability,but there is a continuum of management recommenda-tions depending on the combination of ecological andgenetic outcomes in both a historical and recent setting.A difficulty with this concept is that ecological ex-changeability is rarely testable by direct experimenta-tion. However, this framework does focus on adaptivedifferences and evolutionary potential, and acknowl-edges the importance of gene flow in management.
A common problem in defining ESUs is that too fewor too many populations receive status, which is due inpart to the variety of definitions. Waples (2006)reviewed the various definitions in the context ofPacific salmon Oncorhynchus spp. (Salmonidae). Heconcluded that they are problematic, as his reviewresulted in either one or hundreds of ESUs, dependingon the criteria used. Thus, he called for additional stud-ies using empirical data. The subjectivity of the differ-ent definitions is problematic, but identifying what islikely to be lost versus maintained, and evaluatingalternative management strategies must be the overallgoals of conservation science.
The objective of our research was to understand thegenetic structure of the spiny-tailed iguana Ctenosauramelanosterna, including potentially adaptive differ-ences, within and among its remaining populations,which are subject to varying levels of protection. Weused mtDNA and amplified fragment length polymor-phism (AFLP) data to test whether populations aregenetically exchangeable and evaluated whetherthere is evidence of recent demographic instability(which might imply problems with population viabilityover and above the overt anthropogenic threats; Finnet al. 2009).
MATERIALS AND METHODS
Study system. Ctenosaura melanosterna is a medium-sized spiny-tailed iguana (200 to 350 mm snout–ventlength, SVL) that is primarily herbivorous thoughopportunistically carnivorous in some life stages (Köh-ler 2003, Gutsche 2005, McCranie et al. 2005). Thespecies is endemic to Honduras and occurs within
Pasachnik et al.: Population genetics of Ctenosaura melanosterna 115
approximately 1316 km2 of arid tropical scrub forest inthe Valle de Aguán (north-central mainland) and on 2islands of the Cayos Cochinos Archipelago (CayoPequeño and Cayo Grande). It therefore occurs in theCentral American biodiversity hotspot described byMyers et al. (2000) and in a crisis ecoregion asdescribed by Hoekstra et al. (2005). Buckley & Axtell(1997) described C. melanosterna on the basis of mor-phology and geography. The population in the Vallede Aguán was first noted in 1966 and assigned toEnyaliosaurus palearis (Echternacht 1968).
The island and mainland populations of this speciesare separately listed as Critically Endangered by theIUCN Red List Assessment of 2011 (S. A. Pasachnikunpubl. data) based on limited geographic range,increased habitat fragmentation and destruction, andover-harvesting of adults and eggs. Wilson &McCranie (2004) declared Ctenosaura mela nosternaone of the top 4 most ecologically vulnerable species inHonduras. This species has also been accepted forCITES Appendix II listing due to the threats posed bythe international pet trade and its similarity to C.palearis. Considerable variation exists however, be -tween, and in some cases within, the mainland and theisland regions in terms of threats and protection.
The 2 islands of the Cayos Cochinos Archipelago arewithin the Cayos Cochinos Natural Marine Reserveadministered by the Honduran Coral Reef Foundation(HCRF). Although both islands are technically pro-tected, Cayo Pequeño gains additional protectionthrough the presence of the HCRF research station.Cayo Grande has a small village and tourist resort on itand thus has increased threats due primarily to har-vesting and feral dogs and cats (S. A. Pasachnik pers.obs., C. E. Montgomery pers. comm.). The populationson the mainland have little to no local protection and ahigher threat level. A population of Ctenosauramelanosterna occurs within Pico Bonito National Parkin the Valle de Aguán; however, this population is notafforded much protection due to a lack of policing inthe area. In addition, the populations in the Valle deAguán as a whole are threatened by large-scale habi-tat destruction and fragmentation, feral dogs and cats,and harvesting of adults and eggs. Harvesting isgreatly increased in this area due to a festival that cel-ebrates the consumption of this species.
Given the extreme nature of the threats to the Vallede Aguán populations, it will be difficult forCtenosaura melanosterna to persist if the current ratesof habitat destruction and consumption continue. In-creasing the level of protection on the mainland will beno easy task. Thus, understanding the urgency of thisaction is important. Protection is already in place for theCayos Cochinos populations (although it does vary be-tween islands). Thus the question becomes, is the
species adequately conserved if the Valle de Aguánpopulation is allowed to go extinct and C. melanosternapersists only on the Cayos Cochinos? If iguanas in the 2regions are genetically distinct and locally adapted, thislack of exchangeability supports the need for increasedprotection of the Valle de Aguán populations.
As part of an ongoing project characterizing the distribution of Ctenosaura melanosterna within theValle de Aguán, the habitat has been surveyed for a va-riety of characteristics (S. A. Pasachnik unpubl. data).The dominant tree species is Acacia riparia (Legumi-nosae). Other abundant plants in the region includeOpuntia sp., Stenocereus sp. (Cactaceae), and to alesser extent Hematoxylum brasileto (Caesalpini-aceae), all of which are eaten by C. melanosterna. Theaverage height among sites of the maximum emergenttree is 12 m, and the average height of the canopy is5 m. Deforestation as well as soil and water contamina-tion is very high in these areas due to local agriculturalactivity associated with cattle farming and the presenceof a large Dole fruit plantation (S. A. Pasachnik unpubl.data; for photos, see Fig. 1, and Fig. S1 in the supple-ment at www.int-res.com/articles/suppl/n014p113.pdf).
Bermingham et al. (1998) conducted a survey of CayosCochinos Pequeño over a 4 d visit in 1995. During thistime, a preliminary inventory of the flora and a charac-terization of the different vegetation types were con-ducted. The dominant vegetation type found was ever-green oak forest, which was estimated to coverapproximately 50% of the island and be made up ofat least 90% Quercus cf. oleoides (Fagaceae). The understory in these forests is made up of Calliandra(Fabaceae-Mimosoideae), Connarus (Connaraceae), Alibertia edulis (Rubiaceae), Cupania (Sapindaceae),and Ouratea (Ochnaceae) (Bermingham et al. 1998).Most of the oak trees are slow growing and several hun-dred years old, ranging from 5 to 10 m in the windier ar-eas of the island to 35 m tall along some of the ridges.Most have hollow tree trunks, which are optimal retreatsites for iguanas. Mature mixed forests also occur tosome degree on the island, where few oak trees arefound and the canopy consists mostly of evergreensranging from 30 to 35 m tall. Palms are scatteredthroughout the island and on the 3 main beaches. Buttonmangrove Conocarpus erectus (Combretaceae) andmangrove fern Acrostichum aureum (Adiantaceae) canalso be found in a small marsh area on the island(Bermingham et al. 1998; see the supplement to the pre-sent paper for general habitat photos). Although this sur-vey was only conducted on Cayos Cochinos Pequeño,the islands are ecologically extremely similar (Wilson &Cruz Diaz 1993; S. A. Pasachnik pers. obs., C. E. Mont-gomery pers. comm.).
There is little to no overlap in the vegetation of these2 geographic isolates of Ctenosaura melanosterna.

Endang Species Res 14: 113–126, 2011
Cayos Cochinos is dominated by evergreen oak forest,whereas Acacia and cacti dominate the Valle deAguán. Given that there is little to no overlap in vege-tation, it is clear that individuals from each populationhave different diets. Likewise there are expected dif-ferences in reproductive biology, as the different habi-tats afford different soil types and occur in areas ofhighly different weather patterns (S. A. Pasachnikpers. obs.); thus the egg deposition, clutch size, andtiming of reproduction most likely vary (Colli 1991,Gillis & Ballinger 1991, Iverson et al. 1993, Jenkins etal. 2009). In addition to ecological differences, thegeography of the area clearly shows that the mainlandand island populations are not only separated by anexpanse of land but also by the Caribbean Sea (sepa-rating the islands from the mainland 8000 to 9000 yearsago; see Toscano & Macintyre 2003 for sea levelcurves). Thus, current gene flow between these areasis extremely unlikely.
Field collection. DNA samples were collected fromindividuals across the geographic range of Ctenosauramelanosterna within the Valle de Aguán and CayosCochinos in Honduras over a 5 yr period from 2004 to2009 (Fig. 1). The exact locations of these individualsare not recorded herein, as the 2 geographic isolates of
this species are Critically Endangered and listed underCITES Appendix II due to the threats they face fromthe international pet trade. Additional informationconcerning this topic may be requested from theauthors.
Upon capture, a digital photograph was taken andSVL, tail length, sex, and weight were recorded. Inaddition, each individual was given a unique mark,with bead tags and paint, to avoid re-sampling. Eithera 1 cm section of the tail tip was removed and stored in100% ethanol, or a 0.5 ml sample of blood was drawnfrom the caudal vein and stored in an EDTA buffer(Longmire et al. 1992) for molecular analysis. Differentsampling techniques were used depending on whenthe sample was collected; earlier samples were takenfrom the tail tip as blood-drawing techniques wereperfected. For individuals from which a tissue samplewas taken, the area was disinfected with ethanol priorto removal, and pressure was applied to the wounduntil bleeding ceased, and the area was sealed with atopical skin adhesive to prevent infection. For individ-uals from which a blood sample was taken, the areaaround the puncture site was disinfected with ethanolbefore the blood was drawn and was sealed with a top-ical adhesive after blood had been drawn.
116
Fig. 1. Ctenosaura melanosterna. Distribution of the Honduran spiny-tailed iguana in the Valle de Aguán and Cayos Cochinos(Pequeño Grande), Honduras. Top photo: typical beach habitat of Cayos Cochinos including numerous palms (credit: C.E.
Montgomery). Bottom photo: typical habitat in the Valle de Aguán with a cactus in the foreground (credit: J. Corneil)

Pasachnik et al.: Population genetics of Ctenosaura melanosterna
DNA sequencing. Genomic DNA was extracted us-ing the Qiagen DNeasy extraction kit. The polymerasechain reaction (PCR) was used to amplify portions of 2mitochondrial markers, 674 bp of NADH dehydroge-nase subunit 4 and 1067 bp of cytochrome oxidase B(CytB). For primer sequences and PCR procedures, seePasachnik et al. (2009). PCR products were verified bygel electrophoresis, and successful amplicons were pu-rified using exonuclease I/shrimp alkaline phospha -tase (ExoSAP). Sequencing reactions were performedusing the PCR primers and were aligned using Se-quencher 4.6 (Gene Code Corporation). Ambiguousbase calls were verified manually by examining theforward and reverse electropherogram reads. Se-quences were aligned with published Ctenosaura andsequences from GenBank (e.g. accession numbersAF217774, U66227, EU246733, AF020252, AF020254)using MacClade 4.07 (Maddison & Maddison 2005).We assayed 81 individuals for the 2 mitochondrialmarkers. C. palearis was used as the outgroup. All sequences were submitted to Genbank and depo -sited under GenBank accession numbers GU331986–GU331993, GU332005–GU332012, and GU906223.
Mitochondrial DNA analysis. The 2 mtDNA lociwere combined to estimate a mitochondrial genealogyusing a Bayesian and maximum likelihood (ML)approach. Bayesian posterior probabilities were esti-mated using MrBayes 3.1 (Ronquist & Huelsenbeck2003) with 4 Markov chains, the temperature profile atthe default setting of 0.2, run for 2 million generations,and sampling every 100th generation with a finalburn-in of 10 000 generations. ML analysis was con-ducted in PAUP* 4.0 (Swofford 2002) using a heuristicsearch with 1000 random-taxon-addition replicates.Confidence at each node was assessed using nonpara-metric bootstrapping (Felsenstein 1985) based on 1000pseudo-replicates with 10 random-taxon-additionreplicates per pseudo-replicate. The optimal model ofsequence evolution for each locus was determinedin Modeltest 3.7 (Posada & Crandall 1998). We usedSplits Tree 4.10 to estimate unrooted networks usingparsimony, neighbor-joining, and minimum spanningnetworks. All yielded the same topology, which wascongruent with the ML gene tree.
Using the program Arlequin version 3.11 (Excoffieret al. 2005) we tested various hypotheses of geneticstructuring by running analyses of molecular variance(AMOVAs) based on a priori groupings created byconsidering geographic barriers. The first groupingtested considered the 2 island populations together,the north side of the Rio Aguán, and the south side ofthe Rio Aguán as 3 separate groups. The second testedthe islands individually as well as the north and southside of the river, giving 4 different groups. We thenused the program SAMOVA version 1.0 (spatial analy-
sis of molecular variation, Dupanloup et al. 2002) toexplore the population structuring without the use ofany a priori groups. This method assigns sampling sitesor populations to groups based on geographic proxim-ity and genetic homogeneity through a simulatedannealing procedure. The number of groups must bespecified for each run. Since we sampled 12 locationswe assessed each number of groups (K) ranging from 2to 11 with 100 simulated annealing simulations. Byexploring different numbers of groups, the most likelygroups could be determined based on the resultingF statistics (Dupanloup et al. 2002), which are calcu-lated using an AMOVA approach (Excoffier et al.1992). Once these groups were chosen, we used thesame groupings in Arlequin to estimate p values rela-tive to 10 000 randomizations.
Demographic statistics. To evaluate the possibilitythat populations have recently experienced largedemographic changes, we followed Finn et al. (2009) intesting the mtDNA data for deviations from mutation-drift equilibrium using standard test statistics in DnaSP(Rozas et al. 2003). We used the results from SAMOVA,AMOVA, and a priori groups based on geography todetermine how to define populations. Since there wassome variation in these results, we report on the CayosCochinos islands together and separately, and theAguán Valley populations together and then groupedby the north and south sides of the Rio Aguán.
The demographic statistics used include: meanabsolute error (MAE), raggedness, Fu’s FS, Tajima’sD*, Fu and Li’s D, and the growth statistic (R2) ofRamos-Onsins and Rozas (Finn et al. 2009). MAEreflects the differences between the observed mis-match distribution and the theoretical mismatch distri-butions under demographic expansion (for example,following a severe bottleneck). Thus MAE decreasesas the probability of expansion increases (Rogers et al.1996). Raggedness describes the smoothness of theobserved pairwise difference distribution and isexpected to decrease with expansion, which increasessmoothness (Harpending 1994). Fu’s (1997) FS com-pares observed and expected haplotype frequencies(using the Ewens 1972 model, which assumes migra-tion drift equilibrium and neutral mutation). Negativevalues, indicating a low probability of the observedpopulation having as many haplotypes as the Ewenssimulation, are expected with population expansion.Tajima’s D compares the number of segregating sitesand nucleotide diversity to test the hypothesis that allmutations are neutral. Values are negative under pop-ulation expansion. Fu & Li’s (1993) D* is similar toTajima’s D but computes the number of singletons inthe external branches and is expected to be negativewith population expansion. The R2 statistic of Ramos-Onsins & Rozas (2002) also accounts for singletons and
117
has higher values with population expansion. This R2statistic is more powerful for small populations,whereas Fu’s FS is most powerful when the populationis large. For all demographic statistics, except MAE, p-values were estimated using 1000 coalescent replicatesimulations, where the observed number of segregat-ing sites was held constant and no recombination wasallowed. In addition, p-values for Tajima’s D and Fuand Li’s D* were generated from the original test ofthe data.
We then categorized each group using these 6 demo-graphic statistics. The possible categories of demo-graphic stability ranged from 1 to 5; 1 represents amonomorphic group inferred to be resultant of a recentfounder effect or extreme bottleneck, 2 represents arecent strong bottleneck inferred from all statisticsbeing significantly high, 3 represents a historic bottle-neck inferred from some statistics being significantlyhigh, 4 represents a long-term demographic stabilityinferred from no significant result, and 5 represents along-term growth signature inferred from some statis-tics being significantly low (Finn et al. 2009).
While deviations from mutation-drift equilibriummight indicate demographic instability (and therefore,lower conservation value), they might also be causedby natural selection or population structure, and thesealternatives cannot be distinguished when only a sin-gle marker is tested (Misawa & Tajima 1997, Tajima1997). In addition, category 4 (‘long-term stability’) isbased on failure to reject a null hypothesis and istherefore inherently weak.
Nuclear data analysis. AFLP markers were obtainedfollowing the general procedure described by Vos etal. (1995), using 4 different selective primers (Fitz-patrick et al. 2008). The presence or absence of frag-ments was determined by running fluorescentlylabeled PCR product in an ABI 3100 sequencer at theUniversity of Tennessee’s sequencing facility. Peakswere aligned and called in both Genescan® AnalysisSoftware (Applied Biosystems) and Peak ScannerTM
Software v1.0 (Applied Biosystems), and then verifiedthrough visual inspection of each chromatogram. Acomplete technical replicate, from restriction-ligationthrough selective PCR, was performed for each indi-vidual by multiplexing with 2 different coloredprimers. Only those sites and individuals that showedthe same pattern with both color primers were used inthis analysis.
To evaluate population structure without a prioriassumptions of groups, we used the clustering Markovchain Monte Carlo (MCMC) algorithm in STRUCTURE2.2 (Pritchard et al. 2000, Falush et al. 2007). To inferthe number of genetic clusters (K) best supported bythe data, we used both the approximate posterior prob-abilities (Pritchard et al. 2000), and delta K method
(Evanno et al. 2005). For each K from 1 to 8, we ran theMCMC 10 independent times with 10 000 burn-in gen-erations and 100 000 sampling generations. Due toinconsistency in missing data between primers, thedata from each primer were evaluated separately. Allindividuals with any missing data were then removedand the analysis was repeated, such that 51 individualswere included. Lastly, we removed the loci that werethought to be affected by selection, as discussed below,and repeated the analysis.
To directly address the question of island–mainlanddifferentiation, we estimated multi-locus FST (propor-tion of genetic variation between populations andgroups overall) using the program AFLP-SURV 1.0(Vekemans 2002) and screened for individual outliermarkers using Baye Scan (Foll & Gaggiotti 2008).BayeScan uses posterior probability estimates to eva -luate hierarchical models in which individual loci orpopulations are allowed to contribute differentially tothe overall FST. AFLP markers linked to loci contri -buting to differential local adaptation between islandand mainland habitats are expected to show greaterthan average FST if there is ongoing gene flow or if isolation is recent (such that mutation and drift havenot yet maximized FST for most markers). Becausewe were concerned with rigorously evaluating the possibility of local adaptation rather than identifyingor counting candidate loci, we used a high threshold (Pr{αi ≠ 0 | data} > 0.99), where α is the locus-specificcontribution to the global FST, for accepting evidence ofdivergent selection. This is expected to produce a highfalse negative rate for AFLPs if the underlying model iscorrect (Foll & Gaggiotti 2008). However, unrecognizedpopulation structure (Excoffier et al. 2009) or deviationsfrom the assumed mutation process for AFLPs might in-crease the false positive rate. No estimate of false posi-tive rate for a situation such as the one described hereinexists (Foll & Gaggiotti 2008); however, the number ofcandidate loci in the most extreme bin (posterior proba-bility > 0.99) is greater than the number with posteriorprobability between 0.95 and 0.99. This is not expectedif only false positives are being identified.
RESULTS
Mitochondrial DNA analysis
The results from the gene tree analysis, AMOVA,and SAMOVA all show support for genetic structureseparating the island populations from the mainlandpopulations, a separation between the populations onthe north and south side of the Rio Aguán, and a possi-ble separation between the 2 island populations. Thisindicates that the island populations have been pre-
Endang Species Res 14: 113–126, 2011118
Pasachnik et al.: Population genetics of Ctenosaura melanosterna
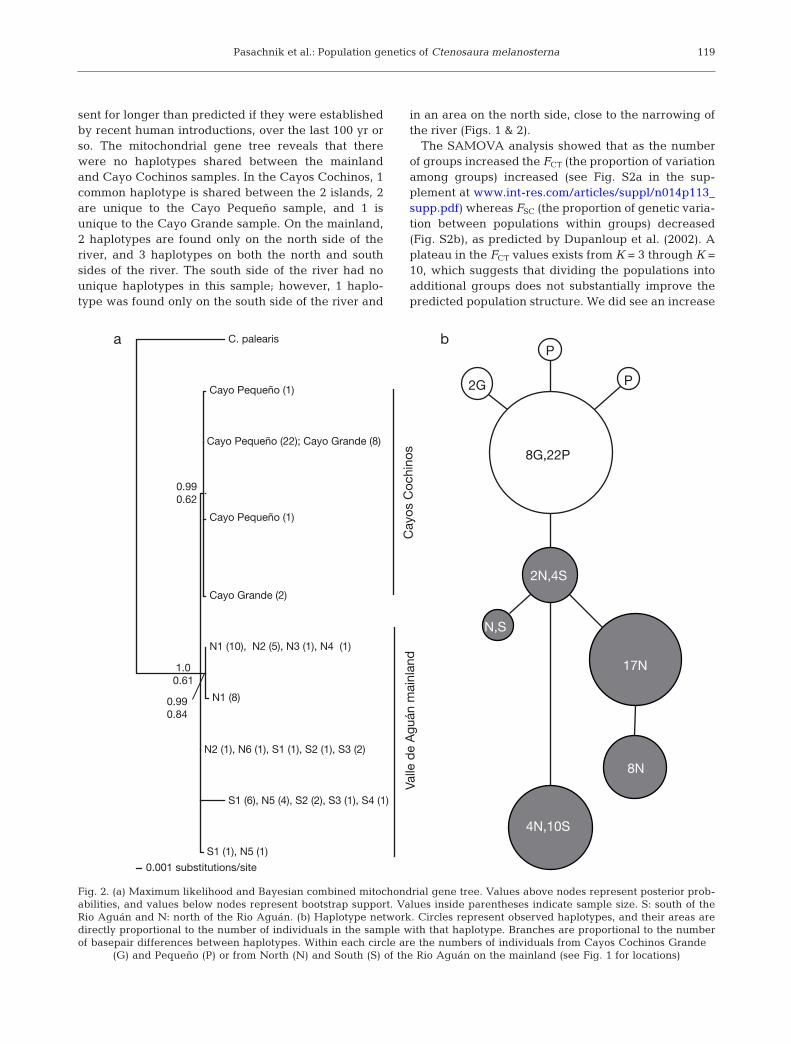
sent for longer than predicted if they were establishedby recent human introductions, over the last 100 yr orso. The mitochondrial gene tree reveals that therewere no haplotypes shared between the mainlandand Cayo Cochinos samples. In the Cayos Cochinos, 1common haplotype is shared between the 2 islands, 2are unique to the Cayo Pequeño sample, and 1 isunique to the Cayo Grande sample. On the mainland,2 haplotypes are found only on the north side of theriver, and 3 haplotypes on both the north and southsides of the river. The south side of the river had nounique haplotypes in this sample; however, 1 haplo-type was found only on the south side of the river and
in an area on the north side, close to the narrowing ofthe river (Figs. 1 & 2).
The SAMOVA analysis showed that as the numberof groups increased the FCT (the proportion of variationamong groups) increased (see Fig. S2a in the sup -plement at www.int-res.com/articles/suppl/ n014p113_supp.pdf) whereas FSC (the proportion of genetic varia-tion between populations within groups) decreased(Fig. S2b), as predicted by Dupanloup et al. (2002). Aplateau in the FCT values exists from K = 3 through K =10, which suggests that dividing the populations intoadditional groups does not substantially improve thepredicted population structure. We did see an increase
119
C. palearis
Cayo Pequeño (1)
Cayo Pequeño (22); Cayo Grande (8)
Cayo Pequeño (1)
Cayo Grande (2)
N1 (10), N2 (5), N3 (1), N4 (1)
N1 (8)
N2 (1), N6 (1), S1 (1), S2 (1), S3 (2)
S1 (6), N5 (4), S2 (2), S3 (1), S4 (1)
S1 (1), N5 (1)
0.001 substitutions/site
1.0
0.61
0.99
0.62
0.99
0.84
Cayo
s C
ochin
os
Valle
de A
guán m
ain
land
a b
P
P
2G
8G,22P
2N,4S
N,S
17N
8N
4N,10S
Fig. 2. (a) Maximum likelihood and Bayesian combined mitochondrial gene tree. Values above nodes represent posterior prob-abilities, and values below nodes represent bootstrap support. Values inside parentheses indicate sample size. S: south of theRio Aguán and N: north of the Rio Aguán. (b) Haplotype network. Circles represent observed haplotypes, and their areas aredirectly proportional to the number of individuals in the sample with that haplotype. Branches are proportional to the numberof basepair differences between haplotypes. Within each circle are the numbers of individuals from Cayos Cochinos Grande
(G) and Pequeño (P) or from North (N) and South (S) of the Rio Aguán on the mainland (see Fig. 1 for locations)
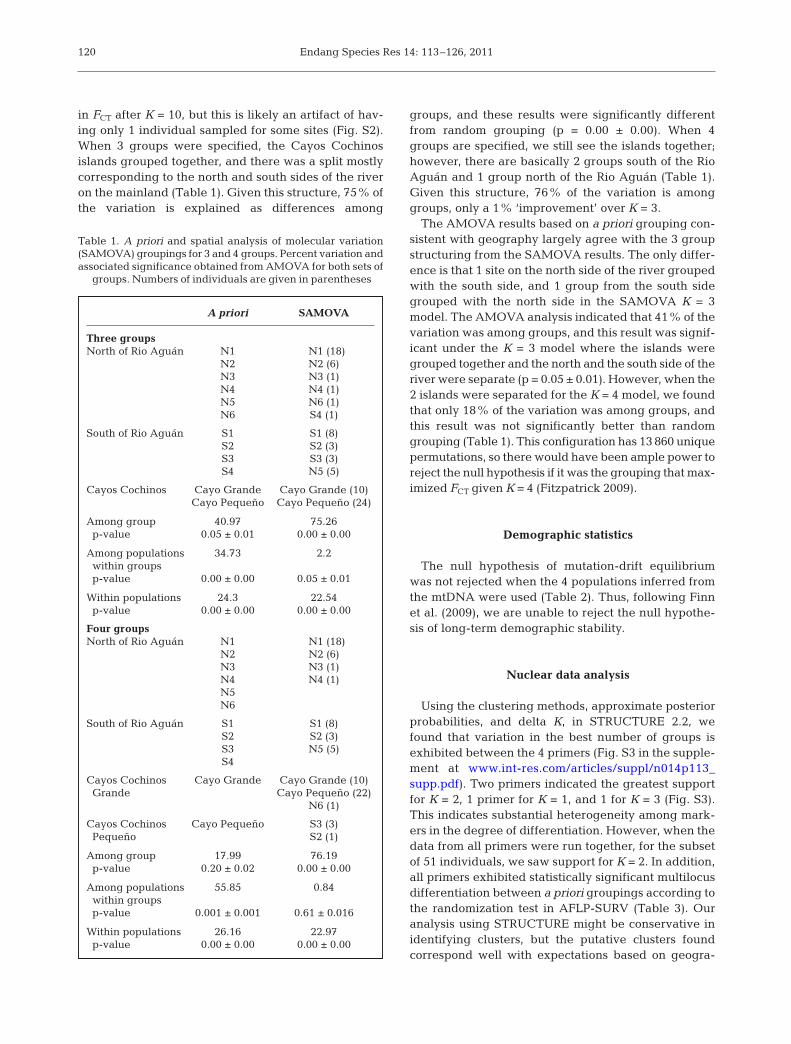
in FCT after K = 10, but this is likely an artifact of hav-ing only 1 individual sampled for some sites (Fig. S2).When 3 groups were specified, the Cayos Cochinosislands grouped together, and there was a split mostlycorresponding to the north and south sides of the riveron the mainland (Table 1). Given this structure, 75% ofthe variation is explained as differences among
groups, and these results were significantly differentfrom random grouping (p = 0.00 ± 0.00). When 4groups are specified, we still see the islands together;however, there are basically 2 groups south of the RioAguán and 1 group north of the Rio Aguán (Table 1).Given this structure, 76% of the variation is amonggroups, only a 1% ‘improvement’ over K = 3.
The AMOVA results based on a priori grouping con-sistent with geography largely agree with the 3 groupstructuring from the SAMOVA results. The only differ-ence is that 1 site on the north side of the river groupedwith the south side, and 1 group from the south sidegrouped with the north side in the SAMOVA K = 3model. The AMOVA analysis indicated that 41% of thevariation was among groups, and this result was signif-icant under the K = 3 model where the islands weregrouped together and the north and the south side of theriver were separate (p = 0.05 ± 0.01). However, when the2 islands were separated for the K = 4 model, we foundthat only 18% of the variation was among groups, andthis result was not significantly better than randomgrouping (Table 1). This configuration has 13 860 uniquepermutations, so there would have been ample power toreject the null hypothesis if it was the grouping that max-imized FCT given K = 4 (Fitzpatrick 2009).
Demographic statistics
The null hypothesis of mutation-drift equilibriumwas not rejected when the 4 populations inferred fromthe mtDNA were used (Table 2). Thus, following Finnet al. (2009), we are unable to reject the null hypothe-sis of long-term demographic stability.
Nuclear data analysis
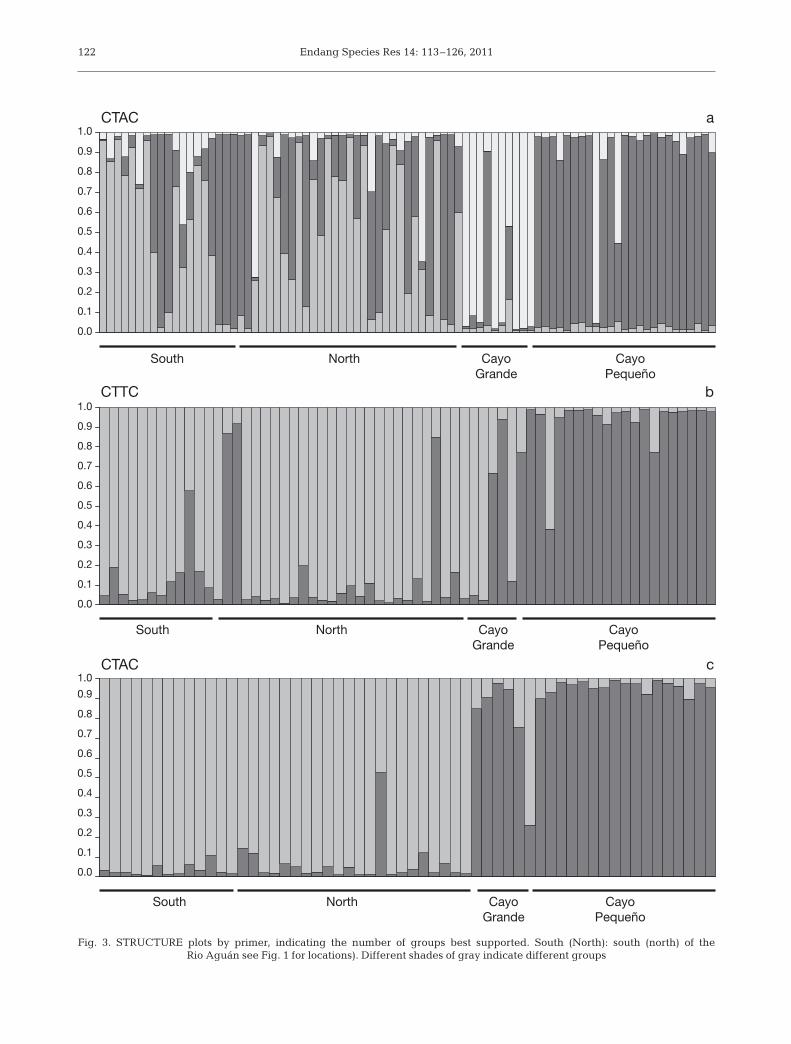
Using the clustering methods, approximate posteriorprobabilities, and delta K, in STRUCTURE 2.2, wefound that variation in the best number of groups isexhibited between the 4 primers (Fig. S3 in the supple-ment at www.int-res.com/articles/suppl/n014p113_supp.pdf). Two primers indicated the greatest supportfor K = 2, 1 primer for K = 1, and 1 for K = 3 (Fig. S3).This indicates substantial heterogeneity among mark-ers in the degree of differentiation. However, when thedata from all primers were run together, for the subsetof 51 individuals, we saw support for K = 2. In addition,all primers exhibited statistically significant multilocusdifferentiation between a priori groupings according tothe randomization test in AFLP-SURV (Table 3). Ouranalysis using STRUCTURE might be conservative inidentifying clusters, but the putative clusters foundcorrespond well with expectations based on geogra-
Endang Species Res 14: 113–126, 2011120
A priori SAMOVA
Three groupsNorth of Rio Aguán N1 N1 (18)
N2 N2 (6)N3 N3 (1)N4 N4 (1)N5 N6 (1)N6 S4 (1)
South of Rio Aguán S1 S1 (8)S2 S2 (3)S3 S3 (3)S4 N5 (5)
Cayos Cochinos Cayo Grande Cayo Grande (10)Cayo Pequeño Cayo Pequeño (24)
Among group 40.97 75.26p-value 0.05 ± 0.01 0.00 ± 0.00
Among populations 34.73 2.2within groupsp-value 0.00 ± 0.00 0.05 ± 0.01
Within populations 24.3 22.54p-value 0.00 ± 0.00 0.00 ± 0.00
Four groupsNorth of Rio Aguán N1 N1 (18)
N2 N2 (6)N3 N3 (1)N4 N4 (1)N5N6
South of Rio Aguán S1 S1 (8)S2 S2 (3)S3 N5 (5)S4
Cayos Cochinos Cayo Grande Cayo Grande (10)Grande Cayo Pequeño (22)
N6 (1)
Cayos Cochinos Cayo Pequeño S3 (3)Pequeño S2 (1)
Among group 17.99 76.19p-value 0.20 ± 0.02 0.00 ± 0.00
Among populations 55.85 0.84within groupsp-value 0.001 ± 0.001 0.61 ± 0.016
Within populations 26.16 22.97p-value 0.00 ± 0.00 0.00 ± 0.00
Table 1. A priori and spatial analysis of molecular variation(SAMOVA) groupings for 3 and 4 groups. Percent variation andassociated significance obtained from AMOVA for both sets of
groups. Numbers of individuals are given in parentheses
Pasachnik et al.: Population genetics of Ctenosaura melanosterna
phy and mtDNA. When 3 groups were supported, the<mainland and each island population were separate(Fig. 3a). When 2 groups were supported, a split wasevident between Cayos Cochinos and the mainlandpopulations (Fig. 3b,c).
Using AFLP-SURV 1.0 (Vekemans 2002), we esti-mated multi-locus FST in order to address differentia-tion between various populations, specifically toanswer the question of mainland–island differentia-tion. All 4 primers showed significant FST values at
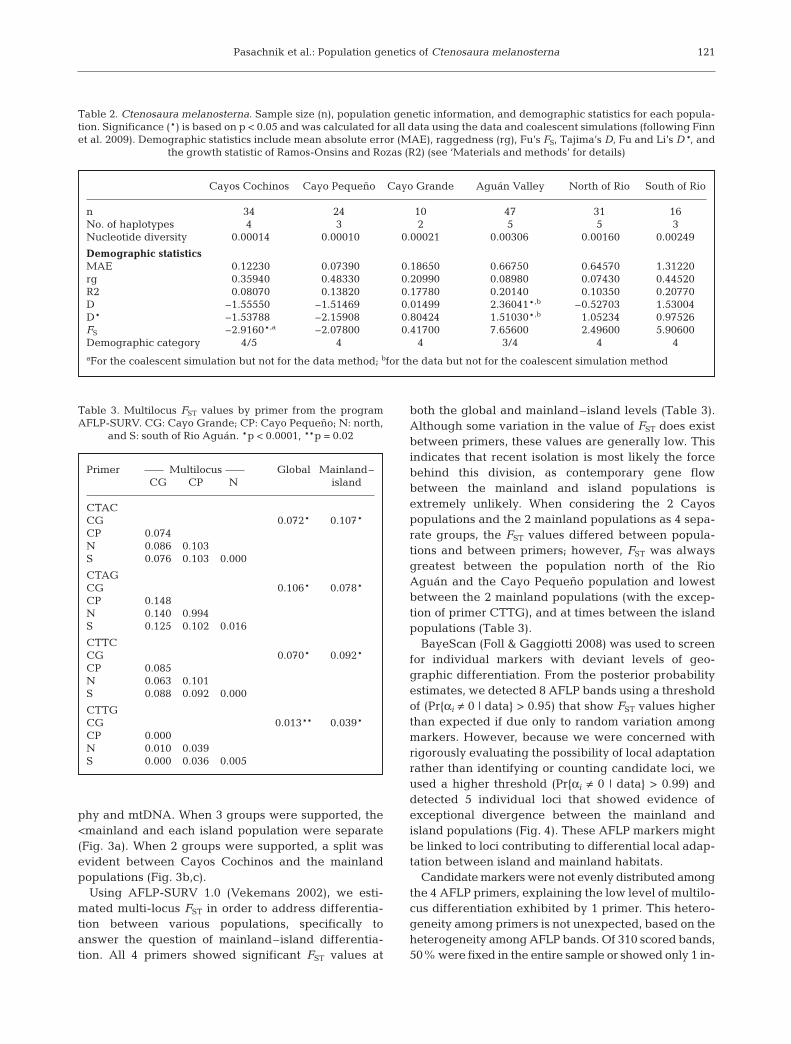
both the global and mainland–island levels (Table 3).Although some variation in the value of FST does existbetween primers, these values are generally low. Thisindicates that recent isolation is most likely the forcebehind this division, as contemporary gene flowbetween the mainland and island populations isextremely unlikely. When considering the 2 Cayospopulations and the 2 mainland populations as 4 sepa-rate groups, the FST values differed between popula-tions and between primers; however, FST was alwaysgreatest between the population north of the RioAguán and the Cayo Pequeño population and lowestbetween the 2 mainland populations (with the excep-tion of primer CTTG), and at times between the islandpopulations (Table 3).
BayeScan (Foll & Gaggiotti 2008) was used to screenfor individual markers with deviant levels of geo-graphic differentiation. From the posterior probabilityestimates, we detected 8 AFLP bands using a thresholdof (Pr{αi ≠ 0 | data} > 0.95) that show FST values higherthan expected if due only to random variation amongmarkers. However, because we were concerned withrigorously evaluating the possibility of local adaptationrather than identifying or counting candidate loci, weused a higher threshold (Pr{αi ≠ 0 | data} > 0.99) anddetected 5 individual loci that showed evidence ofexceptional divergence between the mainland andisland populations (Fig. 4). These AFLP markers mightbe linked to loci contributing to differential local adap-tation between island and mainland habitats.
Candidate markers were not evenly distributed amongthe 4 AFLP primers, explaining the low level of multilo-cus differentiation exhibited by 1 primer. This hetero-geneity among primers is not unexpected, based on theheterogeneity among AFLP bands. Of 310 scored bands,50% were fixed in the entire sample or showed only 1 in-
121
Cayos Cochinos Cayo Pequeño Cayo Grande Aguán Valley North of Rio South of Rio
n 34 24 10 47 31 16No. of haplotypes 4 3 2 5 5 3Nucleotide diversity 0.00014 0.00010 0.00021 0.00306 0.00160 0.00249
Demographic statisticsMAE 0.12230 0.07390 0.18650 0.66750 0.64570 1.31220rg 0.35940 0.48330 0.20990 0.08980 0.07430 0.44520R2 0.08070 0.13820 0.17780 0.20140 0.10350 0.20770D –1.55550 –1.51469 0.01499 2.36041*,b –0.52703 1.53004D* –1.53788 –2.15908 0.80424 1.51030*,b 1.05234 0.97526FS –2.9160*,a –2.07800 0.41700 7.65600 2.49600 5.90600Demographic category 4/5 4 4 3/4 4 4aFor the coalescent simulation but not for the data method; bfor the data but not for the coalescent simulation method
Table 2. Ctenosaura melanosterna. Sample size (n), population genetic information, and demographic statistics for each popula-tion. Significance (*) is based on p < 0.05 and was calculated for all data using the data and coalescent simulations (following Finnet al. 2009). Demographic statistics include mean absolute error (MAE), raggedness (rg), Fu’s FS, Tajima’s D, Fu and Li’s D*, and
the growth statistic of Ramos-Onsins and Rozas (R2) (see ‘Materials and methods’ for details)
Primer Multilocus Global Mainland–CG CP N island
CTACCG 0.072* 0.107*CP 0.074N 0.086 0.103S 0.076 0.103 0.000
CTAGCG 0.106* 0.078*CP 0.148N 0.140 0.994S 0.125 0.102 0.016
CTTCCG 0.070* 0.092*CP 0.085N 0.063 0.101S 0.088 0.092 0.000
CTTGCG 0.013** 0.039*CP 0.000N 0.010 0.039S 0.000 0.036 0.005
Table 3. Multilocus FST values by primer from the programAFLP-SURV. CG: Cayo Grande; CP: Cayo Pequeño; N: north,
and S: south of Rio Aguán. *p < 0.0001, **p = 0.02
Endang Species Res 14: 113–126, 2011122
0.0
0.1
0.2
0.3
0.4
0.5
0.6
0.7
0.8
0.9
1.0
CTAC
South North Cayo
Grande
Cayo
Pequeño
South North Cayo
Grande
Cayo
Pequeño
CTTC
0.0
0.1
0.2
0.3
0.4
0.5
0.6
0.7
0.8
0.9
1.0
0.0
0.1
0.2
0.3
0.4
0.5
0.6
0.7
0.8
0.9
South North Cayo
Grande
Cayo
Pequeño
CTAC
a
b
c1.0
Fig. 3. STRUCTURE plots by primer, indicating the number of groups best supported. South (North): south (north) of theRio Aguán see Fig. 1 for locations). Different shades of gray indicate different groups

dividual iguana without the majority phenotype, andonly a minority of variable bands were highly differenti-ated among groups. However, even when we removedthe 8 loci that are seemingly associated with selection,we still saw support for the island–mainland separation(K = 2) in the STRUCTURE analysis.
DISCUSSION
Four concordant lines of data demonstrate that 2separate ESUs should be considered within Cteno -saura melanosterna. The results from both themtDNA and AFLP analyses show support for a splitbetween the populations in the Valle de Aguán andCayos Cochinos. Further, the AFLP data indicatepossible adaptive differentiation between the 2groups (Fig. 4), consistent with the strong contrastbetween the xeric, Acacia-dominated habitat of theValle de Aguán and the more mesic oak forests ofthe Cayos Cochinos. Additional management unitswithin these ESUs may be appropriate; some datasupport differentiation between the 2 islands oracross the Rio Aguán, although these patterns needto be verified by additional data. What seems clearis that the relatively protected population of C.melanosterna on Cayo Pequeño is not representativeof (or exchangeable with) the mainland form, andtherefore, an irreplaceable element of biodiversitywould be lost if the Valle de Aguán population wereallowed to go extinct.
Island and mainland ESUs
The gene tree analysis of the mtDNA data clearlydemonstrates a division between the island popula-tions and the mainland populations, as none of theobserved haplotypes was found in both general loca-tions (Fig. 2). The AMOVA and SAMOVA analysesalso showed support for this separation, with the addi-tion of a separation between the mainland populationsfound on the south side of the Rio Aguán and thosefound to the north (Table 1). The AFLP data are con-cordant with the principal separation of Cayos Cochi-nos from the mainland; however, instead of showingsupport for an additional mainland separation, some ofthese data show support for separating Cayo Grandefrom Cayo Pequeño (Fig. 3, Table 3).
Understanding the structure, and thus defining theunits and prioritizing those units, is vital to both aproactive and reactive conservation program (Brookset al. 2006). One of the most commonly used andappropriate ways to classify groups of organisms forconservation is into ESUs, which are supported as‘species’ or DPSs by the ESA. A variety of ways todefine ESUs have been developed, and disagreementexists between these definitions (Waples 2006). Pen-nock & Dimmick (1997) argued that this ambiguity isbeneficial in allowing decisions to be made on a case-by-case basis, as to which variables are most impor-tant. As things stand, research is needed on a case-by-case basis to predict the consequences of alternativeconservation strategies.
From sequencing a portion of the mitochondrialgenome or scanning the nuclear genome, individualsfrom the mainland can be differentiated from those onCayos Cochinos. Thus Moritz’s (1994) criterion of sig-nificant differentiation at the nuclear level (Table 3) ismet and the criterion of reciprocal monophyly (Fig. 2)is partially met with this dataset. In addition to thegenetic data, by simply looking at the geography of thearea one can deduce that the mainland and island pop-ulations are not only separated by an expanse of landbut also by the Caribbean Sea; therefore, Waples’(1991) first criterion of reproductive isolation is alsomet with these data. However, to meet Waples’ secondcriterion of distinct adaptations or evolutionary legacyand the similar criteria of many of the other definitionsof an ESU (Ryder 1986, Dizon et al. 1992, Crandall etal. 2000), our attention must turn to evidence for adap-tive variation or differential selection and concordancebetween additional lines of data.
The genomic heterogeneity in the degree of diver-gence inferred from BayeScan is consistent with adap-tive differentiation between the mainland and islandpopulations. The amount of variation exhibited by theAFLPs is low overall, implying recent isolation. How-
Pasachnik et al.: Population genetics of Ctenosaura melanosterna 123
alpha
Fre
qu
en
cy
−0.5 0.5 1.5
0
10
20
30
Fig. 4. Ctenosaura melanosterna. Frequency by which Foll &Gaggiotti’s (2008) α was observed, illustrating variationamong amplified fragment length polymorphism (AFLP)markers in the degree of differentiation between mainlandand island samples. Outliers detected by BayeScan (Foll &Gaggiotti 2008) are shown in grey (Pr{αi ≠ 0 | data} > 0.95) and
black (Pr{αi ≠ 0 | data} > 0.99)
Endang Species Res 14: 113–126, 2011124
ever, at least 5 alleles are strongly differentiated, likelyas a result of local selective sweeps at linked loci. TheCayos Cochinos island habitat is dominated by ever-green oak forest, whereas cacti and Acacia plantsdominate the Valle de Aguán mainland habitat.Although detailed dietary studies have not yet beenconducted, it is clear that individuals in each popula-tion are foraging on extremely different plants, asthere is little overlap in the flora between sites. Like-wise, these different habitats afford different soil typesand occur in areas of highly different weather patterns(S. A. Pasachnik pers. obs.). Therefore, the reproduc-tive biology, such as nesting times, may also vary (Colli1991, Gillis & Ballinger 1991, Iverson et al. 1993, Jenk-ins et al. 2009).
Given the evidence of adaptive differentiation,Waples’ (1991) criterion of preserving evolutionarylegacy is met. There is also concordance between dif-ferent lines of data including genetics, geography, andecology, to support this conclusion. Thus the criteria ofDizon et al. (1992) are met and there is support for 2ESUs. Further, following Crandall et al. (2000), wereject genetic and ecological exchangeability betweenthe mainland and island populations. Ctenosauramelanosterna is therefore a case in which all lines ofevidence, under all sets of criteria, support the sameconclusion of 2 unique ESUs.
Although it might be interesting to know how longthe 2 groups have been geographically separated, wehave no means to reliably estimate a divergence time.The mtDNA gene tree is too shallow to support infer-ence using a molecular clock approach (with so fewsubstitutions between haplotype groups, inference ofrates or times is highly imprecise), and coalescentapproaches such as Isolation with Migration (IM) (Hey& Nielsen 2004) require more independent loci for reli-able inference, in addition to assumptions about popu-lation size and history that are probably unrealistic forendangered species. We can say that divergence hasbeen sufficiently recent such that few nucleotide dif-ferences have accumulated and the mtDNA genealogyhas not yet resolved into 2 clearly monophyleticgroups.
Demographic stability
Using the simple summary statistics recommendedby Finn et al. (2009), we did not reject the null hypoth-esis of demographic stability for any putative ESU orsubpopulation. Caution should be taken when usingthis method of classifying both the stability of popula-tions and in turn the long-term habitat stability, espe-cially in the context of conservation and management.Although many of these statistics can be used with
confidence to infer certain events, such as bottlenecks,failure to reject the null hypothesis should not be con-sidered equivalent to accepting the conclusion ofdemographic stability. In other words, there may bebiologically relevant events that have occurred but arestatistically not significant, due to sample size or thepower of the analysis (Fidler et al. 2006). Rigorous riskassessment might better be approached from aBayesian perspective where a variety of priors areexplored and their probability assessed, instead of sim-ply rejecting or accepting a null hypothesis.
Conservation implications
The actions needed to protect these 2 ESUs are verydifferent. The Cayos Cochinos populations are locatedwithin a National Monument and thus will continue tobe afforded a certain degree of protection, althoughthis varies from island to island as discussed above. Inaddition, the threats that the Cayos Cochinos popula-tions face are greatly reduced in comparison to themainland populations, as anthropogenic factors are notas prevalent. Continued protection of the Cayos Cochi-nos populations is expected. However, given the datapresented herein, neglecting to protect the variationwithin the Valle de Aguán will greatly reduce theamount of biodiversity that is conserved.
Failure to take further action in the Valle de Aguánwill result in the extirpation of these populations, leav-ing those on Cayos Cochinos as the only representa-tives of this species. Given that the Cayos Cochinosislands are small and in a hurricane zone, deciding toprotect only these populations could result in theextinction of this species. In addition, it is likely thatCtenosaura melanosterna plays an integral role in thefunctioning of the unique dry tropical forest that occursin the Valle de Aguán, just as its sister species C.palearis (Pasachnik et al. 2010) plays in the ecologi-cally similar Valle de Motagua (Coti & Ariano 2008).Thus the extirpation of C. melanosterna could havea negative impact on the entire Valle de Aguán ecosystem.
Management strategies such as translocations, or thecreation of rescue populations, and captive breedingand release programs have been discussed for thisspecies. Failure to preserve the 2 distinct units identi-fied herein might result in the elimination of differen-tial adaptations to their respective environments. Therelocation or release of individuals into areas of the‘other’ ESU and the subsequent interbreeding mayresult in the deleterious effects of outbreeding depres-sion in the following generations (e.g. Sunnucks & Tait2001), and, in turn, the possible extinction of thespecies. Further, because the exact substructure within
Pasachnik et al.: Population genetics of Ctenosaura melanosterna 125
each of the units is not yet understood, breeding andtranslocation programs should respect the secondarysubdivisions (separation of the islands and the northand south side of the Aguán River), until there areample data to do otherwise. Lastly, those individualsthat are currently in ex situ breeding programs, and forwhich the origin is unknown, should not be releasedinto the wild until their origin can be determined,because of the potential harm outbreeding depressioncould cause to the species as a whole.
Acknowledgements. This study would not have been possiblewithout the help of R. F. Steiner, E. A. Pineda, C. R. Carias, J.Corneil, C. E. Montgomery, and a multitude of local residentsand guides, many thoughtful discussions with J. Iverson, J.Fordyce, and S. Horn, The Bay Island Foundation, and theIguana Research and Breeding Station and its helpful staff,the Cayos Cochinos Foundation, the many offices of ICF (for-merly AFE-COHDEFOR), and grants to S.A.P. from Sigma Xiand the International Iguana Foundation, and the Depart-ment of Ecology and Evolutionary Biology of the University ofTennessee, Knoxville. Thanks to Daniel Ariano for aiding inthe construction of the distribution map. All procedures wereapproved by the University of Tennessee, Knoxville, Institu-tional Animal Care and Use Committee.
LITERATURE CITED
Avise JC (2005) Phylogenetic units and currencies above andbelow the species level. In: Purvis A, Gittleman JL, BrooksT (eds) Phylogeny and conservation. Cambridge Univer-sity Press, New York, NY, p 77–100
Bermingham E, Coates A, Cruz Diaz G, Emmons L and others(1998) Geology and terrestrial flora and fauna of CayosCochinos, Honduras. Rev Biol Trop 46 (Suppl 4):15–37
Brooks TM, Mittermeier RA, da Fonseca GAB, Gerlach J andothers (2006) Global biodiversity conservation priorities.Science 313:58–61
Brummitt N, Lughadha EN (2003) Biodiversity: Where’s hotand where’s not. Conserv Biol 17:1442–1448
Buckley LJ, Axtell RW (1997) Evidence for specific status ofthe Honduran lizards formally referred to as Ctenosaurapalearis (Reptilia: Squamata: Iguanidae). Copeia 1997:138–150
Caro T, Engilis A, Fitzherbert E, Gardner T (2004) Preliminaryassessment of the flagship species concept at a small scale.Anim Conserv 7:63–70
Colli GR (1991) Reproductive ecology of Ameiva ameiva(Sauia, Teiidae) in the Cerrado of Central Brazil. Copeia1991:1002–1012
Coti P, Ariano D (2008) Ecology and traditional use of theGuatemalan black iguana (Ctenosaura palearis) in the dryforests of the Motagua Valley, Guatemala. Iguana 3:142–149
Crandall KA, Bininda-Edmonds ORP, Mace GM, Wayne RK(2000) Considering evolutionary processes in conservationbiology: an alternative to ‘evolutionarily significant units’.Trends Ecol Evol 15:290–295
Davis GE (2005) Science and society: marine reserve designfor the California Channel Islands. Conserv Biol 19:1745–1751
Dizon AE, Lockyer C, Perrin WF, Demaster DP, Sisson J (1992)Rethinking the stock concept — a phylogeographicapproach. Conserv Biol 6:24–36
Dupanloup I, Schneider S, Excoffier L (2002) A simulatedannealing approach to define the genetic structure of pop-ulations. Mol Ecol 11:2571–2581
Echternacht AC (1968) Distributional and ecological notes onsome reptiles from northern Honduras. Herpetologica 24:151–158
Evanno G, Regnaut S, Goudet J (2005) Detecting the numberof clusters of individuals using the software STRUCTURE:a simulation study. Mol Ecol 14:2611–2620
Ewens WJ (1972) Sampling theory of selective neutral alleles.Theor Popul Biol 3:87–112
Excoffier L, Smouse PE, Quattro JM (1992) Analysis of molec-ular variance inferred from metric distances among DNAhaplotypes: application to human mitochondrial DNArestriction data. Genetics 131:479–491
Excoffier L, Laval G, Schneider S (2005) Arlequin ver. 3.0: anintegrated software package for population genetics dataanalysis. Evol Bioinform Online 1:47–50
Excoffier L, Hofer T, Foll M (2009) Detecting loci under selec-tion in a hierarchically structured population. Heredity103:285–298
Falush D, Stephens M, Pritchard JK (2007) Inference of popu-lation structure using multilocus genotype data: dominantmarkers and null alleles. Mol Ecol Notes 7:574–578
Felsenstein J (1985) Confidence limits on phylogenies: anapproach using the bootstrap. Evolution 39:783–791
Fidler F, Burgman MA, Cumming G, Buttrose R, Thomason N(2006) Impact of criticism of null-hypothesis significancetesting on statistical reporting practices in conservationbiology. Conserv Biol 20:1539–1544
Finn DS, Bogan MT, Lytle DA (2009) Demographic stabilitymetrics for conservation prioritization of isolated popula-tions. Conserv Biol 23:1185–1194
Fitzpatrick BM (2009) Power and sample size for nestedanalysis of molecular variance. Mol Ecol 18:3961–3966
Fitzpatrick BM, Placyk JS, Niemiller ML, Casper GS,Burghardt GM (2008) Distinctiveness in the face of geneflow: hybridization between specialist and generalistgartersnakes. Mol Ecol 17:4107–4117
Foll M, Gaggiotti O (2008) A genome-scan method to identifyselected loci appropriate for both dominant and codomi-nant markers: a Bayesian perspective. Genetics 180:977–993
Fu YX (1997) Statistical tests of neutrality of mutations againstpopulation growth, hitchhiking and background selection.Genetics 147:915–925
Fu YX, Li WH (1993) Statistical tests of neutrality of muta-tions. Genetics 133:693–709
Gillis R, Ballinger RE (1991) Reproductive ecology of red-chinned lizards (Sceloporus undulatus erythrocheilus) insouthcentral Colorado: comparisons with other pop -ulations of a wide-ranging species. Oecologia 89: 236–243
Gutsche A (2005) Distribution and habitat utilization ofCtenosaura bakeri on Utila. Iguana 12:143–151
Harpending H (1994) Signature of ancient population growthin a low-resolution mitochondrial DNA mismatch distribu-tion. Hum Biol 66:591–600
Hey J, Nielsen R (2004) Multilocus methods for estimatingpopulation sizes, migration rates and divergence time,with applications to the divergence of Drosophilapseudoobscura and D. persimilis. Genetics 167:747–760
Hobbs RJ, Mooney HA (1998) Broadening the extinctiondebate: population deletions and additions in Californiaand Western Australia. Conserv Biol 12:271–283
Hoekstra JM, Boucher TM, Ricketts TH, Roberts C (2005)Confronting a biome crisis: global disparities of habitatloss and protection. Ecol Lett 8:23–29

Endang Species Res 14: 113–126, 2011126
Hughes JB, Daily GC, Ehrlich PR (1997) Population diversity:its extent and extinction. Science 278:689–692
Iverson JB, Balgooyen CP, Byrd KK, Lyddan KK (1993) Latitu-dinal variation in egg and clutch size in turtles. Can J Zool71:2448–2461
Jenkins CL, Peterson CR, Doering SC, Cobb VA (2009) Micro-geographical variation in reproductive characteristicsamong western rattlesnake (Crotalus oreganus) popula-tions. Copeia 2009:774–780
Köhler G (2003) The reptiles of Central America. Herpeton,Verlag Elke Köhler, Offenbach
Longmire JL, Gee GF, Hardekopf CL, Mark GA (1992) Estab-lishing paternity in whooping cranes (Grus americana) byDNA analysis. Auk 109:522–529
Luck GW, Daily GC, Ehrlich PR (2003) Population diversityand ecosystem services. Trends Ecol Evol 18:331–336
Mace GM (2000) It’s time to work together and stop duplicat-ing conservation efforts. Nature 405:393
Maddison DR, Maddison WP (2005) MacClade 4 release ver-sion 4.07 for OSX. Sinauer Associates, Sunderland, MA
McCranie JR, Wilson LD, Kohler G (2005) Amphibians andreptiles of the Bay Islands and Cayos Cochinos, Honduras.Bibliomania!, Salt Lake City, UT
Misawa K, Tajima F (1997) Estimation of the amount of DNApolymorphism when the neutral mutation rate variesamong sites. Genetics 147:1959–1964
Mittermeier RA, da Fonseca GAB, Brooks T, Pilgrim J,Rodrigues A, Myers N (2003) Hotspots and coldspots. AmSci 91:384
Moritz C (1994) Defining ‘evolutionarily significant units’ forconservation. Trends Ecol Evol 9:373–375
Moritz C, Cicero C (2004) DNA barcoding: promise and pit-falls. PLoS Biol 2:e354
Myers N, Knoll AH (2001) The biotic crisis and the future ofevolution. Proc Natl Acad Sci USA 98:5389–5392
Myers N, Mittermeier RA, Mittermeier CG, da Fonseca GAB,Kent J (2000) Biodiversity hotspots for conservation priori-ties. Nature 403:853–858
Pasachnik SA, Fitzpatrick BM, Near TJ, Echternacht AC(2009) Gene flow between an endangered endemiciguana, and its wide spread relative, on the island of Utila,Honduras: When is hybridization a threat? Conserv Genet10:1247–1254
Pasachnik SA, Echternacht AC, Fitzpatrick BM (2010) Genetrees, species and species trees in the Ctenosaura melano -sterna clade. Conserv Genet 11:1767–1781
Pennock DS, Dimmick WW (1997) Critique of the evolutionar-ily significant unit as a definition for ‘distinct populationsegments’ under the U.S. Endangered Species Act. Con-serv Biol 11:611–619
Pimm SL, Russell GJ, Gittleman JL, Brooks TM (1995)Hotspots and the conservation of evolutionary history. Sci-ence 269:347–350
Posada D, Crandall KA (1998) Modeltest: testing the model ofDNA substitution. Bioinformatics 14:817–818
Pritchard JK, Stephen M, Donnelly P (2000) Inference of pop-
ulation structure using multilocus genotype data. Genetics155:945–959
Ramos-Onsins SE, Rozas J (2002) Statistical properties of newneutrality tests against population growth. Mol Biol Evol19:2092–2100
Rogers AR, Fraley AE, Bamshad MJ, Watkins WS, Jorde LB(1996) Mitochondrial mismatch analysis is insensitive tothe mutational process. Mol Biol Evol 13:895–902
Ronquist F, Huelsenbeck JP (2003) MRBAYES 3: Bayesianphylogenetics inference under mixed models. Bioinfor-matics 19:1572–1574
Rozas J, Sanchez-DelBarrio JC, Messeguer X, Rozas R (2003)DnaSP, DNA polymorphism analyses by the coalescentand other methods. Bioinformatics 19:2496–2497
Ryder OA (1986) Species conservation and systematics: thedilemma of subspecies. Trends Ecol Evol 1:9–10
Sanderson EW, Jaiteh M, Levy MA, Redford KH, WanneboAV, Woolmer G (2002) The human footprint and the last ofthe wild. Bioscience 52:891–904
Stewart RR, Possingham HP (2005) Efficiency, costs andtrade-offs in marine reserve system design. EnvironModel Assess 10:203–213
Sunnucks P, Tait N (2001) Velvet worms: tales of the unex-pected. Nat Aust 27:60–69
Swofford DL (2002) PAUP*. Phylogenetic analysis using par-simony (*and other methods). Version 4.0. Sinauer Associ-ates, Sunderland, MA
Tajima F (1997) The amount of DNA polymorphism main-tained in a finite population when neutral mutation ratevaries among sites. Genetics 143:1457–1465
Toscano MA, Macintyre IG (2003) Corrected western Atlanticsea-level curve for the last 11,000 years based on cali-brated 14C dates from Acropora palmata framework andintertidal mangrove peat. Coral Reefs 22:257–270
Vekemans X (2002) AFLP-SURV version 1.0. Laboratoire deGénétique et Ecologie Végétale, Université Libre de Brux-elles
Vos P, Hogers M, Bleeker M, Reijans M and others (1995)AFLP: a new technique for DNA fingerprinting. NucleicAcids Res 23:4407–4414
Wake DB, Vredenburg VT (2008) Are we in the midst of thesixth mass extinction? A view from the world of amphib-ians. Proc Natl Acad Sci USA 105:11466–11473
Waples RS (1991) Pacific salmon, Oncorhynchus spp., and thedefinition of ‘species’ under the Endangered Species Act.Mar Fish Rev 53:11–22
Waples RS (2006) Distinct population segments. In: Scott JM,Goble DD, Davis FW (eds) The Endangered Species Act atthirty: conserving biodiversity in human dominated land-scapes. Island Press, Washington, DC, p 127–149
Wilson LD, Cruz Diaz GA (1993) The herpetofauna of theCayos Cochinos, Honduras. Herpetol Nat Hist 1:13–23
Wilson LD, McCranie JR (2004) The conservation status of theherpetofauna of Honduras. Amphib Reptile Conserv 3: 6–33
Woinarski JCZ, Fisher A (1999) The Australian EndangeredSpecies Act 1992. Conserv Biol 13:959–962
Editorial responsibility: Steven Rossiter,London, UK
Submitted: August 26, 2010; Accepted: February 24, 2011Proofs received from author(s): May 6, 2011