population growth and educational development
TRANSCRIPT

213
CHAPTER 6
POPULATION GROWTH AND EDUCATIONAL
DEVELOPMENT
- Tirtha Bahadur Manandhar*
- Krishna Prasad Shrestha**
6.1 Introduction
6.1.1 Coverage of the Paper
The Population Census, 2001, has collected data on two main educational features of the
population: literacy status, and educational attainment of the population. The National Report of
the Population Census, 2001 presents census results on the following:
i. Population 6 years of age and over by literacy status, age and sex for regions, and districts.
ii. Literate population 6 year of age and over by educational attainment (level passed) age and sex for regions and districts.
Based on the above census results, overall literacy rate for population 6 years and above, and
adult literacy rate for population 15 years and above have been presented in this paper. Also
educational attainment of the literate population has been analyzed based on the census results in
this paper. Thus, we could find out what level of formal education have the various segments of
the population completed (level of school education, higher education). Apart from the findings
based on the census results, it is pertinent to analyze the relevant data collected by the Ministry of
Educational and Sports, (MOES ) and presented regularly in the Annual Educational Statistics
reports of the MOES. In this paper, the basic educational data based on the Educational Statistics
Reports are analyzed initially in context of the educational policies and the relevant population
information from the Census. Detailed analysis of the literacy status and educational attainment of
the population is presented in the later part of the paper.
* Tirtha Bahadur Manandhar is ex-Joint Seretary, HMG, Nepal ** Krishna Prasad Shrestha is a Deputy Director of Central Bureau of Statistics.

214
6.1.2 Population and Educational Development
Population growth and educational development are closely interrelated. Population growth leads
to an increase in number of persons for whom education facilities have to be provided. On the
other hand, educational development affects population trends through promotion of increased
acceptance of family planning measures by the adults, and delay in age at marriage.
Nepal has made significant progress in education at all levels during the past three decades.
Currently, 3.8 million students are attending the primary schools and 1.5 million students are attending the secondary schools (lower secondary and secondary together). Universal primary
education, that is enrollment of all 6-10 years old children in primary schools, is the long-term
goal of the government. The Education for All - Plan of Action (2003) has set the target of
attaining universal primary education by 2015 AD.
Secondary education has also expanded rapidly, as a result of efforts of the government to provide access to secondary education and also due to increased public demand for this level of education.
Higher secondary education has emerged as an alternative to Proficiency Certificate Level (PCL)
education provided in the campuses of Tribhuvan University. There is now a countrywide
network of higher secondary schools, all of which are functioning under private management. The
PCL programme is proposed to be phased out with the expansion of the higher secondary schools.
Two new universities, the Purbanchal University and the Pokhara University have been
established since 1992. The B.P. Koirala Institute of Health Sciences, having university status has
also been set up. Tribhuvan University is still the main provider of higher education in the
country. The new universities have granted affiliation to a large number of private colleges.
Literacy rate has gone up steadily reaching 54.1% for population 6 years and over. Expansion of primary education, and execution of various non-formal education programmes have contributed
towards this increase.
6.2 Features of the Education System
6.2.1 Structure
The structure of school level education with Primary Education of Grades 1-5, Lower Secondary
Education of Grades 6-8, and Secondary Education of Grades 9-10, that was created in early
1990's, still remains in practice. The long term goal of the government as indicated in the Ninth
Plan (1997-2002) document is to integrate the higher secondary education (Grades 11, 12) with
the school level education.

215
6.2.2 Types of Schools
There are three types of schools at each level of school education namely Government aided
schools (Public Schools), Community Schools and Private Schools. The Community Schools and
Private Schools do not get government grants and rely on their own resources and community
contributions. The Community Schools are observed to be attempting to get government paid
'teacher quotas' on receiving which they get recognition as government aided schools. In the year
2001, the government aided schools accounted for 88.8% of enrollment at the primary level,
87.6% of enrollment at the lower secondary level, and 85.8% of enrollment at the secondary level.
The rest of the enrollment of various levels was in the Community Schools and Private Schools.
(DOE, School Level Educational Statistics of Nepal, 2001)
6.2.3 Growth of the Private Sector
The private schools have emerged as major provider of school level education since past two
decades. In the year 2001, private schools constituted 8.7% of all primary schools, 17.8% of all
lower secondary schools, and 21.3% of all secondary schools (DOE, School Level Educational
Statistics of Nepal, 2001). The private schools are seen to be particularly prominent in the
delivery of secondary education. The perceived higher quality of education in these schools is the main factor for the growth of private sector institutions.
Early childhood education has been emphasized for proper development of young children and
increased access to primary educations. Promotion of pre-primary education through community
based child development centres is being done. In urban areas, private sector is providing pre-
primary education on extensive scale.
6.2.4 Higher Secondary Education
Higher secondary education is provided by a diverse set of institutions such as the Public schools,
Private schools, Colleges and specific Plus Two schools. The Higher Secondary Education Board
(HSEB) provides approval to the institutions for conducting Grades 11 and 12 (Plus Two) classes,
prescribes curriculum and conducts examinations. A large number of higher secondary schools have been established in recent years. The number of such schools reached 789 in April 2003. The
addition in number of such schools has been as indicated by the Ninth Plan (1997-2002). The Plan
had expected that the number of higher secondary schools would reach 758 by the end of the plan
period. The number has now exceeded the plan expectation due to liberal granting of approval by
HSEB.

216
6.2.5 Expansion of Higher Education
With the establishment of two new universities - the Purbanchal University and the Pokhara
University, the number of universities has reac hed five. The Kathmandu University and other two
new universities have provided affiliation to a large number of private colleges for teaching
Science, Management, Engineering, Medicine and other professional courses. The Purbanchal
University and Pokhara University have quite small enrollment in their respective constituent
campuses. The private colleges attached to these universities charge much higher fees than the
private campuses affiliated to Tribhuvan University.
6.2.6 Department of Education
The establishment of Department of Education (DOE) in 1999 marks an important change in the
system of educational administration. The DOE was made responsible for the implementation of
the Basic and Primary Education Project (BPEP), Phase II (1999–2004). At the same time, the
processes of preparation of District Education Plans (DEP) and School Improvement Plans (SIP)
were started under the BPEP II programme. The DEP and SIP planning processes are considered
to be important steps for promoting decentralized planning in the educational field and for raising quality education..
6.2.7 Financing of Education
The government has been devoting a substantial proportion of budget for the Education Sector.
The allocation for the Education Sector was 14% of the government budget for Fiscal Year 2000/2001. The Education Sub-Sector allocations were as follows for FY 2000/2001: 55.4% for
Primary Education, 21% for Secondary Education, 12% for Higher Education, and 1% for Non-
formal Education. The total allocation for the Education Sector was Rs. 14.0 Billions. (MOES,
Education Information of Nepal, 2001)
6.2.8 Education Regulations Revision
The Education Regulations 2059 (2002 A.D.) based on the Seventh Amendment of the Education Act, 2028 (1971 A.D.), allows the public schools to charge tuition and other fees on the students.
The government is committed to free primary education. The tuition fees can now be charged in the Public Secondary Schools. Several new features such as Teacher Licensing System, setting up
of Village Education Committees, formation of School Management Committees with major representation of parents, have also been included in the revised Regulations. Further, the new
terminologies have been used to describe the types of Schools. The present government aid ed

217
schools are called Community Schools and the Private Schools (including private boarding
schools) are described as Institutional Schools.
6.2.9 Projects
A number of externally supported projects have been implemented during 1991-2001 to promote educational development.
These are :
- Basic and Primary Education Project (1993-98) Phase I
- Basic and Primary Education Project (1999-2004) Phase II
- Secondary Education Development Project (1993-2000)
- Primary Education Development Project (1992-97)
The Basic and Primary Education Project (Phase I and II) has the objectives of
(i) expanding access to basic and primary education (ii) raising quality of teaching/learning and
(iii) improving educational management. The Primary Education Development Project (PEDP)
concentrated on building infrastructure for primary teacher training and on establishment of
National Centre for Educational Development (NCED). Secondary Education Development
Project provided support for improving infrastructure for science teac hing and for expanding
institutional base for secondary teacher training. The PEDP provided support for the
establishment and operation of the NCED and Primary Teacher Training Centres.
6.2.10 Population Pressure on Education
The country's rate of growth of population during 1991-2001 was 2.25% per year. This is
considered to be relatively high growth rate of population. The population growth exerts
continuing pressure on provision of primary education in the short term and on provision of other
levels of education in course of time.
6.3 Progress in Education
6.3.1 Primary Education
The growth in number of schools and enrollment continued during the intercensal period 1991-
2001. As reported in the School Level Educational Statistics of Nepal, 2001, the number of

218
primary schools reached 24,943 in the year 2001; and enrollment reached 3.8 millions in that
year. (Table 6.1)
Over the period 1993-2001, there was an absolute increase of 4726 primary schools; and the
average annual rate of increase in enrollment dur ing the period was 2.8%. This growth rate is
lower compared to the annual growth rate (11.1%) over the earlier period (1987-92) (Table 6.2).
The Educational Statistics Report for 2001, indicates a decline in number of primary schools in
2001.
Primary education has been a priority area of educational policy and programme. Several
measures have been taken to increase the access to primary education and improve its quality.
Basic and Primary Education Project with comprehensive coverage (Physical facilities
development, Curriculum Development, Teacher Training, Resource Centres, Woman Education)
has been implemented. A new phase of the project is currently under implementation since 1999.
There has been a steady increase in the participation of girls in primary education. Girl students as
proportion of total primary enrollment increased from 38.7% in 1993 to 44.8% in 2001. Special
measures such as provision of scholarships for girl students in specified districts, and appointment
of female teachers have contributed towards this increase in girls participation. The Education for
All – Plan Action 2003 aims at attaining complete gender parity in school enrollment by 2015.
Primary enrollment ratios are used to measure progress in access to and participation in primary
education. Gross Enrollment Ratios have exceeded 100% because of presence of "underaged" and
"overaged" children in primary classes. Currently, Net Enrollment Ratio is 81.1%. This implies
that about 19% of children in 6-10 years age group are still out of school (primary level). It is
observed that most of the unschooled children belong to the disadvantaged groups, communities
in remote areas and families in extreme poverty.
6.3.2 Secondary Education
There has been a significant increase in number of lower secondary and secondary schools and
also in the enrollments of the respective levels. The number of lower secondary schools went up
from 4376 in 1993 to 7340 in 2001. Enrollment grew from 637 thousand in 1993 to 1058
thousand in 2001 indicating an annual increase of 5.2% over the period 1993-2001. (Tables 6.1
and 6.2)

219
The number of secondary schools reached 4113 in 2001, which is nearly double the number in
1993. Enrollment at this level went up from 272 thousand in 1993 to 449 thousand in 2001,
indicating an annual growth rate of 4.2% during the period 1993-2001. A decline in number of
secondary schools in 2001 is noted: however there was a large increase in secondary level
enrollment in this year.
The increase of lower secondary and secondary level enrollment can be explained by factors such
as the demand for secondary education created by an expanding primary education system, social
pressure for gaining more education at upper levels, and the waiving of tuition fees in the public
schools at lower secondary and secondary levels. The "tuition fee" in secondary education was
done away in 2059 when a major revision of the Education Regulations, 2059 (2002 A.D.)
permitted the charging of tuition and other fees in the public schools.
The percentage of girls at the enrollment of the lower secondary level was 42.2% and at
secondary level 41.4% in 2001. Over the years from 1993 to 2001, some increment in the
percentage of girl students at the secondary levels has occurred. A large number of lower
secondary and secondary schools have been approved with a view to increase, for the boys as well
as the girls, the access to secondary education.
Table 6.1 : Trends in number of schools, total enrollment and girls' enrolment 1993 – 2001, Nepal.
1993 1994 1995 1996 1997 1998 1999 2000 2001
Primary Level
1. No of Schools 20217 21102 21473 22218 23284 23885 25527 25927 24943 2. Total Enrolment (in 1000) 3091 3191 3263 3447 3460 3587 3780 3623 3853 3. Girls Percentage in Total
Enrolment 38.7 39.0 39.9 40.6 41.6 41.9 42.6 44.1 44.8
Lower Secondary Level
1. No of Schools 4376 4739 5041 5506 6062 6617 7276 7287 7340 2. Total Enrolment (in 1000) 637 670 726 791 828 842 916 957 1058 3. Girls Percentage in Total
Enrolment 34.0 35.0 36.0 38.0 38.6 40.9 40.9 41.0 42.2
Secondary Level 1. No of Schools 2242 2482 2654 2903 3322 3624 4082 4350 4113 2. Total Enrolment (in 1000) 272 274 290 329 344 375 385 373 449 3. Girls Percentage in Total
Enrolment 31.0 32.0 35.0 36.1 40.9 39.2 39.7 40.6 41.4
Source : Ministry of Education, Educational Statistics Reports for Various Years 1993 to 2001.
Note : The statistics mentioned here include Public (G overnment aided), Comminity and Private
Schools.

220
Table 6.2 : Average annual growth rate of enrollment at primary, lower secondary and secondary levels.
Year Primary Lower Secondary Secondary
1993-94 3.2 5.2 0.7
1994-95 2.2 8.3 5.8
1995-96 5.7 8.9 13.8
1996-97 0.4 4.8 4.5
1997-98 3.7 1.6 9
1998-99 5.3 7.8 2.7
1999-2000 -4.1 4.5 -3.2
2000-2001 6.3 0.7 20.4
Average 2.8 5.2 6.7
Source : Based on data presented in Table 6.1.
Note : The Minus (-) notation indicates a decline in related rate.
The Gross Enrollment Ratio at the lower secondary level was 63.2% and at the secondary level,
43.8% in the year 2001. These ratios indicate relatively low participation rates of the adolescents
and youths in secondary education. Gender disparities in participation are more pronounced at this
level than at the primary level. The participation of low socio-economic and disadvantaged groups
is generally observed to be low, mainly because of high incidence of dropout at the primary level,
among these groups. Further, the low efficiency of secondary education as indicated by high
failure rate in the S.L.C. examination is a matter of serious concern.
6.3.3 Proportion of Girls Enrollment at Primary Level
The pattern of primary enrollment in 2001 by Development Regions and Geographical zones is
shown in Table 6.3 Each cell in the table has two figures: the first figure is the total enrollment in
the concerned region/zone, and the second figure is the percentage of girls in that enrollment. It is
seen that the Mountain and Hill Zones of Eastern and Western Region, and Kathmandu Valley
have high percentages of girls enrollment in the total enrollment of respective Region/Zone.
Lowest percentages of girls enrollment are found in Mountain Zones of Mid Western and Far
Western Regions, and Terai Zone of Central Region.

221
Table 6.3 : Primary enrollment and percentage of girls, 2001 by development and geographical regions.
Region Eastern Central Western Mid Western
Far Western
Mountain Total 100041 112131 3508 50814 73944 % of Girls 47 45 50.7 34.3 41.4
Hills Total 337674 352242 629543 300089 121624 % of Girls 47.9 46.6 48.9 43.7 43.4
Kathmandu Valley Total 221290 % of Girls 47.7
Terai Total 445616 482246 259540 206615 156701 % of Girls 44.3 38.2 42.5 44.7 45.1
Region Total 883331 1167909 892591 557518 352269 % of Girls 46 43.2 47.1 43.2 43.8
Source : Department of Education, MOES, School Level Educational Statistics of Nepal, 2001
6.3.4 Teachers at the School Level
The total number of teachers in schools (all types) in 2001 was 96,659 at the primary level,
26,678 at lower secondary level, and 18,846 at the secondary level. Female teachers as
proportions of total teachers constituted 25.3% of teachers at primary level, 14% of teachers at
lower secondary level and 7.9% of teachers at secondary level in 2001.
During the period 1996-2001 the number of primary teachers increased by 8.1%, number of lower
secondary teachers by 35.4% and number of secondary teachers by 14.7%. The increase in
number of lower secondary and secondary teachers is evid ently higher than that of primary
teachers.
Over the period 1996-2001, there was steady increase in proportions of female teachers at the
primary level; about 25% of the teachers in primary schools are female teachers: and the
proportions of female teachers reached around 14% at lower secondary, and about 8% at
secondary level in 2001.

222
Table 6.4 : Teachers at school level 1996-2001.
Level Category 1996 1997 1998 1999 2000 2001 Total Teachers 89,378 91,464 91,878 99,382 97,879 96659 Primary
Level Percentage of Female Teachers 20.6 22.5 22.5 23.8 25.3 25.3
Total Teachers 19,704 20,641 22,095 24,696 25,375 26678 Lower
Secondary Level
Percentage of Female Teachers 12.8 12.6 11.6 13.4 12 14
Total Teachers 16,423 16,494 16,677 19,185 19,498 18,846
Secondary Level Percentage of
Female Teachers 10.3 8.2 7.2 8.4 7.6 7.90%
Source : Ministry of Education, Educational Statistics Reports (Various Years) 1996 to 2001.
The Student: Teacher ratios at the school level in 2001 were as follows: 40:1 at primary level,
40:1 at Lower Secondary Level and 24:1 at Secondary Level. There are large regional variations
in the student teacher ratios. Generally the student teacher ratios are higher at all levels in Terai
region compared to other regions.
6.4 Enrollment Ratios
6.4.1 Trends in Enrollment Ratios
The enrollment ratios indicate the extent of access to and participation of population of relevant
age groups in education of various levels of education. Targets of educational development are
generally laid down in Nepalese development plans in terms of enrollment ratios – Net
Enrollment Ratios (NER) (Number of students in officially defined age group for a given level of
education expressed as percentage of population in the corresponding age group) with respect to
Primary Education, and Gross Enrollment Ratios (GER) (Enrollment in a specific level of
education, regardless of age, expressed as a percentage of the eligible school age population
corresponding to the same level of education) with respect to Lower Secondary and Secondary
levels. For instance, the Ninth Plan laid down enrollment targets of attaining 90%(NER) at
Primary Level and 45% (GER) at Secondary Level. The Tenth Plan (2002/2007) has set target of
attaining GER 65% for lower secondary level and 45% secondary level During the period 1995-
2001, the GER at primary level increased marginally, and there was significant improvement in
the NER.

223
Table 6.5 : Change in GER, NER 1995-2001.
Year 1995 2001
Level Gross
Enrollment Ratio
Net Enrollment
Ratio
Gross Enrollment
Ratio
Net Enrollment
Ratio
Primary 114.1 67.5 124.7 81.1
Lower Secondary 47.9 26 63 39
Secondary 31.6 17.3 43.8 25.5
Source : Ministry of Education, Educational Statistics Reports, 1995, and 2001.
The GER at lower secondary increased significantly during 1995-2001 period. There was also
moderate increase in NER at this level. GER and NER at the secondary level also went up
moderately. The data indicate that in 2001, about 81% of primary school age (6-10 years) children
were enrolled in schools; at the lower secondary level about 40% of lower secondary age (11-13
years) children were enrolled, and similarly, 25% of secondary school age (14-15 years) children
were enrolled in secondary schools.
It is seen that the GER at primary level exceeds 100%. This situation is due to lack of strict age-
grade correspondence in school enrollment. There are "underaged" as well as "overaged" children
(ages lower or higher than specified for a particular grade). In the year 2001, the distribution of
students in percentage at primary level by their age/grade level was as follows: "underaged"
students 7.8%: "correct age" students, 65.1%, "overaged" students 27.1%. The data indicate that
over a quarter of all primary students are overaged for the grades they attend.
The pattern of GER at primary level exceeding 100% is found in a number of the South Asian
countries (Bangladesh, India, Maldives, Sri Lanka) besides Nepal.
6.4.2 Pattern of Enrollment Ratios at Various Levels
Table 6.6 presents the GER at different levels by Development Regions. At the primary level, the
GER exceeds 100% both for boys and girl students, and in all the five Development Regions.
Highest total GER is found in the Western Region. Relatively low GER is found in Central
Region. At the lower secondary level, total GER is 63.2%, relatively low GER is found in Mid
Western and Far Western Region, particularly for the girl students in 2001. At the Secondary
level, GER for the country is 43.8%, the highest GER (51.4%) is found in the Western Region
and relatively low GER(about 30%) is found in Mid Western and Far Western Regions in 2001,
GERs are particularly very low for the girl students in all development regions.

224
Table 6.6 : Gross enrollment ratios, by development regions 2001.
Primary Lower Secondary Secondary Development
Region Boys Girls Total Boys Girls Total Boys Girls Total
Eastern 126.7 112.1 119.5 71.9 59 65.5 55.8 42.7 49.2
Central 125.8 102 114 71 51 61 51 37.2 44.2
Western 144.4 138.6 141.6 80.9 68.6 74.8 58.2 44.9 51.4
Mid Western 153.8 119.7 137 66.9 40.1 53.5 42.1 20.3 30.7
Far Western 132 108.4 120.5 66.8 37.1 52.3 43.6 17.2 30.2
Nepal 134.1 115 125 72 54 63 52 36 43.8
Source : DOE, MOES, School Level Educational Statistics of Nepal, 2001.
Table 6.7: Net enrollment ratios by development regions 2001.
Primary Lower Secondary Secondary Development Region Boys Girls Total Boys Girls Total Boys Girls Total
Eastern 83.9 76 80 46 36 41 32.8 24.4 28.4 Central 86.3 69 77.9 46.2 34.6 40.5 32.9 23.8 28.4 Western 89.7 81.4 85.7 49.3 41 45.2 31.9 24.5 28.1 Mid Western 91.1 80.7 85.9 38.2 23 30.6 21.7 10.8 16 Far Western 84.7 73 79 39 22 31 22 8.8 15.4 Nepal 86.9 75.1 81.1 45 33.7 39.4 30.2 20.9 25.5
Source : DOE, MOES, School Level Educational Statistics of Nepal, 2001.
There are wide differences between GER and NER (total as well as genderwise) at all levels. The
relatively low NER compared to GER at primary level indicates the practice of late school going
in several parts of the country.
With respect to both GER and NER at the primary level, there is a substantial gender gap
indicating the need to be met in getting the girls to schools. The gender gaps are wider at lower secondary and secondary levels than at primary level.
Table 6.7 presents NER at different levels and development regions. In the year 2001, the total
NER at the primary level was 81.1%, in total, 86.9% for the boys and for the girls 75.1%. It
means that about 19% of the primary school age children are not in schools. More girls of primary
school age (25%), are not in schools, compared to 13% of the primary school age boys.

225
Regionwise the NER at primary level exceeds the national average of 81.1% in two Development
Regions, (Western and Mid Western Regions). The NER for the Central Region is less than the
national average. This is due to relatively low girl specific NER in this Region.
The NER at lower secondary and secondary levels are quite low, particularly at the secondary level. Regionwise higher NER (45.2%) is found in the Western Region, for the lower secondary
level; and highest NER (28.4%) is found in the Eastern and Central Regions for the secondary
level. Girl specific NER is generally lower than the boy specific NER in all regions.
Further exploration of NER at primary level by geographical regions is relevant in view of the
government's goal of attaining 90% NER by the end of Tenth Plan. The NER data for the year
2001 show that NERs are generally low in the Terai Region of all development regions
particularly for the girls. Also the Mountain and Hill belts in the Mid Western and Far Western
Regions have low NER. (Table 6.8)
Table 6.8 : Net enrollment ratio at primary level by development and geographical regions, 2001.
Regions Boys Girls Total
Nepal 86.9 75 81.1 Eastern Region 83.9 75.8 79.9 Mountains 90.4 94 92 Hills 93.3 88.5 90.9 Terai 78.4 67.1 72.9 Central Region 86.3 69 77.9
Mountains 94.6 90 93 Hills 94 84.8 89.5 Terai 79.8 51.7 66.3 Kathmandu Valley 91.4 89.5 90.5 Western Region 89.7 81.4 85.7 Mountains 96.5 97.4 97 Hills 93.1 90.4 91.8 Terai 84.1 67 75.8 Mid Western Region 91.1 80.7 85.7 Mountains 92.9 67.8 80.5 Hills 95.3 88 91.7 Terai 85.8 75.1 80.5 Far Western Region 84.7 73.1 79 Mountains 96.6 85.2 91.1 Hills 82.5 70.5 76.7 Terai 81.9 70.7 76.4
Source : DOE, MOES, School Level Educational Statistics of Nepal, 2001.

226
6. 5 Promotion, Repetition and Dropout Rates
6. 5.1 Promotion, Repetition and Dropout Rates at Primary Level
One of the main problems of the education system particularly at the primary level is the low rate
of retention in the schools. Retaining the students in schools and enabling them to complete
primary education is now one of the key aims of the education policy at present. The low
retention is a reflection of the successive dropout and repetition rates prevailing in the primary
grades.
Recent Educational Statistics Reports and Ministry of Education Reports have used 'Survival
Rates' at primary level to represent the status of efficiency. The Survival Rate (by grade) at
primary level refers to percentage of student cohort enrolled in Grade 1 of primary education, that
reaches a given grade of the primary cycle. The Educational Statistics Report (1999) has
mentioned the Survival Rate to Grade 5 to be 49.7% for the year 1999. The EFA Plan of Action,
2003, has mentioned the Survival Rate to be 63% for the year 2000.
Data on the flow rates at the primary and secondary levels are regularly presented in the annual
Educational Statistics Reports of the MOES. Data on these rates for two years 1995, and 2001 are
briefly analyzed here (Tables 6.9, A and B). It is seen from the Table
6.9 (B) that in 2001 promotion rate was just above 47.4% at Grade 1; repetition rate was very
high; so too the dropout rate was quite high at Grade 1. Consequently promotion rate to Grade 2
was low. Promotion rates improved substantially from Grade 2 onwards. Repetition rate at the
Grade 2 and subsequent grades are substantially low compared to the rates prevailing at Grade 1.
A comparison of the flow rates for 1995 and 2001 shows that the promotion rate has gone up; and
repetition and dropout rates have gone down across the entire five grades of primary education.
More particularly the promotion rate at Grade 1 has gone up to 47.4 in 2001. Dropout rate has
gone down to 13.7% in 2001. (Table 6.9, A & B). These trends indicate an improvement in the
internal efficiency of primary education.
The pattern of promotion, repetition and dropout rates (at primary level) for boys and girls is
almost similar, with not significant difference.

227
Table 6.9 A: Promotion, repetition, dropout rates at primary level, 1995.
Flow Rate Grade 1 Grade 2 Grade 3 Grade 4 Grade 5
Promotion Rate 37.6 70 77.3 73.2 67
Repetition Rate 41.8 18.9 17 16.9 17.4
Dropout Rate 20.6 11 6 10 16
Source : MOE, Educational Statistics of Nepal, 1995.
Table 6.9 B : Promotion, repetition, dropout rate, 2001.
Flow Rate Grade 1 Grade 2 Grade 3 Grade 4 Grade 5 Promotion Rate 47.4 79.0 83.7 82.7 82.0 Repetition Rate 38.7 16.8 12.3 12.7 90 Dropout Rate 13.9 4.0 4.0 5.0 10.0
Source : DOE, MOES, School Level Educational Statistics of Nepal, 2001
Note : (i) Promotion Rate Percentage of students who are promoted to the next upper grade in the
following year to the number of students enrolled in grade..
(ii) Repetition Rate: The percentage of students who repeat the same grade in the following year to
the number of students enrolled in the grade.
(iii) Dropout Rate: The percentage of students who dropped out from the school from a particular
grade to the number of students enrolled in the grade.
Bringing down dropout and repetition rates is essential to attain higher NERs. For this, raising
quality of instruction in schools, and improving school management including monitoring of
student attendance and performance are essential. Under the BPEP II, the government has been
conducting piloting of automatic promotion in Grades 1, 2, and 3. in a few districts The scheme is
still in experimental stage. Further, there is a programme of introducing Compulsory Primary
Education. Some municipalities like Banepa have done appreciable work on their own in their
constituencies. The government programme on compulsory primary education is limited to five
districts. Successful implementation of Compulsory Primary Education will cut down dropout
rates substantially. The EFA Plan of Action (1993) has also mentioned strategy to introduce the
compulsory education at the primary level. for raising primary enrollment. As yet, it seems
unlikely that there will be extension of the scheme in the immediate future.
6.5.2 Promotion, Repetition and Dropout Rate at Secondary Level
Promotion rates are consistently high at secondary level; there is decline in promotion rate at
Grade 8. Repetition and dropout rates are generally low. A comparison of data for 1995 and 2001
indicates that repetition and dropout rates for the year 2001 are lower than the rates for 1995.

228
(Tables 6.10A and B) Despite the lower repetition and dropout rates in the secondary grades, the
secondary education system is seen to be evidently inefficient. This is indicated by the low pass
rates in the SLC Examination. The low performance of students of the public schools points out
the low efficiency levels of these schools mainly. The S.L.C. pass rates have varied between 33%
and 45% in different years. In the SLC examination of 2003, the pass rate was 32.5%
Table 6.10 A : Promotion, repetition and dropout rate at secondary level, 1995.
Flow Rate Grade 6 Grade 7 Grade 8 Grade 9 Grade 10
Promotion Rate 79.4 81.1 71.2 76.8 -
Repetition Rate 13.2 11.1 16.9 12.0 18.3
Dropout Rate 7.4 7.8 11.9 11.2 -
Source : MOE, Educational Statistics of Nepal, 1995.
Table 6.10 B : Promotion, repetition and dropout rate at secondary level, 2001.
Flow Rate Grade 6 Grade 7 Grade 8 Grade 9 Grade 10
Promotion Rate 84.0 88.5 79.2 82.2 -
Repetition Rate 10.8 8.8 10.6 9.8 10.3
Dropout Rate 5.2 2.7 10.2 8.0 -
Source : DOE, MOES, School Level Educational Statistics of Nepal, 2001.
6.6 Higher Secondary Education
The higher secondary education system was introduced in early 1990's under the Higher
Secondary Education Act of 1989. The system was intended to prepare students for the world of
work as middle level manpower, and to prepare students for higher education in general and
professional areas. Presently, the system is devoted mainly to preparing students for higher
education. The higher secondary education system was expected to replace the Proficiency
Certificate Level (PCL) in Tribhuvan University and other Universities. Such phas ing out of the
PCL programme from the universities has not materialized for various reasons.
Under the Higher Secondary Education Act, the Higher Secondary Education Board (HSEB)
grants approval to various institutions to conduct the Plus Two (Grade 11 and 12) classes. The
higher secondary schools are being run in the following organizational setups:
- Attached to existing secondary schools (Public and Private), but operating as separate entities,

229
- Attached to Campuses, mainly private campuses
- Separate P lus Two (Higher Secondary) Institutes.
In April 2003, the number of higher secondary schools approved by the HSEB was 789. The
regional distribution of these schools is as follows: (Table 6.11)
Table 6.11 : Regional distribution of higher secondary schools (HSS), 2003.
Region Number of H. S. S. %
1. Eastern Region 165.0 20.9 2. Central Region 325 41.2 a) Districts other than Kathmandu Valley Districts (139) (17.6) b) Kathmandu Valley Districts (186) (23.6) 3. Western Region 190 24.1 4. Mid Western Region 49 6.2 5. Far Western Region 60 7.6 Total 789 100
Source : Higher Secondary Education Board. (Compiled from the primary data supplied by HSEB, April 2003)
Data on enrollments and teachers in the higher secondary schools are currently lacking. The
HSEB maintains data on students sitting in the higher secondary examination. According to
HSEB Examination Section, a total of 172 thousand students (Grades 11 and 12) appeared in the
higher secondary examinations held in April 2003. This gives some idea of the large student
population involved in higher secondary school studies.
One important aspect is that the pass rates in the examinations conducted by the HSEB are very
low. Pass rates vary by subject. The overall pass rate in Grade 11 Examination (Regular) of 2055
was 34.5%, and Grade 12 Examination (Regular) of the same year was 39.7%. Higher pass rates
was found in Commerce and Science streams, compared to the rates in Humanities and Education
streams. (HSEB, Examination 2055- At a glance)
6.7 Technical Education and Vocational Training
The Council for Technical Education and Vocational Training (CTEVT) is the principal
government agency under the Ministry of Education and Sports, responsible for technical and
vocational training directed mainly to students with some years of secondary education.
Information is available on 8 Technical Schools and 1 Polytechnic directly operated by CTEVT.

230
In 2056/57, there were a total of 1520 students (undergoing two year Technical SLC programmes)
in the 8 technical schools. The polytechnic (at Hetauda) conducts short term training. There were
114 private technical institutes affiliated to CTEVT, which were conducting the Technical SLC
programmes in various vocational areas . A total of 7155 students were enrolled in these private
institutes in 2056/67. The data indicate significant role of private institutes in vocational training.
(MOES, Education Information of Nepal, 2001)
The CTEVT is now moving on to conduct Diploma level courses in some of the technical
schools. It has also granted affiliation to 5 private institutes to conduct Diploma courses.
Meanwhile, the Training Institute for Technical Instruction (TITI), under the CTEVT has received
affiliation with Kathmandu University to conduct Bachelor programme in Technical Instruction.
6.8 Higher Education
6.8.1 Institutions
The higher education system of the country comprises of the following universities:
Universities Enrollment Constituent (Campuses) Year
Tribhuvan University, Kirtipur 142,308 2001/02
Mahendra Sanskrit University, Dang 1,606 2000/01
Kathmandu University, Dhulikhel 1,497 2000/01
Purbanchal University, Biratanagar 214 2000/01
Pokhara University, Pokhara 128 2000/01
B.P. Koirala Institute of Health Sciences, Dharan 860 2002
Source : Tribhuvan University, The 22nd Annual Report, and B.P.K. Institute of Health Sciences, Annual Report 2001-2002 and Plan of Action 2002-2003
Note : Constituent Campuses refer to campuses operated directly by the concerned univeristies. Thus private/affiliated campuses are not included here.
Until recently, higher education in Nepal was virtually synonymous with Tribhuvan University
(Constituent and Affiliated campuses). At present, the other universities have come up with large
number of affiliated campuses. At present, the total enrollment in constituent campuses of
different universities together exceeds 146,000. In 2053/54 (1996), the total enrollment in
constituent campuses of three universities (Tribhuvan University, Mahendra Sanskrit University
and Kathmandu University) was 106,887.

231
6.8.2 Tribhuvan University
This university is the oldest and largest university of the country. It has 5 Institutes (Engineering,
Medicine, Agriculture and Animal Sciences, Forestry and Science and Technology) and 4
Faculties (Education, Management, Law, and Humanities and Social Sciences). The university
has 61 Constituent campuses under the various Institutes and Faculties. It has a total of 177
affiliated (private) campuses conducting various academic programmes. In 2058/59 B.S.
(2001/2002 A.D.), the university had a total of 142,308 students enrolled in its constituent
campuses. Data on the enrollment in the affiliated campuses are not available.
The university enrollment in Technical Institutes and Faculties in 2058/59is shown in the Tables.
(Table 6.12 A and 6.12 B). From Table 6.12 A it is seen that 42.4% of T.U. enrollment is at
Certificate Level, 45.5% at Bachelor Level, 11.2% at Post Graduate Level, and about 1% at
'Others' category.
Further, girl students constituted 26% of total T.U. enrollment (constituent campuses) .In
Technical Institutes, girls constituted about 19% of total related enrollment, and in General
Faculties, the girl students constituted about 28% of total related enrollment.
The distribution of T.U. enrollment by Institutes and Faculties is shown in Table 6.12 B. and 6.13.
In 2058/59, 13.5% of T.U. enrollment was in Technical Institutes and 86.5% in General Faculties.
Data presented in Table 6.13 indicate that enrollment in Science and Technology at Certificate
and Bachelor Levels constitute major portion of Technical Institute enrollment. Engineering
education is seen to be expanding. In general higher education, the Management and
Humanities/Social Science faculties accounted for major proportion of total enrollment.
For comparision purposes, higher education enrollment status (in constituent campuses of
different universities in 2053/54) is presented in Table 6.12C. The total enrollment in that year
was 106,887. Enrollments by Institutes and General Faculties of Tribhuvan University, and by
Schools of Kathmandu University are also shown in the table. Significant increases have occurred
in enrollment in Tribhuvan University during 2053/54 and 2058/59. (Please refer to Table 6.12A
and 6.12B as well). There has occurred an 18% increase in Technical Institute enrollment
compared to 39% increase in General Faculty enrollment 39% over the five year period in
Tribhuvan University only.

232
Table 6.12 A : Enrolments by levels, Tribhuvan University constituent campuses, 2058/59.
Certificate Bachelor Post Graduate Others Total Institutes/Faculties
Total % Girls Total % Girls Total % Girls Total % Girls Total % Girls Technical Institutes 9873 19.2 7521 18.6 1770 18.9 19,164 18.9 General Faculties 50,470 30.8 57,315 25.9 14,230 19.4 1129 18.3 123,144 27.6
Total 60,343 28.8 64,836 25.0 16,000 19.3 1129 18.3 142,308 26.0 Proportion of enrollment by level 42.4 _ 45.6 _ 11.2 _ 0.8 _ 100.0 _
Table 6.12 B : Enrolment in Tribhuvan University by institutes and faculties (constituent campuses) 2058/59.
Institutes/Faculties Certificate Bachelors Post Graduate Others Total Technical Institutes 1. Engineering 2414 1487 173 4074 2. Agri. and Animal Science 101 536 81 718 3. Medicine 839 616 292 1747 4. Forestry 157 189 14 360 5. Science and Technology 6,362 4693 1,210 12265 Sub Total Technical 9,873 7521 1,770 19,164
General Faculties 6. Law 1924 92 2016 7. Management 12,814 19,072 5,547 37,433 8. Education 7758 13,308 1735 22,801 9. Hum. & Social Science 29,898 23,011 6,856 1129 60,894 Sub Total General 50,470 57,315 14,230 1129 123,144
Total 60,343 64,836 16,000 1129 142,308
Source : Tribhuvan University, The 22nd Annual Report of Tribhuvan University 2058/59

233
Table 6.12 C : Higher education enrollments: enrollments in constituent campuses 2053/54.
University Enrollment
1. Tribhuvan University (T.U.)
Institute of Engineering 1998
Institute of Agriculture and Animal Sciences 602
Institute of Medicine 1565
Institute of Forestry 410
Institute of Science and Technology 11655
Sub Total Technical 16230
Faculty of Law 3877
Faculty of Management 31534
Faculty of Education 10984
Faculty of Humanities and Social Sciences 42001
Sub Total General Faculty 88396
Total T.U. 104626
2. Mahendra Sanskrit University (M.S.U.) 1017
3. Kathmandu University (K.U.)
School of Science 865
School of Engineering 252
School of Management 71
School of Education 24
School of Arts 32
Total K.U. 1244
Grand Total (T.U., M.S.U., K.U.) 106887

234
Table 6.13 : Distribution of enrollment (constituent campuses) Tribhuvan University by institutes/ faculties, 2058/59.
Institute/Faculty Total Enrollment
Percent of Enrollment
Technical 1. Engineering 4074 2.9
2. Agriculture and Animal Science 718 0.5
3. Medicine 1747 1.2
4. Forestry 360 0.3
5. Science and Technology 12265 8.6
Sub Total Technical 19164 13.5
General Faculty
6. Law 2016 1.4
7. Management 37433 26.3
8. Education 22801 16
9. Humanities and Social Science 60894 42.8
Sub Total General 123144 86.5
Total 142308 100.0
Source : Planning Division, Tribhuvan University, The 22nd Annual Report of Tribhuvan University (2058/59).
6.8.3 Mahendra Sanskrit University
This university has 12 constituent campuses and a few affiliated campuses. There were 1606
students in the 12 constituent campuses with following levelwise distribution : Uttarmadhyama-
1070; Shastri-424; and Acharya-112. (Enrollment Data for 2057/58) (U.G.C. Annual Report of
University Grants Commission 2057/2058)
6.8.4 Kathmandu University
This private sector university has 6 constituent campuses (organized in Schools of Science,
Engineering, Management, Education, Medical Sciences and Arts). The total enrollment in these
campuses/schools was 1497 (25% girls) in 2057/58. The university has 12 affiliated colleges
(including 5 medical colleges) in different parts of the country. There were a total of 2491
students (40.6% girls) in these colleges in 2057/58. (UGC, Annual Report of University Grants
Commission, 2057/58)

235
6.8.5 Purbanchal University
This university functioning with state support has 2 constituent campuses, and 34 affilia ted
colleges/campuses. The two constituent campuses had a total of 214 students. The affiliated
colleges/campuses offer Bachelor courses on a number of subject areas such as Science,
Management, Engineering, Agriculture, Bio-chemistry, Education, Humanities and Law. The
affiliated colleges/campuses had a total of 1117 students in 2057/58. (UGC, Annual Report of
University Grants Commission 2057/58)
6.8.6 Pokhara University
This university conducts programmes in Management, Construction Management, Resource
Management under its three Faculties. It has 19 affiliated (private) campuses; these affiliated
campuses conduct courses on various areas such as Science, Bio-chemistry Management,
Engineering. Altogether, there were 128 students in the courses run by the university under its
Faculties. There were 1500 students in the private campuses affiliated to the university in
2057/58. (UGC, Annual Report of University Grants Commission, 2057/58)
Some notable trends in higher education are:
- The demand for professional courses like Engineering, Management, Medicine, and
specific job oriented areas is increasing.
- As the cost of taking up technical studies is increasing, the common people can hardly
afford the high fees charged by the private institutions. Seats in the campuses of Tribhuvan
University are very limited. The Engineering Institute has started course shifts charging
high fees, running in parallel with the regular fee courses.
- In the Faculty of Humanities and Social Sciences, (Tribhuvan University), the proportion of
total enrollment is high. But actual daily attendance of the students in the classes is reported
to be quite low. The failure rate of students in examination in Humanities and Social
Sciences are higher than that in Sciences, Management, and professional areas.
- Generally the private colleges affiliated to the universities do not have adequate physical,
and instructional facilities for conducting the studies.
- The Proficiency Certificate Level classes are being run by constituent and affilia ted
campuses of Tribhuvan University. The Kathmandu University and Mahendra Sanskrit
University continue to run their Certificate Level courses in their respective areas. At the
same time, the 10+2 programme is being expanded.

236
6.8.7 B. P. Koirala Institute of Health Sciences (BPKIHS), Dharan
The BPKIHS was established in 1993 as an autonomous Health Sciences University. The Institute
conducts MBBS programmes, B.Sc. in Nursing, Bachelor in Dental Surgery and a number of Post
Graduate programmes on various clinical sciences. In 2002, the BPKIHS had the following
number of students: 384 in MBBS, 160 in BDS, 75 in B.Sc. Nursing, 160 in Certificate level in
Nursing, 48 in MD/MS and 33 in other clinical areas.
6.9 Literacy Definition
In common interpretation, literacy is the knowledge of reading and writing. Those who can read
and write are called literates. A literate person is expected to be conversant with the three R' s -
reading, writing and arithmetic. Traditionally for census taking purposes in most countries, the
ability to read and write has been regarded as the minimal standard of literacy. Now a day,
literacy is interpreted in a wide and comprehensive sense. UNESCO came up with the concept of
functional literacy and added qualitative approach in 1965. It defined a person to be functionally
literate when he/she could read and write enough to be effective in the normal activities of life. It
is difficult to measure the extent of knowledge and skills required to carry on daily
responsibilities relating to work, and supporting one self and one's family. For census purposes,
the ability to read and write and do simple computation is enough basis for categorizing a person
as literate. Even this is difficult to measure precisely; and census-takers have to rely on
respondents to declare whether they are literate or not. It is not possible to test respondents about
literacy in census operation.
6.9.1 Literacy and Development
Education is one of the fundamental means for all for alleviating poverty and bringing
improvement in the standard of living through different socio -economic activities. So, literacy is
the most important single means of attaining socio-economic development and of opening for the
individual, the door to innovative ideas and actions. Literacy enhances access to information that
may be necessary to conduct various essential activities in daily life and work. It enables a person
to improve his knowledge base, acquire education informally and make progress in life. The
objective of 9th Plan (1997-2002) was to attend 70% literacy and that of the 10th plan to achieve
75% literacy by year 2007 for population 6 years and above and make all people literate at the end

237
of Twelfth Plan Period. UNESCO has made a worldwide call for eradicating illiteracy in the
member countries by the year 2000 A.D. The 'Education for all' Conference held in Jomtien,
Thailand (1990) called for action by the participating countries to reduce their respective illiteracy
rates by half, by the year 2000 A.D. The illiteracy should be abolished by the year 2015 AD
according to the Millennium Development Goals (MDGs) endorsed by UN in September 2001. In
the context of Nepal, since the illiteracy rate was 45.9 percent in 2001, the resolution implies that
illiteracy rate should be reduced drastically to meet the target endorsed by national and
international authorities.
Various measures are being taken in the country to raise the literacy rate. The expansion of free
primary education is the major contributing factor in raising the literacy rate. Primary education
tackles illiteracy at the source. However, there are large numbers of school dropouts especially
more girls, which adds to the numbers of illiterates.
Adult literacy activities are being carried out by various governmental and non-governmental
agencies in an integrated way. Literacy campaigns have been launched in some districts to
achieve literacy in a short period of time. Provisions are also made to distribute free textbooks for
girl students. Compulsory primary education is initiated in 5 districts. All these activities have
contributed to raise literacy in the country in recent years.
6.9.2 Census Data on Literacy
Censuses have been the main source of information on literacy situation in the country. Data on
literacy have been collected in all the censuses conducted since 1952/54. The concept of literacy
used in the censuses has remained almost uniform. The literacy competence was interpreted as
ability to read and write in any language in the censuses of 1952/54, 1961 and 1971. The 1981
census made a slight improvement in the definition of literacy. The literacy competence was
defined in this census as ability to read and write in any language with understanding. The 1991
and 2001 censuses made further improvement by defining literacy as ability to read and write
with understanding and to do simple arithmetic calculations. Census of 2001 categorized literacy
in two parts able to read and able to read and write with understanding in any language. The later
category was considered as literate in 2001 census. This provision further filtered the quality of
literacy consequentially literacy was reported to be in lower side than expected level in 2001.

238
6.9.3 Literacy Situation in 2001
Literacy rates by single ages from 6 years to 14 years and for various age groups for 1981 and
2001 are presented in Table 6.14. The overall literacy rate in 2001 was 54.1 percent for both
sexes, 65.5 percent for the males and 42.8 percent for females. Nepal Living Standard
Measurement Survey (NLSS) 1995/96 using the same definition as of 2001 census, found low
literacy rate of 37.8% (52.2% for males and 24.4% for females.)
Between Census Household Information, Monitoring and Evaluation System (BCHIMES)
conducted by Central Bureau of Statistics (CBS) in year 2000-reported literacy rate of 57.6%
(70.0% for males and 44.9% for females) using the literacy definition of 1991 census.
On examining the percent of population who reported as can read only to be 5.9 percent in 2001
census, there was some probability that some of them could be reported as literate and the literacy
rate could be noted more than that of reported figures in both the 1995/96 survey and the 2001
census.
The lower literacy rates among females are the result of a variety of historical, economic and
social reasons. Social prejudices against female education, restriction on mobility of females, low
social status granted to the females, the system of early marriage and low participation of females
in formal education are the main reasons for low female literacy rate. The situation is now rapidly
changing. Females have now greater access to primary as well as upper levels of education; and
education has become a necessity for social status as well as for economic betterment. There has
been a considerable increase in the literacy rate for the total population aged 6 years and above
between 1981 and 2001. The total literacy rate went up from 23.3 percent in 1981 to 54.1 percent
in 2001. The male literacy rate increased from 34.0 percent in 1981 to 65.5 percent in 2001.
Similarly, the female illiteracy rate went up from 12 percent in 1981 to 42.8 percent in
2001(Table 6.14 and Fig. 6.1).
6.9.4 Growth in Literacy Level by Sex
The overall literacy rate for population 6 years and above by sex and their growth over the years
is given in Table 6.14. It is seen that during 1981-2001, the total literacy rate has increased more
than two fold. The male literacy has increased less than double and the female literacy rate
increased more than three fold. The growth in the literacy rate has been greater for females than
that of males. Further, there has been an acceleration in the growth of literacy of females from

239
1991-2001 decade compared to 1981-1991 decade. This in itself is a proof of the effort made
towards eradication of illiteracy and encouragement of females to enroll in school system.
Table 6.14 : Literacy rate by age and sex, Nepal, 1981-2001.
Literacy Rate (%) 1981 1991 2001@ Age/Sex
Both Sexes
Male Female Both Sexes
Male Female Both Sexes
Male Female
All ages (6+) 23.3 34.0 12.0 39.6 54.5 25.0 54.1 65.5 42.8
Adults (15+) 20.6* 31.7* 9.2* 33.0** 49.2** 17.4** 48.6 62.7 34.9
6 Years 14.0 17.5 10.5 34.3 40.1 28.3 34.9 36.9 32.8
7 Years 20.3 26.2 14.5 46.1 54.4 37.6 52.9 55.8 49.9
8 Years 24.3 31.1 16.8 51.0 61.0 40.4 61.8 65.8 57.6
9 Years 29.5 38.3 20.4 58.3 69.3 46.9 72.8 76.8 68.7
6-9Years 21.6 27.8 15.2 47.0 55.7 38.0 54.7 58.0 51.4
10 Years 34.4 44.4 22.6 60.0 71.8 46.9 72.5 77.4 67.1
11 Years 42.5 54.7 28.5 68.4 80.4 55.3 81.9 86.0 77.6
12 Years 38.0 49.8 23.9 61.9 74.7 47.8 78.5 83.9 72.5
13 Years 42.2 56.2 26.4 65.5 79.2 51.0 82.5 87.7 77.2
14 Years 40.0 53.9 24.0 62.3 76.4 47.5 80.7 86.4 74.9
10-14 Years 38.8 50.8 21.2 63.2 76.0 49.3 78.6 83.7 73.3
15-19 Years 33.6 48.2 17.5 54.7 71.5 38.6 74.3 82.5 66.2
20-24 Years 26.5 41.7 12.6 43.8 64.3 26.3 65.0 78.2 53.4
15-24 years 30.0* 45.1* 15.0* 49.6** 68.2** 32.7** 70.1 80.6 60.1
25-29 Years 23.0 36.3 10.1 35.1 54.7 17.6 55.7 71.4 41.4
30-34 Years 19.3 31.8 7.8 31.0 49.6 13.9 49.7 67.7 32.6
35-39 Years 17.5 27.6 6.7 28.4 45.3 11.2 42. 4 60.3 24.7
40-44 Years 14.6 23.7 5.5 24.1 41.2 7.9 37.5 55.7 19.5
45-49 Years 14.2 22.2 5.0 21.7 36.5 6.3 33.7 51.3 15.4
50-54 Years 12.5 19.4 4.6 18.1 30.9 4.7 28.5 45.1 11.1
55-59 Years 13.3 20.7 4.5 17.2 28.5 4.2 25.7 41.1 8.3
60-64 Years 10.2 16.1 3.8 13.6 24.0 3.1 19.1 32.4 5.6
65+ Years 10.5 16.4 3.9 14.3 24.5 3.5 16.0 27.5 4.2
Source : CBS, 1995; Population Monograph of Nepal, Table 16 p.378.
@ CBS, 2002; population Census 2001, National Report Vol. II Table 11 p.136.
*CBS, 1984; Population Census 1981, Vol. I ,Part IV, Table 14 p.1
**CBS, 1993; Population Census 1991, Vol. I, Part X Table 30 p.1

240
Figure 6.1: Literacy rate for 6 years and above by sex 1981-2001, Nepal
0
10
20
30
40
50
60
70
1981 1991 2001
Year
Per
cent
Male
Female
Both sex
6.9.5 Growth of Literacy in Specific Age and Sex
The literacy rate was highest for single age13 years. It was 82.5% (87.7 % for males and 77.2%
for females) in 2001. The adult literacy rate (for age 15 years and above) was 48.6% (62.7% for
males and 34.9% for females) in 2001. That rate was 20.6 % in 1981 and 33% in 1991. The
literacy rate was 44.5% (62.3% for males and 28.3% for females) in Nepal Labour Force Survey
(NLFS) in 1998/99 conducted by CBS. The definition of NLFS was similar to that of 2001
census. The literacy rate for age group 15-24 was 70.1% (80.6% for males and 60.1% for females)
in 2001 that rate was 49.6 % in 1991. This shows that the literacy rate of younger generations are
increasing fast during recent years compared to earlier years due to expansion of educational
facilities and increasing awareness of the people.
A comparison of adult literacy in Nepal with South Asia Association of Regional Co-operation
(SAARC) countries would be instructive. The literacy was highest for males (96%) in Maldives
followed by Srilanka (94%), India (68%), Nepal (62%) all of them in 1999, Bangladesh (59%) in
1998 and Bhutan 56% in 1995. That indicator was highest for females in Maldives (96%)
followed by Srilanka (89%), India (44%), Bangladesh (43%) Pakistan (32%), Nepal and Bhutan
28% in the same time period. Therefore in terms of literacy achievement Maldives and Srilanka
recorded highest position among SAARC countries (Table 6.15).

241
Table 6.15 : Adult literacy rate in percent (15 years above) in South Asian Association of Regional Co-operation (SAARC) countries during 1990s.
Year Year (1990) (1995-99) Countries
Female Male Female Male Bhutan 23 51 28 56 (1995) Bangladesh 23 47 43 59 (1998) India 34 62 44 68 (1999) Maldives 92 93 96 96 (1999) Nepal 11 37 28 62 (1999) Pakistan 21 46 32 57 (1999) Srilanka 85 93 89 94 (1999)
Source : Asian Development Bank by Oxford University Press : 2001. p.40
Table 6.16 : Literacy rate and intercensal change by sex, Nepal 1981-2001 for population 6 years and above.
Percent Literate Inter-Censal Change (Average Annual Rate of Increase in %) Sex
1981 1991 2001 1981-91 1991-2001 1981-2001
Both Sexes 23.3 39.6 54.1 1.63 1.45 1.54
Male 34.0 54.5 65.5 2.05 1.10 1.58
Female 12.0 25.0 42.8 1.30 1.78 1.54
6.9.6 Age and Sex Patterns of Literacy in Rural and Urban Areas
The status of literacy by age and sex in 1991 and 2001 for the rural and the urban areas are
presented in Tables 6.17 & 6.18. The total literacy rate in the rural areas was 51.0 percent
compared to 71.9 percent in the urban areas in 2001. In the rural areas, 62.6 percent of the males
and 39.6 percent of the females were literate in 2001. In the urban areas, 81.2 percent of the males
and 61.9 percent of the females were literate in the same year 2001. There is evidently a wide
disparity in the literacy rates in the rural and urban area. The higher literacy rare in the urban areas
is attributable to the facts that there is greater necess ity of being literate in urban than in rural
areas, greater access to educational facilities and also greater awareness in the urban areas as well
as the tendency of educated rural people to migrate in urban areas for different job opportunities.
The liter acy rate in the rural areas grew from 36.8 percent in 1991 to 51.0 percent in 2001. While
the literacy rate in the urban areas grew from 66.9 percent in 1991 to 71.9 percent in 2001.

242
Literacy rate has improved much in the rural areas; the rural-urban difference in literacy rates has
declined substantially in this decade. It is likely that the difference will continue to prevail if
migration of educated persons from the rural areas to the urban areas continues as is happening at
present.
Table 6.17: Rural literacy rate by age and sex, Nepal 1991-2001
Rural Literacy Rate (%) 1991* 2001** Age/Sex
Both Sexes
Male Female Both Sexes
Male Female
All ages (6 Years+) 36.8 51.9 22.0 51.0 62.6 39.6 Adult (15 Years+) 29.7 46.0 14.2 45.0 59.4 31.2 6 Year 31.8 37.7 25.7 31.5 33.6 29.4 7 Year 43.7 52.3 34.9 50.0 53.1 46.9 8 Year 48.8 59.2 37.7 59.6 63.8 55.0 9 Year 56.1 67.8 44.3 70.7 74.9 66.4
6 - 9 Years 44.7 53.7 35.3 52.0 55.4 48.5 10Year 58.0 70.5 44.4 70.6 75.9 65.0 11Year 66.6 79.3 52.6 80.6 84.9 76.1 12Year 60.0 73.5 45.1 77.1 82.8 70.7 13Year 63.5 78.1 48.0 81.0 86.8 75.1
14 Year 60.1 75.2 44.3 79.1 85.4 72.6 10-14Years 61.2 74.8 46.6 77.0 82.5 71.2 15-19 Years 51.8 69.6 35.0 71.7 80.8 63.1 20-24 Years 39.8 61.2 22.0 61.4 75.8 49.0 15-24 Years 48.2* 67.2* 31.1* 76.0 78.6 56.5
25-29 Years 31.1 51.2 13.6 51.2 67.8 36.6 30-34 Years 27.3 46.0 10.4 45.1 63.9 27.8 35-39 Years 25.0 41.9 8.1 37.9 56.1 20.2 40-44 Years 21.1 37.8 5.5 33.2 51.4 15.7 45-49 Years 19.0 33.3 4.2 30.4 47.3 13.6 50-54 Years 15.9 28.1 3.1 26.6 42.5 10.1
55-59 Years 15.3 26.0 2.8 24.7 39.9 7.3 60-64 Years 12.0 21.8 2.2 18.5 31.6 4.9 65 Years+ 12.7 22.3 2.5 15.8 26.9 3.9
Source : * CBS 1995, Population Monograph of Nepal Table 18, p.380 and CBS 1994, Population Census Vol. I, Part X and Vol II
**CBS 2002, National Report Volume II Table 11 p.136 Special table generation

243
There has been an improvement in rural literacy rate during 1991-2001. The male rate went up
from 51.9 percent in 1991 to 62.6 percent in 2001. The female rate went up from 22 percent in
1991 to 39.6 percent in 2001.
Table 6.18: Urban literacy rate by age and sex, Nepal, 1991-2001.
Urban Literacy Rate (%) 1991 2001 Age Both
Sexes Male Female Both Sexes Male Female
6 years & above 66.9 78.0 54.8 71.9 81.2 61.9
15 years & above 62.5 76.0 47.8 68.3 80.0 55.8
6 Year 63.5 67.2 59.6 59.9 61.1 58.5
7 Year 73.7 77.4 69.7 73.9 75.3 72.3
8 Year 77.1 81.6 72.1 79.4 81.0 77.6
9 Year 82.4 86.5 78.0 87.2 89.2 84.9
6 – 9 Years 73.9 77.9 69.6 74.6 76.3 72.8
10 Year 81.3 86.2 75.7 85.7 88.3 82.8
11 Year 86.5 90.6 81.9 90.4 92.8 87.6
12 Year 82.4 87.1 76.9 88.0 90.7 84.8
13 Year 84.7 89.3 79.7 91.2 93.0 89.4
14 Year 83.0 87.8 77.8 90.2 92.4 88.0
10-14Years 83.4 88.0 78.2 88.9 91.2 86.4
15-19 Years 79.4 86.4 71.8 87.1 90.8 82.9
20-24 Years 73.8 85.1 62.1 82.0 89.0 75.2
15 – 24 Years 76.6* 85.8* 66.9* 84.7 90.0 79.1
25-29 Years 66.7 80.3 52.6 76.3 86.5 65.7
30-34 Years 63.1 77.8 46.8 71.7 84.4 57.7
35-39 Years 59.0 74.0 41.6 65.4 80.1 49.0
40-44 Years 54.0 71.4 33.8 60.9 77.0 42.4
45-49 Years 50.2 67.5 29.2 54.0 73.6 28.4
50-54 Years 43.9 61.7 23.6 42.8 63.9 18.4
55-59 Years 40.1 57.8 19.6 33.3 51.8 15.8
60-64 Years 33.3 51.8 14.9 24.2 40.4 11.0
65 Years+ 31.6 50.2 13.8 17.6 32.9 5.9
Source : CBS 1995, Population Monograph of Nepal Table 18, p. 380
* CBS 1994, Population Census 1991, Vol.II
CBS 2002, Population Census 2001 National Report Special Table

244
Figure 6.2: Literacy rate for 6 years and above by sex and rural- urban, Nepal, 1981-2001.
0
10
20
30
40
50
60
70
80
90
1981 1991 2001
Year
Per
cen
t Male Rural
Male UrbanFemale RuralFemale Urban
The urban literacy rate increased from 66.9 percent in 1991 to 71.9 percent in 2001. The male
literacy rate increased by 3 percentage points from 78 in 1991 to 81.2 in 2001. The female literacy
rate also increased by about 7 percentage points from 54.8 in 1991 to 61.9 in 2001. The gain in
literacy during 1991-2001 was greater for females than that of males in both urban and rural areas.
This implies that proportionately more females than males became literate in the rural areas
during 1991-2001(Table 6.17,6.18 and fig. 6.2). Urban literacy rate for 55 years and above in
2001 was noticed lower than that of 1991. One of the reasons was that in those categories only
can read percent was about 9 percent in urban and 6 percent in rural areas in 2001. If there was no
filtered question there was probability to include some of them in literate category.
6.9.7 Regional Variations in Literacy Rate
6.9.7.1 Literacy Rate by Development Regions
The status of literacy in 1991 and 2001 for development regions is presented in tables 6.19.
Western Development Region had the highest (59.3%) literacy rate followed by the Eastern
Development Region (55.7%) and Central Development Region (52.9%). The Mid- Western
Development Region with 49.4 percent and Far Western Development with 48.7 percent, are the
regions with relatively lower and nearly identical literacy rates in 2001. While EDR had the
highest (44.3%) and Mid- western had the lowest (31.8%) literacy rate in 1991. On examining the
literacy rate by gender in different development regions both males and females had the highest

245
(70.4% for male and 49.3% for females) literacy rate in WDR and lowest (61.1 % for male) in
MWDR and FWDR in 2001. The literacy for males was highest (59.3%) in EDR followed by
WDR and lowest (47.6%) for MWDR in 1991. On examining the female literacy, it was found
highest (29.2%) in EDR and lowest 13.3% in FWDR in 1991. During this decade female literacy
growth rate improved more than that of males in all the development regions.
The growth of literacy rate in different development regions during the same period is also given
in Table 6.19. During this decade Nepal gained literacy by 14.5 percentage points. The MWDR
gained the highest percentage point (17.6) and EDR gained the lowest (11.4) percentage points in
the same time period 1991 – 2001.
Table 6.19 : Literacy rate and inter-censal growth rate by development regions, 1991 and 2001.
1991
2001
Increase in Percentage
Points
Development
regions
Both Sexes Male Female Both
Sexes Male Female Both Sexes
EDR 44.3 59.3 29.2 55.7 66.5 45.0 11.4
CDR 38.6 52.0 24.6 52.9 63.7 41.6 14.3
WDR 44.0 58.5 28.9 59.3 70.4 49.3 15.3
MWDR 31.8 47.6 16.3 49.4 61.1 37.7 17.6
FWDR 32.2 52.0 13.3 48.7 64.7 33.2 16.5
Nepal 39.6 54.5 25.0 54.1 65.5 42.8 14.5
Source : CBS 1995, Population Monograph of Nepal Table 20 A, 20 B. p. 380
CBS 2002, Population Census 2001, National Report Vol. II Table 11
6.9.7.2 Literacy Rate by Ecological Zones and Eco -development Regions
The total literacy rate by ecological zones and eco-development regions is presented in Table 6.20
for 1991 and 2001. Among the ecological zones, the Hills had the highest literacy followed by
Terai and lowest in Mountain both in 1991 and 2001. The highest literacy was noted in Central
Hills followed by Western Hills and lowest in MWDR Mountain among the eco-development
regions both in 1991 and 2001.

246
Table 6.20 : Literacy rate by ecological zones, both sexes, 1991 and 2001 .
1991
Ecological Zones EDR CDR WDR MWDR FWDR Nepal
Mountains 45.1 31.1 47.0 22.0 31.2 33.2
Hills 44.6 48.4 48.0 31.6 30.6 43.9
Terai 44.0 30.8 36.6 35.0 34.4 36.5
Total 44.3 38.6 44.0 31.8 32.2 39.6
2001
Mountains 51.4 43.7 55.4 31.2 39.7 43..5
Hills 56.9 63.9 61.8 47.2 44.6 58.6
Terai 55.7 43.8 55.4 54.1 55.5 51.3
Total 55.7 52.9 59.3 49.4 48.7 54.1
Table 6.21 presents the literacy by sex and by eco development regions. The male and female
literacy rates in the Mountain zones were the lowest among different ecological zones. Over the
period 1981-2001, the total literacy rate in Mountains increased from 18.0 percent to 43.5 percent;
the literacy rate in Hill increased from 24.9 percent to 58.6 percent. Similarly the literacy rate in
the Terai increased from 22.5 percent to 51.3 percent. Relatively there has been a large increase
(in percentage points) on literacy rate in Hills followed by Terai and lowest in Mountain
ecological zones (Table 6.21).
As may be seen from Table geographic variations are not identical in all the development regions.
The Mountains in WDR have relatively high literacy rate (above the national average), compared
to the Mountains in other development regions. The Hills in CDR, WDR and EDR have
relatively higher literacy rate (above the national average) compared to the Hills in the other two
development regions. The Terai in all development regions has relatively higher and almost equal
literacy rate (also above or equal to the national average) compared to the Terai of central
development region in 2001. In general, the Mountain in EDR, CDR, MWDR, FWDR, the Hills
in MWDR, FWDR and Terai in CDR have relatively low literacy rates in 2001.

247
Table 6.21 : Literacy rate by sex and development regions, ecological zones and eco-development regions of Nepal, 1981-2001.
Literacy Rate (%) 1981 1991 2001
Regions/Zone Both
sexes Male Female
Both sexes
Male Female Both sexes
Male Female
EDR
Mountains
Hill
Terai
27.4
26.5
25.3
28.8
39.5
40.6
38.7
39.7
14.5
12.1
11.7
16.8
44.3
45.1
44.6
44.0
59.3
62.0
61.4
57.9
29.2
29.0
28.5
29.7
55.7
51.4
56.9
55.7
66.5
61.5
67.8
66.5
45.0
41.7
46.4
44.7
CDR
Mountains
Hill
Terai
22.7
15.6
28.6
18.8
32.3
23.6
39.3
27.5
12.5
6.9
28.9
9.3
38.6
31.1
48.4
30.8
52.0
46.5
63.0
43.0
24.6
15.7
33.6
17.8
52.9
43.7
63.9
43.8
63.7
55.1
74.7
54.6
41.6
32.4
52.7
32.2
WDR
Mountains Hill
Terai
25.8
22.4
27.5
22.1
38.3
31.4
41.3
32.2
13.2
12.4
25.9
11.0
44.0
47.0
48.0
36.6
58.5
59.2
63.6
49.9
28.9
33.5
34.7
23.0
59.3
55.4
61.8
55.4
70.4
63.5
73.0
66.7
49.3
45.8
52.4
44.0
MWDR
Mountains
Hill
Terai
16.4
12.3
16.1
18.3
25.2
19.3
25.8
26.5
7.3
4.7
20.6
9.3
31.8
22.0
31.6
35.0
47.6
36.9
49.4
48.4
16.3
6.4
14.6
21.2
49.4
31.2
47.3
54.1
61.1
46.2
60.5
64.0
37.1
14.7
34.5
44.2
FWDR
Mountains Hill
Terai
17.3
15.4
17.0
19.1
26.8
24.8
26.9
28.0
7.6
6.2
7.6
8.7
32.2
31.2
30.6
34.4
52.0
53.1
53.3
50.4
13.3
10.5
10.1
18.2
48.7
39.7
44.6
55.5
64.7
59.1
64.1
67.3
33.2
21.3
26.6
43.4
NEPAL
Mountains
Hill
Terai
23.3
18.0
24.9
22.5
34.0
27.6
36.9
32.1
12.0
7.8
12.9
11.9
39.6
33.2
43.9
36.5
54.5
50.2
60.2
49.8
25.0
16.5
28.5
22.7
54.1
43.5
58.6
51.3
65.5
56.9
70.6
62.1
42.8
30.4
47.3
40.1
Source : CBS,1995: Population Monograph of Nepal Table 21 p. 384
CBS 2002: Population Census 2001, National Report Vol. II Table 11

248
6.9.7.3 Literacy Rate by Rural/Urban Residence in the Development Regions
Literacy status by the rural and urban residence and by the development regions for 1991 and
2001 is presented in Table 6.22. It is seen that in 2001, the rural areas in WDR had the highest
(57.5%) literacy rate followed by rural EDR and lowest (46.9%) in rural CDR. The male literacy
rates are consistently higher than that of females in all the areas. It suggests that greater efforts
should be made to improve female literacy in all the areas. The data indicate greater efforts have
been made in providing education in the rural areas of WDR and EDR as compared to efforts
made in the rural areas of other development regions.
With regard to 2001, literacy rates in the urban areas in different development regions, the CDR
had the highest literacy rate (75.7%) and this is true for both the males and females literacy rates.
The second highest urban literacy rate (73.2%) is found in the WDR and lowest (60.3%) was in
FWDR. In 2001, the male literacy rate in the urban areas of all development regions was above 70
percent. It is surprising that the male literacy of urban in MWDR was found slightly less than that
of 1991. It might be due to inclusion of some of the rural areas to urban areas after 1991 census
and change of literacy definition. The female literacy rates in all the urban areas were above 46
percent in 2001.
Both the rural literacy rate and the urban literacy rate in the country showed improvement over
the period 1991 and 2001. As may be seen from Table 6.22, the rural literacy rate increased from
36.8 percent in 1991 to 51.0 percent in 2001; the urban literacy rate increased from 66.9 percent
in 1991 to 71.9 percent in 2001 exhibiting more increment in rural areas than that of urban areas
in terms of percentage points.
During the period 1991-2001, there has been an increase in literacy rate ranging from 11 to 17
percentages points in the rural areas of the development regions, the greatest increase being in
WDR and FWDR.
During the same period, increase in literacy rate in urban areas of the different development
regions varied between 3 and 8 percentage points. Higher increments (in percentage points) are
seen to have occurred in the case of WDR and FWDR as compared to those in other regions.

249
Table 6.22 : Literacy rate by rural-urban residence in development regions, Nepal 1991-2001.
1991 2001
Rural Urban Rural Urban
Dev.
Regions Both Sexes
Male Female Both Sexes
Male Female Both Sexes
Male Female Both Sexes
Male Female
Nepal 36.8 51.9 22.0 66.9 78.0 54.8 51.0 62.6 39.6 71.9 81.2 61.9
EDR 42.5 57.8 27.3 65.3 76.5 53.1 54.0 64.9 43.1 68.6 77.8 59.0
CDR 32.7 46.5 18.6 70.1 80.4 58.7 46.9 58.1 35.3 75.7 84.2 66.2
WDR 42.7 57.3 29.5 65.1 75.8 53.7 57.5 68.6 47.5 73.2 83.1 63.5
MWDR 30.5 46.4 14.9 61.3 72.9 48.7 48.1 60.1 36.4 62.2 72.1 52.1
FWDR 30.6 50.5 11.7 53.3 70.5 35.1 47.2 63.5 31.5 60.3 73.7 46.4
6.9.7.4 Literacy Rate by Districts
Literacy rate by districts for 1991 and 2001 are presented in Table 6.23. Among the districts,
Kathmandu occupied the first position with respect to literacy rate and is followed by Kaski and
Chitwan in 2001. The literacy rate in Kathmandu was 77.2 percent, while in Kaski and Chitwan
were 72.1 percent and 71.1 percent respectively. The lowest literacy rates were in Humla and
Mugu .
Table 6.23 : Literacy rate for population 6 years and above by sex for development regions and districts 1991-2001.
Literacy Rate 6 Years and Above
1981* 1991* 2001**
Region / District
Total Total Male Female Total Male Female
NEPAL 23.3 39.6 54.5 25.0 54.1 65.5 42.8
EDR 27.4 44.3 59.3 29.2 55.7 66.5 45.0
Taplejung 28.8 46.1 62.4 30.6 52.6 62.9 42.8
Panchathar 24.0 43.9 61.7 26.9 55.4 65.7 45.6
Ilam 33.0 52.5 65.9 39.0 66.5 74.4 58.6
Jhapa 37.0 56.3 67.8 44.5 67.1 75.6 58.8

250
Literacy Rate 6 Years and Above
1981* 1991* 2001**
Region / District
Total Total Male Female Total Male Female
Morang 30.5 48.9 62.2 35.2 57.0 67.1 46.8
Sunsari 30.8 44.7 59.1 60.2 60.6 70.9 50.3
Dhankuta 31.2 49.6 66.3 33.5 64.3 74.5 54.5
Terhathum 33.8 55.7 74.9 37.6 59.3 71.3 48.2
Sankhuwasabha 27.5 48.6 65.4 32.6 54.2 63.7 45.1
Bhojpur 23.7 41.9 58.9 26.3 54.8 66.1 44.4
Solukhumbu 21.8 38.9 56.8 21.5 45.9 56.7 35.5
Okhaldhunga 17.8 39.1 56.2 23.1 49.3 63.6 36.3
Khotang 22.9 40.3 58.4 23.6 50.2 62.3 38.8
Udayapur 19.3 38.2 55.2 21.5 53.6 64.8 42.5
Saptari 25.2 34.8 51.4 17.8 49.6 63.2 35.5
Siraha 17.6 28.8 43.5 13.3 40.7 53.6 27.1
CDR 22.7 38.6 52.0 24.6 52.9 63.7 41.6
Dhanusa 18.4 30.1 43.1 16.1 48.7 60.1 36.3
Mahotari 16.3 26.0 37.3 13.9 34.7 45.9 22.4
Sarlahi 15.6 26.2 38.0 13.5 36.5 46.9 25.4
Sindhuli 19.4 33.1 48.6 17.7 50.5 62.6 38.5
Ramechhap 17.8 30.4 49.3 12.9 39.4 53.8 26.6
Dolakha 17.5 34.9 53.1 17.7 51.1 64.0 38.8
Sindhupalchoke 15.1 29.7 44.1 15.0 40.6 51.8 29.5
Kavre 24.3 39.6 56.2 23.7 64.0 75.7 52.8
Lalitpur 37.1 62.4 76.5 48.0 70.9 81. 60.4
Bhaktapur 32.4 58.8 74.8 42.7 70.6 81.1 59.6
Kathmandu 50.0 70.1 82.2 57.0 77.2 86.5 66.6
Nuwakot 18.3 31.6 45.4 18.0 51.4 62.4 40.7
Rasuwa 9.2 23.0 33.8 11.3 34.3 42.8 24.8

251
Literacy Rate 6 Years and Above
1981* 1991* 2001**
Region / District
Total Total Male Female Total Male Female
Dhading 15.0 32.2 46.2 18.5 43.7 53.9 34.0
Makwanpur 24.1 38.6 52.1 24.7 63.4 72.6 53.9
Rautahat 12.6 23.7 34.7 11.9 32.7 42.9 21.7
Bara 17.9 28.2 41.7 13.7 42.7 55.2 29.1
Parsa 21.3 32.5 46.2 17.9 42.6 55.5 28.2
Chitawan 33.7 53.1 65.7 40.9 71.1 79.3 63.0
WDR 25.8 44.0 58.5 30.8 59.3 70.4 49.3
Gorkha 18.3 43.8 57.4 31.0 54.3 64.4 45.7
Lamjung 32.7 47.1 62.0 34.0 56.9 69.0 46.3
Tanahu 25.3 50.4 66.5 36.2 62.0 72.6 53.0
Syangja 28.1 51.3 66.9 38.4 66.7 77.9 57.7
Kaski 35.0 57.2 71.0 44.5 72.1 83.2 61.8
Manang 20.5 43.1 54.9 30.1 60.4 67.3 52.7
Mustang 23.3 48.5 60.8 34.8 52.1 61.1 41.1
Myagdi 22.1 39.6 55.0 26.1 56.0 67.9 45.9
Parbat 31.8 51.9 68.5 38.1 57.0 68.2 47.7
Baglung 23.2 41.1 57.3 27.5 61.7 73.1 52.3
Gulmi 31.8 46.8 64.6 32.7 57.8 70.1 48.1
Palpa 28.7 48.2 63.9 34.9 66.2 76.2 57.8
Nawalparasi 22.9 39.2 53.3 25.2 53.3 66.0 40.9
Rupandehi 27.5 40.0 53.4 26.2 66.2 76.2 55.9
Kapilbastu 13.2 28.8 41.1 15.5 41.8 53.3 29.5
Arghakhanchi 25.3 43.3 59.5 29.7 56.1 67.2 46.9
MWDR 16.4 31.8 47.6 16.3 49.4 61.1 37.7
Pyuthan 16.5 32.7 51.4 17.0 46.9 62.4 34.0
Rolpa 14.9 27.7 46.6 10.2 37.5 53.1 23.1

252
Literacy Rate 6 Years and Above
1981* 1991* 2001**
Region / District
Total Total Male Female Total Male Female
Rukum 13.8 28.8 46.8 11.3 40.3 51.0 29.0
Salyan 13.5 29.8 47.5 12.5 48.5 60.2 36.2
Dang 21.5 39.9 55.8 24.4 58.0 69.3 46.9
Banke 18.2 34.6 46.4 21.8 57.8 66.0 49.2
Bardiya 13.9 29.4 41.6 16.8 45.7 55.5 35.9
Surkhet 21.5 42.6 60.2 25.5 62.7 73.9 51.7
Dailekh 18.6 29.8 48.3 11.3 48.0 64.7 32.3
Jajarkot 11.5 23.6 38.0 9.0 39.5 49.4 29.1
Dolpa 12.6 23.3 37.5 8.4 35.0 49.6 19.8
Jumla 18.2 25.4 41.5 8.5 32.5 47.0 16.8
Kalikot 8.5 19.6 33.6 5.1 38.5 54.2 17.8
Mugu 9.5 22.0 37.9 5.2 28.0 45.4 9.3
Humla 13.1 19.6 33.7 4.6 27.1 41.3 11.8
FWDR 17.3 32.2 52.0 13.3 48.7 64.7 33.2
Bajura 11.6 25.2 43.4 7.7 34.1 51.2 17.3
Bajhang 12.9 27.6 50.1 7.0 35.5 57.6 15.2
Achham 14.9 23.9 45.3 5.5 33.8 54.1 16.0
Doti 12.5 28.6 48.7 9.9 43.7 61.2 26.0
Kailali 16.0 30.3 45.3 15.1 52.6 64.0 41.0
Kanchanpur 23.8 41.0 58.5 23.1 60.1 72.8 47.2
Dadeldhura 21.9 36.6 62.3 13.0 51.9 72.2 33.3
Baitadi 20.2 35.7 60.0 13.5 51.9 71.5 33.8
Darchula 22.5 41.4 65.4 18.0 49.5 67.4 32.5
Source : * CBS 1995, Population Monograph of Nepal, Table 23,pp. 387,388.
** CBS 2002, Population Census 2001, National Report, Vol. II Table 11 .

253
Kathmandu was the first, Lalitpur and Bhaktapur were in second and third position while Kalitkot
and Humla were in the lowest position in terms of literacy in1991.
From the distribution of districts by range of literacy rates, it is seen that 43 districts have literacy rate below 54 percent and 32 districts have literacy rate of 54 percent and above (Table 6.24).
Literacy rates have increased in all districts during 1991-2001. There were 5 districts having
literacy more than 71% and 14 districts with literacy 61-70% in 2001. There were no districts
with literacy rate less than 20% whereas there were two such districts in 1991.
Table 6.24: Number of districts with literacy range for 1991 and 2001.
No. of Districts Range of Literacy Rates
1991 2001
10% -20% 2 -
21% -30% 21 2
31% -40% 21 13
41% -50% 20 17
51% -60% 9 24
61% -70% 1 14
71% & above 1 5
Total Districts 75 75
6.9.7.5 Sex Differences in Literacy Rate- Spatial Variations
The status of literacy rate in 1991 and 2001 by sex is also presented in Table 6.23. As expected,
we can observe wide differences in literacy rates exist between males and females in all the
districts. Generally, the differences are particularly marked in the Mountain districts and in the
districts of Mid-Western and Far -Western Development Regions. In the districts with
predominantly urban areas, the differences in male and female literacy rates were observed to be
much smaller.
6.10 Educational Attainment - by Level for National and
Rural/Urban Residence
Considerable improvement in the level of literacy had been achieved in the country over the
years. The literacy level however, does not indicate over all the level of educational attainment of

254
the people. Among the literates there are persons who have been literate without undergoing any
formal schooling, as well as there are those who have completed different levels of formal
education. Expansion of educational facilities, implementation of free education up to secondary
school in recent years and awareness of the people has aided in the enhancement of educational
attainment.
Table 6.25 presents the summary distribution of population aged 6 and above by level of
education for the whole country from 1971 to 2001. The proportions of literate persons with
various levels of educational attainment were as follows:
Table 6.25: Level of educational attainment of literate persons 6 years and above by sex for census year 1991 and 2001.
2001* Level of Educational
Attainment
1971
(%)
1981
(%)
1991
(%) Both Sexes Male Female
Literate but no Schooling 4.42 5.50 8.98 4.73 5.54 3.92
Primary Education 5.79 11.33 16.15 22.65 25.70 19.62
Secondary Education 3.10 4.80 8.88 16.54 20.14 12.95
S.L.C./Intermediate 0.34 1.23 2.88 7.65 10.25 5.06
Graduate/Post Graduate 0.24 0.39 0.64 1.84 3.01 0.68
Level Not Stated -- -- 1.80 0.68 0.81 0.54
Total 13.89 23.25 39.33 54.09 65.45 42.77
Source : C.B.S. 1995, Table 24 p.390 ;
*CBS, 2002, Population Census 2001 National Report Vol. II Table 13, p.144,145
The proportion of people who were literate but had no formal education increased from 4.42
percent in 1971 to 5.5 percent in 1981, 8.98 percent in 1991 and decreased to 4.73 percent in
2001. This indicates increasing number of people learning to read and write through the formal
schooling system. The proportion of literate people who had gone through primary education
increased from 5.79 percent in 1971, 11.33 percent in 1981, 16.15 percent in 1991 and further
increased to 22.65% in 2001. Similarly, proportion of literate people who had secondary
education increased from 3.1 percent in 1971, 4.8 percent in 1981, 8.88 percent in 1991 and to
16.54 percent in 2001. This is evidently due to expansion of free primary and secondary education
facilities in the country.
Those who had passed S.L.C. and studied up to Intermediate level accounted 0.34 percent of the
literate population in 1971, 1.23 percent in 1981, 2.88 percent in 1991 and 7.65 percent in 2001.

255
Graduates and Postgraduate persons constituted a small proportion in all the census years. The
proportions were 0.24 percent in 1971, 0.39 percent in 1981 and 0.64 percent in 1991 and 1.84
percent in 2001.
Table 6.26 presents the percent of population aged 6 years and above by age groups, sex, levels of
educational attainment in the country for 1981-2001. There has been considerable improvement in
different levels of educational attainment during 1981-2001. In all the age groups, the proportions
of persons with different educational attainment levels were higher in 2001 compared to those in
the preceding censuses. This is true for both males and females. For example, the proportion of
population who had completed primary education was 22.7 percent (25.7 Percent males and 19.6
percent for females) in 2001. The corresponding proportions were 16.2 percent (21.2 percent for
males and 11.2 percent for females) in 1991 and 11.3 percent (15.7 percent for males and 6.8
percent for females) in 1981.
Tables 6.27 and 6.28 present the similar information for rural and urban areas of the country
during 1981 to 2001. The rural-urban differentials in educational attainment are clear when we
compare the proportions of population in these areas, who have completed various (specially after
primary) levels of education in 2001. The proportion of population who had completed secondary
education was15.6 percent for the rural areas, while that was 22.2 percent in the urban areas in
2001. Similarly, the proportions of urban population who had completed S.L.C., intermediate
education and graduate & post graduate levels were respectively 16.1 percent, 5.9 percent while
the corresponding proportions for the rural areas were 6.2 percent, and 1.1 percent respectively in
2001.
Attainment of a particular educational level in each specified age group was also higher in the
urban areas than that in the rural areas in 2001 as compared to earlier censuses. For example, the
proportion of people aged 6-9 years who have attained primary education was 48.9 percent in
rural areas and 64.7 percent in the urban areas in 2001. This trend is seems to hold true in all
specified age groups for each level of educational attainment.
The rural-urban differences in educational attainment are also noted. Higher proportions of
population were found completing different levels of education in the urban areas compared to
that of rural areas in 2001.

256
Table 6.26 : Percent of literate population aged 6 years and above by level of education, age and sex, Nepal 1981-2001
Year 1981* 1991* 2001**
Attainment\ Age Group 6 - 9 10-14 15-19 20-24 25-34 35+ Total 6 - 9 10-14 15-19 20-24 25-34 35+ Total 6 - 9 10-14 15-19 20-24 25-34 35+ Total
No Schooling Total 3.70 3.49 4.32 5.62 3.92 7.00 5.50 12.88 6.95 7.06 7.85 8.65 9.48 8.98 3.61 1.37 2.48 3.92 5.34 7.65 4.73 Male 4.44 4.12 5.32 8.06 10.03 11.39 8.13 14.76 7.28 7.33 9.57 12.24 15.60 12.06 3.87 1.23 1.93 3.12 4.95 10.81 5.54 Female 2.42 2.76 3.21 3.39 2.91 2.18 2.75 10.93 6.59 6.80 6.39 5.40 3.19 5.95 3.34 1.52 3.03 4.62 5.71 4.42 3.92
Primary (1-5) Total 17.92 29.37 12.93 8.35 3.88 4.06 11.33 30.16 44.24 15.09 9.35 7.09 3.45 16.15 50.75 57.43 16.15 11.78 10.21 6.78 22.65 Male 23.32 38.71 18.46 12.47 9.34 5.61 15.65 36.32 53.56 19.37 13.64 11.37 5.76 21.18 53.73 61.06 17.21 13.51 12.60 10.14 25.70 Female 12.32 18.47 6.85 4.59 3.44 2.36 6.80 23.78 34.14 10.99 5.71 3.23 1.09 11.19 47.68 53.60 15.11 10.26 7.99 3.35 19.62
Secondary (6-10) Total -- 5.87 4.60 8.23 3.16 1.78 4.80 -- 10.34 27.64 15.43 8.45 3.18 8.88 -- 19.46 44.11 25.13 17.53 7.65 16.54 Male -- 8.17 22.00 14.02 8.86 3.01 7.55 -- 13.29 38.33 23.85 13.96 5.32 12.85 -- 21.04 49.79 29.99 23.48 11.84 20.14 Female -- 3.44 6.45 2.94 1.61 0.42 1.92 -- 7.14 17.38 8.26 3.47 0.99 4.97 -- 17.78 38.52 20.82 12.00 3.37 12.95
SLC & Intermediate Total -- 0.12 1.69 3.57 1.51 0.69 1.23 -- 0.02 3.54 8.87 5.72 1.84 2.88 -- -- 11.02 21.04 13.80 5.54 7.65 Male -- 0.02 2.33 5.97 4.21 1.19 1.98 -- 0.02 4.88 14.16 9.61 3.13 4.48 -- -- 13.05 27.17 19.04 8.90 10.25 Female -- 0.01 0.98 1.38 0.78 0.13 0.45 -- 0.02 2.26 4.38 2.21 0.52 1.31 -- -- 9.01 15.61 8.94 2.09 5.06
Graduate & Post graduate Total -- -- 0.07 0.73 0.65 0.37 0.39 -- -- 0.05 0.83 1.62 0.89 0.64 -- -- -- 2.48 4.82 2.45 1.84 Male -- -- 0.10 1.16 1.83 0.64 0.65 -- -- 0.07 1.29 2.70 1.54 1.06 -- -- -- 3.58 7.93 4.26 3.01 Female -- -- 0.05 0.34 0.33 0.64 0.13 -- -- 0.04 0.44 0.63 0.23 0.23 -- -- -- 1.50 1.93 0.59 0.68
Level Not Stated Total -- -- -- -- -- -- -- 3.41 1.40 1.06 1.20 1.47 1.92 1.80 0.36 0.36 0.52 0.69 1.21 0.74 0.68 Male -- -- -- -- -- -- -- 3.99 1.63 1.20 1.51 2.17 3.29 2.53 0.39 0.36 0.55 0.85 1.62 0.90 0.81 Female -- -- -- -- -- -- -- 2.80 1.16 0.93 0.94 0.84 0.53 1.09 0.33 0.36 0.49 0.56 0.83 0.58 0.54
Sources : * CBS 1995, Table 24 p. 390
** CBS 2002, Population Census 2001, Vol II Table 13 pp 144, 145

257
Table 6.27 : Percent of literate population aged 6 years and above by level of education, age and sex for rural Nepal 1991-2001.
Year 1991* 2001** Attainment Age Group 6 - 9 10-14 15-19 20-24 25-34 35+ Total 6 - 9 10-14 15-19 20-24 25-34 35+ Total
No Schooling Total 12.43 6.96 6.98 7.42 8.40 9.07 8.74 2.87 1.28 1.92 3.84 5.27 7.82 4.59 Male 14.36 7.31 7.28 9.64 12.34 15.45 11.99 3.37 1.17 1.73 3.02 5.03 11.30 5.64 Female 10.44 6.57 6.70 6.13 4.91 2.58 5.57 2.36 1.39 2.10 4.55 5.49 4.27 3.57
Primary (1-5) Total 28.40 43.55 15.51 9.56 7.12 3.29 15.88 48.86 57.54 17.18 12.51 10.59 6.66 22.88 Male 34.86 53.47 20.21 14.44 11.85 5..67 21.27 51.75 61.46 18.76 14.72 13.56 10.24 26.29 Female 21.74 32.86 11.06 5.52 2.94 0.86 10.61 45.89 53.40 15.66 10.60 7.91 3.02 19.54
Secondary (6-10) Total -- 9.04 25.70 14.32 7.48 2.62 7.93 -- 17.83 43.85 24.55 16.77 6.81 15.56 Male -- 12.14 37.09 23.34 13.17 4.63 11.98 -- 19.49 49.98 30.65 23.51 10.94 19.38 Female -- 5.70 14.93 6.85 2.44 0.58 3.97 -- 16.08 37.95 19.27 10.69 2.60 11.80
SLC & Intermediate Total -- 0.01 2.29 6.44 4.08 1.15 1.96 -- -- 8.31 18.19 11.47 4.58 6.19 Male -- 0.01 3.48 11.37 7.68 2.12 3.35 -- -- 9.72 23.95 16.75 7.67 8.56 Female -- 0.01 1.17 2.36 0.88 0.15 0.60 -- -- 6.95 13.21 6.71 1.43 3.87
Graduate & Post graduate Total -- -- 0.03 0.38 0.69 0.32 0.26 -- -- -- 1.59 3.04 1.50 1.14 Male -- -- 0.04 0.70 1.32 0.62 0.48 -- -- -- 2.50 5.39 2.73 1.97 Female -- -- 0.01 0.11 0.13 0.03 0.04 -- -- -- 0.81 0.93 0.24 0.32
Level Not Stated Total 3.31 1.40 1.03 1.15 1.39 1.79 1.73 0..30 0.37 0 .48 0.71 1.24 0.65 0.64 Male 3.92 1.64 1.19 1.49 2.13 3.16 2.48 0.32 0.37 0.57 0.91 1.70 0.78 0.78 Female 2.68 1.14 0.88 0.88 0.74 0.39 1.00 0.27 0.36 0.40 0.54 0.83 0.51 0.50
Sources: * CBS 1995, Table 25 p. 392
** CBS 2002, Population Census 2001,Special table generated

258
Table 6.28 : Percent of literate population aged 6 years and above by level of education, age and sex for urban, Nepal 1991-2001.
Year 1991* 2001** Attainment\Age Group 6 - 9 10-14 15-19 20-24 25-34 35+ Total 6 - 9 10-14 15-19 20-24 25-34 35+ Total
No Schooling Total 18.03 6.85 7.72 8.86 10.71 13.79 11.27 9.07 1.96 5.33 4.26 5.68 6.58 5.49 Male 19.32 6.90 7.73 9.11 11.48 17.28 12.63 7.48 1.62 2.88 3.54 4.62 7.72 5.00 Female 16.64 6.78 7.71 8.59 9.88 9.86 9.80 10.80 2.32 8.05 4.97 6.80 5.38 6.01
Primary (1-5) Total 50.50 51.19 11.58 7.77 6.85 5.19 18.74 64.70 56.74 10.99 8.40 8.39 7.59 21.29 Male 52.97 54.45 12.70 8.30 7.75 6.64 20.36 67.91 58.47 9.93 8.24 8.41 9.51 22.41 Female 47.86 47.51 10.36 7.23 5.89 3.55 16.97 61.24 54.88 12.16 8.56 8.37 5.55 20.08
Secondary (6-10) Total -- 23.51 44.02 23.75 16.47 9.10 17.97 -- 29.85 45.45 27.83 21.12 13.11 22.19 Male -- 24.75 48.02 27.33 19.91 12.23 20.66 -- 30.82 48.93 27.14 23.37 17.50 24.40 Female -- 22.10 39.63 20.05 12.79 5.59 15.02 -- 28.80 41.56 28.52 18.72 8.44 19.85
SLC & Intermediate Total -- 0.08 14.10 27.13 19.25 9.11 11.62 -- -- 24.63 34.31 24.81 11.72 16.07 Male -- 0.07 15.93 32.85 24.01 13.16 14.56 -- -- 28.64 41.15 28.97 16.69 19.64 Female -- 0.09 12.10 21.21 14.15 4.56 8.41 -- -- 20.16 27.56 20.38 6.46 12.26
Graduate & Post graduate Total -- -- 0.27 4.26 9.23 6.79 4.28 -- -- -- 6.60 13.20 8.58 5.91 Male -- -- 0.29 5.29 13.02 10.72 6.26 -- -- -- 8.31 18.94 13.97 8.78 Female -- -- 0.25 3.19 5.19 2.39 2.13 -- -- -- 4.92 7.08 2.87 2.87
Level Not Stated Total 4.56 1.44 1.33 1.58 2.14 3.35 2.49 0.81 0.34 0.70 0.62 1.04 1.35 0.91 Male 4.85 1.53 1.29 1.68 2.46 4.54 2.96 0.83 0.30 0.46 0.57 1.25 1.69 1.00 Female 4.25 1.33 1.38 1.46 1.80 2.01 1.99 0.79 0.37 0.98 0.67 0.82 0.99 0.80
Source : * CBS 1995 Table 26 p. 393
** Population Census 2001, Special table generated

259
6.11 School Attendance Status of 6-25 Years Age Population who
have not Passed 10th Grade
Data on educational attainment serves important information for policy and program managers to
assess the educational system up to secondary level after the restoration of multi party democracy
system in the country in 1991. Data on school attendance, however, provides a more complete
picture in this respect. Data on current status of school attendance for population 6-25 years of age
who have not passed 10th grade was collected both in the censuses of 1991 and 2001. This type of
data is useful in knowing what percentage of people 6-25 years of age are attending or had
attended schools at different levels sometimes before census. Tables 6.29 and 6.30 present
national data on proportion of 6-25 years of age population currently attending school and who
have not passed 10 th grade respectively for the years 1991 and 2001. It also shows proportion of
6-25 years old who had been through various levels of school education previously but are not
currently attending schools.
The overall current attendance of persons, 6 to 25 years of age in educational institutions was
46.6% (51.4 percent for males and 41.9 percent for females) in 2001. Of these, 1.6 percent was in
beginners (pre-primary) classes, 29.4 percent in primary (grades I-V) classes and 15.7 percent in
the secondary level (VI-X) classes. Among males, 1.6 percent was in the beginner's classes, 32.1
percent in the primary classes, and 17.7 percent in the secondary classes. For females, 1.6 percent
was in beginners classes, 26.7 percent were in primary and 13.6 in the secondary classes. The
male's attendance rate is seen to be considerably higher than the female's rate at all levels of
education (Table 6.30).
6.11.1 School Attendance Status of 6 - 25 Years Age Population in
National Level 1991 - 2001
It is further seen that 52.6 percent of the 6-9 years old population were in different levels i.e. 3.5
percent in the beginners and 49.2 percent in primary classes (category) in 2001. Also about 55
percent of the 10-14 years age group population was in the beginners and primary classes. It is
seen that 18.8 percent of 10-14 years population were at secondary level. It is further seen that of
the 43.4 percent of 15-19 years population, 0.8 percent were beginners, 7.2 percent in primary
classes and 35.4 percent in the secondary level. The current attendance of different age groups in

260
preprimary, primary and secondary education is indicated by the data. For instance, currently 49.2
percent of 6-9 year persons, 54.2 percent of 10-14 year persons and 7.2 percent of 15-19 year
persons are attending primary schools. The total school attendance rates are 52.6 percent for 6-9
years old, 74.0 percent for 10-14 years old, 43.4 percent for 15-19 years old and 9.3 percent for
20-24 years and 8.9 percent 25 years old who have not passed 10 th grade in 2001. A high
proportion (35.4%)of 15-19 years old are in secondary schools. On examining the same indicators
with 1991 census it was found that there was marked improvement during 1991 and 2001(Tables
6.29 and 6.30).
Tables 6.29 and 6.30 also present data on those who were in school some time ago but are no
longer attending school now. Such persons constituted 12.8 percent of the 6-25 years age group
population who have not passed 10th grade. Of such persons, 13.6 percent were males, and 12.0
percent were females. Further 1.3 percent had been out of school after attending beginner classes,
5.6 percent after attending primary schools and 5.9 percent after attending secondary schools in
2001. There were 8.6 percent of 6-25 years group who were not attending school in 1991. The
proportion of population who attended earlier and not attending present are generally increasing
over the years but not substantially (tables 6.29 and 6.30). The specific age assigned for primary
is 6-10, for secondary 11-15 years of age. There are high proportions of population attending
school in their late ages (Table 6.29 and 6.30) but the situation is found improving in 2001 as
compared to that of 1991.
6.12 School Attendance by Rural/Urban Residence
The census also presents data on proportion of population 6 to 25 years of age and who have not
passed 10th grade by current status of school attendance for the rural and the urban areas. Data for
the rural areas are presented in Tables 6.31 for 1991 and 6.32 for 2001.
The proportion of population in school attendance in rural areas (Tables 6.31 and 6.32) indicates
the following: The proportion of population 6 to 25 years of age who have not passed 10 th grade,
currently attending schools was 42.2 percent for both sexes in 2001. The attendance rates for the
males were 50.4 percent and for the females 40.1 percent. Further 1.3 percent of the 6-25 years
population was in the beginners classes, 29.3 percent in primary classes, and 14.6 percent in the
secondary education in the rural areas in 2001. This indicates that in rural areas, the proportion of

261
population currently attending school is higher for males as compared to that with females in
2001. There were greater percent of population in school currently attending in young ages in
2001 as compared to that of 1991. The total population currently attending schools was 29.6
percent in 1991. On examining age specific grade, the situation has improved mark ably during
1991 and 2001.
Similarly for the urban areas data on proportion of 6-25 years population by current status of
school attendance is presented in tables 6.33 for 1991 and 6.34 for 2001. In the urban areas, 54.0
percent of the 6-25 years population was attending schools in 2001. Of these 3.5 percent were in
beginner classes, 29.0 percent in primary schools, and 21.6 percent in secondary schools. The
proportions of school attendance were 55.7 percent for the males, and 52.2 percent for females in
2001. That proportions currently attending school was 40.2 percent for both sexes in 1991. A
small difference is noted in case of male and female school attendance rates in 2001 as compared
to that of 1991 in urban areas.
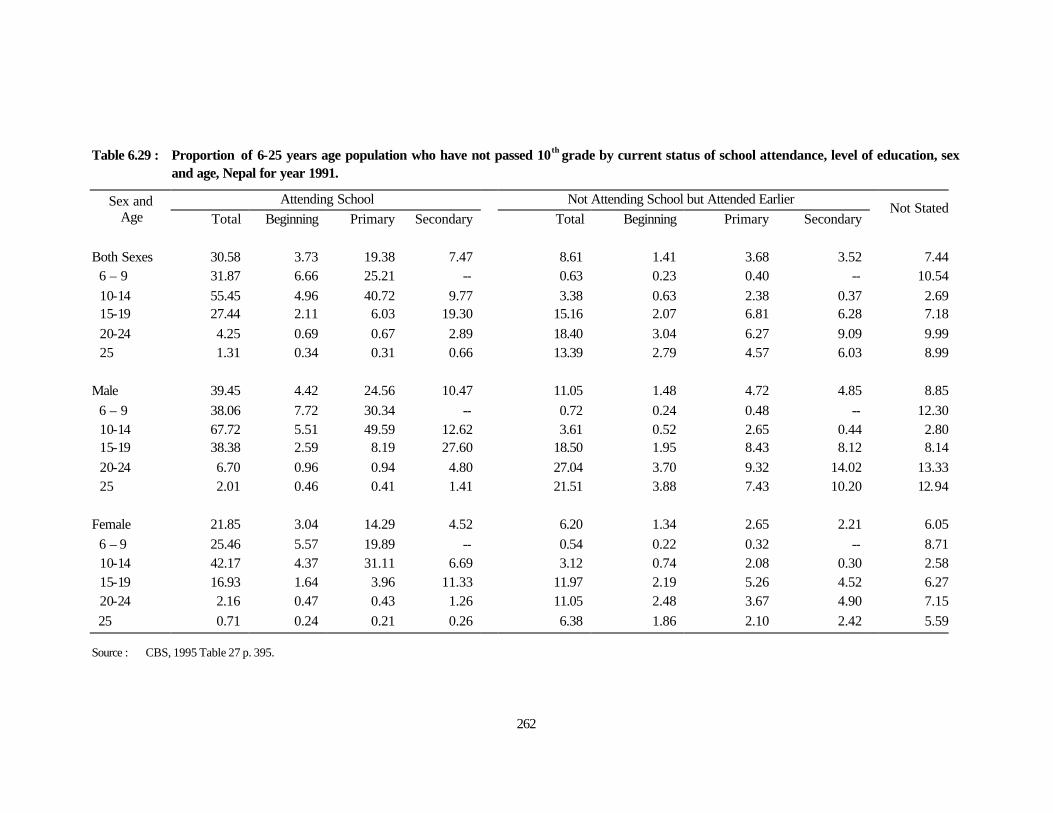
262
Table 6.29 : Proportion of 6-25 years age population who have not passed 10th grade by current status of school attendance, level of education, sex and age, Nepal for year 1991.
Attending School Not Attending School but Attended Earlier Sex and Age Total Beginning Primary Secondary Total Beginning Primary Secondary
Not Stated
Both Sexes 30.58 3.73 19.38 7.47 8.61 1.41 3.68 3.52 7.44 6 – 9 31.87 6.66 25.21 -- 0.63 0.23 0.40 -- 10.54 10-14 55.45 4.96 40.72 9.77 3.38 0.63 2.38 0.37 2.69 15-19 27.44 2.11 6.03 19.30 15.16 2.07 6.81 6.28 7.18 20-24 4.25 0.69 0.67 2.89 18.40 3.04 6.27 9.09 9.99 25 1.31 0.34 0.31 0.66 13.39 2.79 4.57 6.03 8.99
Male 39.45 4.42 24.56 10.47 11.05 1.48 4.72 4.85 8.85 6 – 9 38.06 7.72 30.34 -- 0.72 0.24 0.48 -- 12.30 10-14 67.72 5.51 49.59 12.62 3.61 0.52 2.65 0.44 2.80 15-19 38.38 2.59 8.19 27.60 18.50 1.95 8.43 8.12 8.14 20-24 6.70 0.96 0.94 4.80 27.04 3.70 9.32 14.02 13.33 25 2.01 0.46 0.41 1.41 21.51 3.88 7.43 10.20 12.94
Female 21.85 3.04 14.29 4.52 6.20 1.34 2.65 2.21 6.05 6 – 9 25.46 5.57 19.89 -- 0.54 0.22 0.32 -- 8.71 10-14 42.17 4.37 31.11 6.69 3.12 0.74 2.08 0.30 2.58 15-19 16.93 1.64 3.96 11.33 11.97 2.19 5.26 4.52 6.27 20-24 2.16 0.47 0.43 1.26 11.05 2.48 3.67 4.90 7.15 25 0.71 0.24 0.21 0.26 6.38 1.86 2.10 2.42 5.59
Source : CBS, 1995 Table 27 p. 395.

263
Table 6.30 : Proportion of 6 - 25 years age population who have not passed 10th grade of education by current status of school attendance, level of education, sex and age, Nepal for year 2001
Attending School Not Attending School but Attended Earlier Sex and Age Total Beginner Primary Secondary Total Beginner Primary Secondary
Not Stated
NEPAL Both Sexes 46.62 1.61 29.35 15.67 12.76 1.26 5.64 5.86 0.02 6 – 9 52.63 3.45 49.18 -- 1.69 0.21 1.47 -- -- 10 - 14 73.98 0.98 54.25 18.76 4.31 0.44 3.18 0.70 0.02 15 - 19 43.39 0.82 7.19 35.38 19.41 1.72 8.96 8.73 0.04 20-24 9.27 1.15 1.91 6.21 31.70 2.91 9.87 18.92 0.06 25 8.93 1.69 2.38 4.86 24.43 2.53 7.82 14.08 0.10 Male 51.39 1.63 32.05 17.71 13.55 0.97 6.01 6.57 0.02 6 - 9 55.83 3.72 52.11 -- 1.73 0.21 1.51 -- -- 10 - 14 79.06 0.98 57.79 20.29 4.30 0.29 3.26 0.75 0.02 15 - 19 49.12 0.77 7.92 40.42 19.88 1.23 9.28 9.37 0.06 20-24 10.60 0.95 2.17 7.48 36.23 2.38 11.34 22.51 0.05 25 9.79 1.45 2.63 5.70 30.65 2.39 9.71 18.56 0.08 Female 41.90 1.59 26.67 13.64 11.98 1.56 5.27 5.15 0.02 6 – 9 49.32 3.17 46.15 -- 1.64 0.22 1.43 -- -- 10 – 14 68.60 0.97 50.49 17.13 4.33 0.59 3.10 0.65 0.01 15 – 19 37.74 0.86 6.47 30.41 18.95 2.21 8.64 8.10 0.03 20-24 8.09 1.33 1.68 5.08 27.69 3.38 8.58 15.74 0.06 25 8.16 1.90 2.15 4.11 18.81 2.66 6.11 10.04 0.12
Source : Population Census 2001, Special table generated.

264
Table 6.31 : Proportion of 6 to25 years of age who have not passed 10 t h grade of education by current status of school attendance, level of education, sex and age, for rural Nepal, census year 1991.
Attending School Not Attending School but Attended Earlier Sex and Age Total Beginning Primary Secondary Total Beginning Primary Secondary
Not stated
Both Sexes 29.55 3.72 19.07 6.76 8.40 1.41 3.74 3.25 7.01 6 – 9 30.43 6.59 23.84 -- 0.62 0.23 0.39 -- 9.79
10-14 53.56 4.99 40.05 8.52 3.37 0.64 2.39 0.34 2.62 15-19 26.18 2.03 6.24 17.91 15.03 2.10 7.02 5.91 6.98 20-24 4.04 0.64 0.67 2.73 18.17 3.09 6.51 8.57 9.40 25 1.23 0.32 0.30 0.61 13.06 2.78 4.67 5.61 8.23
Male 38.96 4.46 24.63 9.87 11.03 1.50 4.87 4.66 8.49 6 – 9 36.92 7.69 29.23 -- 0.72 0.24 4.48 -- 11.58
10-14 66.59 5.58 49.50 11.51 3.63 0.53 2.68 0.42 2.71 15-19 37.84 2.53 8.62 26.69 18.73 1.99 8.81 7.93 8.01
20-24 6.64 0.91 0.97 4.76 27.73 3.86 9.99 13.88 13.04 25 1.94 0.43 0.42 1.09 21.71 3.96 7.78 9.97 12.33
Female 20.38 3.01 13.65 3.72 5.84 1.33 2.63 1.88 5.57 6 – 9 23.73 5.46 18.27 -- 0.52 0.22 0.30 -- 7.93
10-14 39.51 4.35 29.86 5.30 3.10 0.75 2.08 0.27 2.52 15-19 15.16 1.56 3.98 9.62 11.53 2.21 5.32 4.00 6.00
20-24 1.88 0.42 0.41 1.05 10.23 2.44 3.62 4.17 6.38 25 0.62 0.22 0.20 0.20 5.68 1.76 2.01 1.91 4.73
Source : CBS 1995 Table 28 p. 396.

265
Table 6.32 : Proportion of 6 - 25 years age population who have not passed 10t h grade of education by current status of school attendance, level of education, sex and age, rural Nepal for year 2001.
Attending School Not Attending School but Attended Earlier Sex and Age Total Beginner Primary
(1-5) Secondary
(6-10)
Total Beginner Primary (1-5)
Secondary(6-10)
Not Stated
Both Sexes 42.18 1.27 29.31 14.60 12.71 1.17 5.85 5.69 0.01 6 – 9 50.03 2.71 47.31 -- 1.48 0.16 1.32 -- -- 10 – 14 72.11 0.91 54.09 17.11 4.14 0.39 3.13 0.62 0.01 15 – 19 42.82 0.59 7.61 34.62 19.31 1.35 9.33 8.63 0.03 20-24 8.42 0.99 1.73 5.70 32.66 2.99 10.79 18.88 0.04 25 6.47 1.21 1.82 3.45 21.47 2.21 7.24 12.02 0.08
Male 50.41 1.38 32.28 16.74 13.74 0.95 6.31 6.48 0.01
6 – 9 53.33 3.21 50.12 -- 1.54 0.17 1.37 -- -- 10 - 14 77.49 0.93 57.87 18.70 4.11 0.27 3.18 0.66 0.02 15 - 19 49.10 0.66 8.59 39.85 20.28 1.11 9.86 9.31 0.04 20-24 10.05 0.81 2.03 7.20 38.87 2.44 12.79 23.64 0.03 25 7.33 1.04 2.12 4.17 27.78 2.10 9.28 16.40 0.05
Female 40.07 1.19 26.39 12.50 11.69 1.37 5.41 4.91 0.01
6 – 9 46.65 2.21 44.43 -- 1.42 0.15 1.27 -- -- 10 - 14 66.42 0.90 50.09 15.43 4.17 0.52 3.07 0.58 0.01 15 - 19 36.75 0.55 6.67 29.53 18.37 1.56 8.81 8.00 0.02 20-24 7.03 1.14 1.48 4.41 27.35 3.45 9.09 14.81 0.04 25 5.71 1.35 1.54 2.81 15.84 2.32 5.42 8.11 0.10
Source: Population Census 2001, Special table generated

266
Table 6.33 : Proportion of 6 to 25 years of age who have not passed 10th grade of education by current status of school attendance, level of edu cation, sex and age, for urban Nepal, census year 1991.
Attending School Not Attending School but Attended Earlier Sex and Age Total Beginning Primary Secondary
Total Beginning Primary Secondary
Not stated
Both Sexes 40.23 3.74 22.35 14.14 10.53 1.43 3.15 5.95 11.39
6 – 9 48.53 7.47 41.06 -- 0.80 0.28 0.52 -- 19.19 10-14 74.60 4.67 47.49 22.44 3.45 0.56 2.25 0.64 3.49 15-19 38.04 2.72 4.29 31.03 16.33 1.82 5.08 9.43 8.95 20-24 5.81 1.08 0.69 4.04 20.13 2.69 4.47 12.97 14.45 25 2.03 0.57 0.33 1.13 16.28 2.95 3.72 9.61 15.64
Male 43.80 4.05 23.98 15.77 11.26 1.36 3.38 6.52 11.97
6 – 9 52.00 8.05 43.05 -- 0.81 0.28 0.53 -- 20.39 10-14 78.87 4.81 50.44 23.62 3.55 0.49 2.38 0.68 3.70 15-19 42.64 3.02 4.84 34.78 16.68 1.64 5.43 9.61 9.13 20-24 7.12 1.30 0.77 5.05 22.36 2.65 4.82 14.89 15.27 25 2.51 0.68 0.32 1.51 19.88 3.24 4.52 12.12 17.88
Female 36.40 3.41 20.59 12.40 9.74 1.50 2.89 5.35 10.76
6 – 9 45.78 6.86 38.92 -- 0.80 0.28 0.52 -- 17.91 10-14 69.81 4.52 44.17 21.12 3.33 0.63 2.10 0.60 3.25 15-19 33.02 2.38 3.70 26.94 15.94 2.01 4.69 9.24 8.75 20-24 4.44 0.85 0.61 2.98 17.82 2.74 4.10 10.98 13.60 25 1.57 0.46 0.33 0.78 12.82 2.68 2.94 7.20 13.50
Source: CBS 1995 Table 29 p. 397

267
Table 6.34 : Proportion of 6 - 25 years age population who have not passed 10t h grade of education by current status of school attendance, level of education, sex and age, urban Nepal for year 2001.
Attending School Not Attending School but Attended Earlier Sex and Age Total Beginner Primary Secondary Total Beginner Primary Secondary
Not Stated
Both Sexes 54.04 3.48 28.99 21.57 14.23 1.94 4.95 7.33 0.09 6 – 9 72.61 9.00 63.60 -- 2.81 0.57 2.24 -- -- 10 – 14 86.69 1.42 55.47 29.80 5.23 0.69 3.38 1.16 0.04 15 – 19 46.62 2.18 5.08 39.36 19.85 3.66 6.72 9.46 0.12 20-24 11.40 1.65 1.96 7.79 29.02 2.79 6.38 19.85 0.15 25 21.90 4.21 5.34 12.36 39.82 4.20 10.84 24.78 0.24
Male 55.69 2.87 30.07 22.75 13.81 1.25 4.97 7.58 0.10 6 – 9 74.68 7.55 67.12 -- 2.72 0.46 2.26 -- -- 10 – 14 89.90 1.33 57.60 30.98 5.16 0.44 3.49 1.23 0.05 15 – 19 49.32 1.33 4.75 43.24 17.70 1.88 6.01 9.81 0.17 20-24 10.91 1.37 1.92 7.63 27.13 2.27 6.09 18.77 0.13 25 22.30 3.52 5.20 13.57 45.03 3.83 11.90 29.30 0.22
Female 52.21 4.05 27.84 20.32 14.76 2.76 4.94 7.07 0.22 6 – 9 70.39 10.54 59.85 -- 2.91 0.71 2.20 -- -- 10 - 14 83.26 1.51 53.21 28.54 5.33 0.98 3.26 1.09 0.10 15 - 19 43.59 2.99 5.41 35.19 22.28 5.73 7.52 9.03 0.20 20-24 11.86 1.94 2.00 7.92 31.00 3.32 6.68 21.00 0.38 25 21.53 4.86 5.46 11.21 34.81 4.55 9.83 20.43 0.79
Source : Population Census 2001, Special table generated.

268
The proportions of population attending in different age groups (for both sexes) were 72.6 percent
for the 6-9 years population, 86.7 percent for the 10-14 years population, 46.6 percent for the 15-
19 years population and 11.4 percent for the 20-24 years and 21.9 percent for age 25 population in
2001. That proportion was quite low in 1991 (Table 6.33 and 6.34). It indicates that greater
numbers of people are attending school in 2001 compared to earlier censuses.
The proportions of population attending school among 6-9 years, 10-14 years and 15-19 years
were 74.7 percent, 89.9 percent, 49.3 percent of respectively for males; the corresponding values
for the females were 70.4percent 83.3 percent and 43.6 percent respectively in 2001.
The differences in male/female proportions of population (6-25 years) by different levels of
education, as well as by different age groups exist in both the urban and rural areas. But there are
narrow differences exist in urban areas compared to that in the rural areas and the gap is
narrowing down in recent years.
Among those who are currently attending school, the male-female and rural-urban differentials
exist. The proportion of 6-25 year population currently attending school is higher in the urban
than that in the rural areas. The difference is particularly marked at secondary level. In general it
may be said that the rural-urban gap in the proportion currently attending school seemed to have
increased with increasing level of schooling and this is more marked for females than for males in
2001.
6.12.1 Ministry of Education Data on School Attendance
To increase the participation of children at primary school age group (6-10 years) in primary
education has been one of the goals of the educational policy. It is further emphasized by MDGs
that all who were enrolled in grade one should reach fifth grade and should have univer sal
primary education in the country by 2015. Significant progress has been made in achieving high
participation rates all over the country. The Annual Statistical Reports of the MoES present data
on school enrolment by districts, development regions and for the whole country. The primary
source of the data is the schools. All schools have to fill up and submit a statistical information
form to MoES, DoE every year.

269
The census data on school attendance are based on responses to the question on school attendance
in the census schedule/questionnaire.
The sources of data on school attendance form the MoES, DoE reports and the census are
therefore totally different. This makes comparison of the data difficult. However, the census data
would provide some indication of current age specific participation rates at the time of census.
In 2001, according to the MoES Statistical Report (2001), the gross enrolment in the primary
level was 124.7 percent. Net enrolment ratio was 81.1 percent in the same year, considering that
about 43.6 percent of the students in the primary schools are mostly over aged for the grades
concerned.
The census of 2001 indicates that 72.6 percent of the 6-9 years age group population were
attending pre-primary (beginners) or primary classes. Further the table indicate that 55.5 percent
of the 10-14 years population were also attending primary schools. This would imply involvement
of 'overaged' children in the primary and secondary schools in large numbers. Similarly 7.3
percent in pre-primary & primary 39.4 in secondary are attending by age group 15-19 years of age
which indicate that there are lot of students over aged in different level of school system in Nepal.
6.13 Future Prospects
Population growth shows its impact on educational development of the country in a number of
ways. The demand for primary education in absolute terms, has increased as a result of high
population growth. Provision of more schools, teachers, textbooks and educational materials
becomes necessary to meet the increased demand. Secondary education is also affected by making
secondary education free as well as by population growth. The increase in primary enrolment will
have its repercussion on secondary education within a period of five years after the initial
increment in enrolment in grade I. Demand for secondary education is growing due to free
secondary education and increased need for attaining secondary education for better job prospects
and for getting entry into higher education.
It was observed that there were lots of over age students in different levels of schooling. Proper
attention should be given to enroll in age specific grades by the concerned authorities in future to
increase net enrolment ratio in different levels of schooling.

270
Implementation of free primary and secondary education and rapid population growth makes very
difficult to attain the goal of universal primary education. Further, it makes the task of raising
quality of education more difficult as provision of better physical facilities, more educational
materials, and trained teachers cannot be made at a fast pace even if the funds are available. The
government is spending its huge percent of national budget on education. In the fiscal year
2060/61 about 16% of national budget is allocated for Educational Sector. Still there are great
challenges to overcome.

271
References
Asian Development Bank by Oxford University Press (2001). Growth and Change in Asia and the Pacific Key Indicators 2001, Volume XXXII.
Central Bureau of Statistics (2002). Population Census 2001, National Report, National Planning Commission, Kathmandu, Nepal.
DOE, MOES, School Level Educational Statistics of Nepal for the years1999, 2000 and 2001.
National Planning Commission Secretariat (NPCS) (2003). Tenth Plan 2059-2060 , His Majesty's Government of Nepal (HMG/N), Kathmandu, Nepal.
Central Bureau of Statistics (1994). Population Census 1991, Volume I, Part X. National Planning Commission, Kathmandu, Nepal.
Central Bureau of Statistics (1994). Population Census 1991, Volume II. National Planning Commission, Kathmandu, Nepal.
Central Bureau of Statistics (1995). Population Monograph of Nepal, National Planning Commission, Kathmandu, Nepal.
Central Bureau of Statistics (1996). Nepal Living Standard Survey Report, Vol. I. National Planning Commission, Kathmandu, Nepal.
Central Bureau of Statistics (1998/99). Report on the Labour Force Survey, Vol. I. National Planning Commission, Kathmandu, Nepal.
Central Bureau of Statistics (1998). Further Analysis Report Antenatal, Delivery, Postnatal Services Literacy and Polio Coverage, Nepal Multiple Indicator Surveillance (NMIS), Fifth Cycle. Kathmandu, Nepal.
Central Bureau of Statistics (2002). Population Census 2001, National Report, National Planning Commission, Kathmandu, Nepal.
Central Bureau of Statistics & UNICEF (2001). Report on the Situation of Women, Children and Households "Between Census Household Information Monitoring and Evaluation System (BCHIMES), Kathmandu, Nepal.
HSEB, Examination (2055 B.S.). (At a glance), Higher Secondary Education Board
MOES (2003). Education for All, Plan of Action, UNESCO Section.
MOES, Educational Statistics of Nepal, Various Years
National Planning Commission, (2003). The Tenth Plan , Kathmandu, Nepal.
Tribhuvan University, The 22nd Annual Report, Planning Division, Kathmandu, Nepal.
University Grant Commission (2000/01). Annual Report (in Nepali), Kathmandu, Nepal.