population mobility pwrpt
TRANSCRIPT
Population Mobility in the
United States
Martha B. SharmaAPHG Test Development Committee
NCGE, Kansas City
October 22, 2004
II. Population
C. Population movement
1. Push and pull factors
2. Major voluntary and involuntary migrations at different scales
3. Migration selectivity
4. Short-term, local movements, and activity space
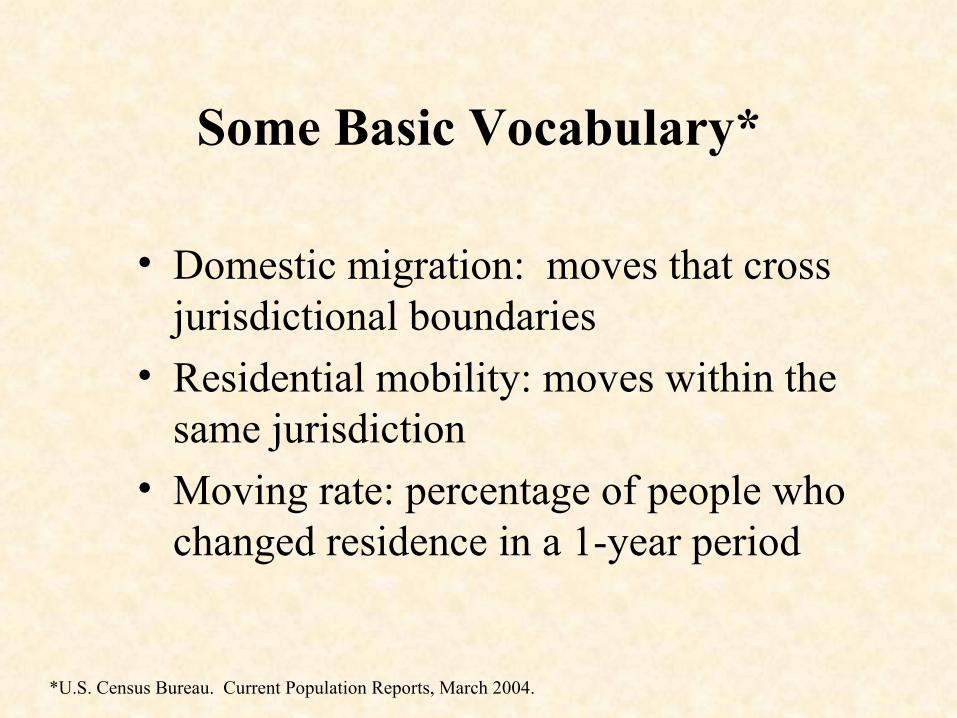
Some Basic Vocabulary*
• Domestic migration: moves that cross jurisdictional boundaries
• Residential mobility: moves within the same jurisdiction
• Moving rate: percentage of people who changed residence in a 1-year period
*U.S. Census Bureau. Current Population Reports, March 2004.

U.S. Population Mobility• Between 2002 and 2003, 40.1 million U.S. residents
moved• More than half of all moves were local (i.e., within the
same county)
• Young adults had the highest moving rates (about one-third of 20-29 year olds in 2003)
• Older adults had the highest interstate moving rates (28% of all 55 and older movers crossed state lines in 2003)
• Hispanics and African American had the highest overall moving rates (18% in 2003)
• Factors most influencing moving rates were age and home ownership
Source: U.S. Census Bureau. Current Population Reports, March 2004.
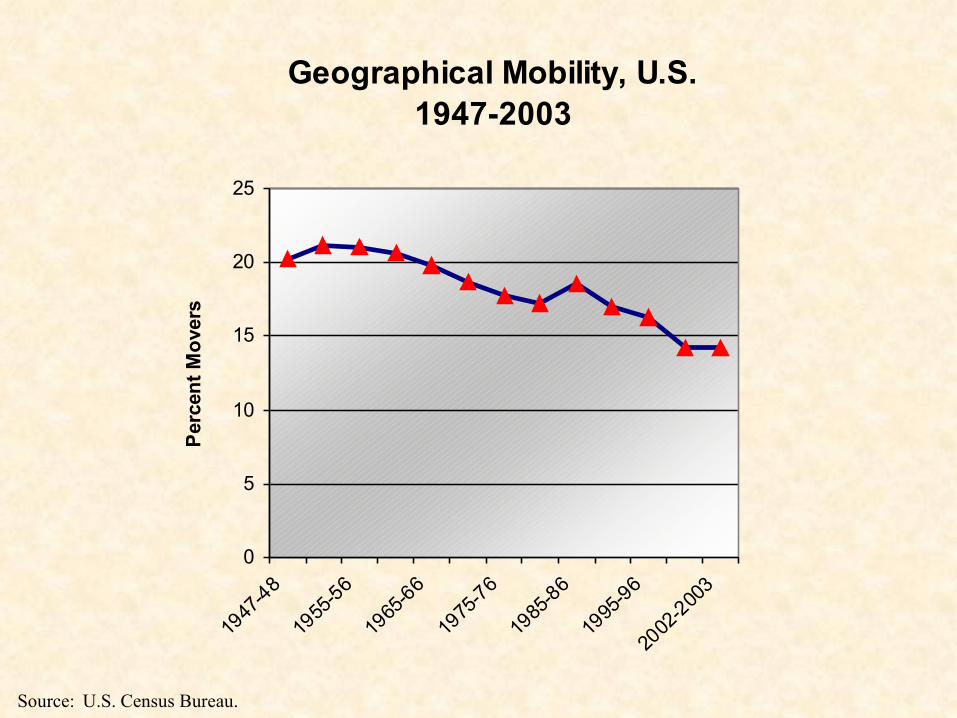
Geographical Mobility, U.S. 1947-2003
0
5
10
15
20
25
1947
-48
1955
-56
1965
-66
1975
-76
1985
-86
1995
-96
2002
-200
3
Per
cen
t M
ove
rs
Source: U.S. Census Bureau.

Geographical Mobility, U.S. -- 1947-2003(by type of move)
0
2
4
6
8
10
12
14
16
1947
-48
1950
-51
1955
-56
1960
-61
1965
-66
1970
-71
1975
-76
1980
-81
1985
-86
1990
-91
1995
-96
2000
-200
1
2002
-200
3
Pe
rce
nt
Mo
ve
rsSame county
Same state
Different state
SOURCE: U.S. Census Bureau, Census 2000 , Summary File3 [online].
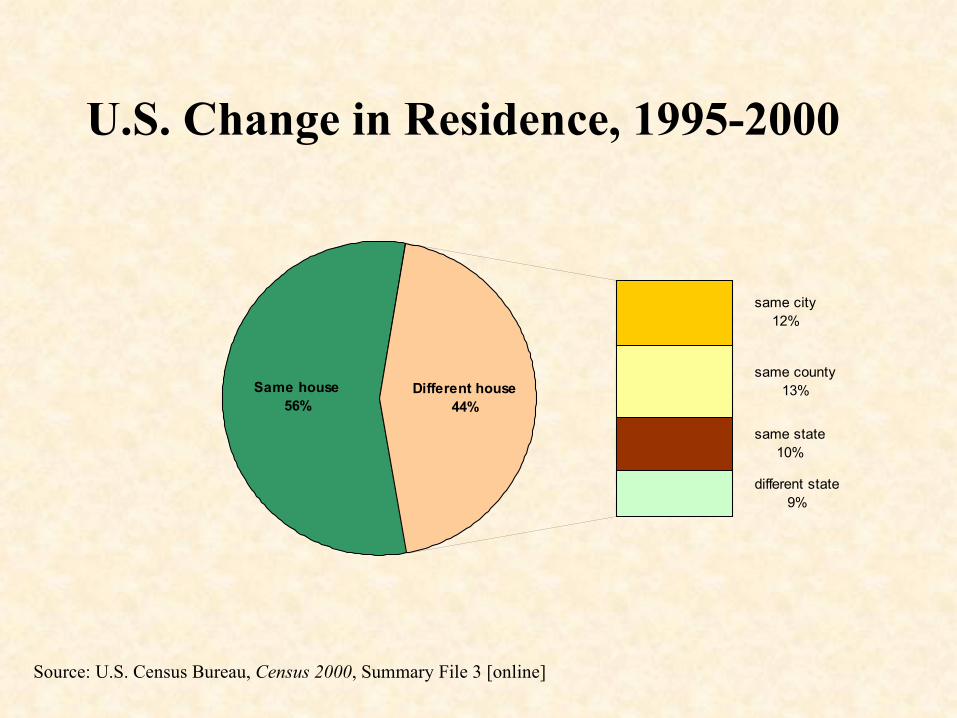
U.S. Change in Residence, 1995-2000
same city12%
same county13%
same state10%
different state9%
Different house44%
Same house56%
Source: U.S. Census Bureau, Census 2000, Summary File 3 [online]
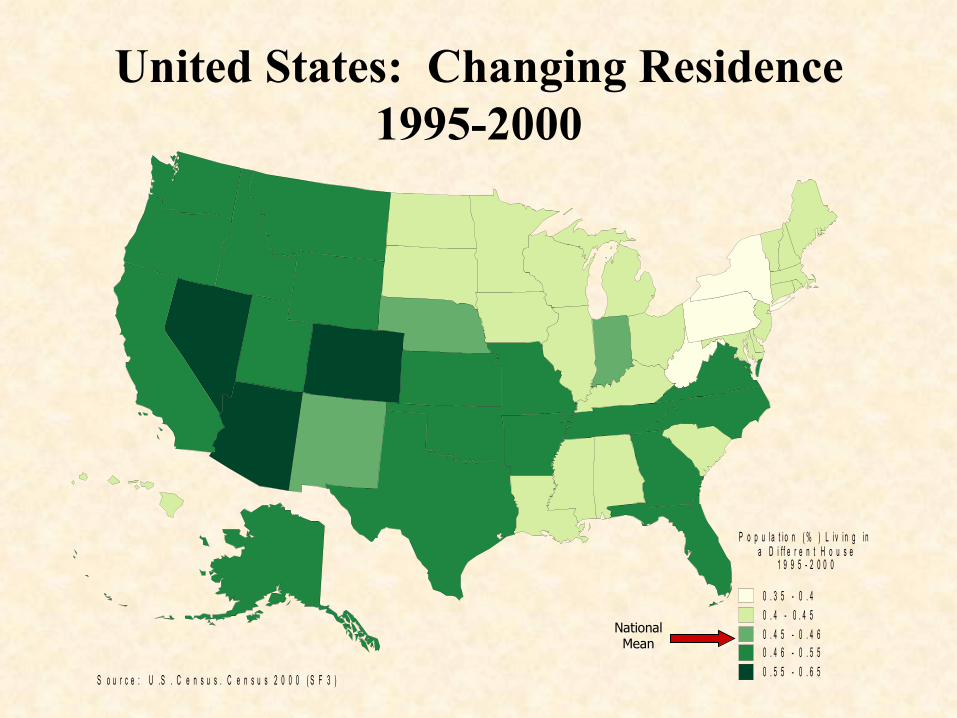
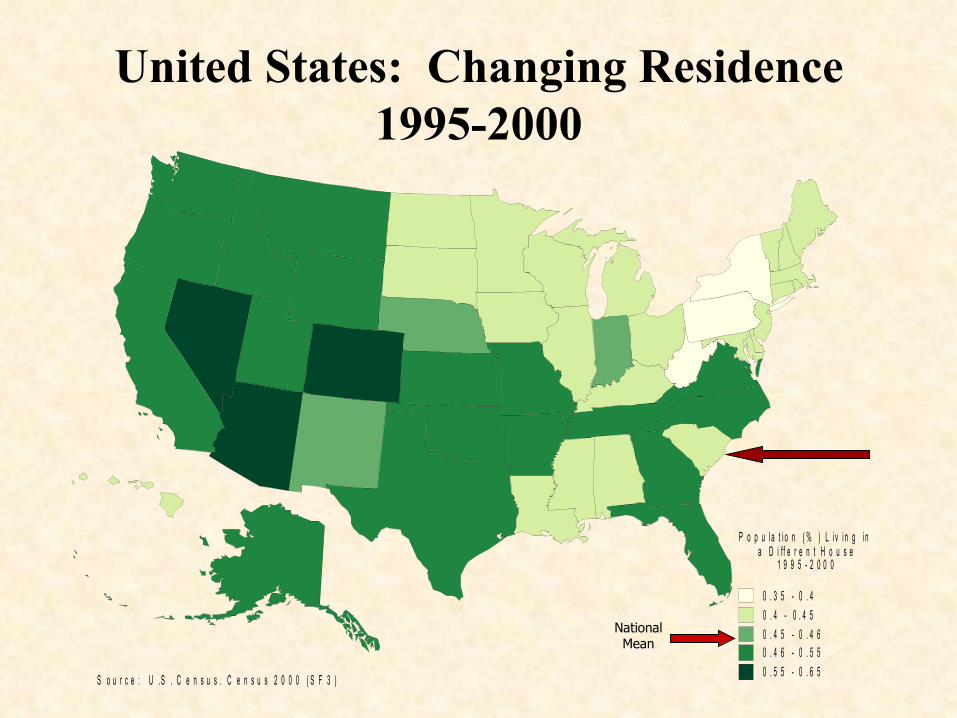
United States: Changing Residence 1995-2000
National Mean
S o u r c e : U .S . C e n s u s . C e n s u s 2 0 0 0 ( S F 3 )
P o p u l a t i o n ( % ) L i v i n g i n a D i f f e r e n t H o u s e
1 9 9 5 - 2 0 0 0
0 . 3 5 - 0 . 4
0 . 4 - 0 . 4 5
0 . 4 5 - 0 . 4 60 . 4 6 - 0 . 5 5
0 . 5 5 - 0 . 6 5
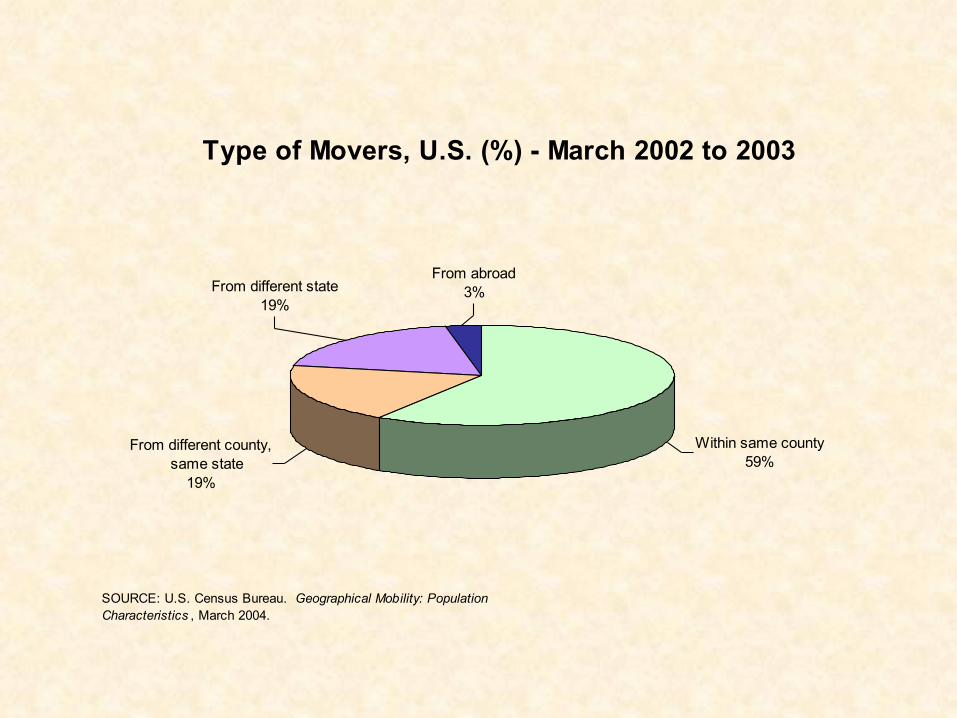
Type of Movers, U.S. (%) - March 2002 to 2003
From different state19%
From abroad3%
Within same county59%
From different county, same state
19%
SOURCE: U.S. Census Bureau. Geographical Mobility: Population Characteristics , March 2004.
National Mean
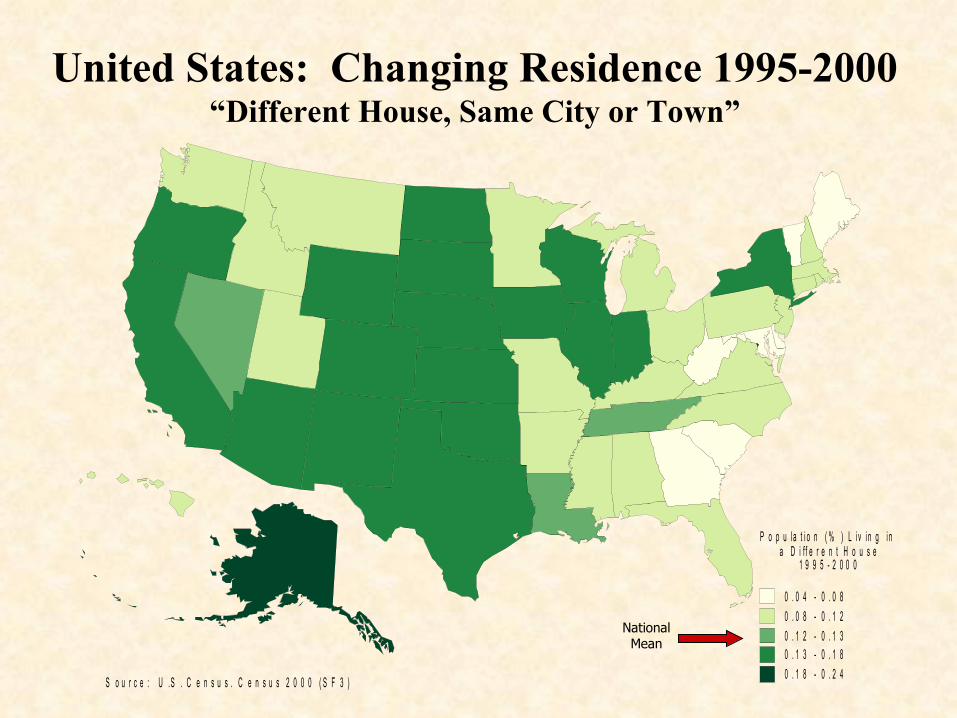
United States: Changing Residence 1995-2000“Different House, Same City or Town”
S o u r c e : U .S . C e n s u s . C e n s u s 2 0 0 0 ( S F 3 )
P o p u l a t i o n ( % ) L i v i n g i n a D i f f e r e n t H o u s e
1 9 9 5 - 2 0 0 0
0 . 0 4 - 0 . 0 8
0 . 0 8 - 0 . 1 2
0 . 1 2 - 0 . 1 30 . 1 3 - 0 . 1 8
0 . 1 8 - 0 . 2 4
National Mean
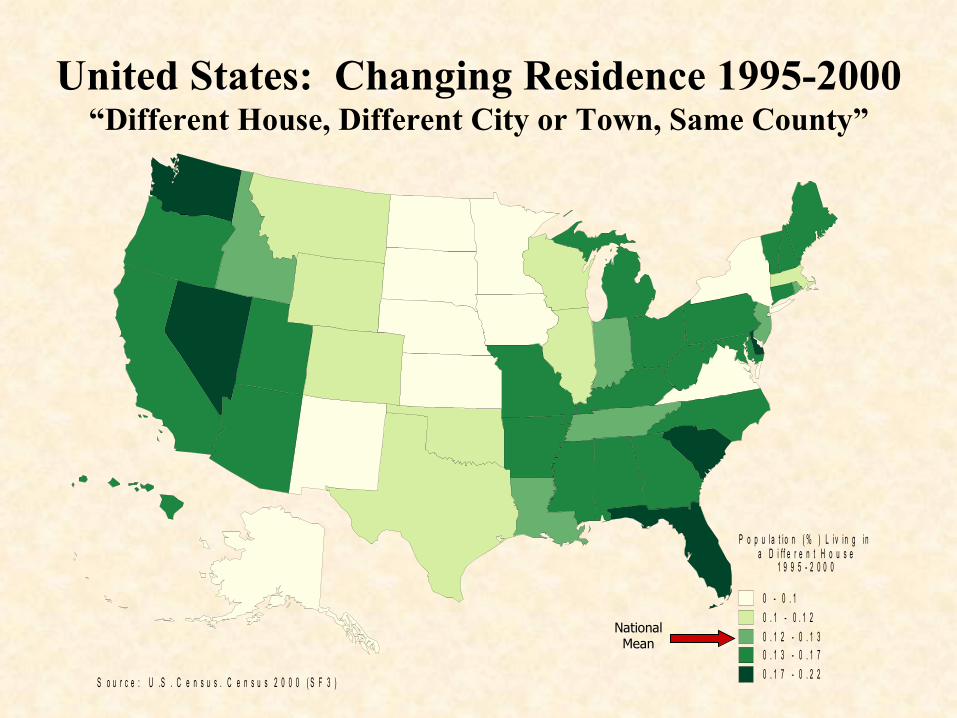
United States: Changing Residence 1995-2000“Different House, Different City or Town, Same County”
S o u r c e : U .S . C e n s u s . C e n s u s 2 0 0 0 ( S F 3 )
P o p u l a t i o n ( % ) L i v i n g i n a D i f f e r e n t H o u s e
1 9 9 5 - 2 0 0 0
0 - 0 . 1
0 . 1 - 0 . 1 2
0 . 1 2 - 0 . 1 30 . 1 3 - 0 . 1 7
0 . 1 7 - 0 . 2 2
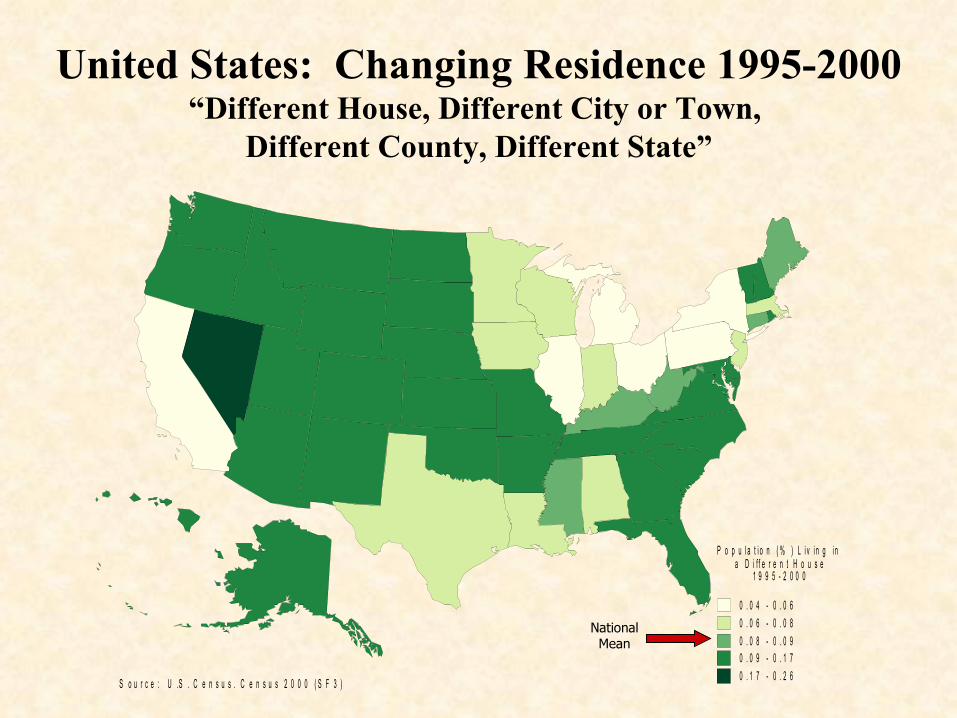
S o u r c e : U .S . C e n s u s . C e n s u s 2 0 0 0 ( S F 3 )
P o p u l a t i o n ( % ) L i v i n g i n a D i f f e r e n t H o u s e
1 9 9 5 - 2 0 0 0
0 - 0 . 0 4
0 . 0 4 - 0 . 0 8
0 . 0 8 - 0 . 0 90 . 0 9 - 0 . 1 2
0 . 1 2 - 0 . 1 5
National Mean
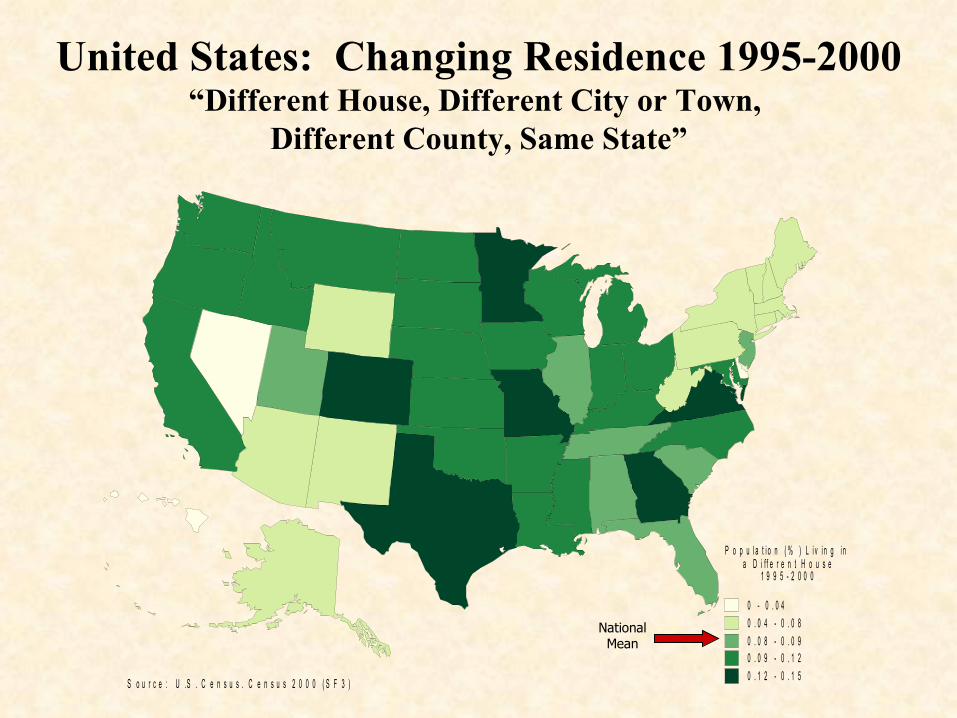
United States: Changing Residence 1995-2000“Different House, Different City or Town,
Different County, Same State”
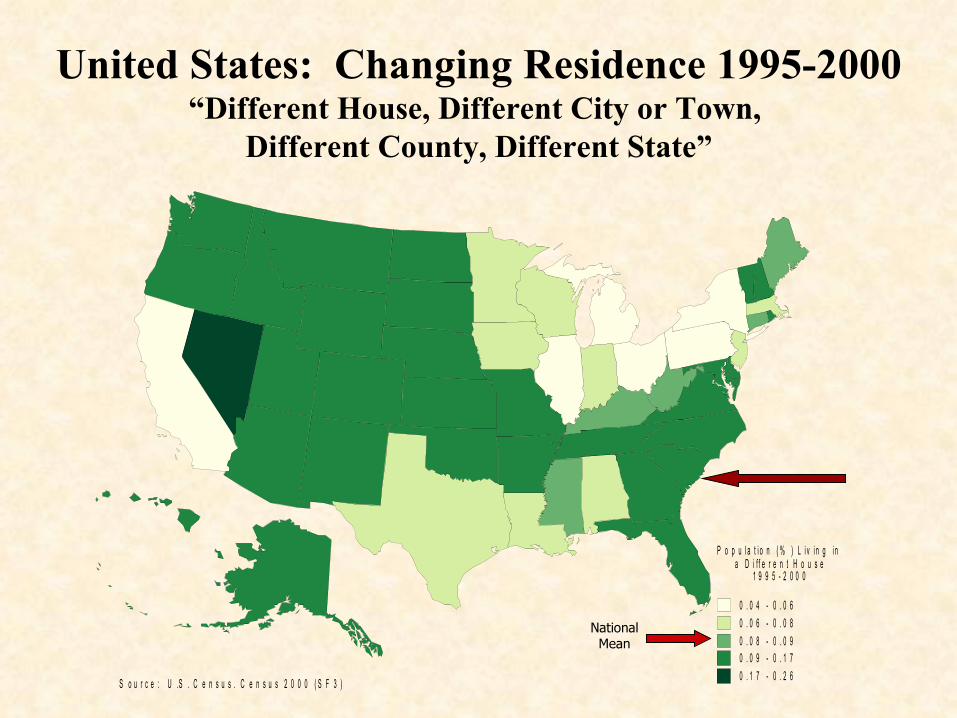
S o u r c e : U .S . C e n s u s . C e n s u s 2 0 0 0 ( S F 3 )
P o p u l a t i o n ( % ) L i v i n g i n a D i f f e r e n t H o u s e
1 9 9 5 - 2 0 0 0
0 . 0 4 - 0 . 0 6
0 . 0 6 - 0 . 0 8
0 . 0 8 - 0 . 0 90 . 0 9 - 0 . 1 7
0 . 1 7 - 0 . 2 6
National Mean
United States: Changing Residence 1995-2000“Different House, Different City or Town,
Different County, Different State”
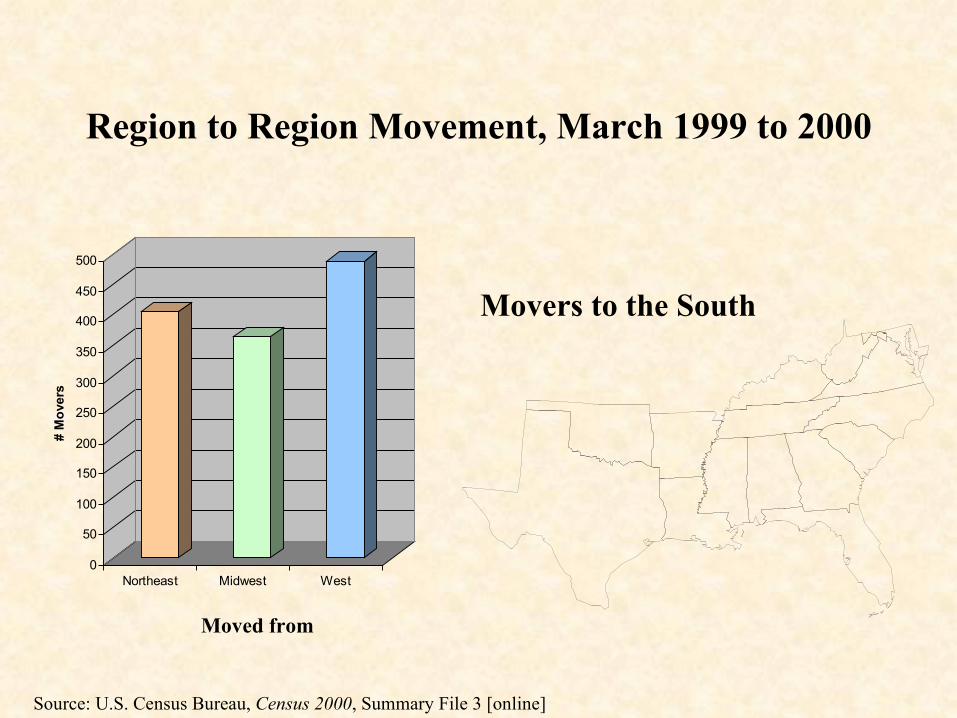
Region to Region Movement, March 1999 to 2000
0
50
100
150
200
250
300
350
400
450
500
# M
ove
rs
Northeast Midwest West
Movers to the South
Moved from
Source: U.S. Census Bureau, Census 2000, Summary File 3 [online]
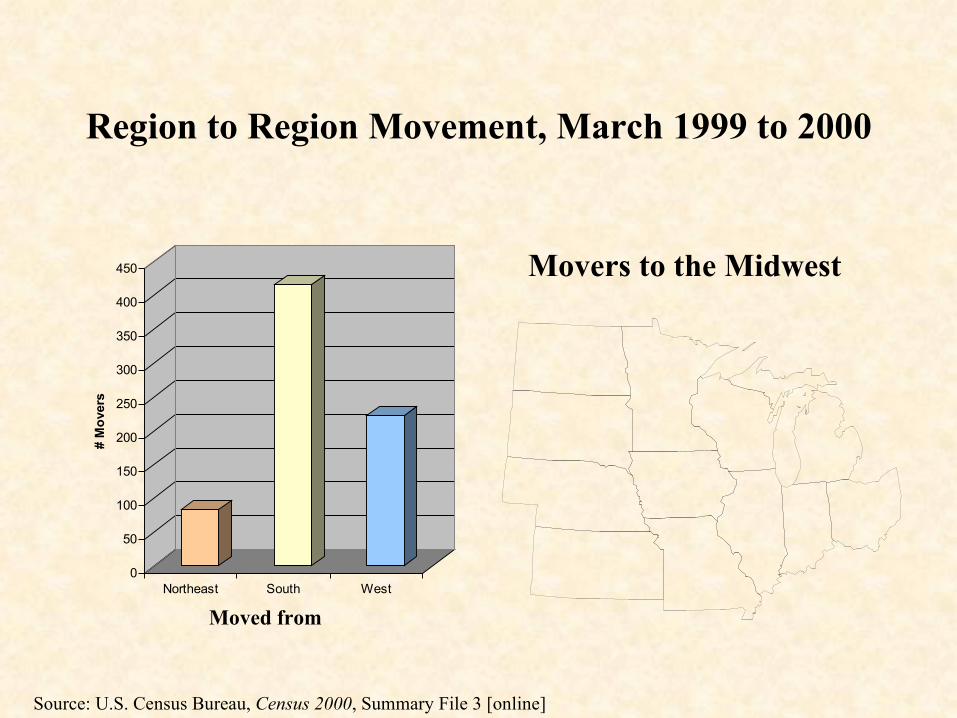
0
50
100
150
200
250
300
350
400
450
# M
ove
rs
Northeast South West
Region to Region Movement, March 1999 to 2000
Movers to the Midwest
Moved from
Source: U.S. Census Bureau, Census 2000, Summary File 3 [online]
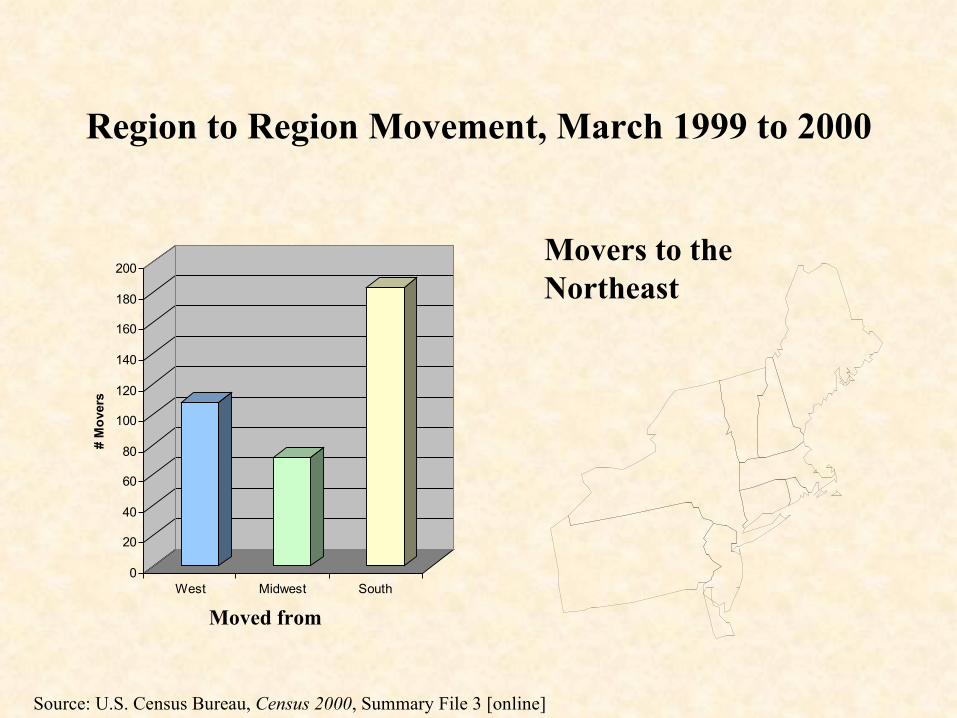
Region to Region Movement, March 1999 to 2000
Movers to the Northeast
Moved from
0
20
40
60
80
100
120
140
160
180
200
# M
ove
rs
West Midwest South
Source: U.S. Census Bureau, Census 2000, Summary File 3 [online]
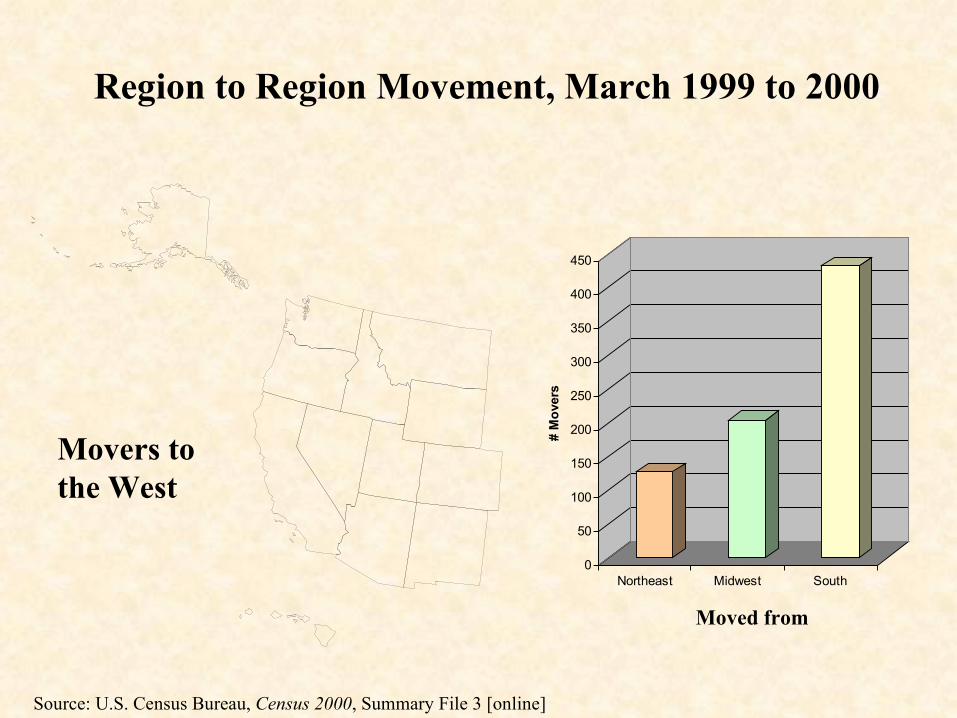
0
50
100
150
200
250
300
350
400
450
# M
ove
rs
Northeast Midwest South
Movers to the West
Region to Region Movement, March 1999 to 2000
Moved from
Source: U.S. Census Bureau, Census 2000, Summary File 3 [online]
Beware the fallacy of absolute truth.
What is true at one scale may not be true at a different scale.
United States: Changing Residence 1995-2000
National Mean
S o u r c e : U .S . C e n s u s . C e n s u s 2 0 0 0 ( S F 3 )
P o p u l a t i o n ( % ) L i v i n g i n a D i f f e r e n t H o u s e
1 9 9 5 - 2 0 0 0
0 . 3 5 - 0 . 4
0 . 4 - 0 . 4 5
0 . 4 5 - 0 . 4 60 . 4 6 - 0 . 5 5
0 . 5 5 - 0 . 6 5
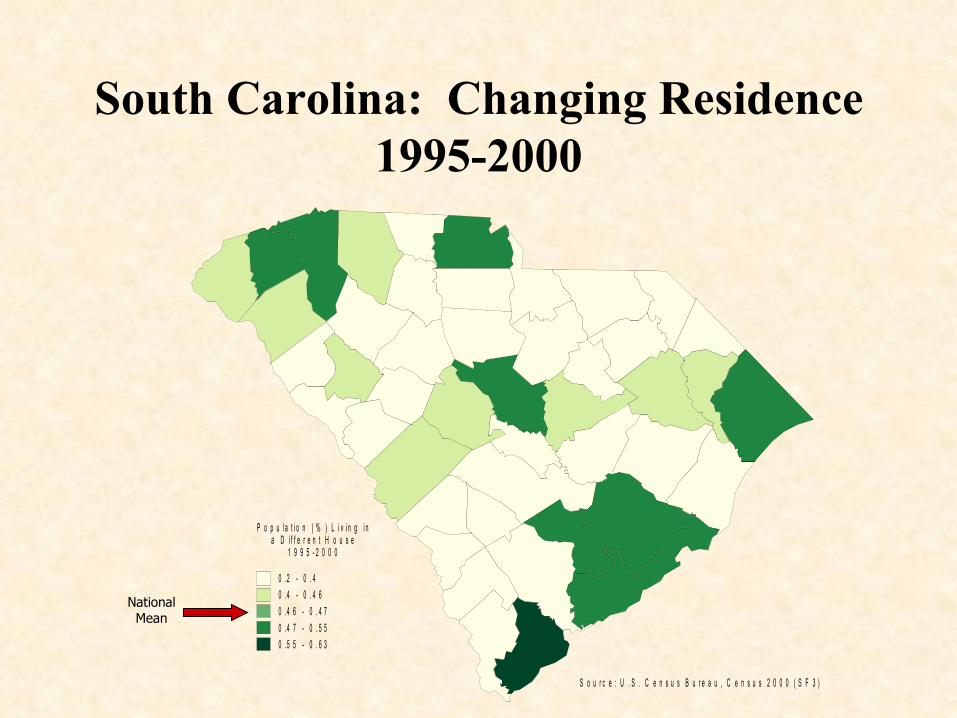
S o u r c e : U . S . C e n s u s B u r e a u , C e n s u s 2 0 0 0 ( S F 3 )
P o p u l a t i o n ( % ) L i v i n g i na D i f f e r e n t H o u s e
1 9 9 5 - 2 0 0 0
0 .2 - 0 . 4
0 .4 - 0 . 4 6
0 .4 6 - 0 . 4 7
0 .4 7 - 0 . 5 5
0 .5 5 - 0 . 6 3
National Mean
South Carolina: Changing Residence 1995-2000
S o u r c e : U .S . C e n s u s . C e n s u s 2 0 0 0 ( S F 3 )
P o p u l a t i o n ( % ) L i v i n g i n a D i f f e r e n t H o u s e
1 9 9 5 - 2 0 0 0
0 . 0 4 - 0 . 0 6
0 . 0 6 - 0 . 0 8
0 . 0 8 - 0 . 0 90 . 0 9 - 0 . 1 7
0 . 1 7 - 0 . 2 6
National Mean
United States: Changing Residence 1995-2000“Different House, Different City or Town,
Different County, Different State”
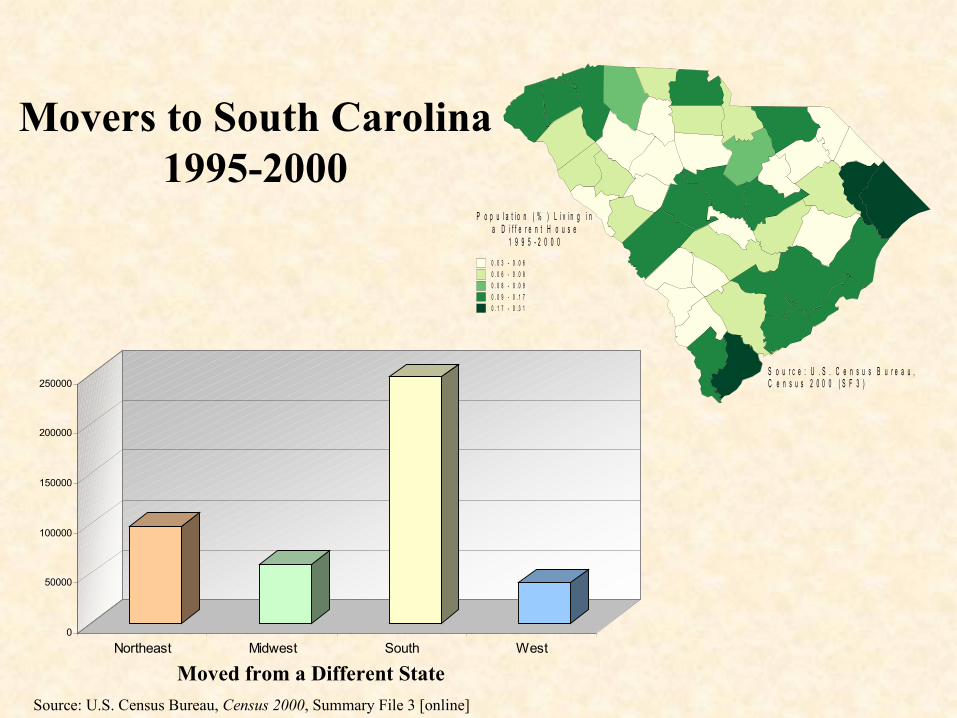
0
50000
100000
150000
200000
250000
Northeast Midwest South West
Movers to South Carolina1995-2000
Moved from a Different State
S o u r c e : U . S . C e n s u s B u r e a u , C e n s u s 2 0 0 0 ( S F 3 )
P o p u l a t i o n ( % ) L i v i n g i na D i f f e r e n t H o u s e
1 9 9 5 - 2 0 0 0
0 . 0 3 - 0 .0 6
0 . 0 6 - 0 .0 8
0 . 0 8 - 0 .0 9
0 . 0 9 - 0 .1 7
0 . 1 7 - 0 .3 1
Source: U.S. Census Bureau, Census 2000, Summary File 3 [online]
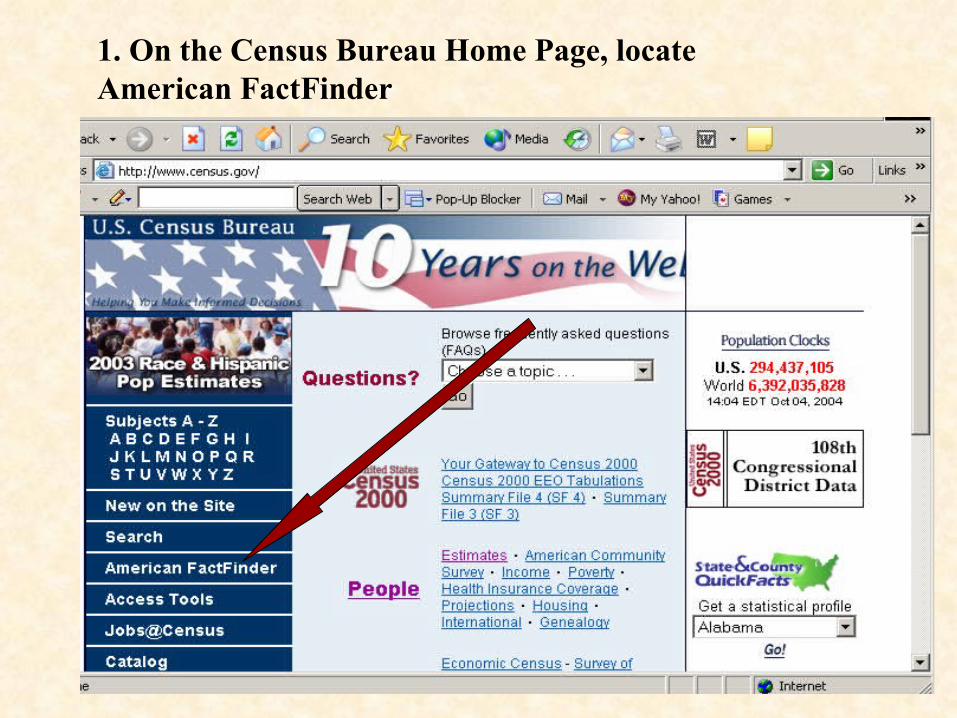
1. On the Census Bureau Home Page, locate American FactFinder
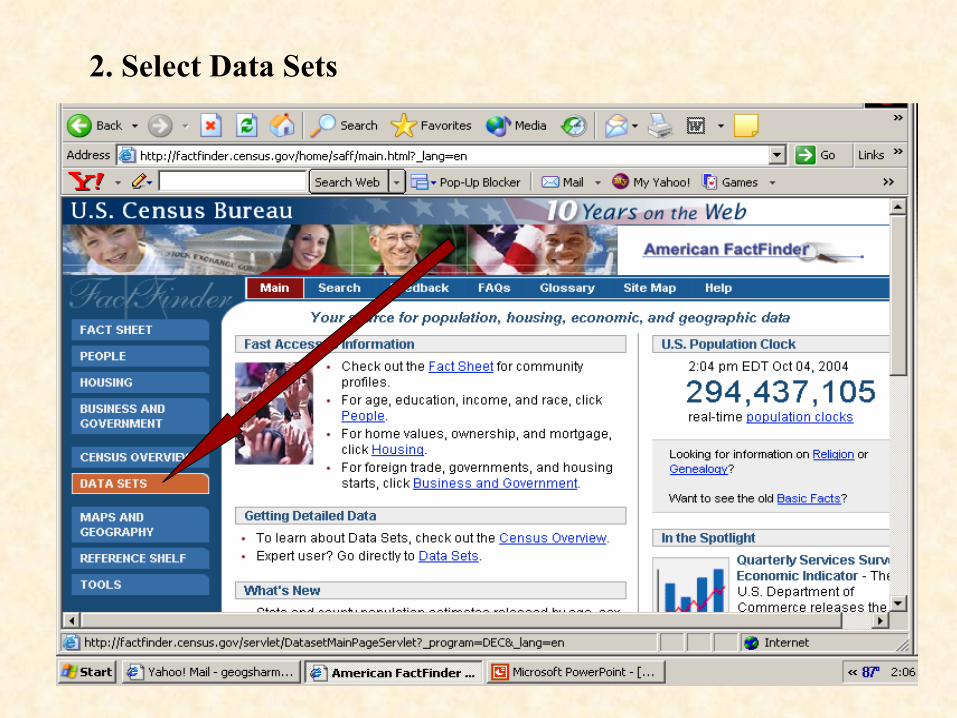
2. Select Data Sets
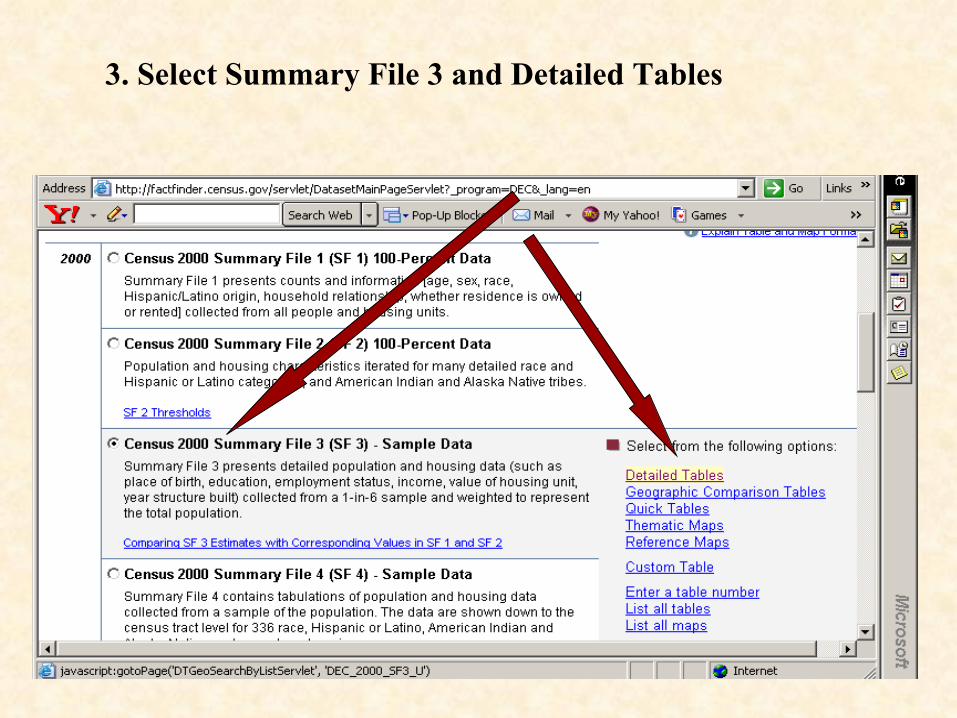
3. Select Summary File 3 and Detailed Tables
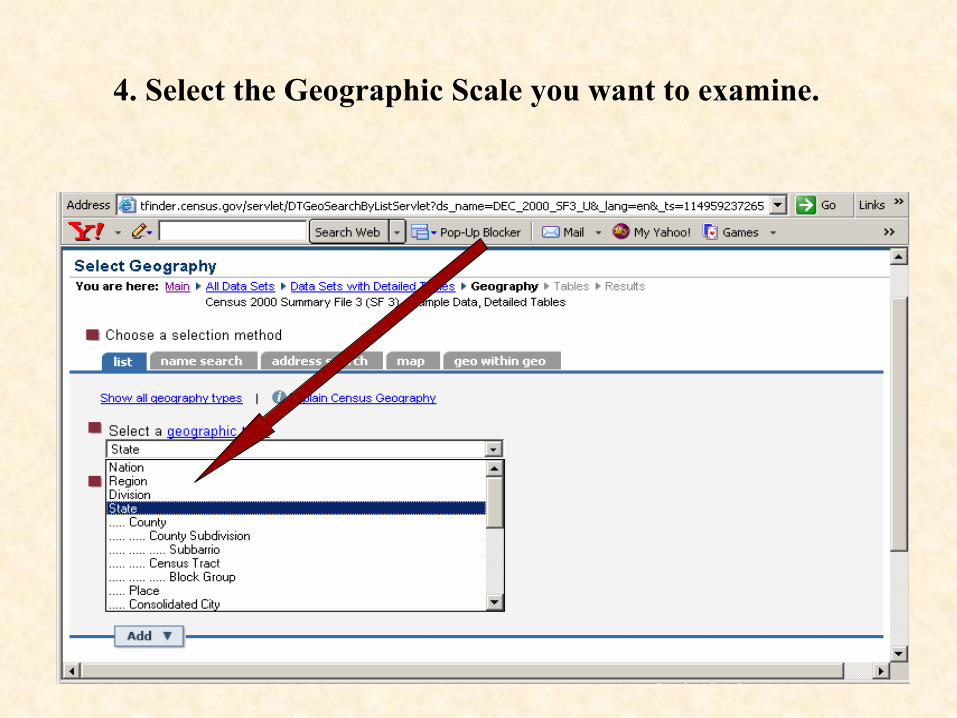
4. Select the Geographic Scale you want to examine.
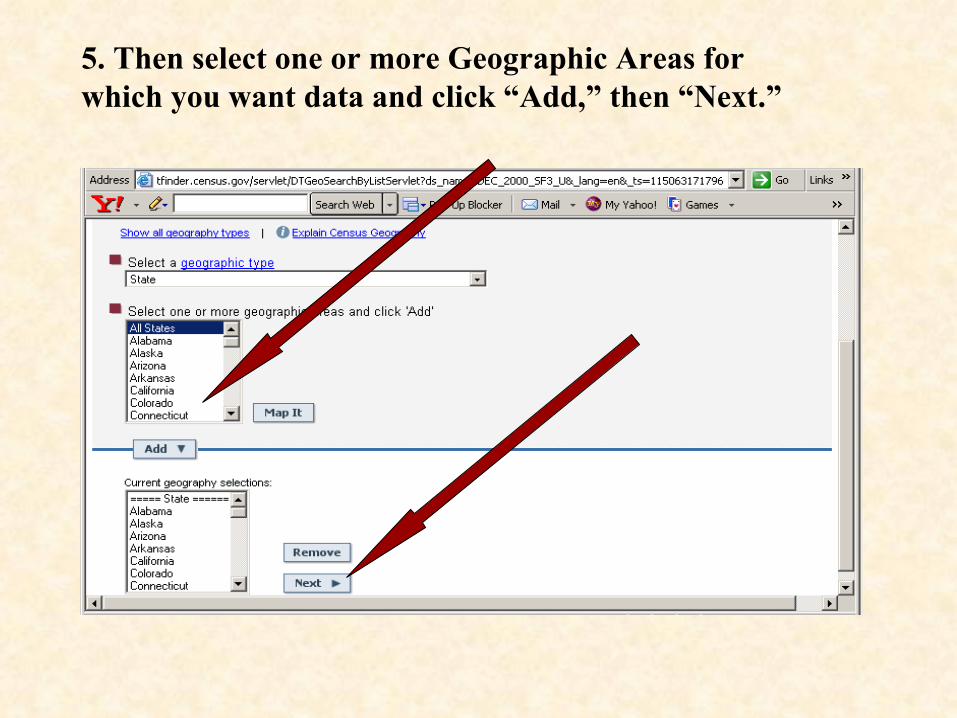
5. Then select one or more Geographic Areas for which you want data and click “Add,” then “Next.”
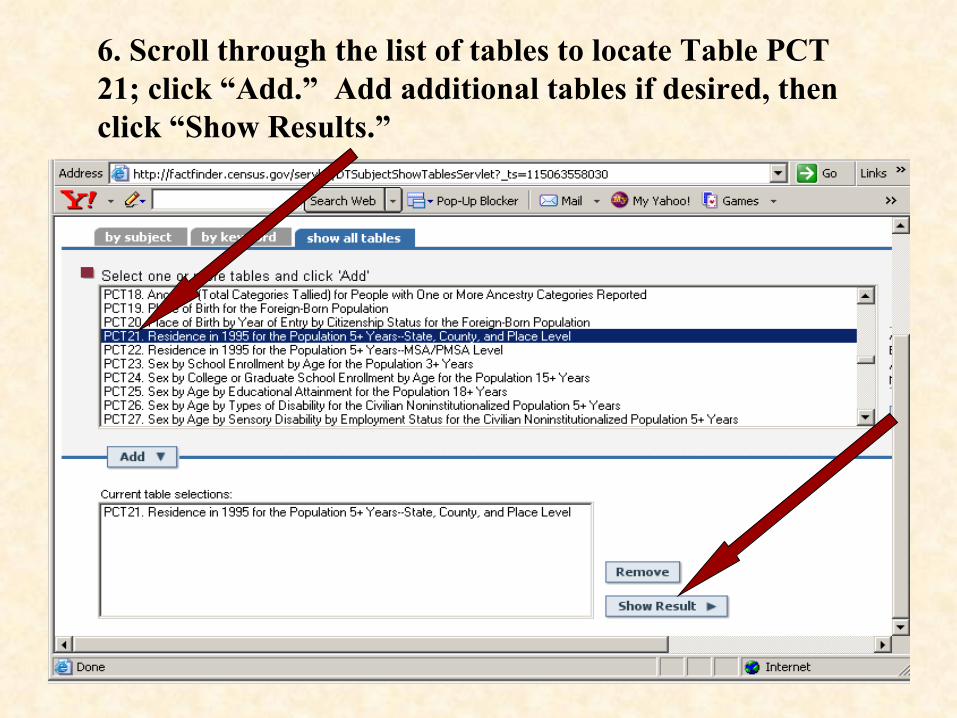
6. Scroll through the list of tables to locate Table PCT 21; click “Add.” Add additional tables if desired, then click “Show Results.”
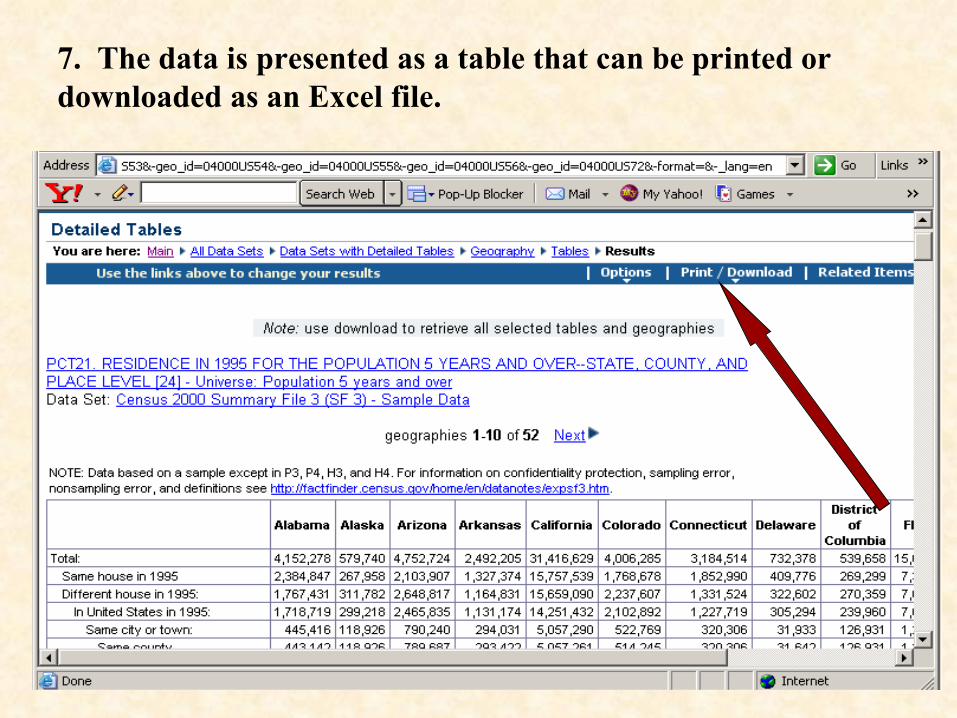
7. The data is presented as a table that can be printed or downloaded as an Excel file.
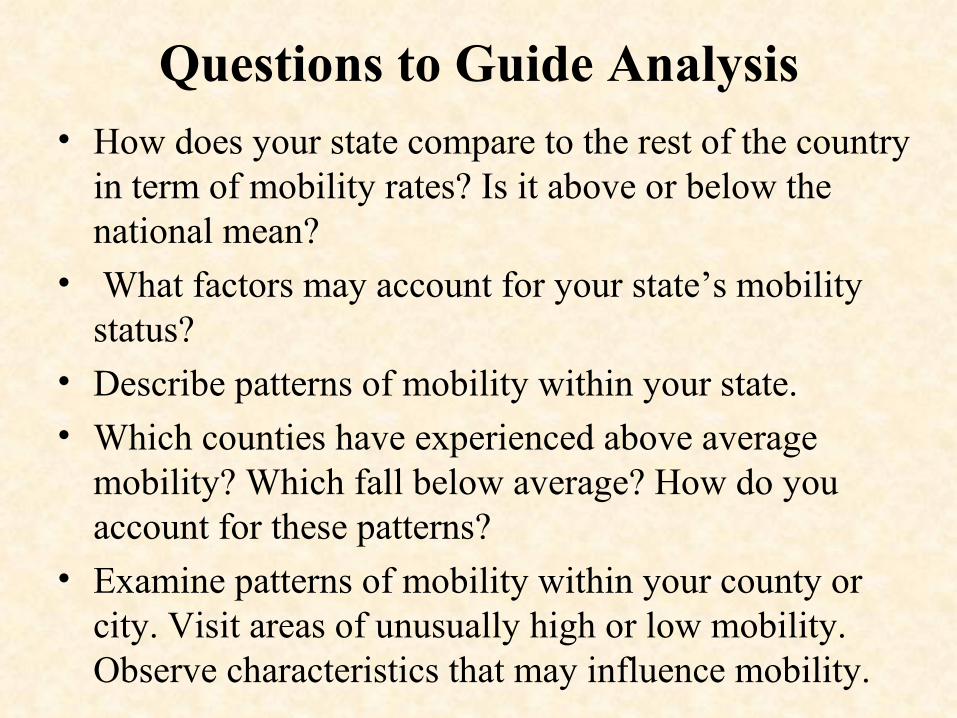
Questions to Guide Analysis• How does your state compare to the rest of the country
in term of mobility rates? Is it above or below the national mean?
• What factors may account for your state’s mobility status?
• Describe patterns of mobility within your state. • Which counties have experienced above average
mobility? Which fall below average? How do you account for these patterns?
• Examine patterns of mobility within your county or city. Visit areas of unusually high or low mobility. Observe characteristics that may influence mobility.
Questions (continued)
• How might patterns of mobility affect political and economic trends in your state, county, or community?
• Did your parents grow up in your community or are they a part of the mobility pattern?
• If your parents are “local,” how has your state, county, or community changed since they were in high school? Which changes are a product of mobility trends?
Activity Space:
Mobility at the Local Scale
Population Mobility in the
United States, Part 2
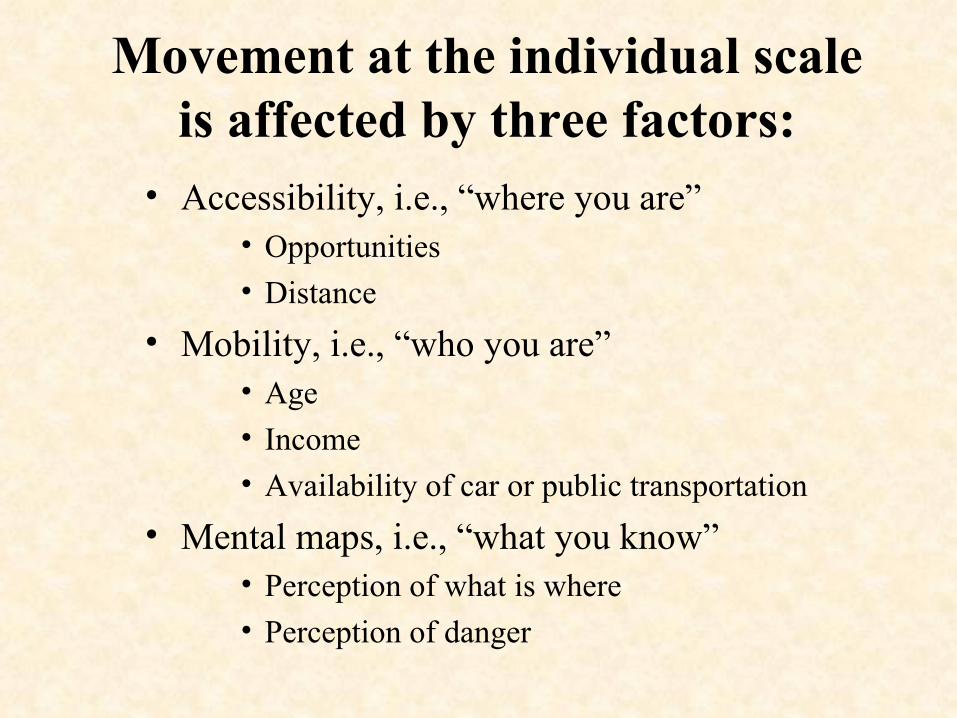
Movement at the individual scale is affected by three factors:
• Accessibility, i.e., “where you are”• Opportunities• Distance
• Mobility, i.e., “who you are”• Age• Income• Availability of car or public transportation
• Mental maps, i.e., “what you know”• Perception of what is where• Perception of danger
Evaluating Personal Activity Space
• Have students keep a diary of their movements for 24 hours on a school day and on a weekend day. [chart provided]
• Using a piece of quarter-inch graphing paper, have students chart their movements for each day.
• What factors limit their movement?• How is their activity space different on a
weekend day compared to a school day?

• Have students interview people in different age groups (e.g., a 7-year old, a college student, a parent, an elderly relative) concerning their movements over a 24 –hour period.
• Have them repeat the graphing activity.• How does age affect mobility?• What factors limit or enable the mobility of
persons in different age groups?
Evaluating Activity Space - Extension
Activity Space Resources
• Fellmann, Getis, and Getis. Human Geography, 8th edition. McGraw-Hill, 2005. pp. 71-76.
• Kuby, et al. Human Geography in Action, 1st edition. John Wiley, 1998. chapter 5.
Web resource:• http://www.colorado.edu/geography/cartpro/cartography2
/spring2001/dettloff/time/prism_map.html