population structure, length weight relationship and
TRANSCRIPT
IOSR Journal of Agriculture and Veterinary Science (IOSR-JAVS)
e-ISSN: 2319-2380, p-ISSN: 2319-2372. Volume 14, Issue 7 Ser. I (July 2021), PP 35-48 www.iosrjournals.org
DOI: 10.9790/2380-1407013548 www.iosrjournals.org 35 | Page
Population structure, Length weight relationship and condition
factor of two Tilapia species in a Tropical River System:
Implications for Fishery Assessment, Modelling and Conservation
*Uneke Bilikis I., Ugwu Ifeanyi A.J. and Udi Onoriode J. A. Department of Applied Biology, Faculty of Science, Ebonyi State University, Abakaliki, Nigeria
Abstract: Fish as a whole has a lot of food potential and can therefore be expected to provide relief from
malnutrition; especially in developing countries. Tilapias are important in local and export markets as well as
food fish by rural farmers. Tilapia species are important in the ecology of tropical waters as well as in the
resources of aquatic systems of the sub-tropical regions. Tilapia species are suitable for fish culture and are the
commercially important inland water fish of Africa. The population structure, length-weight relationship and
condition factor of Tilapia zilli and Oreochromis niloticus were determined in Mid-Cross River basin, South-
Eastern Nigeria. A total of 120 fish samples each of T. zilli and O. niloticus were analyzed and modelled. Data
were collected monthly for a period of four months. The sexes were identified with their morphological factors.
The length-weight relationship and condition factors were determined by mathematical and statistical method in FiSAT II software. Sex ratio of T. zilli population had 30 males and 90 females, at 25% and 75% respectively.
The sex ratio of male to female was 1:3. The data on length and weight of T. zilli, varied between 7.5-34.0cm
and 45-327g respectively. The mean total length and weight were 17.3±0.57cm and 93.8±5.34g respectively.
The slope (b) value of the length-weight relationship of T. zilli was 1.5095, thus the growth pattern of T. zilli in
the River was negative allometric growth. The condition factor K value obtained for T. zilli was 1.61, indicating
that the fish is in good condition. Monthly condition factor value shows that the month of July had the highest K
value of 1.77 while lowest K value of 1.49 was calculated in September. One hundred and twenty (120) species
of O. niloticus were collected and sampled for this study. The highest sex ratio was in July (1:2.3) and lowest
sex ratio was in August (1:1.2). Overall sex ratio for the sample population was 1:1.5 indicating more females
than males. The length and weight distribution for O. niloticus ranged from6.7-38.8cm TL, mean was
24.0±0.76cm TL and 55-395.2g, mean 223.83±15.34g respectively. The fish population showed a typical ‘b’ value of 1.3850 for the length-weight relationship which revealed that the growth pattern was a negative
allometric growth. The monthly condition factor indicates that the month of September has the highest condition
factor which is 3.07 while the month of August has the lowest condition factor value which is 1.93. Overall
condition factor value for the population is 2.55. The sampled fishes in Mid Cross River Basin were in good
condition, but not at their optimum growth. Therefore this fishery is in dire need of proper effective
management. Fishermen in the area should be educated on sustainable management of this freshwater resource,
by selecting the optimum mesh size which release small fish and allow each fish to produced eggs at least once
in its life.
Keywords: population structure, length-weight relationship, condition factor, Tilapia zilli, Oreochromis niloticus
---------------------------------------------------------------------------------------------------------------------------------------
Date of Submission: 28-06-2021 Date of Acceptance: 12-07-2021
---------------------------------------------------------------------------------------------------------------------------------------
I. Introduction Fish as a whole has a lot of food potential and can therefore be expected to provide relief from
malnutrition; especially in developing countries [1].True tilapias however are native only to African and Middle
East. Tilapias are fishes surrounded by fascinating facts [2]. They have important roles these days increasing total supply at affordable prices. Tilapia inhabits a variety of fish and less commonly brackish water habitats,
from shallow streams and ponds through the rivers, lakes and estuaries. Tilapias are hardy species produced by
several culture methods under a wide range of environment condition [3]. Tilapias are produced in many
countries, but mostly in the tropical and subtropical regions in the developing countries contrary to some
aquaculture species, tilapias are important in local and export markets as well as food fish by rural farmers [4].
Tilapia species are important in the ecology of tropical waters as well as in the resources of aquatic systems of
the sub-tropical regions. [5] observed that Tilapia species are suitable for fish culture and are the commercially
important inland water fish of Africa. The outstanding culturable qualities of these fish species in warm waters
have been well reported [6]; [7] and [8]. There are more than 100 species of Tilapia and are originally found in
Population structure, Length weight relationship and condition factor of two ..
DOI: 10.9790/2380-1407013548 www.iosrjournals.org 36 | Page
Africa and parts of the Middle East but can today be found in a number of other waters around the world [9]. T.
zilli inhabit a variety of fresh and less commonly brackish water habitats from shallow streams and ponds
through the rivers, lakes and estuaries. Most T. zilli are omnivore with a preference for soft aquatic vegetation and detritus [10].O. niloticus is a hardy and adaptable species that is found in a wide range of habitats, including
rivers, streams, ponds, lakes and coastal plains. It occurs in both fresh and brackish waters and usually inhabits
shallow areas. As a result, the production of farmed tilapia has increased from 383,654mt in 1990 to
1,505,804mt in 2002, representing about 6% of total farmed finfish in 2002 [11].The species is favored among
aquaculturists due to its ability to tolerate a wide range of environmental conditions, fast growth, successful
reproductive strategies, and ability to feed at different trophic levels. These same traits allow them to be an
extremely successful invasive species in subtropical and temperate environments [12]. They occur in a wide
variety of freshwater habitats like rivers, lakes, sewage canals and irrigation channels [13].In a fight to reduce
high incidence of protein deficiency, various agencies and governments tackle the problem by fish rearing. Due
to their large size, good flavor and rapid growth rate, many Tilapias are at the focus of major fishing and
agricultural efforts set against their value as food. They are hardy species and can tolerate a wide range of ecological conditions with a high reproductive rate. Tilapia is the fifth most important fish in fish farming, with
production reaching 1505,804 metric tons in the year 2000. This is because of their large size, rapid growth and
palatability [14].
Length-weight relationships can be used as character for differentiation of taxonomic units. An already
established length-weight relationship will be useful for assessing the data that contains only length frequency
measurements. This relationship can be used in setting up of yield equations, estimate the number of fishes
landed and for comparing the population over space and time. The mathematical parameters of the relationship
between the length and weight of fish furnish further information on the weight variation of individuals in
relation to their length (condition factor, K). This factor estimates the general well-being of the individual and is
frequently used in three cases: (a) Comparison of two or more co-specific populations living in similar or
different conditions of food, density or climate; (b) Determination of period and duration of gonadal maturation
and (c) Observation of increase or decrease in feeding activity or population changes, possibly due to modifications in food resources. These relationships are also an important component of Fish Base [15]. In
addition, the data on length and weight can also provide important clues on climate and environmental changes,
and change in human subsistence practices. Condition factor is important in understanding the life cycle of fish
species and it contributes to adequate management of these species, hence, maintaining the equilibrium in the
ecosystem [16]. Therefore, this study seeks to determine the population structure, length-weight relationship and
condition factor of T. zilli and O. niloticus in the Mid Cross River basin, South Eastern Nigeria; implications for
fishery assessment, modeling and conservation.
II. Materials And Methods Study area and sampling locations.
The study was carried out in mid-Cross River basin. The area lies approximately between longitude
3o30’E and 10o00’E and latitude 4oN and 8oN. The river basin covers an area of 54 000 km2 with 14 000 km2 in
the Cameroon and 39 500 km2 in Southern Nigeria (Fig. 1).Four fishing sites were sampled; Site I (Uwanna) is
also a minor water transport route between Cross River State and Ebonyi State. It is also a source of municipal
water supply. Minor dredging activity takes place in this station. Site II (Ozziza) is a minor transport rout, and
also use for domestic activities. Site III (Ndibe) is a major commuters’ and wood transport route. Dredging
activities also take place here during the dry season due to the appearance of sand bank, which also attracts a lot
of recreational activities to the site. Site IV (Akpoha) is a minor transport route located on the Mid Cross River
floodplain. Local inhabitants preserve the fishery resources of the river using traditional fish drying and
smoking method. The rainy season and the dry season are the two main seasons of the area. The vegetation around the river is predominately grasses, tall and thin palm trees, and bamboo plants and elephant grasses
unevenly distributed. Hence, the vegetation and the ecological built of the area attract some activities such as
recreation (escortion and picnic), fishing, lumbering farming activities as well as sand mining due to the
presence of sand banks. A mini market is located beside the river where fishes are marketed immediately they
are caught. However, in most cases, fishes are transported to other areas of Ebonyi state and Cross River state.
There is also water fluctuation in the Cross River system with season which goes a long way to determine the
agricultural activities of the occupants during each period. During the dry season, (between November and
March), some areas of the river floor is seen and covered with sand hence fishing activities is usually hampered
and most fishermen would abandon their fishing activities and change over to sand mining (minor dredging
activities). During the raining season (April- September), water levels will increase and reverse the activities of
the people[17].

Population structure, Length weight relationship and condition factor of two ..
DOI: 10.9790/2380-1407013548 www.iosrjournals.org 37 | Page
Fig. 1.Map of Afikpo North Local Government Area showing the sampling location in the Cross River basin
[17].
Sampling method A total of 120 fish specimens for both tilapias fishes were collected from local fishermen the river of
Uwanna, Akpoha, Ozizza and Ndibe respectively in the morning. Daily sampling was carried out between
6.30am and 11.00am for a period of four months (June -September, 2019).The fishes used for this study were
caught by local fishermen at Ndibe, Oziza, Uwana and Akpoha River of the Cross River basin using locally
available crafts and fishing gears which include canoes, cast nets, gill nets, hook and lines. The fishes were
preserved in 70% ethanol solution and were transported in a plastic container to the applied biology laboratory
of the Ebonyi State University, Abakaliki.
Laboratory Analysis In the laboratory, the fishes were serially numbered and mopped on a filter paper to remove excess
water from their body before they were weighed in order to ensure accuracy [18]. The fishes were sorted out and
identified to species level using key provided by [19]. The total length (from the snout to the tip of longest
caudal fin) was measured to 0.1cm and recorded accordingly. The weight of each fish was measured to the
nearest 0.1g on a top electronic weighing balance.
Statistical and Mathematical Analysis
The total length and weight of the samples were used for data analysis based on computer programme of FiSAT
(FAO-ICLARM Stock Assessment Tools) software [20].
The relationship between length (TL) and weight (W) was estimated using the formula:
W= aLb
Where W= weight of the fish in gram, L = Total length (TL) of the fish in cm, a = constant (Intercept) and b =
slope The power curve W= aTLb or its logarithm transformation; LogW = Loga + bLogTL were used to estimate the
parameters “a” and “b” in the relationship between body weight and total length.

Population structure, Length weight relationship and condition factor of two ..
DOI: 10.9790/2380-1407013548 www.iosrjournals.org 38 | Page
The “a” and “b” values were obtained from a linear regression of the length and weight of fish. The correlation
(r2), which is the degree of association between the length and the weight, was computed from the linear
regression analysis. R = r2
The condition factor (K) of the experimental fishes was estimated from the relationship
K = 100W/ L3
Where K = condition factor, W= weight of fish and L = length of fish.
III. Results Population structure
A total of one hundred and twenty (120) species of T. zilli and O. niloticus were examined in four
sampling occasions in mid-Cross River basin. The overall sex- ratio for T. zilli (M/F) was 1: 3. Occurrence of females were relatively higher than males in total catch as well as in samples collected in June (75%), July
(76.7%) and August (85.7), while for males, sex ratio was found to occur in higher percentage in September
(53.3%). Chi-square test (X²) showed significant seasonal differences between both sexes (P< 0.05).The
summary of the variations in number of males, females and sex ratio in monthly samples of T. zilli from mid-
Cross River basin are presented in Table 1. Monthly frequency distribution of T. zilli is as seen in Fig. 2. Overall
sex ratio for the O. niloticus population was 1:1.5 indicating more females than males. The Highest sex ratio
was in July (1:2.3) and lowest sex ratio was in August (1:1.2) (Table 2). Fig. 3 represents the monthly frequency
distribution of O. niloticus.
Table 1: Monthly sex ratio of T. zilli in mid-Cross River basin. Months No / % of
males
No / % of
Females
Total number Sex-ratio (Male-
Female)
Chi-square
June 10 (25.0) 30 (75.0) 40 1: 3.0 1.00
July 7 (23.3) 23 (76.7) 30 1: 3.0 0.83
August 5 (14.3) 30 (85.7) 35 1: 6.0 0.14
September 8 (53.3) 7 (46.7) 15 1: 0.9 0.01
Total 30 (25) 90 (75) 120 1: 3.0
Chi-square values. * Significant (p<0.05)
Table 2: Monthly sex-ratio of O. niloticus in mid-Cross River basin. Months No / % of
males
No / % of
Females
Total number Sex-ratio (Male-
Female)
Chi-square
June 12 (42.9) 16 (57.1) 28 1: 1.3 0.06
July 8 (30.8) 18 (69.2) 26 1: 2.3 1.28
August 18 (45.0) 22 (55.0) 40 1: 1.2 0.94
September 11(42.3) 15 (57.7) 26 1: 1.4 1.28
Total 49 (40.8) 71 (59.2) 120 1: 1.5
Chi-square values. * Significant (p<0.05)
Fig. 2: Monthly frequency distribution of T. zilli in mid-Cross River basin.

Population structure, Length weight relationship and condition factor of two ..
DOI: 10.9790/2380-1407013548 www.iosrjournals.org 39 | Page
Fig. 3: Monthly frequency distribution of O. niloticus in mid-Cross River basin.
Length frequency distribution
The Total length (TL)-frequency distribution is as shown in Fig. 2. The total length of T. zilli ranged
from 7.5-32.2cm TL for males, 7.8-34.0cm TL for females, and 7.5-34.0cm TL for combined sexes. The mean
total lengths of male, female and combined sexes of T. zilli were 16.5±0.76cm TL, 17.2±0.63cm TL, and 17.3±0.57cm TL respectively. Length frequency distribution of T. zilli revealed that the total length class
interval of 15-20 cm TL had the highest frequency value of 36 while total length class interval 30-35cm TL had
the lowest frequency value of 4.
The total length of O. niloticus was between 6.7-36.1cm TL for males, 7.5-38.8cm TL for females,
and 6.7-38.8cm TL for combined sexes. The mean total length of male was 22.5±0.68cm TL, female
24.1±0.75cm TL and combined sexes 24.0±0.76cm TL. Length frequency distribution of O. niloticus showed
that the total length class interval of 20-25cm TL had the highest frequency value of 46 while total length class
interval 35-40cm TL had the lowest frequency value of3.
Fig. 4: Length class frequency distribution of T. zilli in mid-Cross River basin.

Population structure, Length weight relationship and condition factor of two ..
DOI: 10.9790/2380-1407013548 www.iosrjournals.org 40 | Page
Fig. 5: Length class frequency distribution of O. niloticus in mid-Cross River basin.
Weight frequency distribution
The weight ranges for male, female and combined sexes of T. zilli were 45-325g, 49.1-327g and 45-
327g respectively. The mean weights of male, female and combined sexes of T. zilli were 96.0±8.02g,
93.1±7.26g and 93.8±5.43g respectively. The weight frequency distribution is shown in Fig. 6.
The weight frequency of O. niloticus (Fig. 7) which showed that weight between the class intervals of
200-250 had the highest frequency of 37 while those between the class intervals of 50-100 had the lowest
number of 8. Weight ranged from 55-347g, 57.9-395.2g and 55-395.2g for male, female and combined sexes
respectively. Mean weights for male, female and combined sexes for O. niloticus were 206.7±11.42g,
213.1±12.76g and 223.8±15.34g respectively.
Fig.6: Total weight frequency distribution of T. zilli in mid-Cross River basin.

Population structure, Length weight relationship and condition factor of two ..
DOI: 10.9790/2380-1407013548 www.iosrjournals.org 41 | Page
Fig.7: Total weight frequency distribution of O. niloticus in mid-Cross River basin.
Length-Weight Relationship of the Populations
The scatter plots of length-weight relationships of the population of T. zilli in mid-Cross River basin
during the period of study are shown in Fig. 6. The total length (TL) of T. zilli ranged between 7.5cm and
34.0cm and weighed between 45g and 327g. Regression relationship between the total Length (TL) and total Weight (W) of T. zilli is as seen in Fig. 8a, b and c. The equation describing this relationship is W = 0.2753
L1.5095 (r = 0.9776) (Fig. 8)
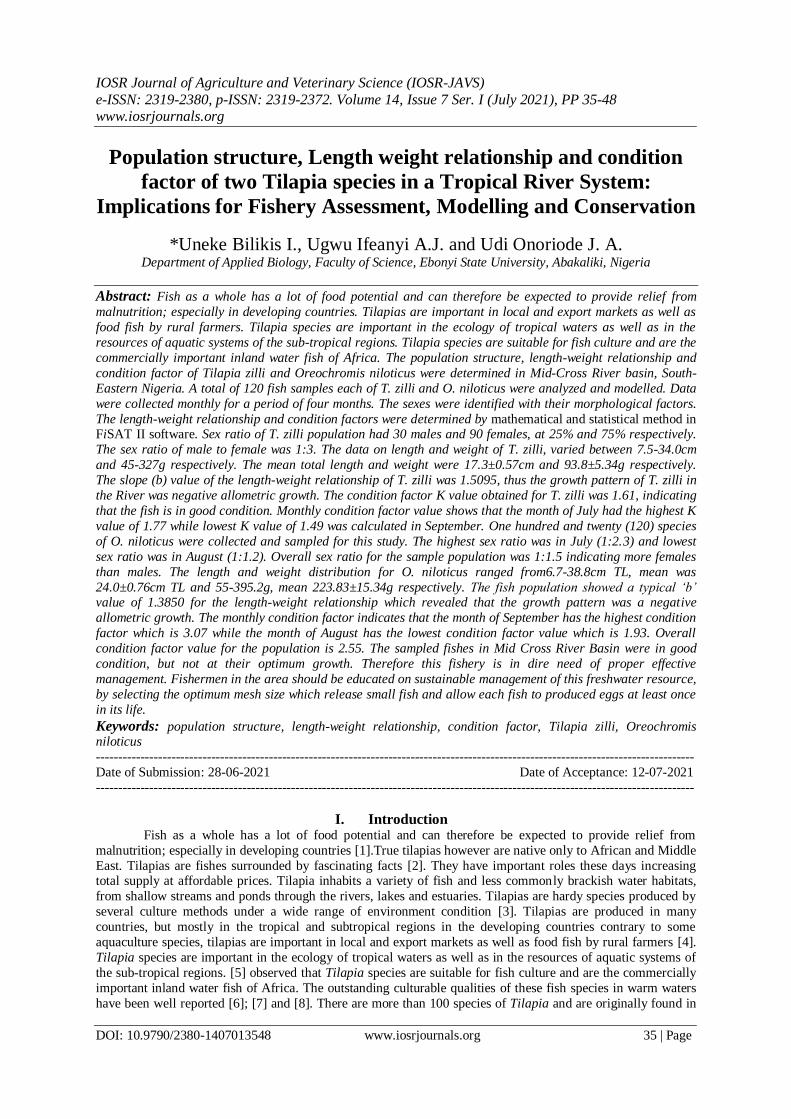
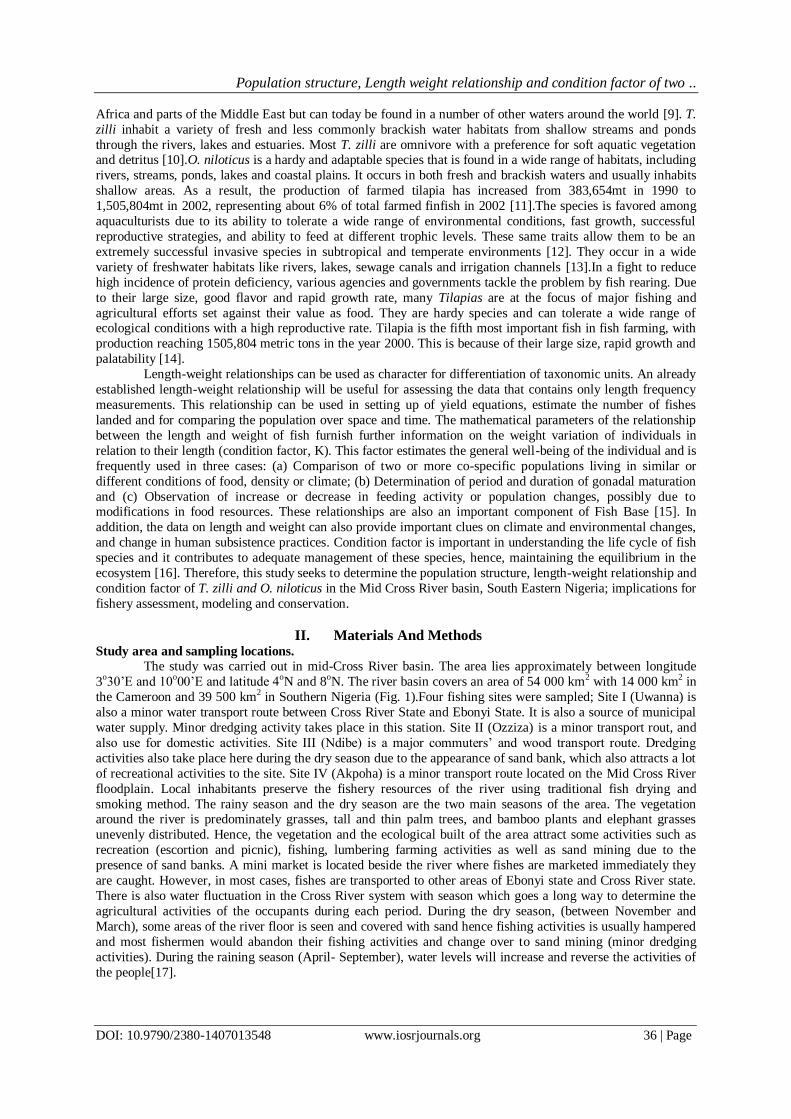
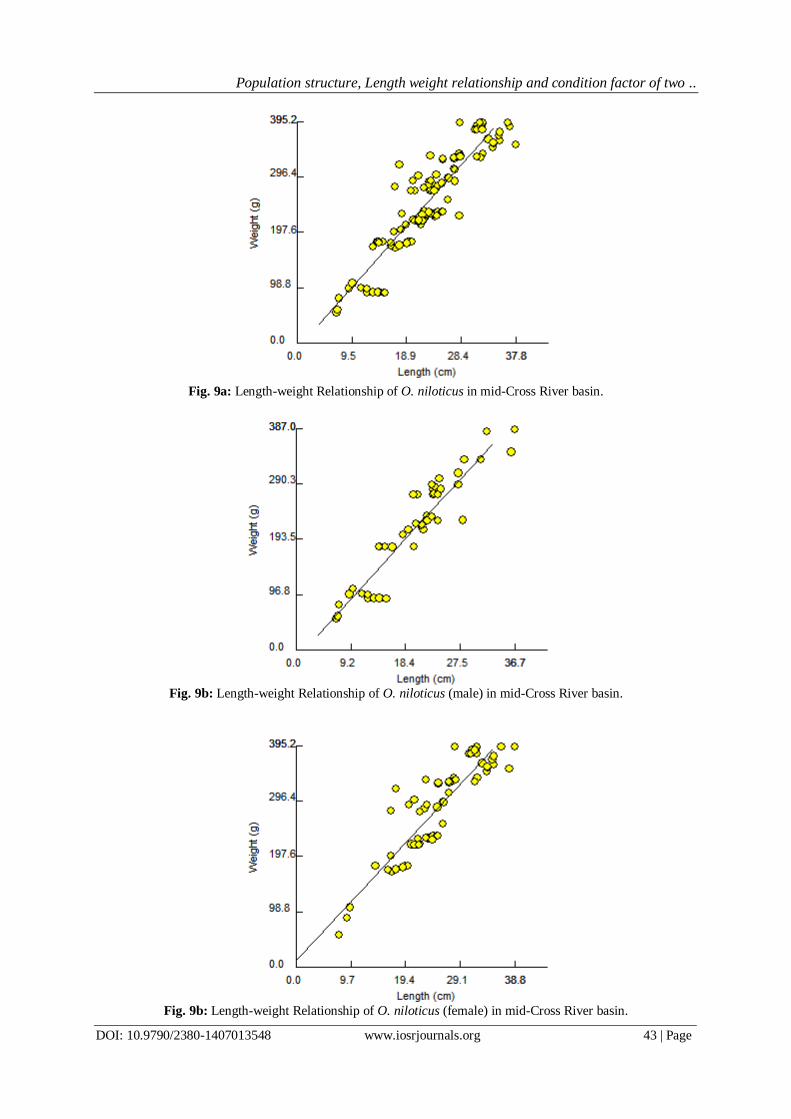
Fig. 9a,b and c show the length-weight relationship of O. niloticus below shows that the intercept ‘a’ =
0.5173, the slope ‘b’ is 1.3850 and the correlation co-efficient ‘r’ is 0.9407with total length (TL) of O. niloticus
between 6.7-38.8cm TL and weight between 55g and 387g.
Regression Analyses of T. zilli and O. niloticus from Mid-Cross River Basin are as shown in Tables 3 and 4.
Fig.8a: Length-Weight relationship of T. zilli in mid-Cross River basin.

Population structure, Length weight relationship and condition factor of two ..
DOI: 10.9790/2380-1407013548 www.iosrjournals.org 42 | Page
Fig. 8b: Length-Weight relationship of T. zilli (males) in mid-Cross River basin.
Fig. 8c: Length-Weight relationship of T. zilli (females) in mid-Cross River basin.
Table 3: Regression Analysis of T. zilli from Mid-Cross River Basin Regression formula Log (W) = a+b* Log (L) Combined sex male female
No. of Observation 120 30 90
Intercept ‘a’ 0.2753 0.1416 0.2294
Standard deviation ‘a’ 0.0362 0.0532 0.0426
Cl of intercept 0.2042 0.0325 0.1460
0.3463 0.2508 0.3129
Slope ‘b’ 1.5095 1.6291 1.5445
Standard deviation ‘b’ 0.0299 0.0465 0.0347
Cl of slope 1.4508 1.5337 1.4765
1.5682 1.7244 1.6125
Correlation coefficient ‘r’ 0.9776 0.9888 0.9785
r2 0.9556 0.9777 0.9575
Cl of r 0.9679 0.9763 0.9675
0.9843 0.9947 0.9858
Population structure, Length weight relationship and condition factor of two ..
DOI: 10.9790/2380-1407013548 www.iosrjournals.org 43 | Page
Fig. 9a: Length-weight Relationship of O. niloticus in mid-Cross River basin.
Fig. 9b: Length-weight Relationship of O. niloticus (male) in mid-Cross River basin.
Fig. 9b: Length-weight Relationship of O. niloticus (female) in mid-Cross River basin.

Population structure, Length weight relationship and condition factor of two ..
DOI: 10.9790/2380-1407013548 www.iosrjournals.org 44 | Page
Table 4: Regression Analysis of O. niloticus from Mid-Cross River Basin Regression formula Log (W) = a+b* Log (L) Combined sex male female
No. of Observation 120 49 71
Intercept ‘a’ 0.5173 0.3788 0.3613
Standard deviation ‘a’ 0.0616 0.0859 0.0760
Cl of intercept 0.3965 0.2103 0.2123
0.6382 0.5472 0.5102
Slope ‘b’ 1.3850 1.4930 1.4913
Standard deviation ‘b’ 0.0460 0.0682 0.0549
Cl of slope 1.2949 1.3593 1.3836
1.4751 1.6267 1.5989
Correlation coefficient ‘r’ 0.9407 0.9543 0.9562
r2 0.8849 0.9107 0.9144
Cl of r 0.9159 0.9199 0.9305
0.9584 0.9741 0.9726
Condition Factor of the two populations
Table (5) shows the monthly variation in length-weight relationship and condition factor (K) of T. zilli
of mid-Cross River basin. The highest and lowest K values were 1.77 (June) and 1.49(September) respectively.
Overall condition factor value for the population was 1.61.
Monthly condition factor of O. niloticus indicated that the month of September had the highest
condition factor which was 3.07 while the month of August had the lowest condition factor value of 1.93.
Overall condition factor value for the population was 2.55 (Table 6).
Table 5: Monthly Condition factor (K) of T. zilli mid-Cross River basin. Months No. (%) of samples Condition Factor
(K)
June 40(33.3) 1.77
July 30(25.0) 1.67
August 35(29.2) 1.51
September 15(12.5) 1.49
Total 120 1.61
Table 6: Monthly Condition factor (K) of O. niloticus mid-Cross River basin. Months
No. (%) of samples Condition Factor(K)
June 28(23.3) 2.95
July 26(21.7) 2.24
August 40(33.3) 1.93
September 26(21.7) 3.07
Total 120 2.55
The length frequency distribution and condition factor of T. zilli revealed that length class 20-25 cm TL
had the highest K value (1.91) while length class 30-35cm TL had the lowest K value (1.25) (Table 7). The
study population of O. niloticus showed that the highest condition factor of 3.15 was recorded at 30-35cm length
range while the lowest condition factor of 1.67 was observed at length range of 10-15 cm (Table 8).
Table 7: Length frequency distribution and condition factor of T. zilli. Length class Frequency Condition Factor
(K)
5-10 27 1.33
10-15 23 1.49
15-20 36 1.85
20-25 21 1.91
25-30 9 1.84
30-35 4 1.25
Total 120 1.61

Population structure, Length weight relationship and condition factor of two ..
DOI: 10.9790/2380-1407013548 www.iosrjournals.org 45 | Page
Table 8: Length frequency distribution and condition factor of O. niloticus
Length class Frequency Condition Factor
(K)
5-10 4 1.77
10-15 9 1.67
15-20 19 2.71
20-25 46 2.48
25-30 27 2.95
30-35 12 3.15
35-40 3 3.10
Total 120 2.55
There was a significant variation in the condition (K) value of O. niloticus as the lowest condition value
was 1.44 of 50-100g weight groups while the highest condition factor value was 3.89 of the 350-400g as shown
in Table 10.
Table 9: Weight Distribution and Condition Factor of T. zilli Weight class Frequency Condition Factor
(K)
0-50 46 1.21
50-100 31 1.25
100-150 14 1.41
150-200 12 1.79
200-250 6 1.91
250-300 3 1.83
300-350 8 1.90
Total 120 1.61
Table 10: Weight Distribution and Condition Factor of O. niloticus. Weight class Frequency Condition Factor
(K)
50-100 4 1.44
100-150 8 2.21
150-200 19 2.36
200-250 38 2.34
250-300 17 2.68
300-350 29 2.95
350-400 9 3.89
Total 120 2.55
IV. Discussion In the present study the overall sex ratio for T. zilli in mid-Cross River basin was found to be 1:3
(Male:Female) and deviated significantly from the expected 1:1 ratio ( =1.99, p< 0.05). In general females dominated the catch in nearly all months except in September. The susceptibility of the females to gillnets
maybe as a result of the minor breeding period which is triggered by the onset of the rainy season. [21] observed
the minor breeding period of cichlid to occur between June and August, which coincidentally fall within the
sampling months in this study. In this regard, the dominance of females in the catch might be attributed to the
active movement of females for search of mates and building nests for courtship which makes them more
vulnerable for gillnets. Earlier study on the same species in Lake Tana also indicated the preponderance of
females over males and this has been attributed to the reproductive behaviour of the fish [22]; [23]. [24] pointed
out that in the African lakes; it is commonly observed that males dominate over females in the cichlid population. However, studies conducted on the same species in some water bodies in Ethiopia and elsewhere in
the world [25]; [26] revealed that females were more numerous than males. However, [27] described that the sex
ratio could vary considerably from species to species, and from year to year in the same population, but in the
majority of cases it is close to one to one. Factors affecting fish distribution and abundance have already been
reported by different workers. Availability of food, spawning rates, breeding grounds coupled with shelter,
presence of current, vegetation, depth of water, breeding rabbits migration and low predation have been
suggested as major limiting factors affecting the distribution and abundance of various fish families in Kainji
Lake [28]. [29]reported fish catch varied with type of gear used, tidal condition and period of capture, diurnally
and seasonally.[16]recorded 5.5-20 cm for annual length range for T. zilli from Wasai Reservoir in Kanoas
against 7.5-30.0cmrecorded in this study. This could be as a result of the four months sampling period when
compared to the one year sampling period of the study in Wasai reservoir in Kano. The differences between

Population structure, Length weight relationship and condition factor of two ..
DOI: 10.9790/2380-1407013548 www.iosrjournals.org 46 | Page
these findings and the results of this study may also be due to difference in ecological conditions of the different
location. The mean total length (TL) of combined sexes of T. zilli ranged from 12.6cm in June, and 23.2cm in
September respectively. The mean Total Length of the overall population was 17.2cm which is a little above [29] mean Total Length value of 16.97cm for combined sexes from Asejire Lake, Oyo State. The weight range
of combined sexes of T. zilli was 5-375g. The mean weight of the overall population was 109.20g. These results
are in agreement with works of [2]; [5]; [4]; [29]. The results also showed that there were strong positive
correlations, which were significant (P<0.01) between the lengths and weights of male, female and combine
sexes of T. zilli observed in this study. The reason for the low mean Total Length and Weight values in the mid-
Cross River basin could be as a result of high mortality of both juveniles and brood stock of T. zilli as a result of
predatory activities, which is typical of the study area.
The length-weight relationship of the overall population of T. zilli showed the value of intercept ‘a’ to
be 0.9826. [16] recorded “a” value of 1.5 during the dry season and 1.2 values during the wet season. The
growth coefficients or slope ‘b’ value of the overall population is 2.3323. This is comparatively lower than the
‘b’ values of(2.9 - 4.8) obtained from [30]and (2.91) from [8]. [16] reported maximum ‘b’ values of 2.5 and 1.53 for wet and dry seasons respectively. Differences between these findings and the results of this study may be
due to difference in ecological conditions. [31], stated that the isometric value of b=3is for an ideal fish that
maintains three dimensional equality, when ‘b’ value is <3, the fish has a negative allometric growth and ‘b’
value >3 is positive allometric growth [18]. If fish have to maintain their shape as they grow, their ‘b’ values
must be equal to 3, but there is no existing theory that says the ‘b’ value must be negatively or positively
allometric [32].Therefore, the growth pattern of T. zilli in mid-Cross River basin is said to be negative
allometric, this implies that T. zilli did not increase in weight faster than the cube of their total lengths.
Meanwhile, [33] have suggested that value of ‘b’ less than 2.5 can be considered as subnormal growth of fish in
that given aquatic environment. The coefficient of determination (r2) value was 0.93.
The Condition factor (K) of 2.63 and 3.4 were reported during the dry and wet seasons respectively
which showed higher value during the wet seasons [16]. [34];[23] on each of their study reported that values of
the condition factor vary according to seasons and are influenced by environmental conditions. In this study, the mean condition factor ranged between 1.5 in September and 1.8 in June and the value comfortably fall within
the ideal range set by [35]. [36] had reported that reproduction results in lower value of condition factor (K<1)
marked the fish loses its weight after spawning period. But, result of this study showed that T. zilli (male, female
and combine sex) considered had condition factors greater than 1. The results obtained from this study indicate
that T. zilli of Mid-cross river basin are in good condition.
One hundred and twenty (120) species of O. niloticus were collected and sampled for four months in
this study. The highest sex ratio was in July (1:2.25) and lowest sex ratio was in August (1:1.20). Overall sex
ratio for the sample population was 1:1.45 indicating more females than males. This fish population showed a
typical ‘b’ value of 1.6174 for the length-weight relationship of both male and female O. niloticus, which
revealed that the growth pattern was a negative allometric growth. According to [37], the weight of fish
increased when they consume the food stuffs that are available for growth and energy. These values may also vary significantly based on other factors featuring sex, growth phase, stomach contents and gonad development
as reported by [38]. These factors are directly connected to the fish, ecosystem health related to the impacts of
human activities like logging and aquaculture encompassing the damaging water quality is another cause and it
is a very worrying trend for this area as it would affect all the biota its supports. Also, b value is dependent on
environmental conditions and geographical, and biological, sampling factors and temporal [36]. The higher
‘b’value of C. apogon in Pedu Lake reported by [39] is an indication of a more favourable environment for this
species which has better growth as compared to Mid Cross River Basin.
The monthly condition factor indicates that the month of September has the highest condition factor
which is 3.073 while the month of August has the lowest condition factor value which is 1.930. Overall
condition factor value for the population is 2.48.The length distribution and condition factor of the study
population of O. niloticus showed that the highest condition factor of 3.15 was recorded at 30-34 cm length
range while the lowest condition factor of 1.67 was observed at length range of 10-14 cm. There was a significant variation in the condition (k) value of O. niloticus as the lowest condition value was 1.34 of 240-
290g weight groups while the highest condition factor was 3.89 of the 140-190g. The condition (K) factor in
was within this range 1.67 as the lowest while 3.15 as highest condition factor which showed that almost of the
fish were in good condition. [40] suggested that if the K value is 1.00, the condition of the fish is poor, long and
thin. A 1.20 value of K indicates that the fish is of moderate condition and acceptable to many anglers. A good
and well-proportioned fish would have a condition (K) value that is approximately 1.40. Based on this
condition, the sampled fishes are in good condition growth. However, fishermen should be encouraged to fish
responsibly for sustainability of the resources because the results from were out of the range set for ideal growth
of freshwater fish. [7];[16] and [35] reported k values of 2.9-4.8, 2.9-4.3 and 2.6-3.4 respectively.

Population structure, Length weight relationship and condition factor of two ..
DOI: 10.9790/2380-1407013548 www.iosrjournals.org 47 | Page
V. Conclusion Generally, females were significantly more than males as indicated in sex ratio of the total sample. The
susceptibility of the females to gillnets maybe as a result of the minor breeding period which is triggered by the
onset of the rainy season, this period coincidentally fall within the sampling months of this study. Thus, the
spawning population in the shallow littoral part of the river should be protected from intensive fishing during
this period. The study population of T. zilli showed negative allometric growth pattern, this implies that T. zilli
did not increase in weight faster than the cube of their total lengths in mid-Cross River basin. The values for condition factor indicate that the fish are in good condition; this might be attributed to availability of food and
favourable ecological conditions in the river. The result of this finding showed that there were significant
differences obtained in length-weight and condition factor among the male and female fish of O. niloticus. The
study in Mid-Cross River Basin revealed that females are significantly in abundance than males and the values
obtained from the study revealed that O. niloticus were in good condition. The observed sex ratio in this study is
desirable for brood stock development and hatchery operation as one male is required to fertilize at least three
females. It is concluded that the O. niloticus examined were in good condition and healthy and can be used for
commercial production. Fishermen in the area should be educated on sustainable management of this freshwater
resource, by selecting the optimum mesh size which release small fish and allow each fish to produced eggs at
least once in its life to conserve these viable commercially important species.
Acknowledgement
This project was supported by funding from Tertiary Education Trust Fund (TETFund) administered by the
Directorate of Research, Innovation & Commercialization Ebonyi State University Abakaliki. Reference No.
EBSU/TETFund/IBR/2018/025
The authors acknowledge the efforts of the community leaders, market community, youths and fishers of Ndibe,
Ozizza, Akpoha and Uwana who allowed, supported and mobilized the research activities in their communities.
We appreciate Ebonyi State University for providing the research enabling environment.
References [1]. Ashraf MA, Zafar A, Rauf S, Mehboob R, Qureshi NA. Nutritional Values of Wild and Cultivated Silver Carp
(Hypophthalmichthys molitrix) and Grass Carp (Ctenopharyngodon idella). International Journal of Agriculture and Biology, 2011;
13: 210–214.
[2]. Odulate DO, Ikenweiwe NB, Abdul WO, Abdulsalami SA. Length-weight relationships and condition factor of Oreochromis
niloticus (Linnaeus) in Oyan Lake, Southwest Nigeria. International Journal of the Tropical Environment.2012; 9 (10):90-96.
[3]. Fesschaye Y. Natural mating in Nile Tiliapia (Oreochromis niloticus).Implication for reproductive success, inbreeding and
cannibalism Wageningen; Wageningen University.2006;150pp.
[4]. Dan-Kishiya AS. Length-weight relationship and condition factor of five fish species from a tropical water supply reservoir in
Abuja, Nigeria. America Journal of Research Community.2013; 1(9):175-187.
[5]. Achakzai WM, Saddozai S, Baloch WA, Memon N. Length-Weight Relationships and Condition Factor of Oreochromis
mossambicus (Peters, 1852) from Manchar Lake Distt. Jamshoro, Sindh, Pakistan. Sindh Universal Research Journal (Science
Series), 2013; 45 (2): 201-206.
[6]. Idodo-Umeh G. Freshwater fishes of Nigeria. (Taxonomy, Ecological notes, diet and utilization). Idodo-Umeh Publish Limited,
Benin-City, Nigeria. 2003;232pp.
[7]. Anene A. Condition Factors of Four Cichlids Species of a Man-Made Lake in Imo State, Southeast, Nigeria. Turkey Journal Fish
Aquatic Science, 2005; 5: 43-47.
[8]. Bala U, Lawal I, Bolorunduro PI, Oniye SJ, Abdullahi SA, Bichi AH. Study of ichtyofauna of Daberam reservoir in Katsina State.
Bayero Journal of Pure and Applied Sciences,2009; 2:172-174.
[9]. Froese R, Tsikliras AC, Stergiou KI. Editorial note on weight–length relations of fishes. ActaIchthyoletPiscato, 2011; 41 (4):261-
263.
[10]. Soyinka OO, Kuton MP, Ayo-Olalusi CI. Seasonal distribution and fish species richness in Badagry Lagoon, south-west Nigeria.
Estonian Journal of Ecology,2010; 59 (2): 1-10.
[11]. Food and Agricultural Organization (FAO). Cultured Aquatic Species Information Programme. Oreochromis niloticus. Cultured
Aquatic Species Information Programme, 2012; 62-73p.
[12]. Peterson MS, Slack WT, Woodley CM. The Occurrence of Non Indigenous Nile Tilapia, Oreochromis niloticus (Linnaeus) in
Coastal Mississippi: Ties to Aquaculture and Thermal Effluent. Wetlands, 2005; 25: 112-121.
[13]. Bailey RG. Guide to the Fishes of the River Nile in the Republic of the Sudan. Journal of Natural History, 1994; 28:937-970.
[14]. Kuton MP, Kusemiju K. Species Diversity and Richness of Cichlids in Three Southwestern Lagoons in Nigeria. Journal of Science
Research Development.2010; 12:22-33.
[15]. Froese R, Pauly D. Fishbase World Wide Web Electronic Publication, 2012; 15-64.
[16]. Imam TS, Bala U, Balarabe ML, Oyeyi TI. Length-weigth relationship and condition factor of four fish species from Wasai
Reservoir in Kano, Nigeria. African Journal of General Agriculture.2010;6 (3):125-130.

Population structure, Length weight relationship and condition factor of two ..
DOI: 10.9790/2380-1407013548 www.iosrjournals.org 48 | Page
[17]. Okoh FA, Eyo JE, Ezenwaji HMG. Species composition and abundance of castnet fishery of a tropical lotic freshwater
ecosystem.Bio-Research. 2007; 5(1): 201-206.
[18]. Oniye SJ, Adebote DA, Usman SK, Makpo JK. Some Aspect of the Biology of Protopterus annectens(Owen) in Jachi Dam Near
Katsina, Katsina State, Nigeria. Journal of fisheries and Aquatic Science.2006; 1(2):136-141.
[19]. Olaosebikan BD, Raji A. Field Guide to Nigerian Freshwater Fishes. Federal College of Freshwater Fisheries Technology, New
Bussa, Nigeria.1998; Pp. 1-106.
[20]. Gayanilo Jr FC, Sparre P, Pauly D. “FAO-ICLARM Stock Assessment Tools II (FiSAT II). Revised Version.User’s Guide.”FAO
Computerized Information Series (Fisheries), 2005; 8: 1-168.
[21]. Kassahun A, Fekadu T, Zenebe T. Adaptability, Growth and Reproductive success of Nile Tilapia, Oreochromis niloticus L.
(Pisces: Cichlidae) stocked in Lake Small Abaya, South Ethiopia. Ethiopia Journal Biological Science.2011; 10 (2): 153-166.
[22]. Zenebe T. Breeding season, fecundity, length-weight relationship and condition factor of Tilapia zilli and Oreochromis niloticus L.
(Pisces: Cichlidae) in Lake Tana, Ethiopia. SINET: Ethiopia Journal Science, 2008; 20 (1): 31-47.
[23]. Ogidiaka E, Esenowo IK. Length weight relationship and condition factor of Tilapia zilli in Warri River, Southern Nigeria.
International Journal of fisheries and Aquatic studies, 2015; 2 (4): 359-361.
[24]. Peña-Mendoza B, Gómez-Márquez JL, Salgado-Ugarte IH, Ramírez-Noguera D. Reproductive biology of Oreochromis
niloticus(Fryer and Ile, 1972) at Emiliano Zapata dam Morelos. International Journal Tropical Biology, 2005; 53 (3-4): 515-522.
[25]. Demeke A. The breeding season of Tilapia, Oreochromis niloticusL. in Lake Hawassa (Ethiopian Rift Valley).Hydrobiology,1996;
337: 77-83.
[26]. Gómez-Márquez JL, Peña-Mendoza B, Salgado-Ugarte IH, Guzmán-Arroyo M. Reproductive aspects of Oreochromis niloticus
(Perciformes: Cichlidae) at Coatetelco Lake, Morelos, Mexico. Revise Biology Tropics, 2003;51: 221-228.
[27]. Kassahun A, Fekadu T, Zenebe T. The cichlid fishes of the Great Lakes of Africa: Their biology and evolution (Nikolsky, 1963) in
the ecology of fishes. Oliver and Boyd, Edinburgh, Scotland.2011; 641 pp.
[28]. Abowei JFN.The Abundance, Condition factor and Length-Weight Relationship of Sardinella madernensis (Jenyns, 1842) from
Nkoro River, Niger Delta, Nigeria. Advance Journal Food Science and Technology, 2009; 1 (1): 66-71.
[29]. Ajagbe SO, Odulate DO, Idowu AA, Ajagbe RO, AlaoDO, Adekunle AO. Length-weight relationship and condition factors of
Redbelly tilapia (Tilapia zilli) caught with gillnets in Asejire Lake, Oyo State, Nigeria. International Journal of Fisheries and
Aquatic Studies, 2016;.4 (1): 448-452.
[30]. Haruna MA. Length -weight relationship of four fish species cichlidae from Magagalake, Kano, Nigeria.Best Journal,2006; 3:109-
111.
[31]. Thomas J, Venu S, Kuruo BM. Length Weight Relationships of Some Deep-sea Fish Inhabiting the Continental Slope Beyond 250m
depth Along the West Coast of India. NAGA World Fish Centre.2003;34pp.
[32]. Agboola JI, Anetekhai MA. Length Weight Relationships of Some Fresh and Brackish Water Fishes in Badagry Creek, Nigeria.
Journal Applied Ichthyology, 2008; 24: 623-625.
[33]. Sachidanandamurthy KL, Yajurvedi HN. A study on growth co-efficient and relative condition factor of the major carp (Catlacatla)
in two lakes differing in water quality. Applied Ecological and Environmental Research, 2008; 6 (3):33-47.
[34]. Rice MA, Mmochi AJ, Zuberi L, Savoie R. Aquaculture in Tanzania. World Aquaculture, 2006; 37: 56-57.
[35]. Rahman M, Hossain Y, Jewel AS, Rahman MM, Jasmine S, Elgorban M. Population Structure, Length-weight and Length-length
Relationships, and Condition- and Form-Factors of the Pool barb Puntius sophore (Hamilton, 1822) (Cyprinidae) from the
ChalanBeel, North-Central Bangladesh. SainsMalaysiana, 2012;41 (7):795-802.
[36]. Froese R. Cube law, condition factor and weight–length relationships: history, meta-analysis and recommendations. Journal of
Applied Ichthyology,2006; 22 (4):241-253.
[37]. Kamaruddin IS, Mustafa-Kamal AS, Christianus A, Daud SK, Amin SMN, Yu-Abit L. Length-weight Relationship and Condition
Factor of three Dominant Species from the Lake Tasik Kenyir, Terengganu, Malaysia. Journal of Fisheries and Aquatic Science,
2012;6(7): 852-856.
[38]. Hossain MY, Ahmed ZF, Leunda PM, Jasmine S, Oscoz J, Miranda R, Ohtomi J. Condition, Length-weight and Length-length
Relationships of the Asian Striped Catfish Mystus vittatus(Bloch, 1794) (Siluriformes: Bagridae) in the Mathabhanga River,
Southwestern Bangladesh. Journal of Applied Ichthyology,2006; 22: 304-307.
[39]. Mansor MI, CheSalmah MR, Rosalina R, Shahrul Anuar MS, Amir Shah Ruddin MS. Length-weight relationships of freshwater
fish species in Kerian River Basin and Pedu Lake. Research Journal of Fisheries and Hydrobiology, 2010; 5(1) 1-8.
[40]. Barnham C, Baxter A. Condition Factor (K), for Salmonid Fish. Fisheries Notes, 1998; Pp. 1-9.
Uneke Bilikis I, et. al. “Population structure, Length weight relationship and condition factor of two
Tilapia species in a Tropical River System: Implications for Fishery Assessment, Modelling and
Conservation.” IOSR Journal of Agriculture and Veterinary Science (IOSR-JAVS), 14(7), 2021, pp.
35-48