port everglades - cloudinary · 1.4.1 marine-side geographical domain ... port everglades berths...
TRANSCRIPT


Port Everglades
2015 Baseline Air Emissions Inventory
Prepared for:
December 2016
Prepared by:
2015 Baseline Air Emissions Inventory
Port Everglades December 2016
TABLE OF CONTENTS
OVERVIEW .......................................................................................................................................................... 1
EXECUTIVE SUMMARY ....................................................................................................................................... 1
SECTION 1 INTRODUCTION ............................................................................................................................. 1 1.1 Reason for Study .................................................................................................................................... 1 1.2 Port Overview ........................................................................................................................................ 2 1.3 Scope of Study ........................................................................................................................................ 4
1.3.1 Pollutants Estimated ............................................................................................................................ 4 1.3.2 Emission Source Categories .................................................................................................................. 7
1.4 Geographical Domain ........................................................................................................................... 8 1.4.1 Marine-side Geographical Domain ....................................................................................................... 8 1.4.2 Land-side Geographical Domain ........................................................................................................ 10
SECTION 2 SUMMARY RESULTS ..................................................................................................................... 11
SECTION 3 OCEAN-GOING VESSELS ............................................................................................................ 17 3.1 Source Description .............................................................................................................................. 17 3.2 Geographical Domain ......................................................................................................................... 21 3.3 Data and Information Acquisition .................................................................................................... 24 3.4 Operational Profiles ............................................................................................................................ 27 3.5 Emission Estimation Methodology .................................................................................................. 29
3.5.1 Propulsion Engine Maximum (MCR) Continuous Rated Power ........................................................ 30 3.5.2 Propulsion Engine Load Factor ......................................................................................................... 31 3.5.3 Propulsion Engine Activity ................................................................................................................ 31 3.5.4 Propulsion Engine Emission Factors .................................................................................................. 32 3.5.5 Propulsion Engines Low Load Emission Factors ............................................................................... 33 3.5.6 Propulsion Engine Power Rating ........................................................................................................ 36 3.5.7 Auxiliary Engine Emission Factors ................................................................................................... 36 3.5.8 Auxiliary Engine Load Defaults ....................................................................................................... 37 3.5.9 Auxiliary Boiler Emission Factors and Load Defaults ...................................................................... 39
3.6 OGV Emission Estimates .................................................................................................................. 41
SECTION 4 HARBOR CRAFT ........................................................................................................................... 43 4.1 Source Description .............................................................................................................................. 43 4.2 Data and Information Acquisition .................................................................................................... 47 4.3 Emission Estimation Methodology .................................................................................................. 48 4.4 Harbor Craft Emission Estimates ..................................................................................................... 51
SECTION 5 NON-ROAD CARGO HANDLING EQUIPMENT ........................................................................ 52 5.1 Source Description .............................................................................................................................. 52 5.2 Data and Information Acquisition .................................................................................................... 53 5.3 Emission Estimation Methodology .................................................................................................. 55 5.4 Emission Estimates ............................................................................................................................. 58
2015 Baseline Air Emissions Inventory
Port Everglades December 2016
SECTION 6 ON-ROAD VEHICLES .................................................................................................................. 59 6.1 Source Description .............................................................................................................................. 59 6.2 Data and Information Acquisition .................................................................................................... 60 6.3 Emission Estimation Methodology .................................................................................................. 63 6.4 Emission Estimates ............................................................................................................................. 65
SECTION 7 RAIL LOCOMOTIVES .................................................................................................................... 66 7.1 Source Description .............................................................................................................................. 66 7.2 Data and Information Acquisition .................................................................................................... 66 7.3 Emission Estimation Methodology .................................................................................................. 67 7.4 Emission Estimates ............................................................................................................................. 71
SECTION 8 ELECTRICAL POWER CONSUMPTION ....................................................................................... 72 8.1 Source Description .............................................................................................................................. 72 8.2 Data and Information Acquisition .................................................................................................... 72 8.3 Emission Estimation Methodology .................................................................................................. 72 8.4 Emission Estimates ............................................................................................................................. 73
APPENDIX A – TRANSIT EMISSIONS APPENDIX B - GLOSSARY
2015 Baseline Air Emissions Inventory
Port Everglades December 2016
LIST OF TABLES
Table ES.1: 2015 Mobile Source Emissions, tons and tonnes per year ............................................. ES-1 Table ES.2: 2015 Port Emissions Compared to County and State Emissions, tons and % ........... ES-2 Table 1.1: List of Facilities ............................................................................................................................... 3 Table 1.2: Pollutant and Greenhouse Gases Description ........................................................................... 5 Table 2.1: 2015 Mobile Source Emissions, tons and tonnes per year ..................................................... 11 Table 2.2: 2015 Port Emissions Compared to County and State Emissions, tons and % ................... 11 Table 2.3: 2015 Energy Consumption and GHG Emission Estimate ................................................... 16 Table 3.1: 2015 Arrivals, Departures, and Shifts by Vessel Type ............................................................ 27 Table 3.2: 2015 Hotelling Times at Berth, hours ....................................................................................... 28 Table 3.3: 2015 Hotelling Times at Anchorage, hours .............................................................................. 29 Table 3.4: OGV Fuel Correction Factors ................................................................................................... 32 Table 3.5: Emission Factors for Propulsion Engines using 0.1 %S MGO, g/kW-hr .......................... 33 Table 3.6: Low-Load Emission Factor Regression Equation Variables ................................................. 34 Table 3.7: Low Load Adjustment Multipliers for Emission Factors ...................................................... 35 Table 3.8: Emission Factors for Auxiliary Engines using 0.1% S MGO, g/kW-hr ............................. 36 Table 3.9: Average Auxiliary Engine Load Defaults, kW ......................................................................... 37 Table 3.10: Cruise Ship Average Auxiliary Engine Load Defaults, kW .................................................. 38 Table 3.11: Emission Factors for Auxiliary Boilers using 0.1% S MGO, g/kW-hr ............................ 39 Table 3.12: Auxiliary Boiler Load Defaults, kW ........................................................................................ 40 Table 3.13: 2015 OGV Emissions by Business Line ................................................................................. 41 Table 3.14: 2015 OGV Emissions by Vessel Type .................................................................................... 41 Table 3.15: 2015 OGV Emissions by Emission Source Type ................................................................. 42 Table 3.16: 2015 OGV Emissions by Operating Mode ............................................................................ 42 Table 4.1: 2015 Propulsion Engine Characteristics by Harbor Craft Type ............................................ 48 Table 4.2: 2015 Auxiliary Engine Characteristics by Harbor Craft Type ............................................... 48 Table 4.3: Load Factors ................................................................................................................................. 49 Table 4.4: Fuel Correction Factors ............................................................................................................... 49 Table 4.5: Harbor Craft (Except Yachts) Emission Factors for Diesel Engines, g/kW-hr ................ 50 Table 4.6: 2015 Emissions from Harbor Craft that Called the Port ....................................................... 51 Table 5.1: 2015 Equipment Characteristics ................................................................................................ 54 Table 5.2: MOVES2014a/NONROAD Engine Source Categories ...................................................... 57 Table 5.3: 2015 Equipment Emissions ........................................................................................................ 58 Table 6.1: Estimated 2015 HDV Vehicle Miles Traveled and Idling ...................................................... 61 Table 6.2: Estimated Cruise Traffic Trips ................................................................................................... 62 Table 6.3: Emission Factors for On-Road Vehicle Operations ............................................................... 64 Table 6.4: Emission Factors for On-Site (On-terminal) Vehicle Operations ........................................ 64 Table 6.5: 2015 Estimated Emissions from Onroad Vehicles ................................................................. 65 Table 7.1: ICTF Container Throughput and Number of Containers per Train ................................... 67 Table 7.2: Estimate of Running Horsepower-Hours ................................................................................ 68 Table 7.3: Estimate of Idling Horsepower-Hours ..................................................................................... 69 Table 7.4: EPA Tier Level Emission Factors for Locomotives............................................................... 70 Table 7.5: Summary of Locomotive Emission Factors ............................................................................. 71 Table 7.6: 2015 Estimated Emissions from Locomotives ........................................................................ 71 Table 8.1: GHG Emission Rates (g/kW-hr) and Source .......................................................................... 73 Table 8.2: 2015 Energy Consumption and GHG Emission Estimate ................................................... 73
2015 Baseline Air Emissions Inventory
Port Everglades December 2016
LIST OF FIGURES
Figure 1.1: Aerial View of the Entrance Channel ........................................................................................ 8 Figure 1.2: Marine-Side Geographical Domain ............................................................................................ 9 Figure 1.3: Aerial View of Port Everglades Boundary .............................................................................. 10 Figure 2.1: NOx Emissions Distribution by Mobile Source Category .................................................... 12 Figure 2.2: PM10 Emissions Distribution by Mobile Source Category.................................................... 12 Figure 2.3: PM2.5 Emissions Distribution by Mobile Source Category ................................................... 12 Figure 2.4: DPM Emissions Distribution by Mobile Source Category .................................................. 12 Figure 2.5: VOC Emissions Distribution by Mobile Source Category ................................................... 13 Figure 2.6: CO Emissions Distribution by Mobile Source Category ...................................................... 13 Figure 2.7: SO2 Emissions Distribution by Mobile Source Category ..................................................... 13 Figure 2.8: CO2e Emissions Distribution by Mobile Source Category ................................................... 13 Figure 2.9: NOx Comparison ........................................................................................................................ 14 Figure 2.10: PM10 Comparison ..................................................................................................................... 14 Figure 2.11: PM2.5 Comparison ..................................................................................................................... 14 Figure 2.12: DPM Comparison .................................................................................................................... 14 Figure 2.13: VOC Comparison ..................................................................................................................... 15 Figure 2.14: CO Comparison ........................................................................................................................ 15 Figure 2.15: SO2 Comparison ....................................................................................................................... 15 Figure 3.1: Container Ship at Port Everglades ........................................................................................... 18 Figure 3.2: Cruise Vessels at Port Everglades ............................................................................................ 18 Figure 3.3: General Cargo Vessel at Port Everglades ................................................................................ 19 Figure 3.4: Tanker at Port Everglades ......................................................................................................... 19 Figure 3.5: 2015 Distribution of Calls by Vessel Type .............................................................................. 20 Figure 3.6: Marine-Side Geographical Domain .......................................................................................... 22 Figure 3.7: Port Everglades Berths and Terminal Areas ........................................................................... 23 Figure 3.8: Processed AIS Dataset ............................................................................................................... 25 Figure 3.9: Processed AIS Vessel Tracks .................................................................................................... 26 Figure 4.1: Assist Tug ..................................................................................................................................... 44 Figure 4.2: Articulated Tug Barge ................................................................................................................ 44 Figure 4.3: Pilot Boat ...................................................................................................................................... 45 Figure 4.4: Towboat ....................................................................................................................................... 45 Figure 4.5: Yacht ............................................................................................................................................. 46 Figure 4.6: 2015 Distribution of Discrete Vessel Count for Harbor Craft ............................................ 46 Figure 5.1: 2015 Distribution of Equipment Engine Type ...................................................................... 52 Figure 5.2: 2015 Distribution of Equipment Count .................................................................................. 55 Figure 6.1: Trucks at Port Everglades.......................................................................................................... 60 Figure 6.2: Liquid Tanker Trucks ................................................................................................................. 60
2015 Baseline Air Emissions Inventory
Port Everglades December 2016
ACKNOWLEDGEMENTS The following individuals and their respective companies and organizations assisted with providing the technical and operational information described in this report, or facilitated the process to obtain this information. We would like to recognize all who contributed their knowledge and understanding to the operations of various source categories. We truly appreciate their time, effort, expertise, and cooperation. Fidel Murgas, Amerada Hess/Buckeye David Speigl, Cemex Construction Materials Florida, Inc. Vic Zemaitis, Chevron Davison de Araujo, Citgo William Coleman, Coleary Transport Company, Inc. Jeff Brueggemann, Crowley Liner Services, Inc. Max Wigglesworth, Crowley Liner Services, Inc. Al Johnson, Eller-ITO Stevedoring Company, LLC Jon Hester, ExxonMobil Ignasi Sola, FAST Terminals/Horizon Terminal Services Robert Ledoux, Florida East Coast Railway John Shapiro, Florida International Terminal, LLC Andrew Bayuk, Host Terminals, Inc. Al McNab, Hyde Shipping Corporation Guy D’Amico, Kinder Morgan Dennis Willower, Lehigh Cement Rich Walker, Marathon Petroleum Charles Runnion, McAllister Towing Rick Bowen, Motiva Captain Andy Edelstein, Port Everglades Pilots Association Terry Hirsch, Portus-PEV, LLC Ron Bitter, SEACOR John Gorman, Seafreight Terminal/Florida Transportation Services, Inc. Enda Walsh, Sol Shipping Services, Inc. Stefanos Kasettas, Sun Terminals, Inc. Jeff Walters, Targa Casey Brouwer, Transmontaigne North Terminal Kevin Brooks, Transmontaigne South Terminal Richard Vogel, Vecenergy Broward County’s Port Everglades Department
2015 Baseline Air Emissions Inventory
Port Everglades December 2016
ACKNOWLEDGEMENTS (CONT’D)
The Port Everglades Baseline Air Emissions Inventory was the result of a group effort that included Port Everglades staff and a technical working group that included local, state and federal environmental agencies. Project Leadership and Management David Anderton, Assistant Director, Broward County’s Port Everglades Department Peg Buchan, Assistant Port Director, Broward County’s Port Everglades Department Erik Neugaard, Environmental Program Manager, Broward County’s Port Everglades Department Technical Working Group Dale Aspy, Region 4, EPA Daniel Bizer-Cox, Office of Transportation and Air Quality, EPA Samantha Danchuk, Broward County Environmental Protection and Growth Management Department Dick Dodge, Port Everglades Association Environmental Committee Albert Lee, Broward County Environmental Protection and Growth Management Department Meg Patulski, Office of Transportation and Air Quality, EPA Alan Powell, Region 4, EPA Rich Vogel, Port Everglades Association Environmental Committee Robert Wong, Broward County Environmental Protection and Growth Management Department Authors: Archana Agrawal, Principal, Starcrest
Guiselle Aldrete, Consultant for Starcrest Bruce Anderson, Principal, Starcrest Rose Muller, Consultant for Starcrest Joseph Ray, Principal, Starcrest
Contributors: Steve Ettinger, Principal, Starcrest Jill Morgan, Consultant for Starcrest
Randall Pasek, Consultant for Starcrest Cover: Melissa Anderson, Principal, Starcrest Document Preparation: Denise Anderson, Consultant for Starcrest Photos: Provided by Port Everglades
2015 Baseline Air Emissions Inventory
Port Everglades December 2016
ACRONYMS AND ABBREVIATIONS
AIS automatic identification system
ATB articulated tug and barge
BSFC brake specific fuel consumption
CF control factor
CI compression ignition
CHE cargo handling equipment
CFR Code of Federal Regulations
CH4 methane
CO carbon monoxide
CO2 carbon dioxide
CO2e carbon dioxide equivalent
D distance
DF deterioration factor
DPM diesel particulate matter
DR deterioration rate
E emissions
ECA emission control area
EF emission factor
EI emissions inventory
EIAPP Engine International Air Pollution
Prevention Certificate
EPA U.S. Environmental Protection Agency
EEIA Energy & Environmental Analysis, Inc.
FCF fuel correction factor
FECR Florida East Coast Railway
FPL Florida Power and Light
FR federal register
g/bhp-hr grams per brake horsepower-hour
g/hr grams per hour
g/kW-hr grams per kilowatt-hour
g/mi grams per mile
GIS geographic information system
GHG greenhouse gas
GTM gross ton-miles
GWP global warming potential
HC hydrocarbons
HDV heavy-duty vehicle
HFO heavy fuel oil
hp horsepower
hrs hours
IARC International Agency for Research on
Cancer
ICTF intermodal container transfer facility
IFO intermediate fuel oil
IMO International Maritime Organization
IHS IHS Maritime World Register of Ships
IVL Swedish Environmental Research Institute
kW kilowatt
kW-hr kilowatt hour
lbs/day pounds per day
LF load factor
LLA low load adjustment
Lloyd’s Lloyd’s Register of Ships
LNG liquefied natural gas
LPG liquefied petroleum gas
MARPOL International Convention for the Prevention
of Pollution from Ships
MCR maximum continuous rating
MDO marine diesel oil
MGO marine gas oil
mph miles per hour
MMGTM million gross ton-miles
MMSI maritime mobile service identity
MOVES Motor Vehicle Emissions Simulator,
EPA model
MY model year
MWhr megawatt hour
N2O nitrous oxide
NEI EPA National Emissions Inventory
nm nautical miles
NONROAD Module of EPA MOVES
NOx oxides of nitrogen
NR not reported
OGV ocean-going vessel
OTAQ Office of Transportation and Air Quality,
EPA
PM particulate matter
PM10 particulate matter less than 10 microns
in diameter
PM2.5 particulate matter less than 2.5 microns
in diameter
ppm parts per million
RCAP Regional Climate Action Plan
RIA Regulatory Impact Analysis
2015 Baseline Air Emissions Inventory
Port Everglades December 2016
RoRo roll-on roll-off vessel
rpm revolutions per minute
RTG rubber tired gantry crane
S sulfur
SCC source classification code
SFC specific fuel consumption
SO2 Sulfur dioxide
SP31 Regional Climate Plan recommendation
to incorporate climate adaption strategy
TEU twenty-foot equivalent unit
tons Short tons
tonnes metric tons
tpy tons per year
U.S. United States
ULSD ultra-low sulfur diesel
USCG U.S. Coast Guard
VBP vessel boarding program
VMT vehicle miles of travel
VOC volatile organic compound
ZH zero hour
ZMR zero-mile rate
2015 Baseline Air Emissions Inventory
Port Everglades O-1 December 2016
OVERVIEW What is the emissions inventory? The Port Everglades 2015 Baseline Air Emissions Inventory identifies and quantifies pollutants emitted from maritime-related mobile diesel equipment operating within the Port jurisdictional boundary. It was conducted voluntarily and proactively, in advance of any regulatory directive, to provide a strong technical foundation to support future policy decisions. The inventory is not a policy document and does not include policy recommendations. Who developed the emissions inventory? The inventory was developed by Starcrest Consulting Group, LLC, in cooperation with local, state and federal agencies. It was funded by Port Everglades. A partnership agreement was developed jointly by Port Everglades and the Environmental Protection Agency’s (EPA) Office of Transportation and Air Quality (OTAQ). What will the partnership accomplish? The partnership will allow the EPA to develop future methods, provide lessons learned, and provide practical examples that can be shared with other ports, related agencies, and stakeholders to support and encourage sustainable development. In addition, the EPA will develop separate emissions estimates for areas outside the Port jurisdictional boundaries, such as highways and railways used by Port Everglades customers. Why was the inventory developed? A long-term strategic clean air plan, incorporating real data, scientific projections, management solutions, and governmental outreach support/actions is necessary to maintain excellent air quality in and around the Port. This emissions inventory provides scientifically valid data to improve understanding of the nature and magnitude of emissions from maritime-related operations at the Port. What does it measure? It estimates tons per year of emissions from maritime-related activities for calendar year 2015. Pollutants in the inventory include relevant EPA criteria pollutants and precursors (carbon monoxide, nitrogen oxides, sulfur dioxide, volatile organic compounds and particulate matter); greenhouse gases (carbon dioxide, methane and nitrous oxide); and diesel particulate matter. Data was gathered for the following mobile source categories associated with marine activities: ocean-going vessels (such as cargo and cruise ships, tankers); harbor vessels (towboats and yachts); cargo handling equipment (cranes, straddle carriers, forklifts, etc.); on-road vehicles (heavy-duty vehicles, light and medium duty vehicles that transport cruise passengers, and port-owned on-terminal fleet vehicles); and rail operations. It also includes emissions for electrical power consumption from public and private entities. It does not include point source emissions from the petroleum facilities located within port property as this is a mobile source inventory and does not include stationary sources.

2015 Baseline Air Emissions Inventory
Port Everglades ES-1 December 2016
EXECUTIVE SUMMARY The Port Everglades Baseline Air Emissions Inventory study presents a detailed overview of port-related emissions based on 2015 activity levels at Port Everglades (the Port), Broward County, Florida. This activity-based emissions inventory provides detailed information on the major mobile source categories associated with the marine activities, which are ocean-going vessels, harbor vessels, cargo handling equipment, on-road heavy-duty and light-duty vehicles, and rail operations. It also includes greenhouse gas emissions from electrical power consumption for buildings and lighting. The geographical domain for the landside source categories is within the Port jurisdictional boundary and its associated terminals. The marine-side geographical domain includes the port jurisdiction and extends three nautical miles beyond the entrance channel. In partnership with the U.S. Environmental Protection Agency (EPA), the Port undertook the development of this emissions inventory of Port-related mobile emission sources and is the first port in the U.S. to partner with EPA in this type of landmark air emissions study. Broward County currently meets environmental standards for air quality; however, the Port chose to create a benchmark or baseline by which to measure future changes in emissions to take necessary actions to maintain air quality standards in the future. The total 2015 emissions for maritime-related mobile sources in Port Everglades are summarized in Table ES.1. Starting in 2015, the North American Emission Control Area (ECA) required all ocean-going vessels (OGV) to utilize fuels with 0.1% S or cleaner. The ocean-going vessel emissions were estimated using this lower sulfur fuel and therefore the OGV and overall SO2 emissions are lower in 2015 than they would have been in previous years. The diesel fuel used by the other mobile source categories is ultra-low sulfur diesel (ULSD) with sulfur content at 15 parts per million (ppm).
Table ES.1: 2015 Mobile Source Emissions, tons and tonnes per year
Sources NOx PM10 PM2.5 DPM VOC CO SO2 CO2e
tons tons tons tons tons tons tons tonnes
Ocean-going vessels 2,001 43.73 41.07 37.95 73.44 183.40 88.45 126,141
Harbor craft 184 5.06 4.67 5.06 7.07 72.73 0.12 11,834
Cargo handling equipment 218 13.83 13.40 13.82 24.81 89.17 0.17 24,729
On-road vehicles 54 3.96 3.65 3.94 5.99 26.96 0.11 10,783
Locomotives 1 0.02 0.02 0.02 0.04 0.36 0.00 136
Total 2,458 66.60 62.82 60.78 111.36 372.61 88.85 173,623
2015 Baseline Air Emissions Inventory
Port Everglades ES-2 December 2016
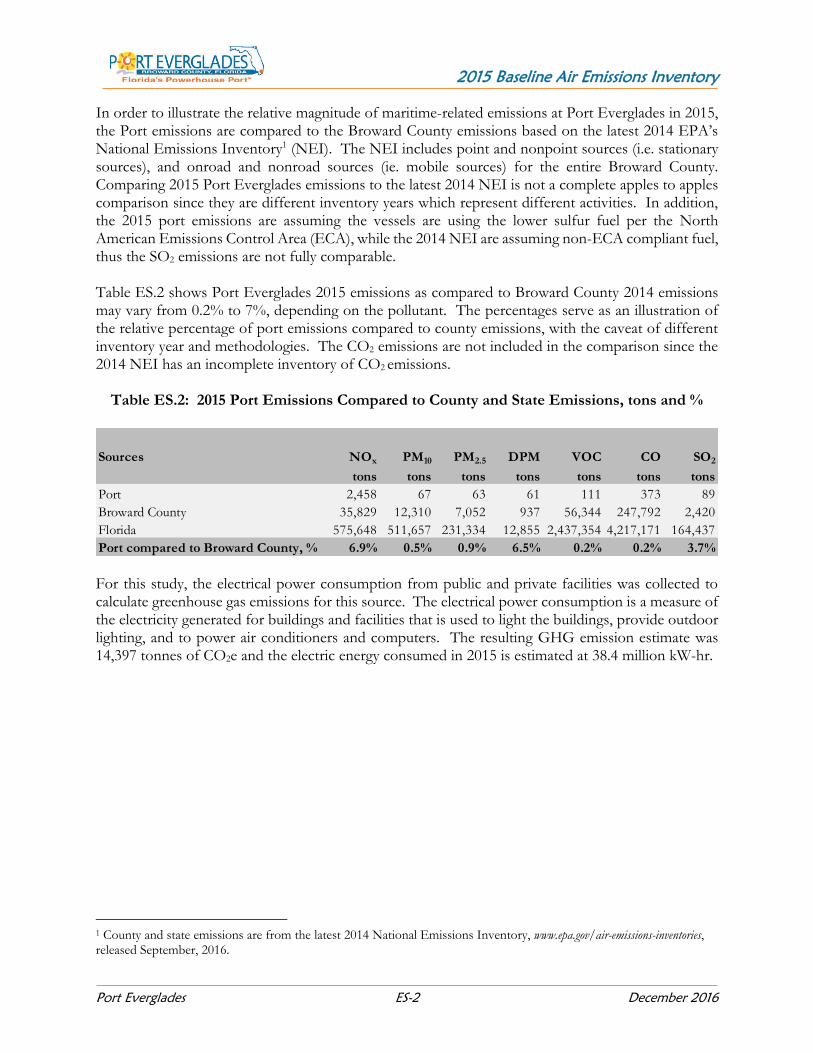
In order to illustrate the relative magnitude of maritime-related emissions at Port Everglades in 2015, the Port emissions are compared to the Broward County emissions based on the latest 2014 EPA’s National Emissions Inventory1 (NEI). The NEI includes point and nonpoint sources (i.e. stationary sources), and onroad and nonroad sources (ie. mobile sources) for the entire Broward County. Comparing 2015 Port Everglades emissions to the latest 2014 NEI is not a complete apples to apples comparison since they are different inventory years which represent different activities. In addition, the 2015 port emissions are assuming the vessels are using the lower sulfur fuel per the North American Emissions Control Area (ECA), while the 2014 NEI are assuming non-ECA compliant fuel, thus the SO2 emissions are not fully comparable. Table ES.2 shows Port Everglades 2015 emissions as compared to Broward County 2014 emissions may vary from 0.2% to 7%, depending on the pollutant. The percentages serve as an illustration of the relative percentage of port emissions compared to county emissions, with the caveat of different inventory year and methodologies. The CO2 emissions are not included in the comparison since the 2014 NEI has an incomplete inventory of CO2 emissions.
Table ES.2: 2015 Port Emissions Compared to County and State Emissions, tons and %
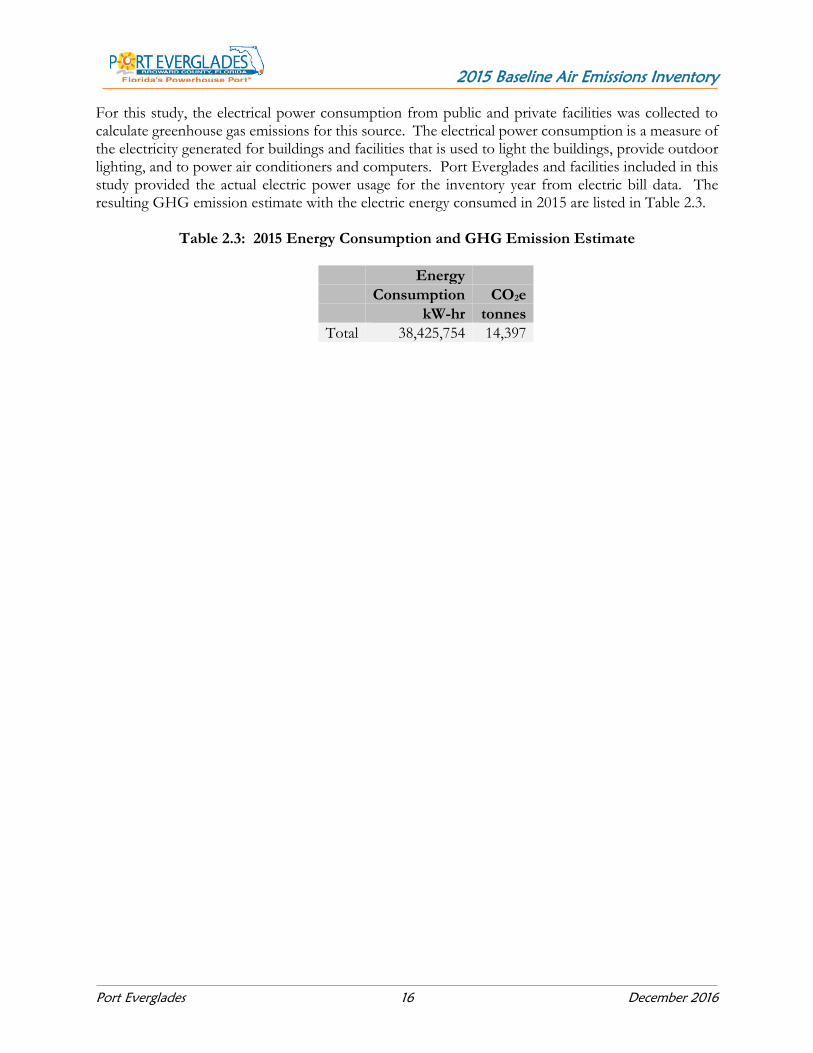
For this study, the electrical power consumption from public and private facilities was collected to calculate greenhouse gas emissions for this source. The electrical power consumption is a measure of the electricity generated for buildings and facilities that is used to light the buildings, provide outdoor lighting, and to power air conditioners and computers. The resulting GHG emission estimate was 14,397 tonnes of CO2e and the electric energy consumed in 2015 is estimated at 38.4 million kW-hr.
1 County and state emissions are from the latest 2014 National Emissions Inventory, www.epa.gov/air-emissions-inventories, released September, 2016.
Sources NOx PM10 PM2.5 DPM VOC CO SO2
tons tons tons tons tons tons tons
Port 2,458 67 63 61 111 373 89
Broward County 35,829 12,310 7,052 937 56,344 247,792 2,420
Florida 575,648 511,657 231,334 12,855 2,437,354 4,217,171 164,437
Port compared to Broward County, % 6.9% 0.5% 0.9% 6.5% 0.2% 0.2% 3.7%

2015 Baseline Air Emissions Inventory
Port Everglades 1 December 2016
SECTION 1 INTRODUCTION The Port Everglades Baseline Air Emissions Inventory study presents a detailed overview of port-related emissions based on 2015 activity levels at Port Everglades (the Port), Broward County, Florida. This activity-based emissions inventory provides detailed information on the major mobile source categories associated with the marine activities, which are ocean-going vessels, harbor vessels, cargo handling equipment, on-road heavy-duty and light-duty vehicles, and rail operations. It also includes greenhouse gas emissions from electrical power consumption for buildings and lighting. 1.1 Reason for Study A long-term strategic clean air plan, incorporating real data, scientific projections, management solutions, and governmental outreach support/actions is necessary to maintain excellent air quality in and around the Port. In addition, Regional Climate Action Plan (RCAP)2 recommendation number SP31 calls for incorporating climate adaptation strategies and greenhouse gas emissions inventories into Seaport Master Plans. In support of these needs, and in partnership with the U.S. Environmental Protection Agency (EPA), the Port undertook the development of this emissions inventory of Port-related mobile emission sources. Port Everglades is the first port in the U.S. to partner with EPA in this type of landmark air emissions study. Broward County currently meets environmental standards for air quality; however, the Port chose to create a benchmark or baseline by which they can measure future changes in emissions so that they can take necessary actions to maintain air quality standards in the future. The partnership agreement was developed jointly by the Port and EPA’s Office of Transportation and Air Quality. The partnership will allow EPA to develop future methodologies, provide lessons learned, and provide practical examples that can be shared with other ports, agencies and stakeholders to support and encourage sustainable development. In addition to this inventory that is funded by Port Everglades, EPA will develop a separate emissions assessment for areas outside the Port’s jurisdictional boundaries such as highways and railways used by Port customers. This inventory will help identify where emission reductions could provide the best public health and environmental benefits.
2 Southeast Florida Regional Climate Change Compact Counties, Regional Climate Action Plan, October 2012. See: www.southeastfloridaclimatecompact.org/wp-content/uploads/2014/09/regional-climate-action-plan-final-ada-compliant.pdf

2015 Baseline Air Emissions Inventory
Port Everglades 2 December 2016
1.2 Port Overview Port Everglades, located in the cities of Hollywood, Ft. Lauderdale, and Dania Beach in Broward County, Florida, is a diverse seaport capable of handling many types of cargo. Port Everglades is Florida’s leading container port, it is ranked among the largest cruise ports in the world, and it is also South Florida’s main seaport for receiving petroleum products. In 2015, Port Everglades welcomed over 3.7 million cruise passengers and moved intermodal containers totaling over 1 million twenty-foot equivalent units (TEUs). The Port breaks downs its operation into 3 business lines: cargo, cruise and petroleum. Table 1.1 lists the public and private facilities and entities included in this emissions inventory by business line and general facility type. The typical mobile emission sources are summarized in Table 1.2 and explained in paragraphs below. The intermodal container transfer facility (ICTF), in which containers are transferred onto and off railcars for transport by Florida East Coast Railway (FECR), is located within port property and thus included in this inventory under “other” facility type. Cargo includes auto, yachts, containers, and dry bulk. Container facilities generally receive and ship cargo in containers and tend to use cargo handling equipment more than other facility types. The two dry bulk facilities at the Port are cement facilities which operate using conveyor systems. General cargo facilities handle a mix of bulk, breakbulk and containerized cargo. These facilities may load/unload vessels that carry breakbulk and containerized cargo, so they maintain a variety of cargo handling equipment to be able to handle any cargo. The equipment at general cargo facilities that is used for specialized cargo may not be used as often, and have lower annual operating hours, compared with typical cargo handling equipment. The cruise business line includes all the cruise ships that visit the Port. The cruise terminals at Port Everglades are home to many of the largest cruise vessels in the world. These terminals use forklifts to load/unload supplies, perishables, and passengers’ luggage needed for the cruise. The petroleum business line includes the liquid bulk facilities that are situated inside of the Port boundary. The liquid bulk facilities handle petroleum products, which may be stored at the facility and/or transferred to or from barges and tankers. Liquid bulk facilities do not generally use cargo handling equipment since the materials are moved by pipeline.

2015 Baseline Air Emissions Inventory
Port Everglades 3 December 2016
Table 1.1: List of Facilities
Business Facility Facility Typical Mobile Emission Line Type Sources Cargo
Container Crowley Liner Services OGV, harbor craft, CHE, on-road vehicles, locomotives Florida International Terminal
Port Everglades Terminal Dry bulk Cemex OGV, harbor craft, on-road vehicles
Lehigh Cement General Horizon Terminal Svcs. OGV, harbor craft, CHE, on-road
vehicles Cargo Host Terminals Hyde Shipping King Ocean Services Portus PEV Seacor Island Lines Coleary Transport Co. Sol Shipping Services Sun Terminals
Cruise Cruise Terminals OGV, harbor craft, CHE Petroleum Liquid bulk Buckeye OGV, harbor craft, on-road vehicles
Chevron Citgo ExxonMobil High Sierra Energy Kinder Morgan Marathon Petroleum Motiva Enterprises Vecenergy/Valero Targa TransMontaigne
Other Other Florida East Coast Railway ICTF
CHE, locomotives
2015 Baseline Air Emissions Inventory
Port Everglades 4 December 2016
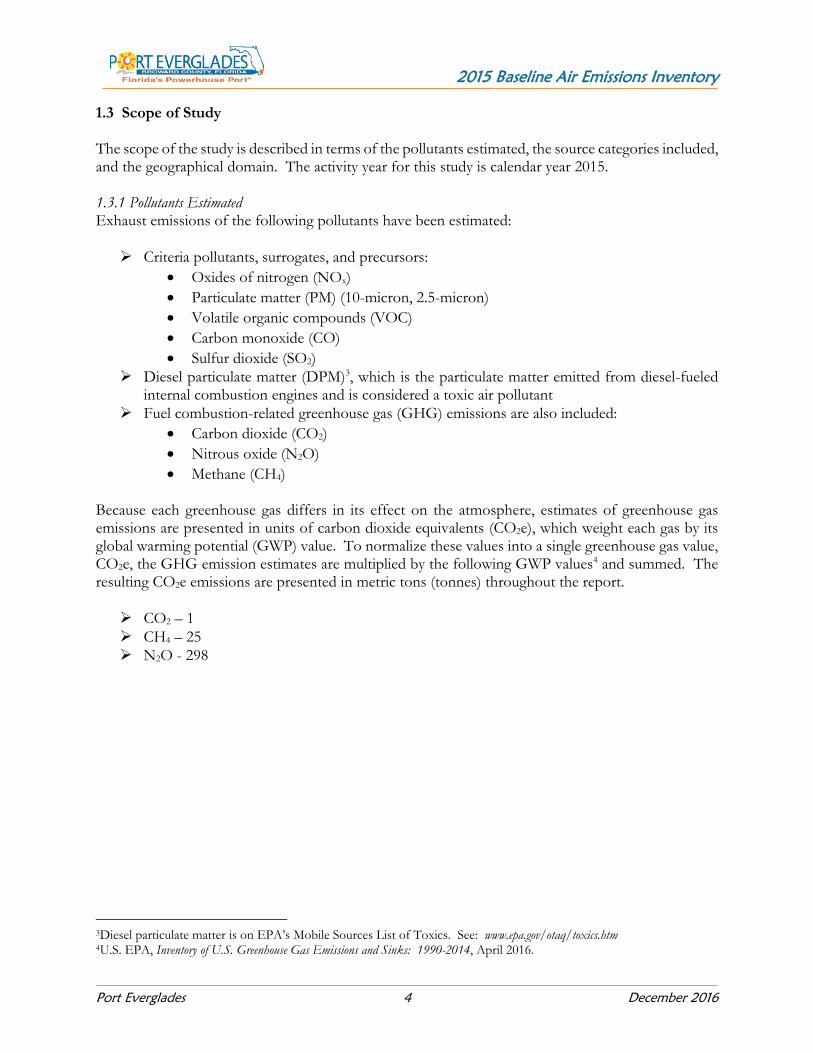
1.3 Scope of Study The scope of the study is described in terms of the pollutants estimated, the source categories included, and the geographical domain. The activity year for this study is calendar year 2015. 1.3.1 Pollutants Estimated Exhaust emissions of the following pollutants have been estimated:
Criteria pollutants, surrogates, and precursors:
Oxides of nitrogen (NOx)
Particulate matter (PM) (10-micron, 2.5-micron)
Volatile organic compounds (VOC)
Carbon monoxide (CO)
Sulfur dioxide (SO2)
Diesel particulate matter (DPM)3, which is the particulate matter emitted from diesel-fueled internal combustion engines and is considered a toxic air pollutant
Fuel combustion-related greenhouse gas (GHG) emissions are also included:
Carbon dioxide (CO2)
Nitrous oxide (N2O)
Methane (CH4) Because each greenhouse gas differs in its effect on the atmosphere, estimates of greenhouse gas emissions are presented in units of carbon dioxide equivalents (CO2e), which weight each gas by its global warming potential (GWP) value. To normalize these values into a single greenhouse gas value, CO2e, the GHG emission estimates are multiplied by the following GWP values4 and summed. The resulting CO2e emissions are presented in metric tons (tonnes) throughout the report.
CO2 – 1
CH4 – 25
N2O - 298
3Diesel particulate matter is on EPA’s Mobile Sources List of Toxics. See: www.epa.gov/otaq/toxics.htm 4U.S. EPA, Inventory of U.S. Greenhouse Gas Emissions and Sinks: 1990-2014, April 2016.

2015 Baseline Air Emissions Inventory
Port Everglades 5 December 2016
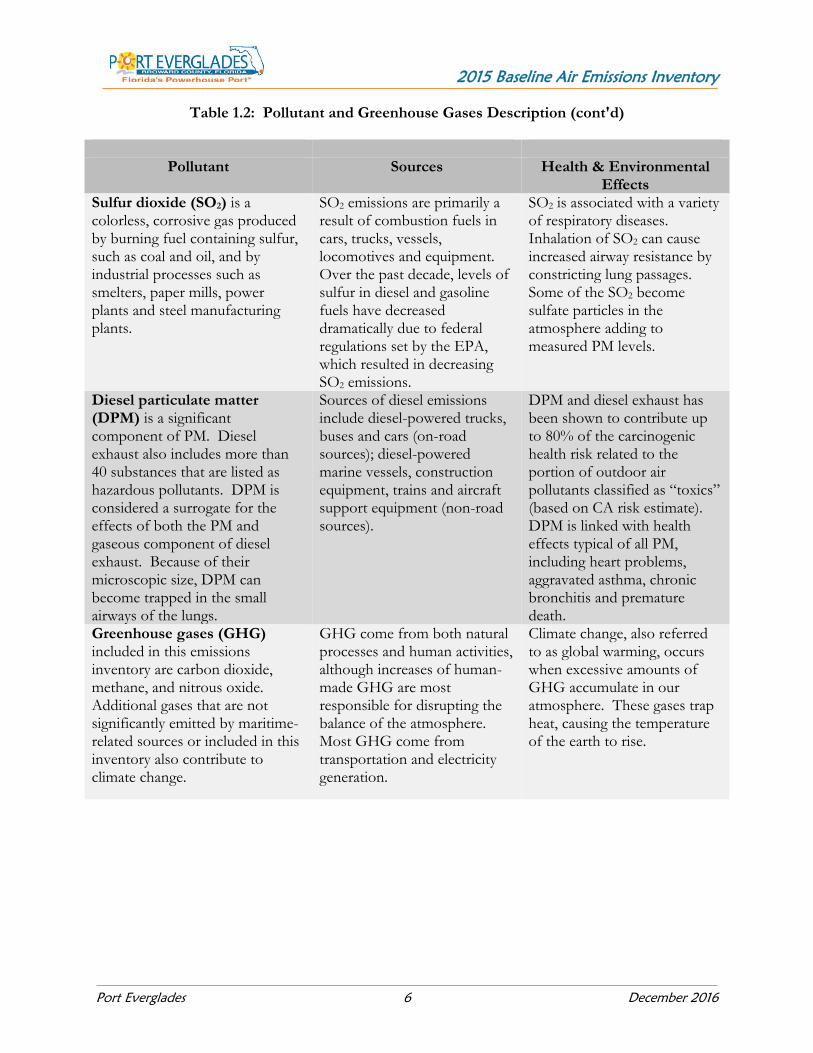
Table 1.2 provides a description of the pollutants and greenhouse gases.
Table 1.2: Pollutant and Greenhouse Gases Description
Pollutant
Sources Health & Environmental
Effects
Oxides of nitrogen (NOx) is the generic term for a group of highly reactive gases; all of which contain nitrogen and oxygen in varying amounts. Most NOx are colorless and odorless.
NOx form when fuel is burned at high temperatures, as in a combustion process. The primary manmade sources of NOx are motor vehicles, electric utilities, and other industrial, commercial, and residential sources that burn fuels.
NOx can react with other compounds in the air to form tiny particles adding to PM concentrations. NOx is an ozone precursor and is also associated with respiratory health effects.
Particulate matter (PM) refers to tiny, discrete solid or aerosol particles in the air. Dust, dirt, soot, and smoke are considered particulate matter. Two types of PM are included in this emissions inventory: PM10, which consists of particles measuring up to 10 micrometers in diameter; and PM2.5, which consists of fine particles measuring 2.5 micrometers in diameter or smaller.
Vehicle exhaust (cars, trucks, buses, among others) are the predominant sources of fine particles in urban areas. In rural areas, land-clearing burning and backyard burning of yard waste contribute to particulate matter levels.
Fine particles are a concern because their very tiny size allows them travel more deeply into lungs, increasing the potential for health risks. Exposure to PM2.5 is linked with respiratory disease, decreased lung function, asthma attacks, heart attacks and premature death.
Volatile organic compounds (VOC) are included in the emissions inventory because they are an ozone ingredient.
VOCs come from the transportation sector: cars and light trucks, marine vessels, and heavy-duty diesel vehicles. Other sources include gasoline-powered yard equipment, gasoline refueling, industrial solvents, and auto-body paint shops, among others.
In addition to contributing to the formation of ozone, some VOC are air toxics which can contribute to a wide range of adverse health effects.
Carbon monoxide (CO) is a colorless, odorless, toxic gas commonly formed when carbon-containing fuel is not burned completely.
CO forms during incomplete combustion of fuels. The majority of CO comes from on and off road vehicle engine exhaust.
CO combines with hemoglobin in red blood cells and decreases the oxygen-carrying capacity of the blood. CO weakens heart contractions, reducing the amount of blood pumped through the body. It can affect brain and lung function.
2015 Baseline Air Emissions Inventory
Port Everglades 6 December 2016
Table 1.2: Pollutant and Greenhouse Gases Description (cont'd)
Pollutant Sources Health & Environmental
Effects
Sulfur dioxide (SO2) is a colorless, corrosive gas produced by burning fuel containing sulfur, such as coal and oil, and by industrial processes such as smelters, paper mills, power plants and steel manufacturing plants.
SO2 emissions are primarily a result of combustion fuels in cars, trucks, vessels, locomotives and equipment. Over the past decade, levels of sulfur in diesel and gasoline fuels have decreased dramatically due to federal regulations set by the EPA, which resulted in decreasing SO2 emissions.
SO2 is associated with a variety of respiratory diseases. Inhalation of SO2 can cause increased airway resistance by constricting lung passages. Some of the SO2 become sulfate particles in the atmosphere adding to measured PM levels.
Diesel particulate matter (DPM) is a significant component of PM. Diesel exhaust also includes more than 40 substances that are listed as hazardous pollutants. DPM is considered a surrogate for the effects of both the PM and gaseous component of diesel exhaust. Because of their microscopic size, DPM can become trapped in the small airways of the lungs.
Sources of diesel emissions include diesel-powered trucks, buses and cars (on-road sources); diesel-powered marine vessels, construction equipment, trains and aircraft support equipment (non-road sources).
DPM and diesel exhaust has been shown to contribute up to 80% of the carcinogenic health risk related to the portion of outdoor air pollutants classified as “toxics” (based on CA risk estimate). DPM is linked with health effects typical of all PM, including heart problems, aggravated asthma, chronic bronchitis and premature death.
Greenhouse gases (GHG) included in this emissions inventory are carbon dioxide, methane, and nitrous oxide. Additional gases that are not significantly emitted by maritime-related sources or included in this inventory also contribute to climate change.
GHG come from both natural processes and human activities, although increases of human-made GHG are most responsible for disrupting the balance of the atmosphere. Most GHG come from transportation and electricity generation.
Climate change, also referred to as global warming, occurs when excessive amounts of GHG accumulate in our atmosphere. These gases trap heat, causing the temperature of the earth to rise.
2015 Baseline Air Emissions Inventory
Port Everglades 7 December 2016
1.3.2 Emission Source Categories This study includes the following port-related emission source categories, described below. Except for the electrical power consumption emissions, the port-related emissions included in this study are for mobile sources only, and are consistent with source categories included in other Air Emission Inventory reports for Port Authorities. Since this is mainly a mobile source emissions inventory, it does not include stationary source emissions that are within the port security parameter and under port jurisdiction, such as petroleum facilities, asphalt plant, and power plant. The stationary sources from the petroleum facilities, power plant and other stationary sources are accounted for in separate annual operating reports submitted to the regional and federal environmental agencies. Ocean-going Vessels Ocean-going vessels (OGVs) that called or visited the Port in 2015 have been included. A vessel call is when a vessel makes first arrival to a berth. The vessel types included are auto carrier, bulk carrier, container ship, cruise ship, general cargo, roll-on roll off (RoRo) vessel, tanker, and a miscellaneous category for vessels that cannot be grouped under the other vessel types. Harbor Craft Diesel-fueled harbor craft that work at the Port, such as pilot boats and assist tugs, plus domestic vessels that called the Port in 2015, such as articulated tug barges (ATB), towboats, and yachts have been included. Yachts have significant activity in Broward County and only the yachts that called the Port in 2015 are included in this source category. Emissions from domestic transitory marine traffic through the Atlantic Intracoastal Waterway are included in Appendix A of this report. The transitory emissions are not part of the harbor craft source category since these vessels did not call the Port, but just passed through. Cargo Handling Equipment Cargo handling equipment (CHE) has been included. This category includes equipment used to move cargo, passenger luggage, products and supplies, material handling equipment and any other equipment that is essential to port facility operations. Some examples of equipment are forklifts, cranes, loaders, reach stackers, rubber tired gantry (RTG) cranes, top loaders, trucks and yard tractors. On-road Vehicles On-road vehicles have been included, specifically heavy-duty vehicles used to move cargo into and out of the Port, light and medium-duty vehicles that transport passengers to and from the cruise terminals, and the Port’s fleet vehicles that operate within the Port. Locomotives The locomotives used by Florida East Coast Railway (FECR) at the new Intermodal Container Transfer Facility (ICTF) and to move cargo between the Port and FECR’s interface with other railroads were included. Electrical Power Consumption Grid emissions from the electricity consumed in 2015 by public and private buildings and terminals at the Port were included. These grid emissions were generated at power plants in Florida, but outside the study area. The emissions from the FPL power plant that was being built in 2015, was not included, nor were the emissions for the older power plant that was demolished in 2013.
2015 Baseline Air Emissions Inventory
Port Everglades 8 December 2016
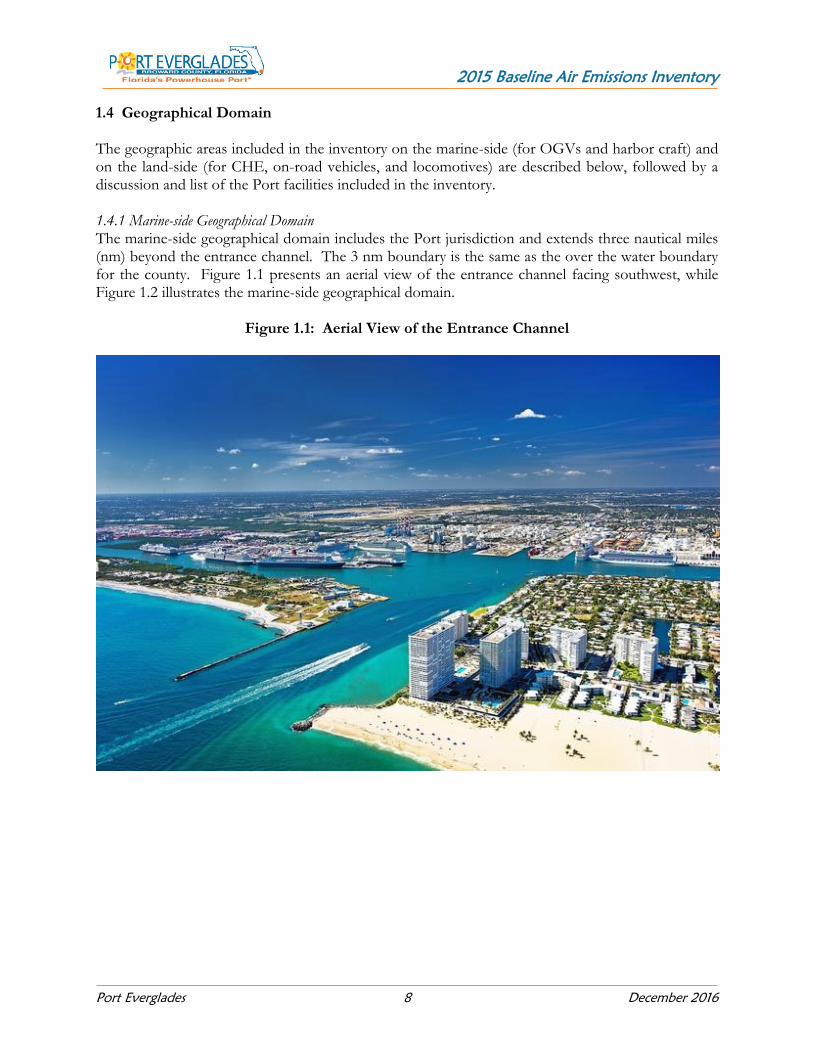
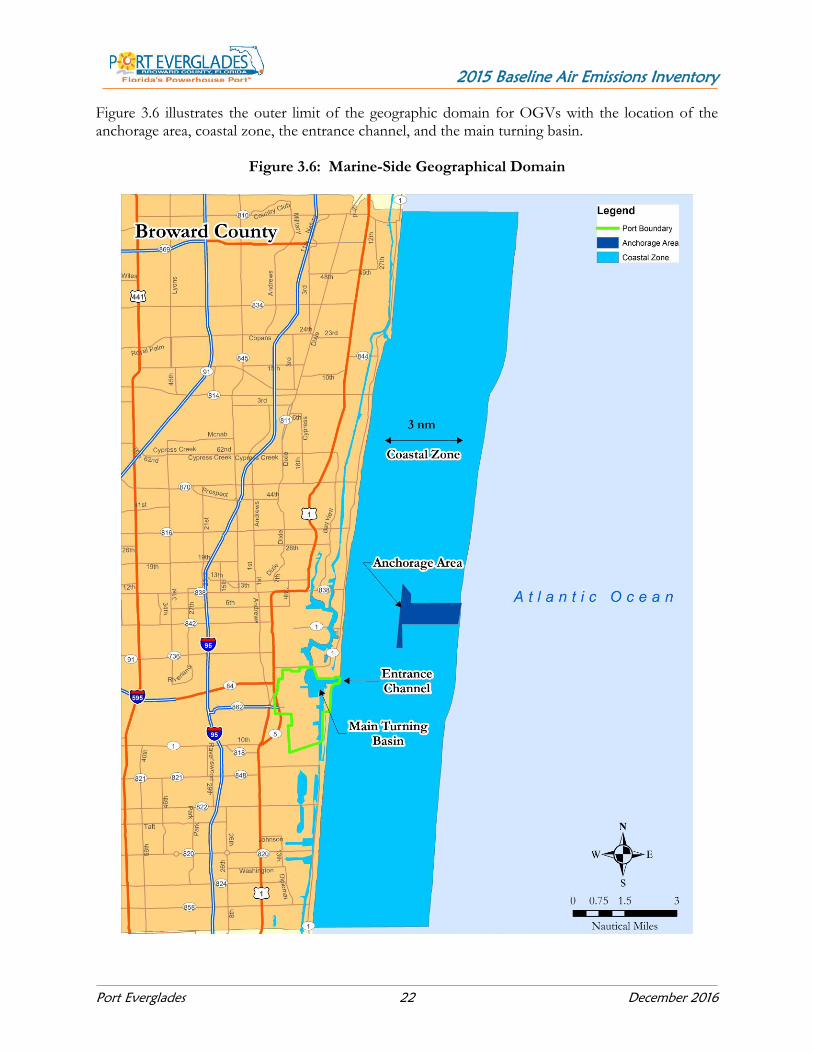
1.4 Geographical Domain The geographic areas included in the inventory on the marine-side (for OGVs and harbor craft) and on the land-side (for CHE, on-road vehicles, and locomotives) are described below, followed by a discussion and list of the Port facilities included in the inventory. 1.4.1 Marine-side Geographical Domain The marine-side geographical domain includes the Port jurisdiction and extends three nautical miles (nm) beyond the entrance channel. The 3 nm boundary is the same as the over the water boundary for the county. Figure 1.1 presents an aerial view of the entrance channel facing southwest, while Figure 1.2 illustrates the marine-side geographical domain.
Figure 1.1: Aerial View of the Entrance Channel

2015 Baseline Air Emissions Inventory
Port Everglades 9 December 2016
Figure 1.2 shows the marine-side geographical domain which includes the Port jurisdiction in green, the main turning basin, the entrance channel, the coastal zone which extends 3 nm from the shore, and the anchorage area in dark blue.
Figure 1.2: Marine-Side Geographical Domain

2015 Baseline Air Emissions Inventory
Port Everglades 10 December 2016
1.4.2 Land-side Geographical Domain The geographical domain for the landside source categories is within the boundary (yellow lines) of the Port jurisdiction and its associated terminals, as indicated in Figure 1.35.
Figure 1.3: Aerial View of Port Everglades Boundary
5 Created from Google Earth.
2015 Baseline Air Emissions Inventory
Port Everglades 11 December 2016
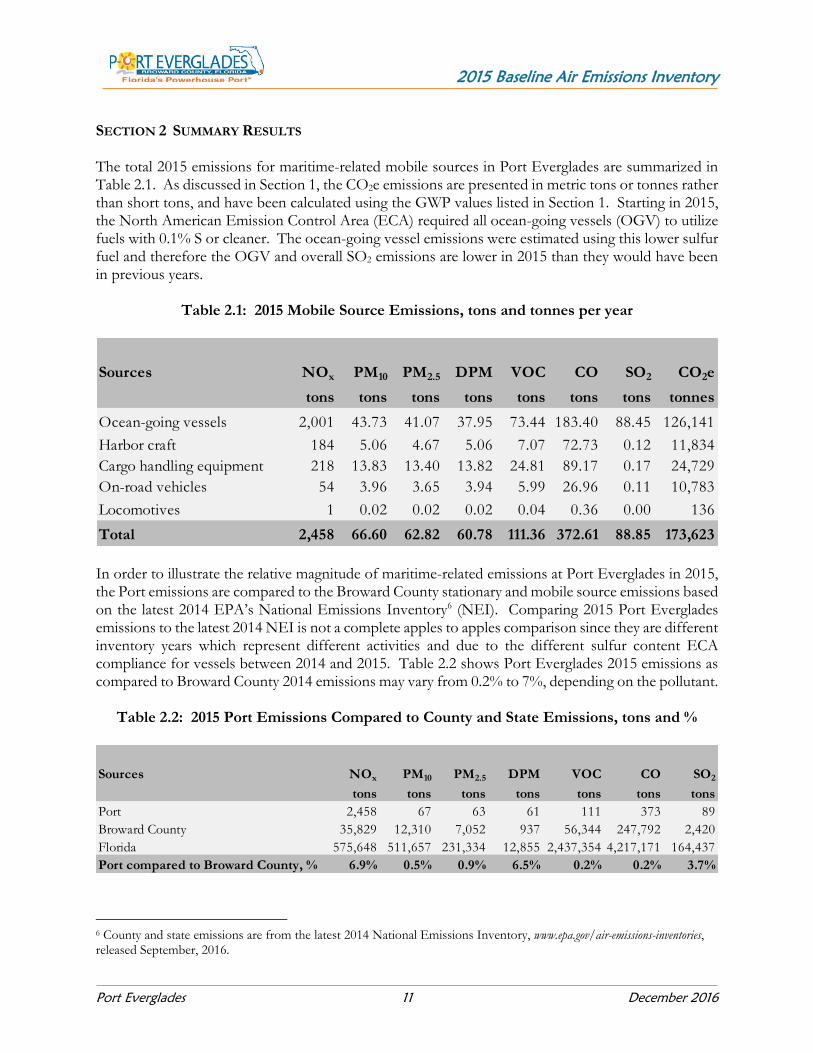
SECTION 2 SUMMARY RESULTS The total 2015 emissions for maritime-related mobile sources in Port Everglades are summarized in Table 2.1. As discussed in Section 1, the CO2e emissions are presented in metric tons or tonnes rather than short tons, and have been calculated using the GWP values listed in Section 1. Starting in 2015, the North American Emission Control Area (ECA) required all ocean-going vessels (OGV) to utilize fuels with 0.1% S or cleaner. The ocean-going vessel emissions were estimated using this lower sulfur fuel and therefore the OGV and overall SO2 emissions are lower in 2015 than they would have been in previous years.
Table 2.1: 2015 Mobile Source Emissions, tons and tonnes per year
In order to illustrate the relative magnitude of maritime-related emissions at Port Everglades in 2015, the Port emissions are compared to the Broward County stationary and mobile source emissions based on the latest 2014 EPA’s National Emissions Inventory6 (NEI). Comparing 2015 Port Everglades emissions to the latest 2014 NEI is not a complete apples to apples comparison since they are different inventory years which represent different activities and due to the different sulfur content ECA compliance for vessels between 2014 and 2015. Table 2.2 shows Port Everglades 2015 emissions as compared to Broward County 2014 emissions may vary from 0.2% to 7%, depending on the pollutant.
Table 2.2: 2015 Port Emissions Compared to County and State Emissions, tons and %
6 County and state emissions are from the latest 2014 National Emissions Inventory, www.epa.gov/air-emissions-inventories, released September, 2016.
Sources NOx PM10 PM2.5 DPM VOC CO SO2 CO2e
tons tons tons tons tons tons tons tonnes
Ocean-going vessels 2,001 43.73 41.07 37.95 73.44 183.40 88.45 126,141
Harbor craft 184 5.06 4.67 5.06 7.07 72.73 0.12 11,834
Cargo handling equipment 218 13.83 13.40 13.82 24.81 89.17 0.17 24,729
On-road vehicles 54 3.96 3.65 3.94 5.99 26.96 0.11 10,783
Locomotives 1 0.02 0.02 0.02 0.04 0.36 0.00 136
Total 2,458 66.60 62.82 60.78 111.36 372.61 88.85 173,623
Sources NOx PM10 PM2.5 DPM VOC CO SO2
tons tons tons tons tons tons tons
Port 2,458 67 63 61 111 373 89
Broward County 35,829 12,310 7,052 937 56,344 247,792 2,420
Florida 575,648 511,657 231,334 12,855 2,437,354 4,217,171 164,437
Port compared to Broward County, % 6.9% 0.5% 0.9% 6.5% 0.2% 0.2% 3.7%
2015 Baseline Air Emissions Inventory
Port Everglades 12 December 2016
81%
9%
8%
2%
NOx
2,458 tons
65%
21%
8%
6%
PM2.5
63 tons62%
23%
8%
7%
DPM
61 tons
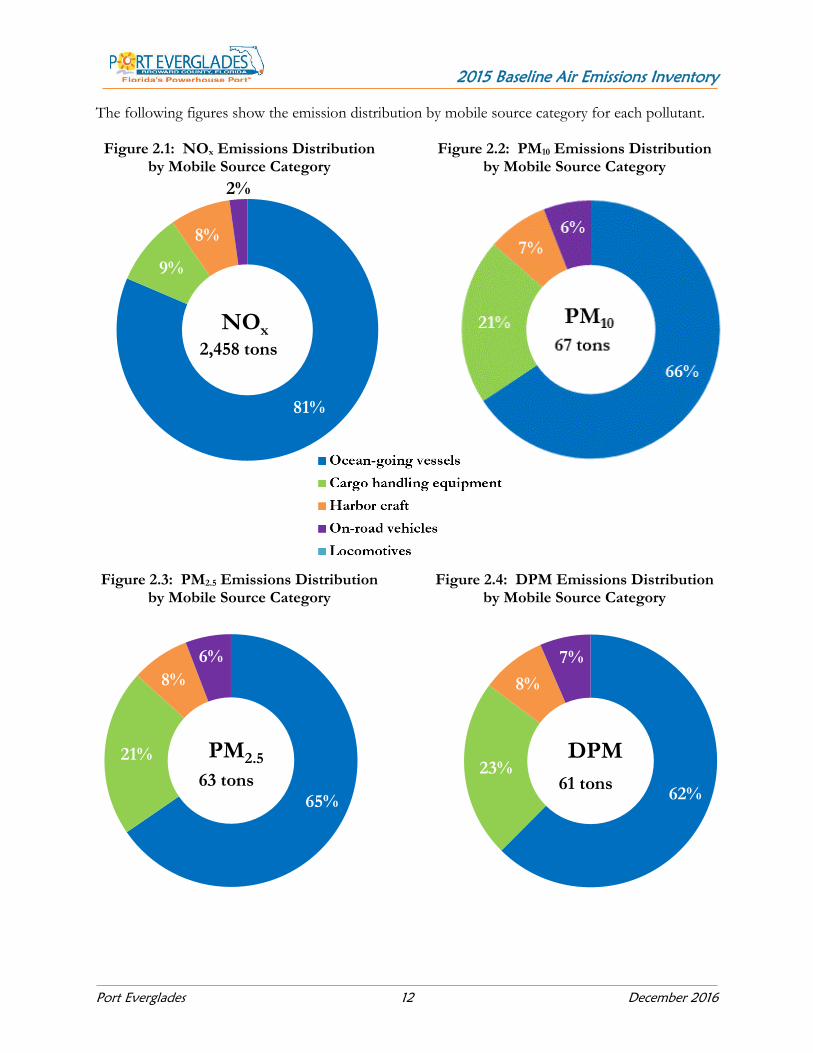
The following figures show the emission distribution by mobile source category for each pollutant.
Figure 2.1: NOx Emissions Distribution by Mobile Source Category
Figure 2.3: PM2.5 Emissions Distribution by Mobile Source Category
Figure 2.2: PM10 Emissions Distribution by Mobile Source Category
Figure 2.4: DPM Emissions Distribution by Mobile Source Category

2015 Baseline Air Emissions Inventory
Port Everglades 13 December 2016
66%
22%
6%
6%
VOC
111 tons
49%
24%
20%
7%
CO
373 tons
99.6%
<1%
SO2
89 tons
73%
14%
7%
6%
CO2
173,623 tons
Figure 2.5: VOC Emissions Distribution by Mobile Source Category
Figure 2.7: SO2 Emissions Distribution by Mobile Source Category
Figure 2.6: CO Emissions Distribution by Mobile Source Category
Figure 2.8: CO2e Emissions Distribution by Mobile Source Category

2015 Baseline Air Emissions Inventory
Port Everglades 14 December 2016
The following figures illustrate the Port Everglades 2015 emissions as compared to Broward County 2014 emissions.
Figure 2.9: NOx Comparison
Figure 2.10: PM10 Comparison
Figure 2.11: PM2.5 Comparison
Figure 2.12: DPM Comparison
7%
93%
NOx
Port Everglades Broward County
<1%
99%
PM10
Port Everglades Broward County
<1%
99%
PM2.5
Port Everglades Broward County
6%
94%
DPM
Port Everglades Broward County

2015 Baseline Air Emissions Inventory
Port Everglades 15 December 2016
0%
100%
CO
Port Everglades Broward County
Figure 2.13: VOC Comparison
Figure 2.14: CO Comparison
Figure 2.15: SO2 Comparison
0%
100%
VOC
Port Everglades Broward County
4%
96%
SO2
Port Everglades Broward County
2015 Baseline Air Emissions Inventory
Port Everglades 16 December 2016
For this study, the electrical power consumption from public and private facilities was collected to calculate greenhouse gas emissions for this source. The electrical power consumption is a measure of the electricity generated for buildings and facilities that is used to light the buildings, provide outdoor lighting, and to power air conditioners and computers. Port Everglades and facilities included in this study provided the actual electric power usage for the inventory year from electric bill data. The resulting GHG emission estimate with the electric energy consumed in 2015 are listed in Table 2.3.
Table 2.3: 2015 Energy Consumption and GHG Emission Estimate
Energy Consumption CO2e
kW-hr tonnes
Total 38,425,754 14,397

2015 Baseline Air Emissions Inventory
Port Everglades 17 December 2016
SECTION 3 OCEAN-GOING VESSELS This section presents emission estimates for the ocean-going vessel (OGV) source category organized into the following subsections: source description (3.1), geographical domain (3.2), data and information acquisition (3.3), operational profiles (3.4), emissions estimation methodology (3.5), and OGV emission estimates (3.6). 3.1 Source Description Vessels that called the Port are grouped by the type of cargo they are designed to carry. The following vessel types called the Port in 2015:
Auto carrier – vessels that transport vehicles.
Bulk carrier – vessels with open holds to carry various bulk dry goods, such as grain, salt, sugar, petroleum coke, and other fine grained commodities.
Containership – vessels that primarily carry goods in 20 and 40-foot containers in their holds and on their decks. Containerships are categorized into subtypes based on their carrying capacity.
Cruise ships – vessels that carry passengers for pleasure voyages.
General cargo – vessels that are designed to carry a diverse range of cargo in their hold and on their decks, such as bulk metals, machinery, yachts, and palletized goods.
Miscellaneous vessel – includes various vessels that cannot be categorized under any of the other vessel type categories.
Roll-on roll-off vessel – commonly known as RoRos, these vessels can accommodate vehicles and large wheeled equipment.
Tanker –vessels that transport liquids in bulk, such as oil, chemicals, or other specialty goods such as molasses or asphalt. Tankers are classified based on their size.
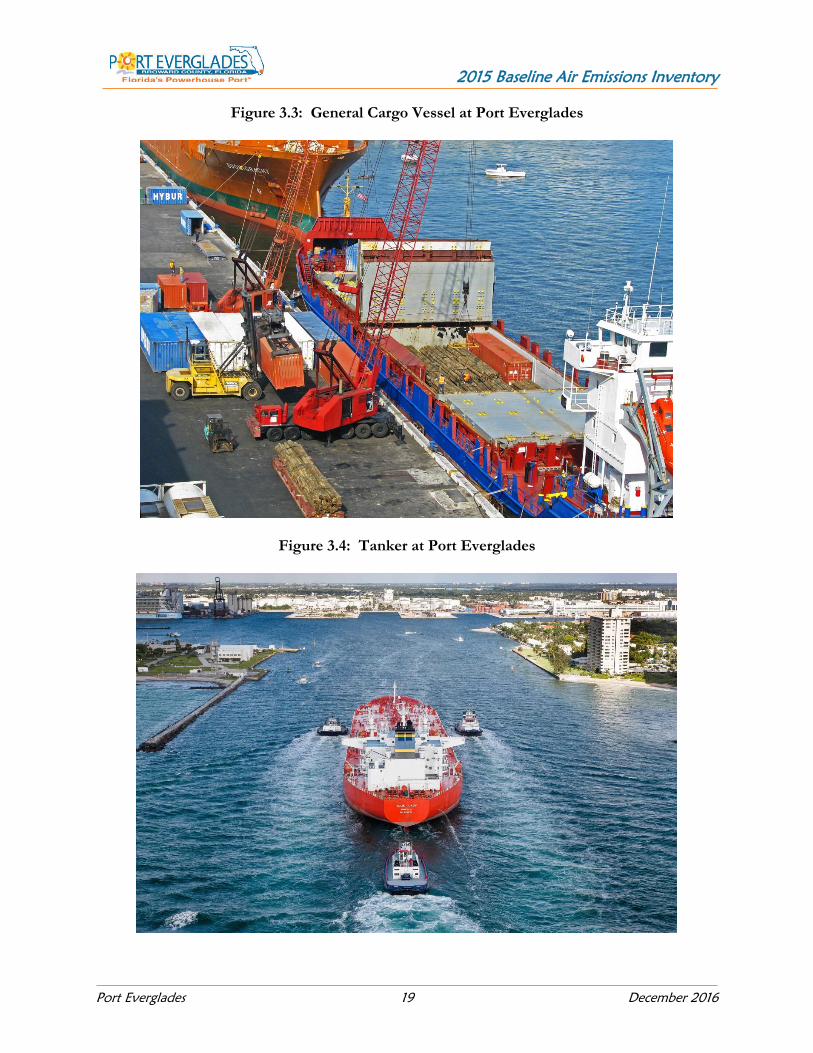
The emissions associated with barges and articulated tug barges (ATBs) are addressed in Section 4, Harbor Craft. Figures 3.1 through 3.4 show various types of ocean-going vessels that call at Port Everglades, including containerships, cruise vessels, general cargo and tankers. The images shown are for illustrative purposes only.

2015 Baseline Air Emissions Inventory
Port Everglades 18 December 2016
Figure 3.1: Container Ship at Port Everglades
Figure 3.2: Cruise Vessels at Port Everglades
2015 Baseline Air Emissions Inventory
Port Everglades 19 December 2016
Figure 3.3: General Cargo Vessel at Port Everglades
Figure 3.4: Tanker at Port Everglades
2015 Baseline Air Emissions Inventory
Port Everglades 20 December 2016
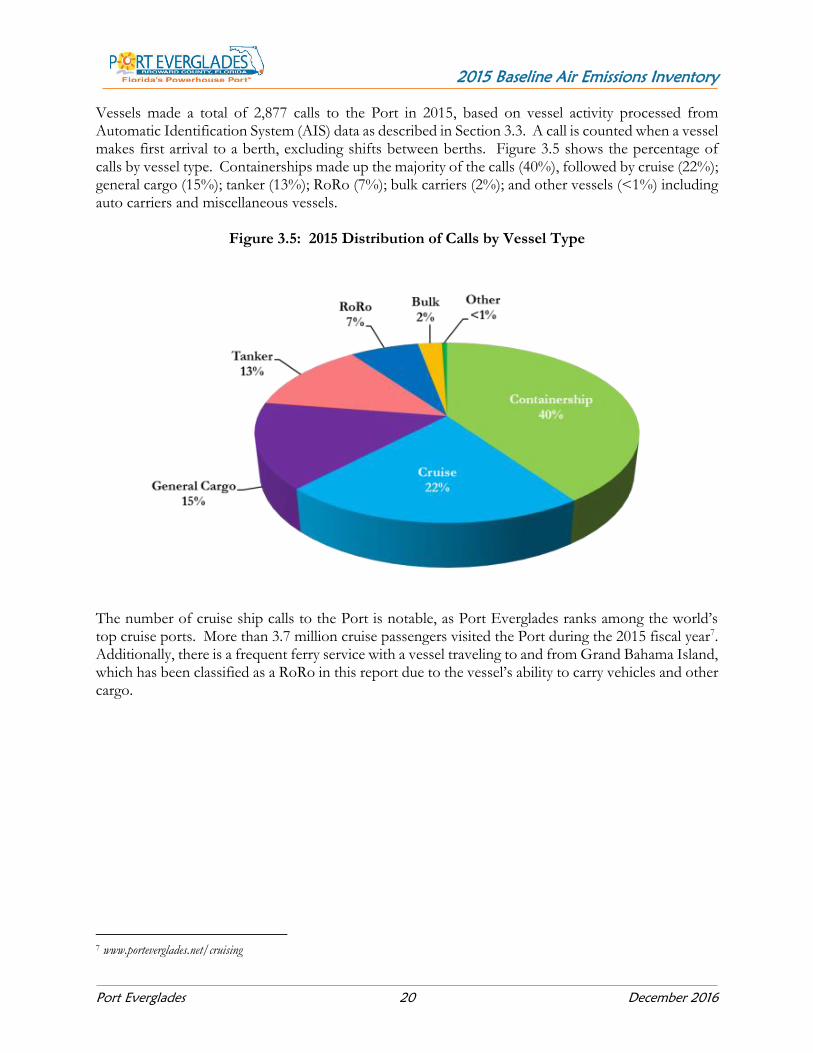
Vessels made a total of 2,877 calls to the Port in 2015, based on vessel activity processed from Automatic Identification System (AIS) data as described in Section 3.3. A call is counted when a vessel makes first arrival to a berth, excluding shifts between berths. Figure 3.5 shows the percentage of calls by vessel type. Containerships made up the majority of the calls (40%), followed by cruise (22%); general cargo (15%); tanker (13%); RoRo (7%); bulk carriers (2%); and other vessels (<1%) including auto carriers and miscellaneous vessels.
Figure 3.5: 2015 Distribution of Calls by Vessel Type
The number of cruise ship calls to the Port is notable, as Port Everglades ranks among the world’s top cruise ports. More than 3.7 million cruise passengers visited the Port during the 2015 fiscal year7. Additionally, there is a frequent ferry service with a vessel traveling to and from Grand Bahama Island, which has been classified as a RoRo in this report due to the vessel’s ability to carry vehicles and other cargo.
7 www.porteverglades.net/cruising

2015 Baseline Air Emissions Inventory
Port Everglades 21 December 2016
3.2 Geographical Domain The geographical domain includes the berths and waterways within the Port jurisdiction boundary and extends three nautical miles beyond the Broward County shoreline. The three nautical mile line defines the edge of the water boundary. The following operational modes define the characteristics of a vessel’s operation within the emissions inventory geographical domain:
1. Maneuvering Vessel movements inside the geographical domain, including the coastal zone. Additional power is typically brought online since the vessel is preparing to travel in, or is traveling in, restricted waters.
2. At-Berth When a vessel is stationary at the dock/berth. 3. At-Anchorage When a vessel is stationary within the anchorage area. The anchorage area is
located in the coastal zone. Due to the unique short entrance, the Port’s operational modes are slightly different than other ports which include a long transit. As an example for comparison, the entrance channel to Port Everglades is less than 1 nm, while some vessels at the Port of Houston Authority transit approximately 58 nm from the sea buoy to reach some berths. For Port Everglades’ geographical boundary, there is no transit or “at-sea” mode, only a maneuvering mode. The maneuvering mode is comprised of the coastal zone, the main turning basin and the area inside the shoreline along the Atlantic Intracoastal Waterway. Most vessels travel from the coastal zone through the entrance channel and enter the main turning basin when traveling to or from a berth. Ships operating in the coastal zone are considered to be traveling in restricted waters as there is a precautionary area near the entrance channel, an anchorage area, and a pilot boarding area near the edge of the zone.
2015 Baseline Air Emissions Inventory
Port Everglades 22 December 2016
Figure 3.6 illustrates the outer limit of the geographic domain for OGVs with the location of the anchorage area, coastal zone, the entrance channel, and the main turning basin.
Figure 3.6: Marine-Side Geographical Domain
2015 Baseline Air Emissions Inventory
Port Everglades 23 December 2016
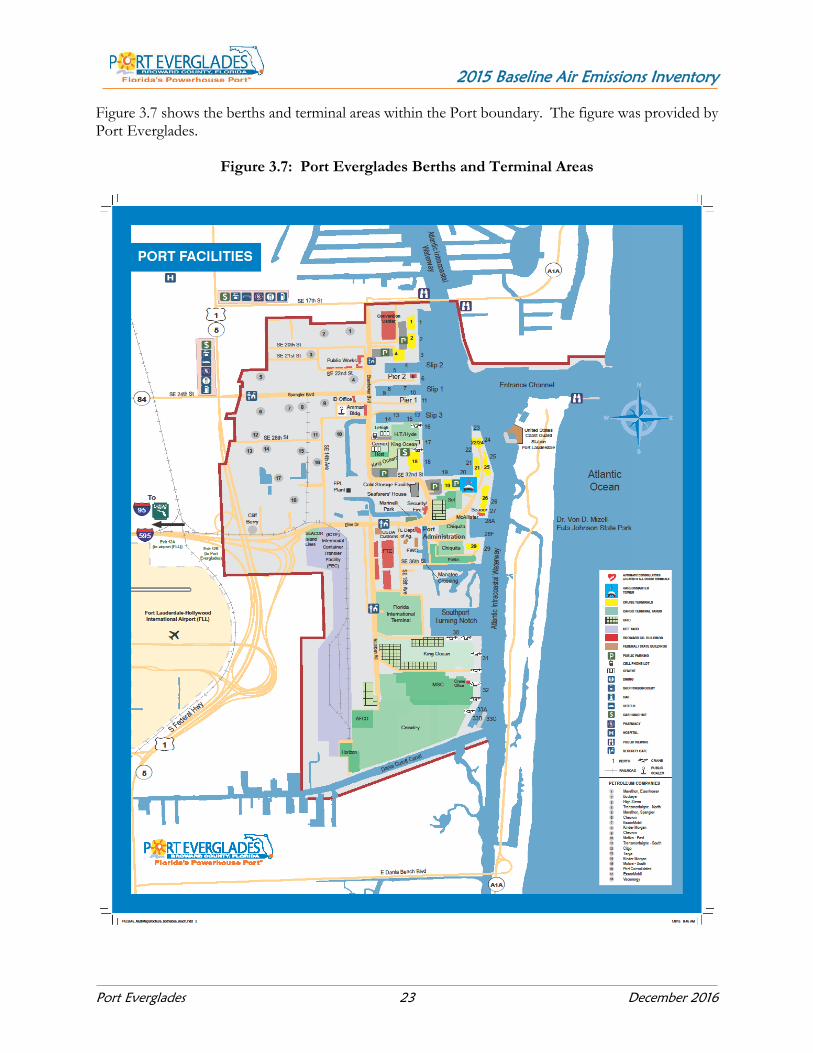
Figure 3.7 shows the berths and terminal areas within the Port boundary. The figure was provided by Port Everglades.
Figure 3.7: Port Everglades Berths and Terminal Areas
2015 Baseline Air Emissions Inventory
Port Everglades 24 December 2016
3.3 Data and Information Acquisition The OGV emission estimates presented in this report are based on vessel activity data, vessel operational data, and vessel parameter data. Activity data sources include AIS data and wharfinger vessel call data. The AIS data was used for identifying vessel movements within the geographical domain and processed to determine discrete vessel activity parameters including actual speed over water. This data was collected by the U.S, Coast Guard (USCG) AIS receiver network, and compiled into files comprised of unique AIS records for individual vessels. The Port also provided wharfinger data detailing vessel calls to berths, which was used as a secondary data source to verify the vessel activity that was processed from the AIS data. AIS data points contain vessel specific geographical and temporal information including, but not limited to: IMO number, MMSI number, geographic coordinates, speed over water, heading, date, and time. Vessel operational data includes Starcrest Vessel Boarding Program (VBP) data collected from ships at various ports to determine auxiliary engine and boiler loads, by the various operational modes. The discrete vessel operational data collected during VBP is confidential, but the averages used for defaults are listed in sections 3.5.8 and 3.5.9 of this report. Additional discussions with Port Everglades Pilots (the Pilots) provided insight into vessel maneuvering operations from the pilot boarding location to when the pilot disembarks the vessel. The vessel specific parameter data is obtained through the IHS Fairplay (Lloyd’s) register of ships and includes: vessel type, engine type, propulsion engine horsepower, keel laid date, vessel max rated speed, and other parameters needed to estimate ship emissions. VBP program data also provided vessel specific International Maritime Organization’s (IMO) Engine International Air Pollution Prevention Certificate (EIAPP) for propulsion and auxiliary engines. For ships with a valid propulsion engine EIAPP, the engine’s actual NOx emissions value (g/kW-hr) is used in place of the default NOx emission factor, which is the same as the applicable engine’s IMO Tier NOx requirement. The raw AIS data was processed into vessel call activity through a combination of database processing and Geographic Information System (GIS) spatial analysis. The initial processing step is to evaluate the raw AIS data and remove any duplicate records or data anomalies, such as erroneous speeds and geographical coordinates. The next processing step is to spatially analyze the AIS data using GIS to determine where the AIS records are located within the study area. After the AIS data has been spatially analyzed, the next step is to process the AIS data using a database to generate vessel activities from concurrent AIS records. Vessel activity records generated from AIS data processing contain vessel specific speed profiles and the amount of time spent operating in the coastal and maneuvering zones, as well as hotelling time at a berth or anchorage. Only the vessel activities that were determined to have called at the Port based on the spatial analysis of the AIS data were compiled and used for this emissions inventory. Additionally, vessel calls listed in the wharfinger data were linked to the AIS data vessel calls to confirm the inclusion of all vessel activity. If the AIS activity did not contain a trip listed in the wharfinger data due to a temporal AIS data gap resulting in an incomplete AIS activity, the wharfinger data was manually added to the AIS activity to complete a trip. The AIS data contained relatively few data gaps, so less than 1% of the total vessel calls were gap-filled using the wharfinger data.

2015 Baseline Air Emissions Inventory
Port Everglades 25 December 2016
Figure 3.8 shows a spatial representation of the AIS data collected, processed, and analyzed for this inventory within the geographical domain.
Figure 3.8: Processed AIS Dataset

2015 Baseline Air Emissions Inventory
Port Everglades 26 December 2016
Figure 3.9 presents the vessel tracks of the individual vessel activities generated from the AIS dataset that called the Port within the geographical domain. The varying shades of white lines represent the variation in density of the vessel tracks.
Figure 3.9: Processed AIS Vessel Tracks

2015 Baseline Air Emissions Inventory
Port Everglades 27 December 2016
3.4 Operational Profiles Vessel movements derived from AIS data were assigned one of the following trip types:
Arrival – inbound trip from the coastal zone boundary to berth
Departure – outbound trip from a berth or anchorage area to the inventory boundary
Shift – intra-port trips between berths and/or the anchorage area that is within the inventory boundary
For this study, an inbound trip from the inventory boundary to the anchorage area was included in the emission estimates if the next movement after the anchorage was a berth at the Port. Containerships are classified into subtypes using a standardized unit to describe their carrying capacity, which is called a twenty-foot equivalent unit (TEU) and is based on the size of a 20-foot shipping container. In this inventory, a containership classified as Container-1000 vessel can accommodate up to 1,999 TEUs. Table 3.1 presents the number of arrivals, departures, and shifts associated with vessels that called at the Port in 2015.
Table 3.1: 2015 Arrivals, Departures, and Shifts by Vessel Type
Vessel Type Arrivals Departures Shifts Total
Auto carrier 5 5 2 12
Bulk 60 61 42 163
Bulk - heavy load 9 9 1 19
Container - 1000 784 785 160 1,729
Container - 2000 88 88 9 185
Container - 3000 85 85 1 171
Container - 4000 109 109 1 219
Container - 5000 49 49 0 98
Container - 6000 45 45 1 91
Container - 9000 1 1 0 2
Cruise 625 625 3 1,253
General cargo 443 444 128 1,015
Miscellaneous 10 10 1 21
RoRo 199 199 20 418
Tanker - handysize 56 56 25 137
Tanker - panamax 41 43 23 107
Tanker - suezmax 1 1 0 2
Tanker - chemical 267 266 96 629
Total 2,877 2,881 513 6,271
2015 Baseline Air Emissions Inventory
Port Everglades 28 December 2016
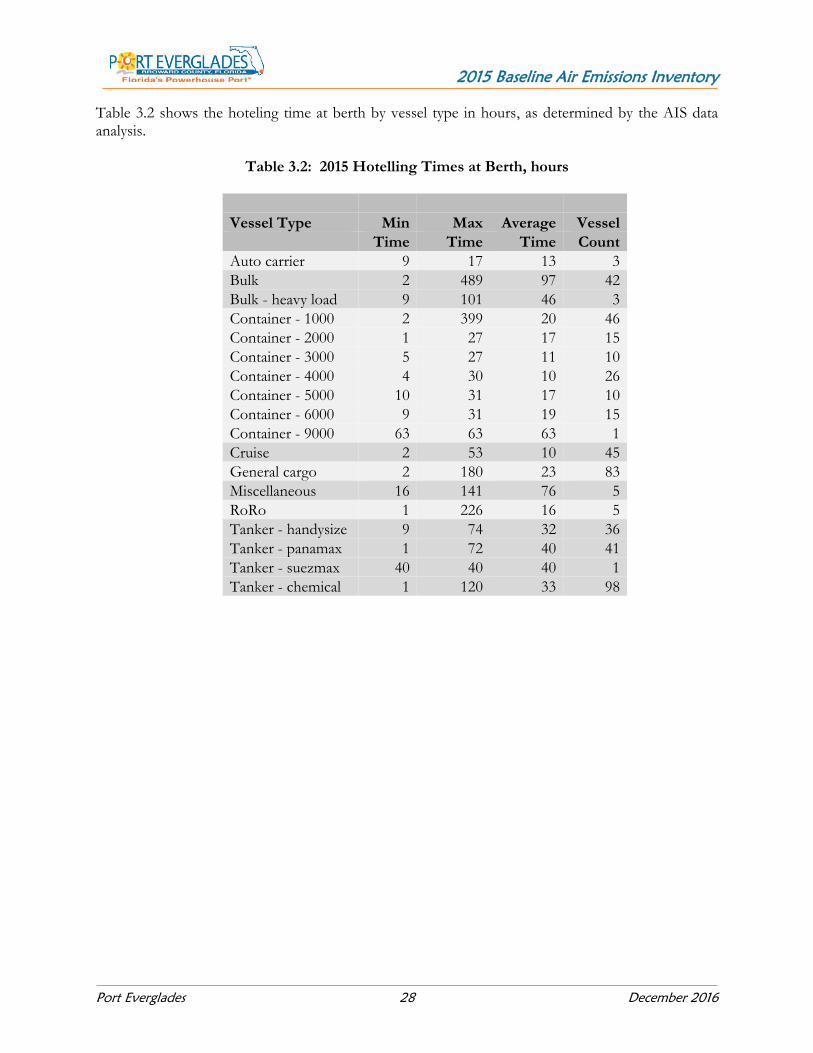
Table 3.2 shows the hoteling time at berth by vessel type in hours, as determined by the AIS data analysis.
Table 3.2: 2015 Hotelling Times at Berth, hours
Vessel Type Min Max Average Vessel
Time Time Time Count
Auto carrier 9 17 13 3
Bulk 2 489 97 42
Bulk - heavy load 9 101 46 3
Container - 1000 2 399 20 46
Container - 2000 1 27 17 15
Container - 3000 5 27 11 10
Container - 4000 4 30 10 26
Container - 5000 10 31 17 10
Container - 6000 9 31 19 15
Container - 9000 63 63 63 1
Cruise 2 53 10 45
General cargo 2 180 23 83
Miscellaneous 16 141 76 5
RoRo 1 226 16 5
Tanker - handysize 9 74 32 36
Tanker - panamax 1 72 40 41
Tanker - suezmax 40 40 40 1
Tanker - chemical 1 120 33 98

2015 Baseline Air Emissions Inventory
Port Everglades 29 December 2016
Table 3.3 shows the hoteling time at anchorage by vessel type in hours, as determined by the AIS data analysis.
Table 3.3: 2015 Hotelling Times at Anchorage, hours
Vessel Type Min Max Average Vessel
Time Time Time Count
Auto carrier 9 10 10 2
Bulk 6 235 44 17
Bulk - heavy load 10 10 10 1
Container - 1000 2 211 48 19
Container - 2000 10 31 18 4
Container - 3000 38 38 38 1
Container - 4000 14 14 14 1
Container - 5000 na na na na
Container - 6000 na na na na
Container - 9000 na na na na
Cruise na na na na
General cargo 2 402 37 27
Miscellaneous na na na na
RoRo 15 212 51 1
Tanker - handysize 9 74 32 36
Tanker - panamax 4 78 24 19
Tanker - suezmax na na na na
Tanker - chemical 1 500 34 49
3.5 Emission Estimation Methodology Vessel activity data and the methods of estimating emissions are discussed below for propulsion engines, auxiliary engines and boilers. Differences in methods of estimation between the various modes of operation, at-berth and maneuvering for this study, are discussed where applicable. Emission estimates were made assuming all vessels calling the Port were compliant with the IMO North American Emissions Control Area (ECA) requirement to use marine gas oil (MGO) with 0.1% sulfur (S) content fuel.

2015 Baseline Air Emissions Inventory
Port Everglades 30 December 2016
In general, emissions are estimated as a function of vessel power demand with energy expressed in kW-hr multiplied by an emission factor, where the emission factor is expressed in terms of grams per kilowatt-hour (g/kW-hr). Emission factors and emission factor adjustments for different fuel usage (see section 3.5.4) and for low propulsion engine load (see section 3.5.5), are then applied to the various activity data. Equations 3.1 and 3.2 report the basic equations used in estimating emissions by mode.
Equation 3.1
𝑬𝒊 = 𝑬𝒏𝒆𝒓𝒈𝒚𝒊 × 𝑬𝑭 × 𝑭𝑪𝑭
Where: Ei = Emissions by mode Energyi = Energy demand by mode, calculated using Equation 3.2 below as the energy output of the engine(s) or boiler(s) over the period of time, kW-hr EF = emission factor, expressed in terms of g/kW-hr FCF = fuel correction factor, dimensionless
The ‘Energy’ term of the equation is where most of the location-specific information is used. Energy by mode is calculated using Equation 3.2:
Equation 3.2
𝑬𝒏𝒆𝒓𝒈𝒚𝒊 = 𝑳𝒐𝒂𝒅 × 𝑨𝒄𝒕𝒊𝒗𝒊𝒕𝒚
Where: Energyi = Energy demand by mode, kW-hr Load = maximum continuous rated (MCR) times load factor (LF) for propulsion engine power (kW); reported operational load of the auxiliary engine(s), by mode (kW); or operational load of the auxiliary boiler, by mode (kW) Activity = activity, hours
The emissions estimation methodology for propulsion engines can be found in subsections 3.5.1 to 3.5.6, for auxiliary engines can be found in subsections 3.5.7 and 3.5.8, and for auxiliary boilers can be found in subsection 3.5.9. Propulsion engines are also referred to as main engines. Incinerators are not included in the emissions estimates because incinerators are not used within the study area. Information collected from interviews with the vessel operators and marine industry personnel indicate that vessels do not use their incinerators while at-berth or near coastal waters. 3.5.1 Propulsion Engine Maximum (MCR) Continuous Rated Power MCR is used to determine load by mode for propulsion engines. For this study, it is assumed that the Lloyd’s ‘Power’ value is the best surrogate for MCR power and is reported in kilowatts. For diesel-electric configured ships, MCR is the combined rated electric propulsion motor(s) rating, in kW.

2015 Baseline Air Emissions Inventory
Port Everglades 31 December 2016
3.5.2 Propulsion Engine Load Factor Load factor for propulsion engines is estimated using the ratio of actual speed compared to the ship’s maximum rated speed. Propulsion engine load factor is estimated using the Propeller Law, which shows that propulsion engine load, varies with the cube of vessel speed. Therefore, propulsion engine load at a given speed is estimated by taking the cube of that speed divided by the vessel's maximum speed, as illustrated by the following equation.
Equation 3.3
𝑳𝑭 = (𝑺𝒑𝒆𝒆𝒅𝑨𝒄𝒕𝒖𝒂𝒍 / 𝑺𝒑𝒆𝒆𝒅𝑴𝒂𝒙𝒊𝒎𝒖𝒎)𝟑
Where:
LF = load factor, dimensionless SpeedActual = actual speed, knots SpeedMaximum = maximum speed, knots
For the purpose of estimating emissions, the load factor has been capped to 1.0 so that there are no calculated propulsion engine load factors greater than 100% (i.e., calculated load factors above 1.0 are assigned a load factor of 1.0). 3.5.3 Propulsion Engine Activity Activity is measured in hours of operation within the geographical boundary. At-berth times are determined from the date and time stamps in the AIS data when a vessel is determined to be at a terminal. The maneuvering time within the geographical boundary is estimated using equation 3.4, which divides the segment distance traveled by ship at its over water speed.
Equation 3.4
𝑨𝒄𝒕𝒊𝒗𝒊𝒕𝒚 = 𝑫/𝑺𝒑𝒆𝒆𝒅𝑨𝒄𝒕𝒖𝒂𝒍
Where: Activity = activity, hours D = distance, nautical miles SpeedActual = actual ship speed, knots
Distance and actual speeds are derived from AIS data point geographical coordinate locations and the associated over the water speed between points.

2015 Baseline Air Emissions Inventory
Port Everglades 32 December 2016
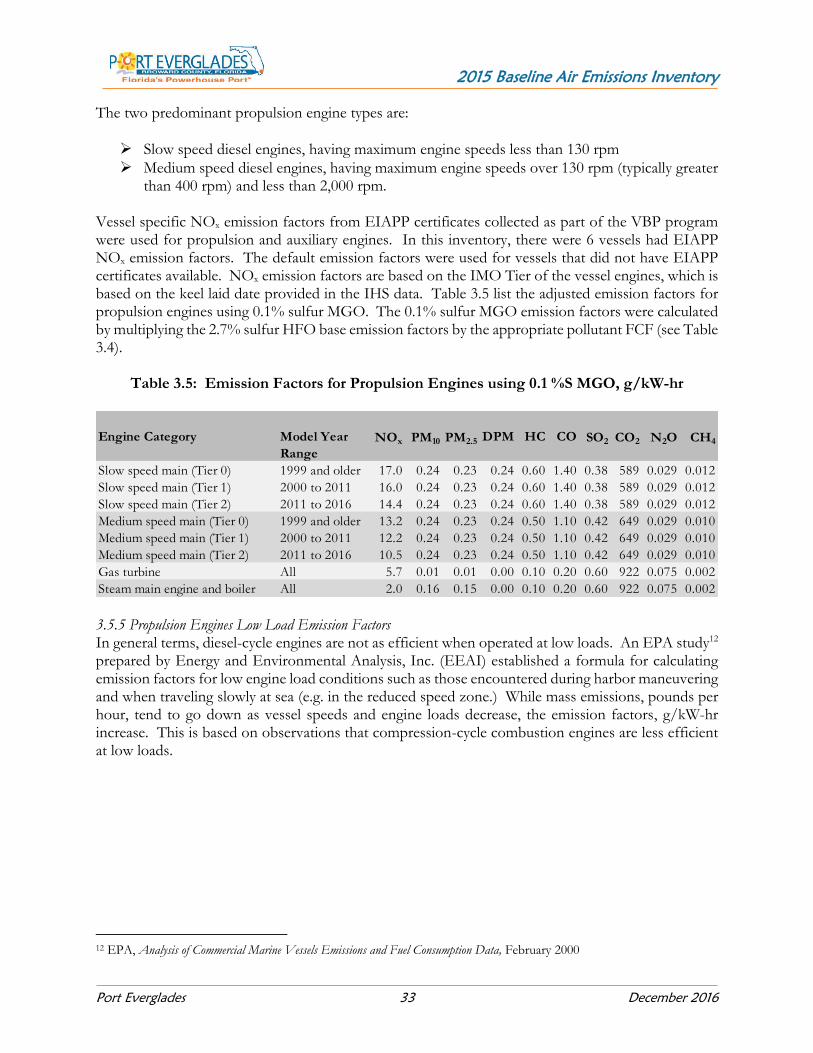
3.5.4 Propulsion Engine Emission Factors The main engine emission factors used in this study were reported in the ENTEC 2002 study,8 except for PM, CO and greenhouse gas emission factors. An IVL Swedish Environmental Research Institute 2004 study9 was the source for the PM emission factors for gas turbine and steamship vessels, as well as the CO and greenhouse gas emission factors for CO2, and N2O. Per IVL 2004 study data, CH4 were assumed to be 0.2% of HC emission factors. The main and auxiliary engine particulate matter (PM10) and SOx emission factors are based on the following equations10 for HFO fuel with 2.7% sulfur content:
Equation 3.5
𝑷𝑴𝟏𝟎 𝑬𝑭 (𝒈/𝒌𝑾 − 𝒉𝒓)𝒇𝒐𝒓 𝑯𝑭𝑶 = 𝟏. 𝟑𝟓 + 𝑩𝑺𝑭𝑪 𝒙 𝟕 𝒙 𝟎. 𝟎𝟐𝟐𝟒𝟕 𝒙 (𝑭𝒖𝒆𝒍 𝑺𝒖𝒍𝒇𝒖𝒓 𝑭𝒓𝒂𝒄𝒕𝒊𝒐𝒏 – 𝟎. 𝟎𝟐𝟒𝟔)
Where:
BSFC = brake specific fuel consumption in g/kW-hr Equation 3.6
𝑺𝑶𝟐 𝑬𝑭 (𝒈/𝒌𝑾 − 𝒉𝒓) = 𝑩𝑺𝑭𝑪 𝒙 𝟐 𝒙 𝟎. 𝟗𝟕𝟕𝟓𝟑 𝒙 (𝑭𝒖𝒆𝒍 𝑺𝒖𝒍𝒇𝒖𝒓 𝑭𝒓𝒂𝒄𝒕𝒊𝒐𝒏) Where:
0.97753 is the fraction of fuel sulfur converted to SO2 and 2 is the ratio of molecular weights of SO2 and S.
The base emission factors are based on residual fuel oil/ heavy fuel oil (HFO) with average sulfur content of 2.7%. Starting in 2015, the North American Emission Control Area (ECA) requires all ships to utilize fuels with 0.1% S or cleaner. The emission factors were corrected using fuel correction factors (FCFs) from the baseline HFO 2.7% S to MGO 0.1% S. Table 3.4 lists the FCFs used11.
Table 3.4: OGV Fuel Correction Factors
Actual Fuel Sulfur Used Content NOx PM10 PM2.5 DPM VOC CO SOx CO2 N2O CH4
Content by weight % MGO 0.1% 0.94 0.17 0.20 0.17 1.00 1.00 0.04 0.95 0.94 1.00
8 ENTEC, Quantification of Emissions from Ships Associated with Ship Movements between Ports in the European Community, Final Report, July 2002 9 IVL, Methodology for Calculating Emissions from Ships: Update on Emission Factors, 2004. (IVL 2004) 10 Current Methodologies in Preparing Mobile Source Port-Related Emission Inventories, Final Report, April 2009 11 ARB, www.arb.ca.gov/regact/2011/ogv11/ogv11appd.pdf
2015 Baseline Air Emissions Inventory
Port Everglades 33 December 2016
The two predominant propulsion engine types are:
Slow speed diesel engines, having maximum engine speeds less than 130 rpm
Medium speed diesel engines, having maximum engine speeds over 130 rpm (typically greater than 400 rpm) and less than 2,000 rpm.
Vessel specific NOx emission factors from EIAPP certificates collected as part of the VBP program were used for propulsion and auxiliary engines. In this inventory, there were 6 vessels had EIAPP NOx emission factors. The default emission factors were used for vessels that did not have EIAPP certificates available. NOx emission factors are based on the IMO Tier of the vessel engines, which is based on the keel laid date provided in the IHS data. Table 3.5 list the adjusted emission factors for propulsion engines using 0.1% sulfur MGO. The 0.1% sulfur MGO emission factors were calculated by multiplying the 2.7% sulfur HFO base emission factors by the appropriate pollutant FCF (see Table 3.4).
Table 3.5: Emission Factors for Propulsion Engines using 0.1 %S MGO, g/kW-hr
3.5.5 Propulsion Engines Low Load Emission Factors In general terms, diesel-cycle engines are not as efficient when operated at low loads. An EPA study12 prepared by Energy and Environmental Analysis, Inc. (EEAI) established a formula for calculating emission factors for low engine load conditions such as those encountered during harbor maneuvering and when traveling slowly at sea (e.g. in the reduced speed zone.) While mass emissions, pounds per hour, tend to go down as vessel speeds and engine loads decrease, the emission factors, g/kW-hr increase. This is based on observations that compression-cycle combustion engines are less efficient at low loads.
12 EPA, Analysis of Commercial Marine Vessels Emissions and Fuel Consumption Data, February 2000
Engine Category Model Year NOx PM10 PM2.5 DPM HC CO SO2 CO2 N2O CH4
Range
Slow speed main (Tier 0) 1999 and older 17.0 0.24 0.23 0.24 0.60 1.40 0.38 589 0.029 0.012
Slow speed main (Tier 1) 2000 to 2011 16.0 0.24 0.23 0.24 0.60 1.40 0.38 589 0.029 0.012
Slow speed main (Tier 2) 2011 to 2016 14.4 0.24 0.23 0.24 0.60 1.40 0.38 589 0.029 0.012
Medium speed main (Tier 0) 1999 and older 13.2 0.24 0.23 0.24 0.50 1.10 0.42 649 0.029 0.010
Medium speed main (Tier 1) 2000 to 2011 12.2 0.24 0.23 0.24 0.50 1.10 0.42 649 0.029 0.010
Medium speed main (Tier 2) 2011 to 2016 10.5 0.24 0.23 0.24 0.50 1.10 0.42 649 0.029 0.010
Gas turbine All 5.7 0.01 0.01 0.00 0.10 0.20 0.60 922 0.075 0.002
Steam main engine and boiler All 2.0 0.16 0.15 0.00 0.10 0.20 0.60 922 0.075 0.002

2015 Baseline Air Emissions Inventory
Port Everglades 34 December 2016
The following equations describe the low-load effect where emission rates can increase, based on a limited set of data from Lloyd’s Maritime Program and the USCG. The low load effect was also described in a study conducted for the EPA by ENVIRON.13 Equation 3.7 is the equation developed by EEAI to generate emission factors for the range of load factors from 2% to <20% for each pollutant:
Equation 3.7
𝒚 = 𝒂 (𝒇𝒓𝒂𝒄𝒕𝒊𝒐𝒏𝒂𝒍 𝒍𝒐𝒂𝒅)−𝒙 + 𝒃 Where:
y = emission factor, g/kW-hr a = coefficient b = intercept x = exponent (negative) fractional load = propulsion engine load factor (2% - <20%), derived by the Propeller Law, percent (see equation 3.3)
Table 3.6 presents the variables for equation 3.7.
Table 3.6: Low-Load Emission Factor Regression Equation Variables
Pollutant
Exponent
Intercept (b)
Coefficient (a)
PM 1.5 0.2551 0.0059
NOx 1.5 10.4496 0.1255
CO 1.0 0.1548 0.8378
HC 1.5 0.3859 0.0667
13 EPA, Commercial Marine Inventory Development, July 2002

2015 Baseline Air Emissions Inventory
Port Everglades 35 December 2016
Table 3.7 lists the low-load adjustment multipliers used for diesel propulsion engines. Adjustments to N2O and CH4 emission factors are made based on the NOx and HC low load adjustments, respectively. The LLA adjustment is not applied at engine loads greater than 20%. For main engine loads below 20%, the LLA increases to reflect increased emissions on a g/kW-hr basis due to engine inefficiency. Low load emission factors do not apply to steamships or ships having gas turbines because the EPA study only observed an increase in emissions from diesel engines.
Table 3.7: Low Load Adjustment Multipliers for Emission Factors14
Load
PM
NOx
SO2
CO
VOC
CO2
N2O
CH4
2% 7.29 4.63 1.00 9.68 21.18 1.00 4.63 21.18 3% 4.33 2.92 1.00 6.46 11.68 1.00 2.92 11.68 4% 3.09 2.21 1.00 4.86 7.71 1.00 2.21 7.71 5% 2.44 1.83 1.00 3.89 5.61 1.00 1.83 5.61 6% 2.04 1.60 1.00 3.25 4.35 1.00 1.60 4.35 7% 1.79 1.45 1.00 2.79 3.52 1.00 1.45 3.52 8% 1.61 1.35 1.00 2.45 2.95 1.00 1.35 2.95 9% 1.48 1.27 1.00 2.18 2.52 1.00 1.27 2.52 10% 1.38 1.22 1.00 1.96 2.18 1.00 1.22 2.18 11% 1.30 1.17 1.00 1.79 1.96 1.00 1.17 1.96 12% 1.24 1.14 1.00 1.64 1.76 1.00 1.14 1.76 13% 1.19 1.11 1.00 1.52 1.60 1.00 1.11 1.60 14% 1.15 1.08 1.00 1.41 1.47 1.00 1.08 1.47 15% 1.11 1.06 1.00 1.32 1.36 1.00 1.06 1.36 16% 1.08 1.05 1.00 1.24 1.26 1.00 1.05 1.26 17% 1.06 1.03 1.00 1.17 1.18 1.00 1.03 1.18 18% 1.04 1.02 1.00 1.11 1.11 1.00 1.02 1.11 19% 1.02 1.01 1.00 1.05 1.05 1.00 1.01 1.05 20% 1.00 1.00 1.00 1.00 1.00 1.00 1.00 1.00
The LLA multipliers are applied to the at-sea emission factors for diesel propulsion engines only. The low load emission factor is calculated for each pollutant using Equation 3.8. In keeping with the emission estimating practice of assuming a minimum main engine load of 2%, the table of LLA factors does not include values for 1% load.
Equation 3.8
𝑬𝑭 = 𝑨𝒅𝒋𝒖𝒔𝒕𝒆𝒅 𝑬𝑭 × 𝑳𝑳𝑨 Where:
EF = calculated low load emission factor, expressed in terms of g/kW-hr Adjusted EF = fuel adjusted emission factor for diesel propulsion engines LLA = low load adjustment multiplier, dimensionless
14 The LLA multipliers for N2O and CH4 are based on NOx and HC, respectively.

2015 Baseline Air Emissions Inventory
Port Everglades 36 December 2016
3.5.6 Propulsion Engine Power Rating OGVs calling the Port were matched using the most current Lloyd’s data to determine propulsion engine power ratings. For vessels missing propulsion engine power rating, vessel class specific average value was used. 3.5.7 Auxiliary Engine Emission Factors The adjusted auxiliary engine emission factors using 0.1% S MGO, based on ENTEC 2002 and IVL 2004, are presented in Table 3.8. Vessel specific NOx emission factors from EIAPP certificates collected from VBP data were utilized. Vessel that did not have EIAPP NOx emission factors used the default NOx emission factors. Similar to the propulsion engine emission factors, the 2.7% sulfur HFO base emission factors are multiplied by the appropriate pollutant FCF (see Table 3.3) to calculate the 0.1% S MGO emission factors. PM10 and SOx emission factors are based on equations 3.5 and 3.6 described in earlier sections. In 2015, the auxiliary engines used 0.1% S fuel due to the ECA requirement.
Table 3.8: Emission Factors for Auxiliary Engines using 0.1% S MGO, g/kW-hr
Engine Category Model Year NOx PM10 PM2.5 DPM HC CO SO2 CO2 N2O CH4
Range
Medium speed auxiliary (Tier 0) 1999 and older 13.8 0.24 0.23 0.24 0.4 1.1 0.44 686 0.029 0.008
Medium speed auxiliary (Tier 1) 2000 to 2011 12.2 0.24 0.23 0.24 0.4 1.1 0.44 686 0.029 0.008
Medium speed auxiliary (Tier 2) 2011 to 2016 10.5 0.24 0.23 0.24 0.4 1.1 0.44 686 0.029 0.008
High speed auxiliary (Tier 0) 1999 and older 10.9 0.24 0.23 0.24 0.4 0.9 0.44 656 0.029 0.008
High speed auxiliary (Tier 1) 2000 to 2011 9.8 0.24 0.23 0.24 0.4 0.9 0.44 656 0.029 0.008
High speed auxiliary (Tier 2) 2011 to 2016 7.7 0.24 0.23 0.24 0.4 0.9 0.44 656 0.029 0.008
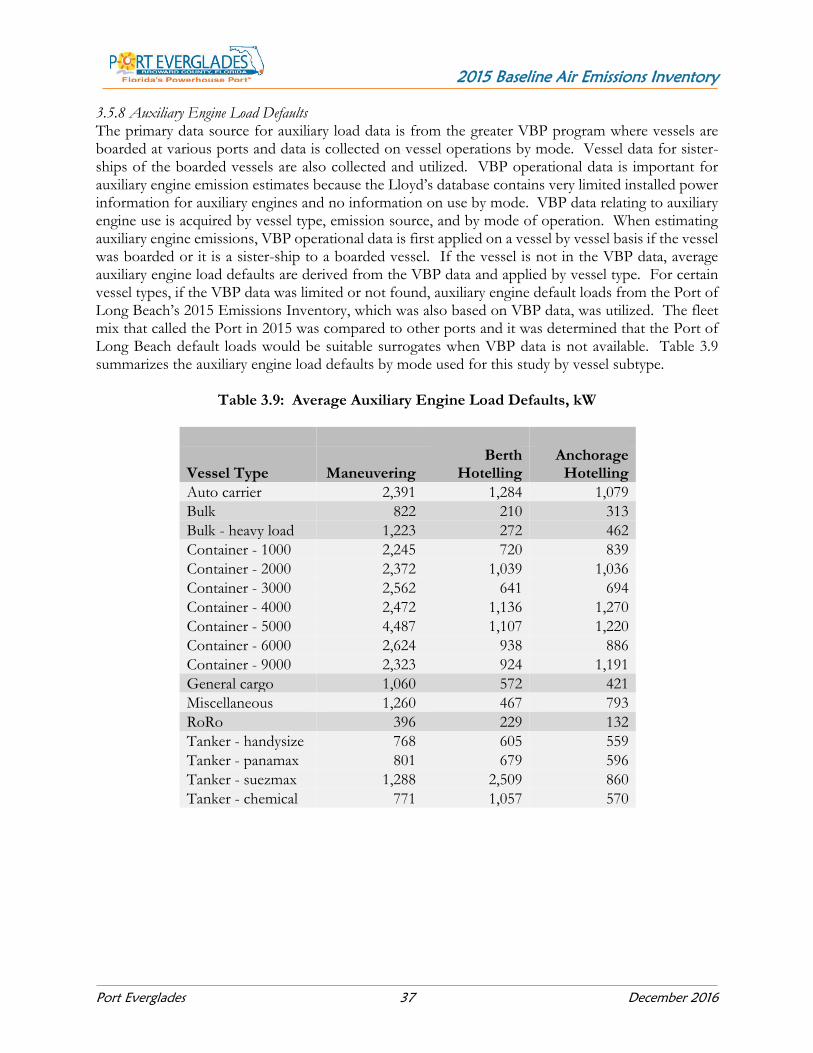
2015 Baseline Air Emissions Inventory
Port Everglades 37 December 2016
3.5.8 Auxiliary Engine Load Defaults The primary data source for auxiliary load data is from the greater VBP program where vessels are boarded at various ports and data is collected on vessel operations by mode. Vessel data for sister-ships of the boarded vessels are also collected and utilized. VBP operational data is important for auxiliary engine emission estimates because the Lloyd’s database contains very limited installed power information for auxiliary engines and no information on use by mode. VBP data relating to auxiliary engine use is acquired by vessel type, emission source, and by mode of operation. When estimating auxiliary engine emissions, VBP operational data is first applied on a vessel by vessel basis if the vessel was boarded or it is a sister-ship to a boarded vessel. If the vessel is not in the VBP data, average auxiliary engine load defaults are derived from the VBP data and applied by vessel type. For certain vessel types, if the VBP data was limited or not found, auxiliary engine default loads from the Port of Long Beach’s 2015 Emissions Inventory, which was also based on VBP data, was utilized. The fleet mix that called the Port in 2015 was compared to other ports and it was determined that the Port of Long Beach default loads would be suitable surrogates when VBP data is not available. Table 3.9 summarizes the auxiliary engine load defaults by mode used for this study by vessel subtype.
Table 3.9: Average Auxiliary Engine Load Defaults, kW
Vessel Type Maneuvering Berth
Hotelling Anchorage
Hotelling
Auto carrier 2,391 1,284 1,079
Bulk 822 210 313
Bulk - heavy load 1,223 272 462
Container - 1000 2,245 720 839
Container - 2000 2,372 1,039 1,036
Container - 3000 2,562 641 694
Container - 4000 2,472 1,136 1,270
Container - 5000 4,487 1,107 1,220
Container - 6000 2,624 938 886
Container - 9000 2,323 924 1,191
General cargo 1,060 572 421
Miscellaneous 1,260 467 793
RoRo 396 229 132
Tanker - handysize 768 605 559
Tanker - panamax 801 679 596
Tanker - suezmax 1,288 2,509 860
Tanker - chemical 771 1,057 570
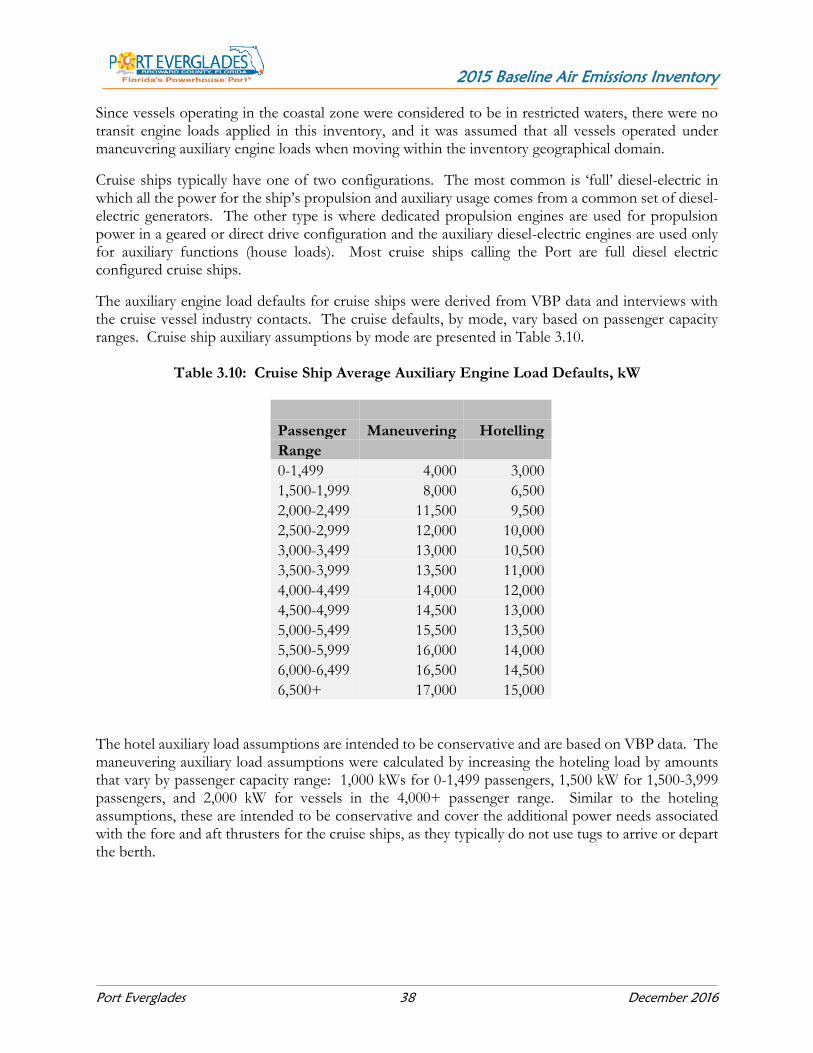
2015 Baseline Air Emissions Inventory
Port Everglades 38 December 2016
Since vessels operating in the coastal zone were considered to be in restricted waters, there were no transit engine loads applied in this inventory, and it was assumed that all vessels operated under maneuvering auxiliary engine loads when moving within the inventory geographical domain.
Cruise ships typically have one of two configurations. The most common is ‘full’ diesel-electric in which all the power for the ship’s propulsion and auxiliary usage comes from a common set of diesel-electric generators. The other type is where dedicated propulsion engines are used for propulsion power in a geared or direct drive configuration and the auxiliary diesel-electric engines are used only for auxiliary functions (house loads). Most cruise ships calling the Port are full diesel electric configured cruise ships.
The auxiliary engine load defaults for cruise ships were derived from VBP data and interviews with the cruise vessel industry contacts. The cruise defaults, by mode, vary based on passenger capacity ranges. Cruise ship auxiliary assumptions by mode are presented in Table 3.10.
Table 3.10: Cruise Ship Average Auxiliary Engine Load Defaults, kW
Passenger Maneuvering Hotelling
Range 0-1,499 4,000 3,000
1,500-1,999 8,000 6,500
2,000-2,499 11,500 9,500
2,500-2,999 12,000 10,000
3,000-3,499 13,000 10,500
3,500-3,999 13,500 11,000
4,000-4,499 14,000 12,000
4,500-4,999 14,500 13,000
5,000-5,499 15,500 13,500
5,500-5,999 16,000 14,000
6,000-6,499 16,500 14,500
6,500+ 17,000 15,000
The hotel auxiliary load assumptions are intended to be conservative and are based on VBP data. The maneuvering auxiliary load assumptions were calculated by increasing the hoteling load by amounts that vary by passenger capacity range: 1,000 kWs for 0-1,499 passengers, 1,500 kW for 1,500-3,999 passengers, and 2,000 kW for vessels in the 4,000+ passenger range. Similar to the hoteling assumptions, these are intended to be conservative and cover the additional power needs associated with the fore and aft thrusters for the cruise ships, as they typically do not use tugs to arrive or depart the berth.

2015 Baseline Air Emissions Inventory
Port Everglades 39 December 2016
3.5.9 Auxiliary Boiler Emission Factors and Load Defaults In addition to the auxiliary engines that are used to generate electricity for on-board uses, most OGVs have one or more boilers used for fuel heating and for producing hot water and steam. Table 3.11 shows the adjusted emission factors used for the auxiliary boilers based on ENTEC 2002 and IVL 2004 studies. Similar to the propulsion and auxiliary engine emission factors, the 2.7% sulfur HFO base emission factors are multiplied by the appropriate pollutant FCF (see Table 3.4) to calculate the 0.1% sulfur MGO emission factors.
Table 3.11: Emission Factors for Auxiliary Boilers using 0.1% S MGO,
g/kW-hr
The boiler fuel consumption data collected from vessels during the VBP was converted to equivalent kilowatts using specific fuel consumption (SFC) factors found in the ENTEC 2002 study. The average SFC value based on residual fuel is 305 grams of fuel per kW-hour. The average kW for auxiliary boilers was calculated using the following equation.
Equation 3.9
𝑨𝒗𝒆𝒓𝒂𝒈𝒆 𝒌𝑾 = ((𝒅𝒂𝒊𝒍𝒚 𝒇𝒖𝒆𝒍/𝟐𝟒) × 𝟏, 𝟎𝟎𝟎, 𝟎𝟎𝟎)/𝟑𝟎𝟓
Where:
Average kW = average energy output of boilers, kW daily fuel = boiler fuel consumption, tonnes per day
As with auxiliary engines, the primary source of load data is from the VBP, and direct values for vessels boarded are used on an individual basis for vessels boarded and their sister ships. There is no load data from the Lloyds database by mode. For vessels not boarded or vessels that did not have any sister vessels boarded through the VBP, average loads from Port of Long Beach 2015 Emissions Inventory were used as defaults.
Engine Category Model Year NOx PM10 PM2.5 DPM HC CO SO2 CO2 N2O CH4
Range
Steam main engine and boiler All 2.0 0.16 0.15 0.00 0.1 0.2 0.60 922 0.075 0.002

2015 Baseline Air Emissions Inventory
Port Everglades 40 December 2016
Auxiliary boilers are not typically used when the main engine load is greater than approximately 20% due to heat recovery systems that are used to produce heat while the ship is underway. If the main engine load is less than or equal to 20%, the maneuvering boiler load defaults shown in the table are used. As discussed in section 3.5.8, no at-sea boiler loads have been applied in this inventory because it has been assumed that heat recovery systems provide needed heat while at sea. Auxiliary boiler energy defaults in kilowatts used for each vessel type are presented in Table 3.12.
Table 3.12: Auxiliary Boiler Load Defaults, kW
Vessel Type Maneuvering Berth
Hotelling Anchorage
Hotelling
Auto Carrier 351 351 351
Bulk 132 132 132
Bulk - Heavy Load 132 132 132
Container - 1000 241 241 241
Container - 2000 325 325 325
Container - 3000 474 474 474
Container - 4000 492 492 492
Container - 5000 628 628 628
Container - 6000 600 600 600
Container - 9000 705 705 705
General Cargo 135 135 135
Miscellaneous 137 137 137
RoRo 243 243 243
Tanker - Handysize 371 2,586 371
Tanker - Panamax 371 3,293 371
Tanker - Suezmax 371 5,843 371
Tanker - Chemical 371 832 371
Full diesel electric cruise ships utilize scavenged heat (heat recovered from engine exhaust) to provide steam needed within the inventory boundary. The boilers in diesel electric cruise ships are therefore assumed to be off during hoteling and maneuvering modes.
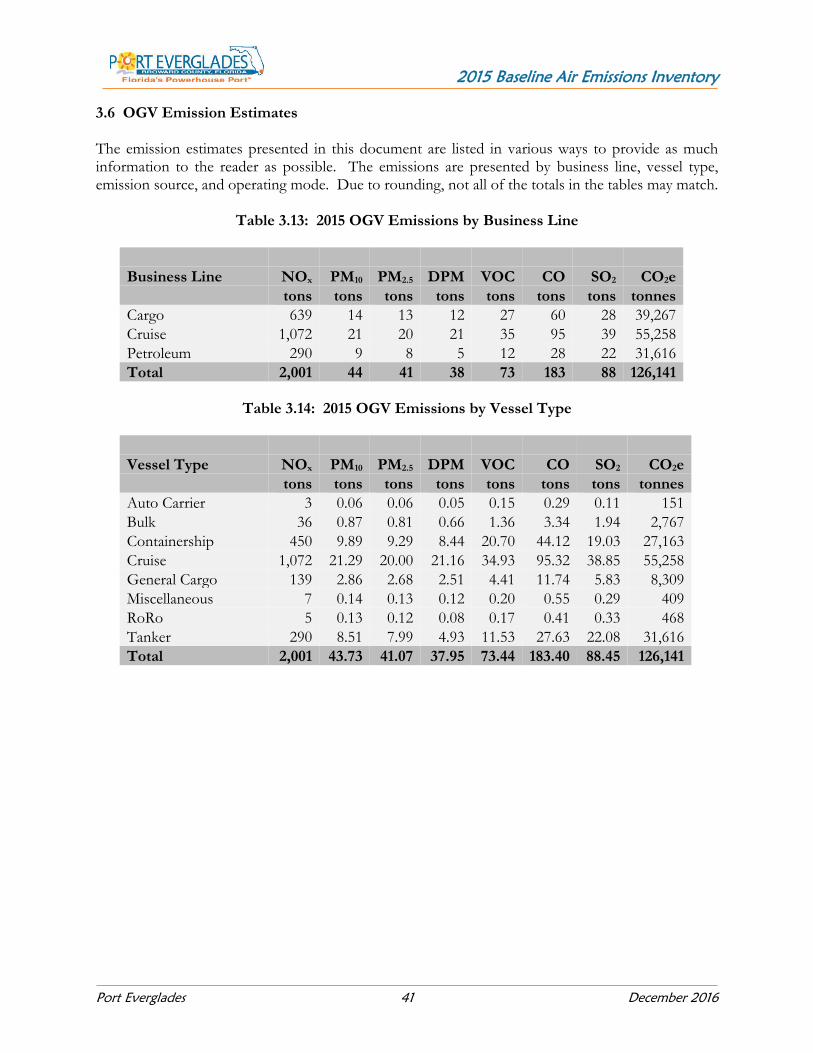
2015 Baseline Air Emissions Inventory
Port Everglades 41 December 2016
3.6 OGV Emission Estimates The emission estimates presented in this document are listed in various ways to provide as much information to the reader as possible. The emissions are presented by business line, vessel type, emission source, and operating mode. Due to rounding, not all of the totals in the tables may match.
Table 3.13: 2015 OGV Emissions by Business Line
Business Line NOx PM10 PM2.5 DPM VOC CO SO2 CO2e
tons tons tons tons tons tons tons tonnes
Cargo 639 14 13 12 27 60 28 39,267
Cruise 1,072 21 20 21 35 95 39 55,258
Petroleum 290 9 8 5 12 28 22 31,616
Total 2,001 44 41 38 73 183 88 126,141
Table 3.14: 2015 OGV Emissions by Vessel Type
Vessel Type NOx PM10 PM2.5 DPM VOC CO SO2 CO2e
tons tons tons tons tons tons tons tonnes
Auto Carrier 3 0.06 0.06 0.05 0.15 0.29 0.11 151
Bulk 36 0.87 0.81 0.66 1.36 3.34 1.94 2,767
Containership 450 9.89 9.29 8.44 20.70 44.12 19.03 27,163
Cruise 1,072 21.29 20.00 21.16 34.93 95.32 38.85 55,258
General Cargo 139 2.86 2.68 2.51 4.41 11.74 5.83 8,309
Miscellaneous 7 0.14 0.13 0.12 0.20 0.55 0.29 409
RoRo 5 0.13 0.12 0.08 0.17 0.41 0.33 468
Tanker 290 8.51 7.99 4.93 11.53 27.63 22.08 31,616
Total 2,001 43.73 41.07 37.95 73.44 183.40 88.45 126,141

2015 Baseline Air Emissions Inventory
Port Everglades 42 December 2016
Table 3.15: 2015 OGV Emissions by Emission Source Type
Emission Source NOx PM10 PM2.5 DPM VOC CO SO2 CO2e
tons tons tons tons tons tons tons tonnes
Main Engines 135 2.71 2.55 2.70 12.20 17.71 2.85 4,082
Auxiliary Engines 1,793 35.24 33.11 35.24 57.59 158.37 63.82 90,745
Boilers 72 5.78 5.41 0.00 3.66 7.31 21.78 31,314
Total 2,001 43.73 41.07 37.95 73.44 183.40 88.45 126,141
Table 3.16: 2015 OGV Emissions by Operating Mode
Operating Mode NOx PM10 PM2.5 DPM VOC CO SO2 CO2e
tons tons tons tons tons tons tons tonnes
Hotelling, Berth 1,526 33.86 31.79 28.76 50.22 135.68 71.29 101,674
Hotelling, Anchorage 94 2.21 2.07 1.73 3.13 8.38 4.93 7,036
Maneuvering 381 7.67 7.21 7.46 20.09 39.34 12.23 17,431
Total 2,001 43.73 41.07 37.95 73.44 183.40 88.45 126,141

2015 Baseline Air Emissions Inventory
Port Everglades 43 December 2016
SECTION 4 HARBOR CRAFT This section presenting emission estimates for the harbor vessels source category is organized into the following subsections: source description (4.1), data and information acquisition (4.2), emissions estimation methodology (4.3), and harbor craft emission estimates (4.4). 4.1 Source Description Emissions from the following types of diesel-fueled harbor craft were quantified:
Assist tug – The main task for these tugs is to assist and escort the marine vessels that call at the Port. The tugs may provide other towing work when not assisting and escorting arriving or departing vessels.
Articulated tug barge (ATB) – ATBs consist of tank barges coupled with high-horsepower tugs.
Pilot boat – The pilot boats are used to take or pick up pilots to the ocean-going vessels approximately 3-4 nm from the coastline.
Towboat – Towboats include self-propelled ocean tugs, pushboats, and towboats that tow/push barges. They can be used to move bulk liquids, scrap metal, bulk materials, rock, sand, and other materials. The towboat category in this study also includes tugboats, such as an inland vessel supply tugboat.
Yacht – Yacht activity is a significant business at Port Everglades and thus included in this emissions inventory. Only those yachts that stopped at a berth (i.e. called the Port) are included in this emissions inventory.
The geographical domain for harbor craft is the same as for the ocean-going vessels (see Section 3.2). This section includes activity and emissions for harbor craft that called the port or worked at the Port in 2015. Activity and emissions for transitory marine traffic through the Atlantic Intracoastal Waterway is included in Appendix A of this report.
Figures 4.1 through 4.5 shows the various harbor craft. The images shown in the figures may not be photographs of actual harbor craft while at the Port, but are for illustrative purposes only.
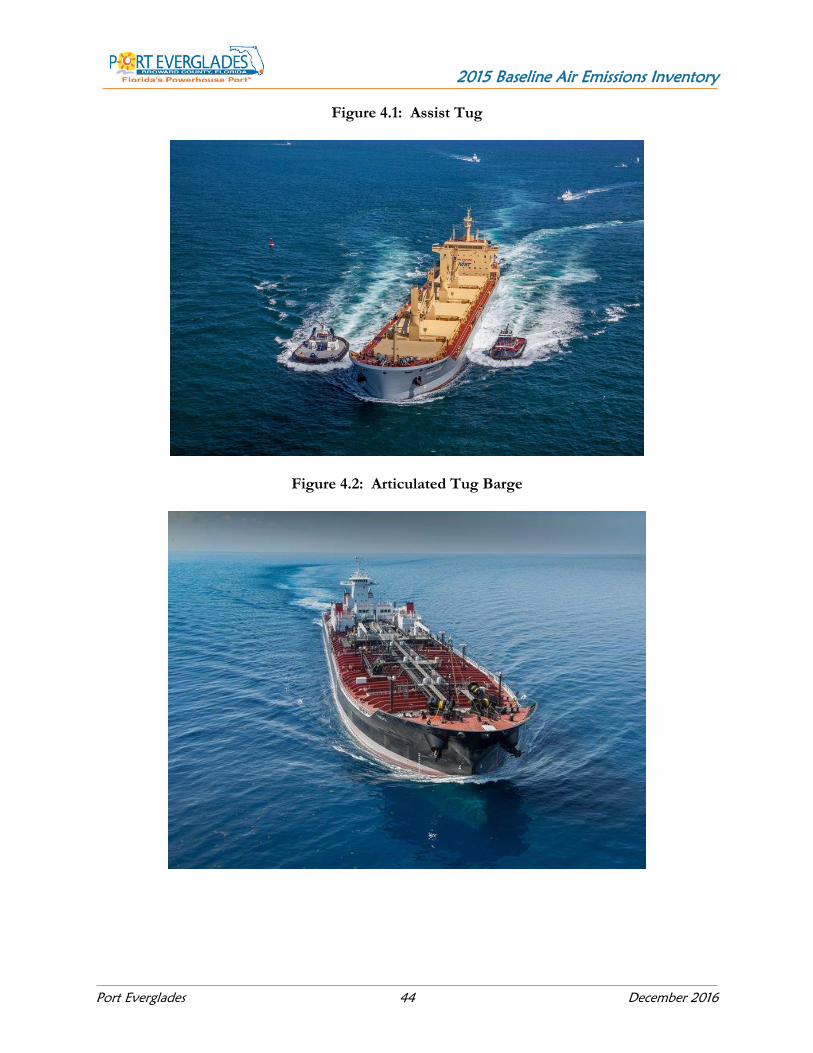
2015 Baseline Air Emissions Inventory
Port Everglades 44 December 2016
Figure 4.1: Assist Tug
Figure 4.2: Articulated Tug Barge

2015 Baseline Air Emissions Inventory
Port Everglades 45 December 2016
Figure 4.3: Pilot Boat
Figure 4.4: Towboat

2015 Baseline Air Emissions Inventory
Port Everglades 46 December 2016
Figure 4.5: Yacht
Figure 4.6 presents the distribution of the 100 harbor craft that called or worked within the study area in 2015. The vessel count is per discrete vessel and not for numerous trips they may have made throughout the year. The Fort Lauderdale area is called “the yachting capital of the world” and yachts are often hauled across the Atlantic to the area’s boatyards for maintenance and repairs between cruising seasons. Many yachts are shipped in and out of the Port Everglades annually. The yachts included in this inventory arrived or departed from a Port Everglades berth.
Figure 4.6: 2015 Distribution of Discrete Vessel Count for Harbor Craft
Yacht56%
Towboat21%
ATB16%
Assist tug4%
Pilot boat3%

2015 Baseline Air Emissions Inventory
Port Everglades 47 December 2016
4.2 Data and Information Acquisition The operational hours and engine characteristics data for assist tugs and pilot boats was acquired by contacting individual entities/companies and they in turn provided annual hours of use and engine characteristics for each vessel. Tables 4.1 and 4.2 summarize the characteristics of propulsion and auxiliary engines respectively, by vessel type for vessels that worked and/or called the Port in 2015. For some assist tugs, hours of operations were not available. To estimate emissions, average operating hours shown in tables 4.1 and 4.2 were used as defaults. For ATBs, towboats and yachts, AIS data was used to identify activity (hours) in three zones by Maritime Mobile Service Identity (MMSI) numbers. The three zones are defined as at berth, maneuvering, and in the coastal zone.
At berth - Hours in this zone were assumed for one auxiliary engine.
Maneuvering - Hours in this zone were assumed for one auxiliary engine and total installed propulsion engine horsepower.
Coastal zone - Hours in this zone were assumed for one auxiliary engine and total installed propulsion engine horsepower.
The domestic vessel AIS data was compared against call data received from the port and the data was divided into harbor craft that made calls to the port and those that were in transit. The emissions and activity for the harbor craft that called the port in 2015 are included in this section. For transitory marine traffic emissions, please see Appendix A. For ATBs, towboats, and yachts, a combination of AIS data for activity and Lloyd’s data and website searches for engine information were used. For vessel and engine information, activity data by IMO number was joined with Lloyd’s data to determine vessel keel laid date which represented vessel model year and engine horsepower. Lloyd’s data provided number and total installed propulsion engine horsepower for the vessel. Total propulsion horsepower was divided by number of engines and assigned to each propulsion engine. The auxiliary engine horsepower, for majority of the engines, was not available through Lloyd’s data. This information was obtained for several vessels via various towboat operators website. Averages within each vessel type were used where no data was available. For ATBs, towboats, and yachts, the vessel model year was used as a surrogate for engine year for lack of specific information on whether these vessels had been repowered. Therefore, the emission results will be conservative since some vessels may have replaced old engines with new ones, but the original engine is being used to estimate emissions.
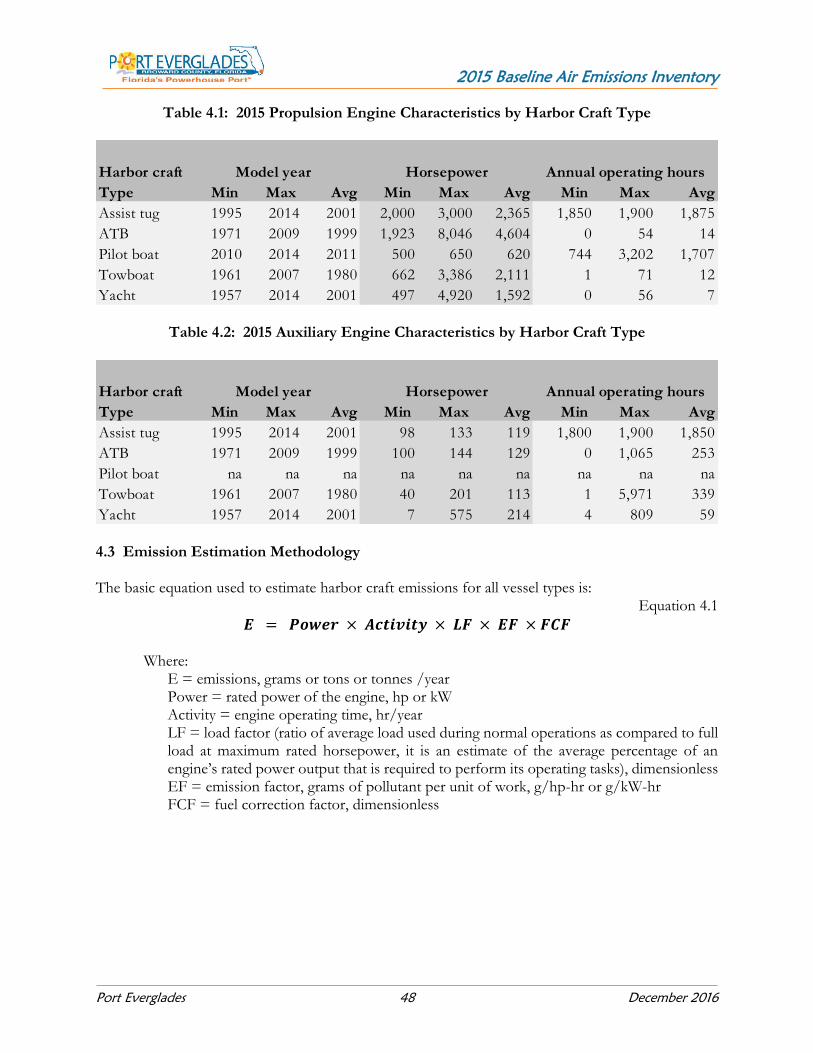
2015 Baseline Air Emissions Inventory
Port Everglades 48 December 2016
Table 4.1: 2015 Propulsion Engine Characteristics by Harbor Craft Type
Table 4.2: 2015 Auxiliary Engine Characteristics by Harbor Craft Type
4.3 Emission Estimation Methodology The basic equation used to estimate harbor craft emissions for all vessel types is:
Equation 4.1
𝑬 = 𝑷𝒐𝒘𝒆𝒓 × 𝑨𝒄𝒕𝒊𝒗𝒊𝒕𝒚 × 𝑳𝑭 × 𝑬𝑭 × 𝑭𝑪𝑭
Where: E = emissions, grams or tons or tonnes /year Power = rated power of the engine, hp or kW Activity = engine operating time, hr/year LF = load factor (ratio of average load used during normal operations as compared to full load at maximum rated horsepower, it is an estimate of the average percentage of an engine’s rated power output that is required to perform its operating tasks), dimensionless EF = emission factor, grams of pollutant per unit of work, g/hp-hr or g/kW-hr FCF = fuel correction factor, dimensionless
Harbor craft Model year Horsepower Annual operating hours
Type Min Max Avg Min Max Avg Min Max Avg
Assist tug 1995 2014 2001 2,000 3,000 2,365 1,850 1,900 1,875
ATB 1971 2009 1999 1,923 8,046 4,604 0 54 14
Pilot boat 2010 2014 2011 500 650 620 744 3,202 1,707
Towboat 1961 2007 1980 662 3,386 2,111 1 71 12
Yacht 1957 2014 2001 497 4,920 1,592 0 56 7
Harbor craft Model year Horsepower Annual operating hours
Type Min Max Avg Min Max Avg Min Max Avg
Assist tug 1995 2014 2001 98 133 119 1,800 1,900 1,850
ATB 1971 2009 1999 100 144 129 0 1,065 253
Pilot boat na na na na na na na na na
Towboat 1961 2007 1980 40 201 113 1 5,971 339
Yacht 1957 2014 2001 7 575 214 4 809 59
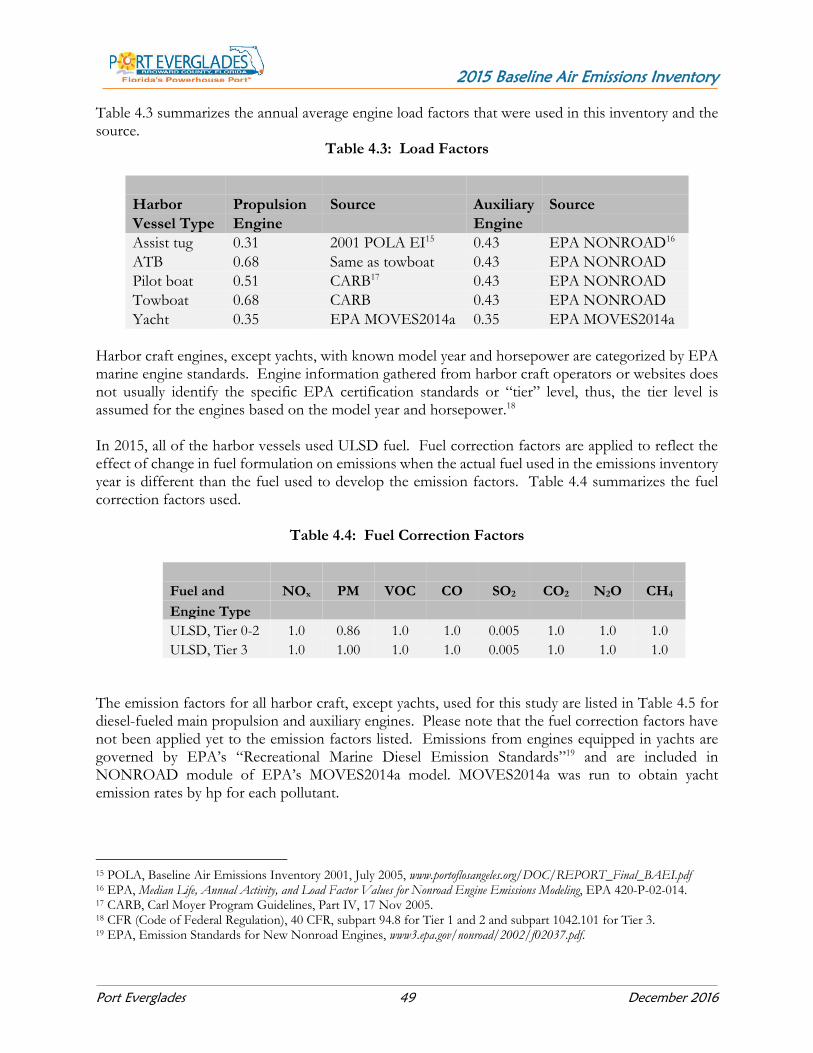
2015 Baseline Air Emissions Inventory
Port Everglades 49 December 2016
Table 4.3 summarizes the annual average engine load factors that were used in this inventory and the source.
Table 4.3: Load Factors
Harbor Propulsion Source Auxiliary Source
Vessel Type Engine Engine
Assist tug 0.31 2001 POLA EI15 0.43 EPA NONROAD16
ATB 0.68 Same as towboat 0.43 EPA NONROAD
Pilot boat 0.51 CARB17 0.43 EPA NONROAD
Towboat 0.68 CARB 0.43 EPA NONROAD
Yacht 0.35 EPA MOVES2014a 0.35 EPA MOVES2014a
Harbor craft engines, except yachts, with known model year and horsepower are categorized by EPA marine engine standards. Engine information gathered from harbor craft operators or websites does not usually identify the specific EPA certification standards or “tier” level, thus, the tier level is assumed for the engines based on the model year and horsepower.18 In 2015, all of the harbor vessels used ULSD fuel. Fuel correction factors are applied to reflect the effect of change in fuel formulation on emissions when the actual fuel used in the emissions inventory year is different than the fuel used to develop the emission factors. Table 4.4 summarizes the fuel correction factors used.
Table 4.4: Fuel Correction Factors
Fuel and NOx PM VOC CO SO2 CO2 N2O CH4
Engine Type ULSD, Tier 0-2 1.0 0.86 1.0 1.0 0.005 1.0 1.0 1.0
ULSD, Tier 3 1.0 1.00 1.0 1.0 0.005 1.0 1.0 1.0
The emission factors for all harbor craft, except yachts, used for this study are listed in Table 4.5 for diesel-fueled main propulsion and auxiliary engines. Please note that the fuel correction factors have not been applied yet to the emission factors listed. Emissions from engines equipped in yachts are governed by EPA’s “Recreational Marine Diesel Emission Standards”19 and are included in NONROAD module of EPA’s MOVES2014a model. MOVES2014a was run to obtain yacht emission rates by hp for each pollutant.
15 POLA, Baseline Air Emissions Inventory 2001, July 2005, www.portoflosangeles.org/DOC/REPORT_Final_BAEI.pdf 16 EPA, Median Life, Annual Activity, and Load Factor Values for Nonroad Engine Emissions Modeling, EPA 420-P-02-014. 17 CARB, Carl Moyer Program Guidelines, Part IV, 17 Nov 2005. 18 CFR (Code of Federal Regulation), 40 CFR, subpart 94.8 for Tier 1 and 2 and subpart 1042.101 for Tier 3. 19 EPA, Emission Standards for New Nonroad Engines, www3.epa.gov/nonroad/2002/f02037.pdf.

2015 Baseline Air Emissions Inventory
Port Everglades 50 December 2016
Table 4.5: Harbor Craft (Except Yachts) Emission Factors for Diesel Engines, g/kW-hr
kW Range Year NOx PM VOC CO SO2 CO2 N2O CH4
Range
0 to 8 <2000 10.23 1.00 0.27 8.0 1.3 690 0.031 0.01
8 to 19 <2000 9.23 0.80 0.27 6.6 1.3 690 0.031 0.01
19 to 37 <1999 9.23 0.80 0.27 6.6 1.3 690 0.031 0.01
37 to 76 <2000 10.0 0.40 0.27 1.7 1.3 690 0.031 0.01
76 to 131 <2000 10.0 0.40 0.27 1.5 1.3 690 0.031 0.01
131 to 1,001 <2000 10.0 0.30 0.27 1.5 1.3 690 0.031 0.01
1,000+ <2000 13.0 0.30 0.27 2.5 1.3 690 0.031 0.01
Cat 2 Engines <2000 13.2 0.72 0.50 1.1 1.3 690 0.031 0.01
0 to 8 2000-2005 10.23 0.90 0.27 2.0 1.3 690 0.031 0.01
8 to 19 2000-2005 9.23 0.80 0.27 2.0 1.3 690 0.031 0.01
19 to 37 2000-2004 9.23 0.80 0.27 2.0 1.3 690 0.031 0.01
37 to 76 2000-2004 9.8 0.40 0.27 1.7 1.3 690 0.031 0.01
76 to 131 2000-2004 9.8 0.40 0.27 1.5 1.3 690 0.031 0.01
131 to 1,001 2000-2004 9.8 0.30 0.27 1.5 1.3 690 0.031 0.01
1,000+ 2000-2007 9.8 0.30 0.27 2.5 1.3 690 0.031 0.01
Cat 2 Engines 2000-2007 9.8 0.72 0.50 1.1 1.3 690 0.031 0.01
0 to 8 2005-2009 7.3 0.80 0.20 5.0 1.3 690 0.031 0.01
8 to 19 2005-2009 7.3 0.80 0.20 5.0 1.3 690 0.031 0.01
19 to 37 2004-2009 7.3 0.60 0.20 5.0 1.3 690 0.031 0.01
131 to 1,001 2004-2013 7.0 0.20 0.20 5.0 1.3 690 0.031 0.01
1,000+ 2007-2013 7.0 0.20 0.20 5.0 1.3 690 0.031 0.01
Cat 2, <3,300 2007-2013 8.2 0.50 0.50 5.0 1.3 690 0.031 0.01
Cat 2, >3,300 2007-2013 9.3 0.50 0.50 5.0 1.3 690 0.031 0.01
0 to 8 2009+ 7.3 0.40 0.20 5.0 1.3 690 0.031 0.01
8 to 19 2009+ 7.3 0.40 0.20 5.0 1.3 690 0.031 0.01
19 to 37 2009+ 7.3 0.30 0.20 5.0 1.3 690 0.031 0.01
37 to 76 2013+ 7.3 0.30 0.20 5.0 1.3 690 0.031 0.01
76 to 1,001 2013+ 5.2 0.12 0.20 5.0 1.3 690 0.031 0.01
1,000+ 2013+ 7.3 0.14 0.20 5.0 1.3 690 0.031 0.01
Cat 2, <3,300 2013+ 7.3 0.14 0.50 5.0 1.3 690 0.031 0.01
Tier 0 engines
Tier 1 engines
Tier 2 engines
Tier 3 engines
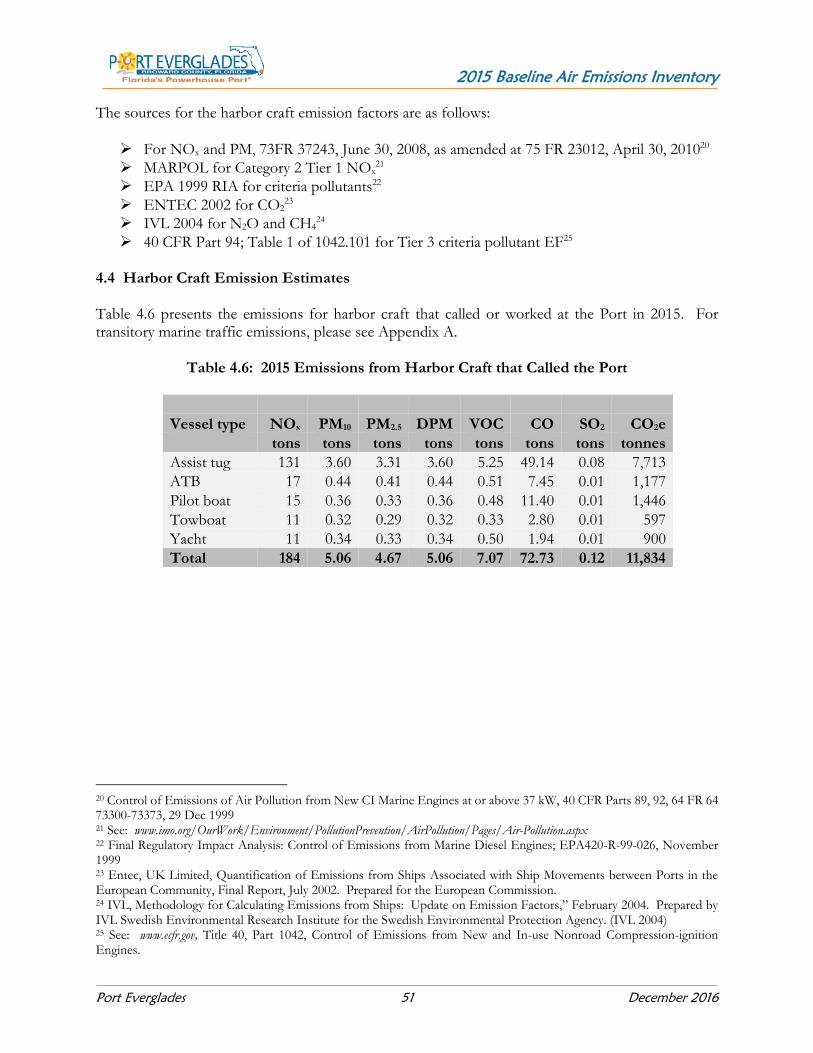
2015 Baseline Air Emissions Inventory
Port Everglades 51 December 2016
The sources for the harbor craft emission factors are as follows:
For NOx and PM, 73FR 37243, June 30, 2008, as amended at 75 FR 23012, April 30, 201020
MARPOL for Category 2 Tier 1 NOx21
EPA 1999 RIA for criteria pollutants22
ENTEC 2002 for CO223
IVL 2004 for N2O and CH424
40 CFR Part 94; Table 1 of 1042.101 for Tier 3 criteria pollutant EF25 4.4 Harbor Craft Emission Estimates Table 4.6 presents the emissions for harbor craft that called or worked at the Port in 2015. For transitory marine traffic emissions, please see Appendix A.
Table 4.6: 2015 Emissions from Harbor Craft that Called the Port
Vessel type NOx PM10 PM2.5 DPM VOC CO SO2 CO2e
tons tons tons tons tons tons tons tonnes
Assist tug 131 3.60 3.31 3.60 5.25 49.14 0.08 7,713
ATB 17 0.44 0.41 0.44 0.51 7.45 0.01 1,177
Pilot boat 15 0.36 0.33 0.36 0.48 11.40 0.01 1,446
Towboat 11 0.32 0.29 0.32 0.33 2.80 0.01 597
Yacht 11 0.34 0.33 0.34 0.50 1.94 0.01 900
Total 184 5.06 4.67 5.06 7.07 72.73 0.12 11,834
20 Control of Emissions of Air Pollution from New CI Marine Engines at or above 37 kW, 40 CFR Parts 89, 92, 64 FR 64 73300-73373, 29 Dec 1999 21 See: www.imo.org/OurWork/Environment/PollutionPrevention/AirPollution/Pages/Air-Pollution.aspx 22 Final Regulatory Impact Analysis: Control of Emissions from Marine Diesel Engines; EPA420-R-99-026, November 1999 23 Entec, UK Limited, Quantification of Emissions from Ships Associated with Ship Movements between Ports in the European Community, Final Report, July 2002. Prepared for the European Commission. 24 IVL, Methodology for Calculating Emissions from Ships: Update on Emission Factors,” February 2004. Prepared by IVL Swedish Environmental Research Institute for the Swedish Environmental Protection Agency. (IVL 2004) 25 See: www.ecfr.gov, Title 40, Part 1042, Control of Emissions from New and In-use Nonroad Compression-ignition Engines.
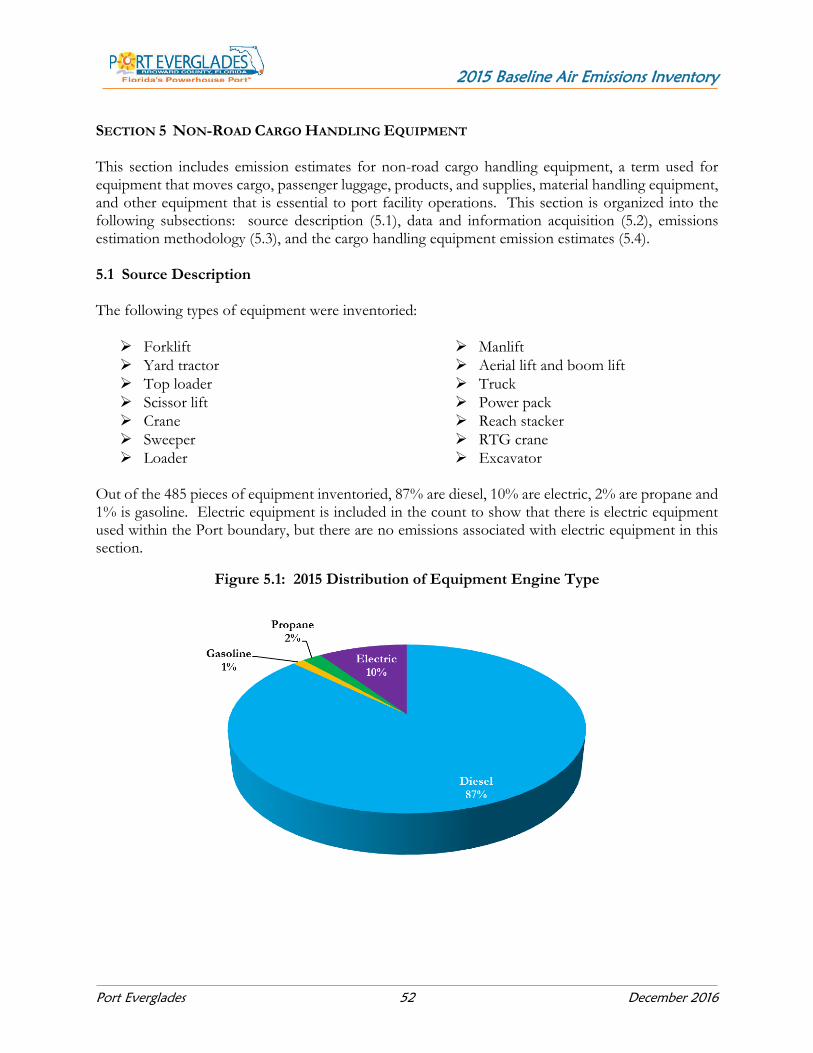
2015 Baseline Air Emissions Inventory
Port Everglades 52 December 2016
SECTION 5 NON-ROAD CARGO HANDLING EQUIPMENT This section includes emission estimates for non-road cargo handling equipment, a term used for equipment that moves cargo, passenger luggage, products, and supplies, material handling equipment, and other equipment that is essential to port facility operations. This section is organized into the following subsections: source description (5.1), data and information acquisition (5.2), emissions estimation methodology (5.3), and the cargo handling equipment emission estimates (5.4). 5.1 Source Description The following types of equipment were inventoried:
Forklift
Yard tractor
Top loader
Scissor lift
Crane
Sweeper
Loader
Manlift
Aerial lift and boom lift
Truck
Power pack
Reach stacker
RTG crane
Excavator Out of the 485 pieces of equipment inventoried, 87% are diesel, 10% are electric, 2% are propane and 1% is gasoline. Electric equipment is included in the count to show that there is electric equipment used within the Port boundary, but there are no emissions associated with electric equipment in this section.
Figure 5.1: 2015 Distribution of Equipment Engine Type
2015 Baseline Air Emissions Inventory
Port Everglades 53 December 2016
5.2 Data and Information Acquisition The maintenance and/or equipment operating staff of each terminal/facility were contacted to obtain equipment count, engine characteristics, and activity information on the equipment specific to their terminal or facility operations for the 2015 calendar year. Due to confidentiality reasons, one terminal chose not to provide data. The Port staff helped the data collector make assumptions for that particular terminal’s equipment based on their knowledge of operations. Another similar terminal’s equipment list was used as a default and the hours were pro-rated based on the two terminals throughput. Since this was the first inventory conducted at Port Everglades, most of the facilities had equipment lists, but not all of the data fields requested. For example, some knew equipment and/or engine make and model, but not horsepower. Most provided average hours of operation for the year, but not actual hours since they do not normally keep actual hours in a log where it would be easy to calculate the actual annual hours for a given year. For the equipment with unknown engine horsepower, additional research was done by the data collector prior to completing data collection. For forklifts and yard tractors, which make up the majority of the equipment for this study, the engine horsepower was included using the following techniques:
For forklifts, the horsepower was estimated based on engine type, engine make and model, and/or lift capacity provided. For those forklifts that lacked sufficient data to estimate horsepower, it was left blank and defaults were used to estimate emissions.
For yard tractors, if the make/model was known, the horsepower was included based on the company web search.
There are several equipment types in this inventory that only have one piece of equipment with an unknown horsepower. These equipment types were researched and an assumed horsepower was included from other port inventories or from engine specifications found on manufacturers’ websites.

2015 Baseline Air Emissions Inventory
Port Everglades 54 December 2016
Table 5.1 summarizes the engine characteristics and operating hours of yard equipment operating at the Port in 2015. Averages of the model year, horsepower, or operating hours are used as default values when equipment specific data is not available. The “na” in the tables means that data was not available at time of data collection. Electric equipment does not have emissions associated with it, but are included in the count.
Table 5.1: 2015 Equipment Characteristics
Equipment Engine Count Model Year Horsepower Annual Hours
Type Average Average Average
Aerial lift Diesel 3 2003 147 300
Crane Diesel 4 2009 2,013 1,433
Empty container handler Diesel 2 2006 155 na
Excavator Diesel 1 2008 370 300
Forklift Diesel 177 2006 76 659
Loader Diesel 1 2007 290 300
Manlift Diesel 1 na 78 300
Power pack Diesel 5 1996 458 3,600
Reach stacker Diesel 4 2012 365 1,650
RTG crane Diesel 3 2014 300 2,000
Scissor lift Diesel 4 2003 30 300
Skid steer loader Diesel 1 1997 68 300
Sweeper Diesel 3 2010 74 300
Top loader Diesel 54 2003 331 1,972
Truck Diesel 4 2011 150 288
Yard tractor Diesel 156 2003 175 1,333
Forklift Gasoline 4 1994 54 900
Sweeper Gasoline 2 na 74 300
Forklift Propane 10 2004 54 352
Forklift Electric 26 na na na
Scissor lift Electric 12 na na na
Boom lift Electric 1 na na na
Crane Electric 7 na na na
Total 485
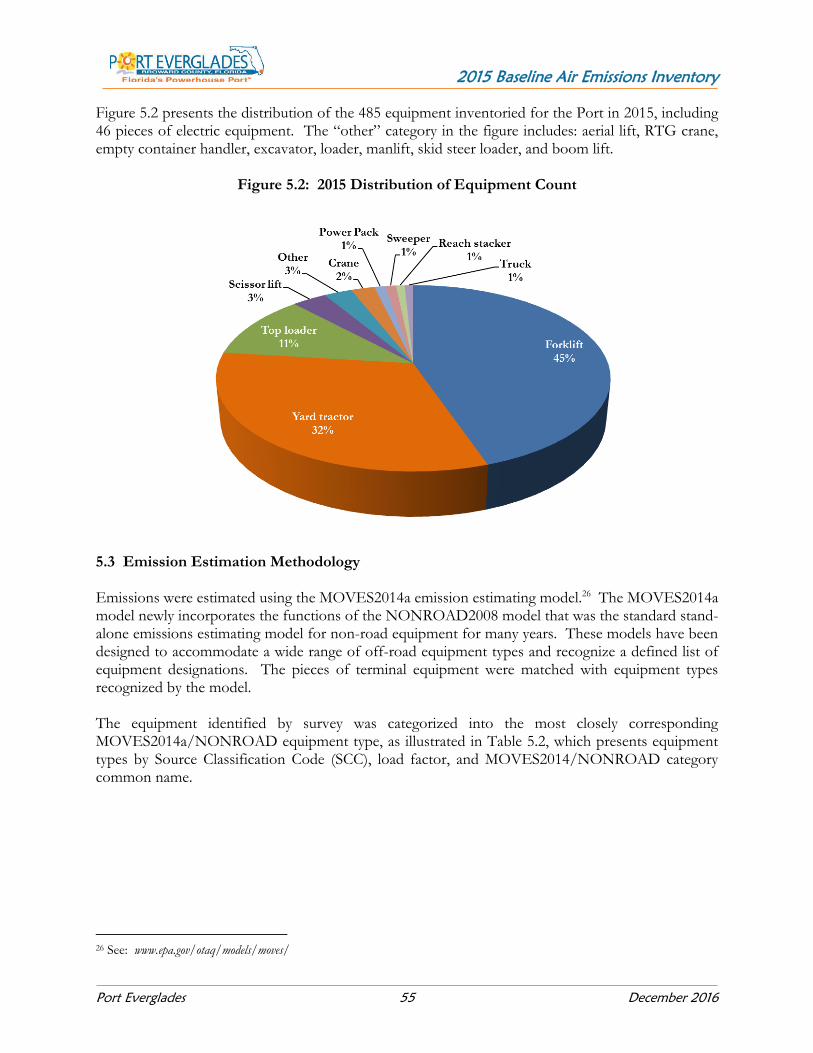
2015 Baseline Air Emissions Inventory
Port Everglades 55 December 2016
Figure 5.2 presents the distribution of the 485 equipment inventoried for the Port in 2015, including 46 pieces of electric equipment. The “other” category in the figure includes: aerial lift, RTG crane, empty container handler, excavator, loader, manlift, skid steer loader, and boom lift.
Figure 5.2: 2015 Distribution of Equipment Count
5.3 Emission Estimation Methodology Emissions were estimated using the MOVES2014a emission estimating model.26 The MOVES2014a model newly incorporates the functions of the NONROAD2008 model that was the standard stand- alone emissions estimating model for non-road equipment for many years. These models have been designed to accommodate a wide range of off-road equipment types and recognize a defined list of equipment designations. The pieces of terminal equipment were matched with equipment types recognized by the model. The equipment identified by survey was categorized into the most closely corresponding MOVES2014a/NONROAD equipment type, as illustrated in Table 5.2, which presents equipment types by Source Classification Code (SCC), load factor, and MOVES2014/NONROAD category common name.
26 See: www.epa.gov/otaq/models/moves/
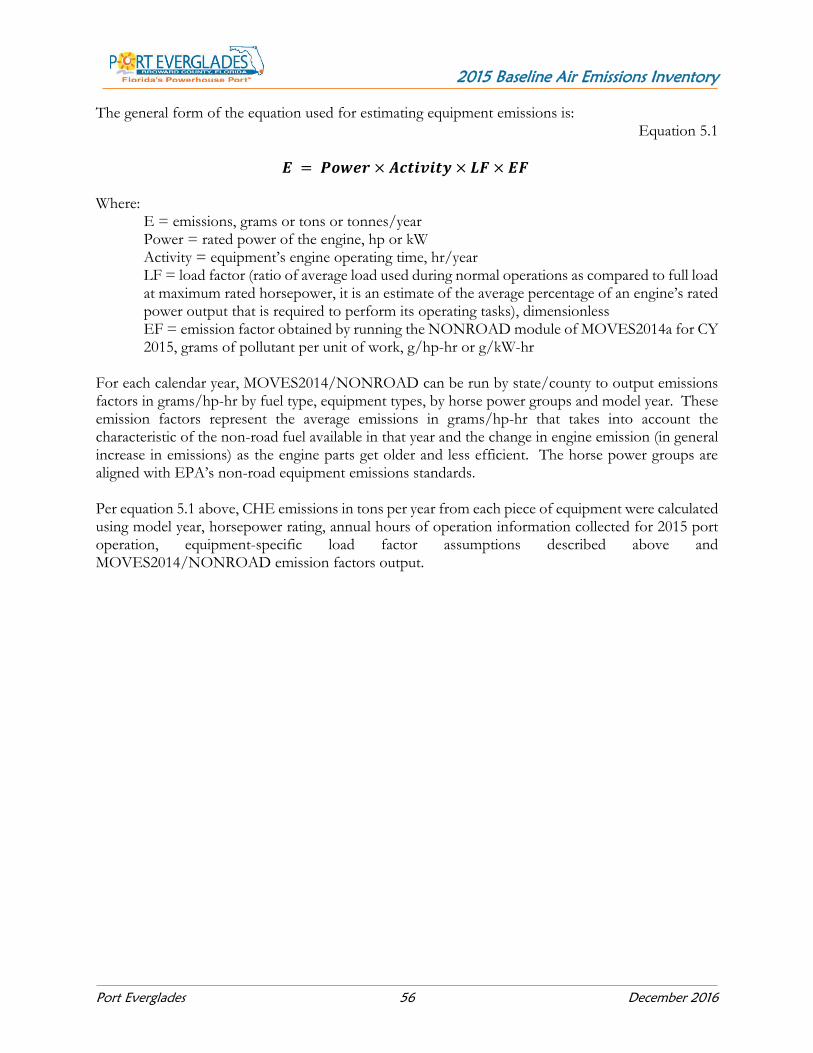
2015 Baseline Air Emissions Inventory
Port Everglades 56 December 2016
The general form of the equation used for estimating equipment emissions is: Equation 5.1
𝑬 = 𝑷𝒐𝒘𝒆𝒓 × 𝑨𝒄𝒕𝒊𝒗𝒊𝒕𝒚 × 𝑳𝑭 × 𝑬𝑭 Where:
E = emissions, grams or tons or tonnes/year Power = rated power of the engine, hp or kW Activity = equipment’s engine operating time, hr/year LF = load factor (ratio of average load used during normal operations as compared to full load at maximum rated horsepower, it is an estimate of the average percentage of an engine’s rated power output that is required to perform its operating tasks), dimensionless EF = emission factor obtained by running the NONROAD module of MOVES2014a for CY 2015, grams of pollutant per unit of work, g/hp-hr or g/kW-hr
For each calendar year, MOVES2014/NONROAD can be run by state/county to output emissions factors in grams/hp-hr by fuel type, equipment types, by horse power groups and model year. These emission factors represent the average emissions in grams/hp-hr that takes into account the characteristic of the non-road fuel available in that year and the change in engine emission (in general increase in emissions) as the engine parts get older and less efficient. The horse power groups are aligned with EPA’s non-road equipment emissions standards. Per equation 5.1 above, CHE emissions in tons per year from each piece of equipment were calculated using model year, horsepower rating, annual hours of operation information collected for 2015 port operation, equipment-specific load factor assumptions described above and MOVES2014/NONROAD emission factors output.
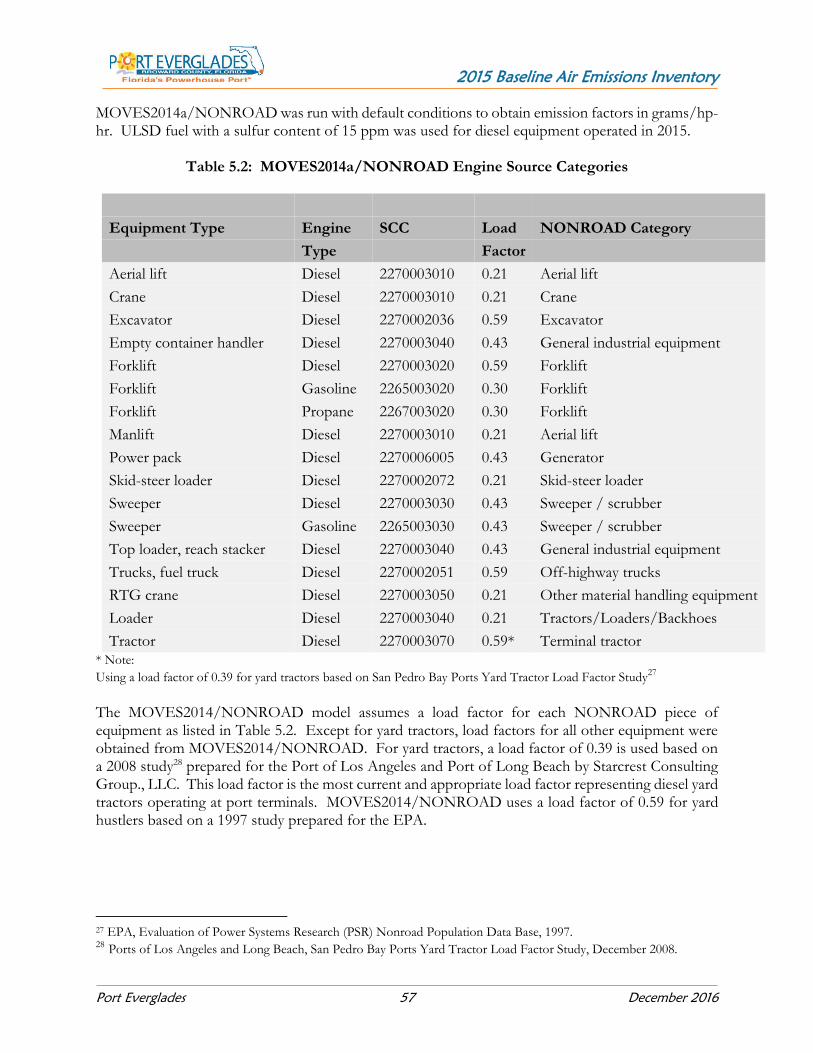
2015 Baseline Air Emissions Inventory
Port Everglades 57 December 2016
MOVES2014a/NONROAD was run with default conditions to obtain emission factors in grams/hp-hr. ULSD fuel with a sulfur content of 15 ppm was used for diesel equipment operated in 2015.
Table 5.2: MOVES2014a/NONROAD Engine Source Categories
Equipment Type Engine SCC Load NONROAD Category Type Factor
Aerial lift Diesel 2270003010 0.21 Aerial lift
Crane Diesel 2270003010 0.21 Crane
Excavator Diesel 2270002036 0.59 Excavator
Empty container handler Diesel 2270003040 0.43 General industrial equipment
Forklift Diesel 2270003020 0.59 Forklift
Forklift Gasoline 2265003020 0.30 Forklift
Forklift Propane 2267003020 0.30 Forklift
Manlift Diesel 2270003010 0.21 Aerial lift
Power pack Diesel 2270006005 0.43 Generator
Skid-steer loader Diesel 2270002072 0.21 Skid-steer loader
Sweeper Diesel 2270003030 0.43 Sweeper / scrubber
Sweeper Gasoline 2265003030 0.43 Sweeper / scrubber
Top loader, reach stacker Diesel 2270003040 0.43 General industrial equipment
Trucks, fuel truck Diesel 2270002051 0.59 Off-highway trucks
RTG crane Diesel 2270003050 0.21 Other material handling equipment
Loader Diesel 2270003040 0.21 Tractors/Loaders/Backhoes
Tractor Diesel 2270003070 0.59* Terminal tractor * Note:
Using a load factor of 0.39 for yard tractors based on San Pedro Bay Ports Yard Tractor Load Factor Study27
The MOVES2014/NONROAD model assumes a load factor for each NONROAD piece of equipment as listed in Table 5.2. Except for yard tractors, load factors for all other equipment were obtained from MOVES2014/NONROAD. For yard tractors, a load factor of 0.39 is used based on a 2008 study28 prepared for the Port of Los Angeles and Port of Long Beach by Starcrest Consulting Group., LLC. This load factor is the most current and appropriate load factor representing diesel yard tractors operating at port terminals. MOVES2014/NONROAD uses a load factor of 0.59 for yard hustlers based on a 1997 study prepared for the EPA.
27 EPA, Evaluation of Power Systems Research (PSR) Nonroad Population Data Base, 1997. 28 Ports of Los Angeles and Long Beach, San Pedro Bay Ports Yard Tractor Load Factor Study, December 2008.
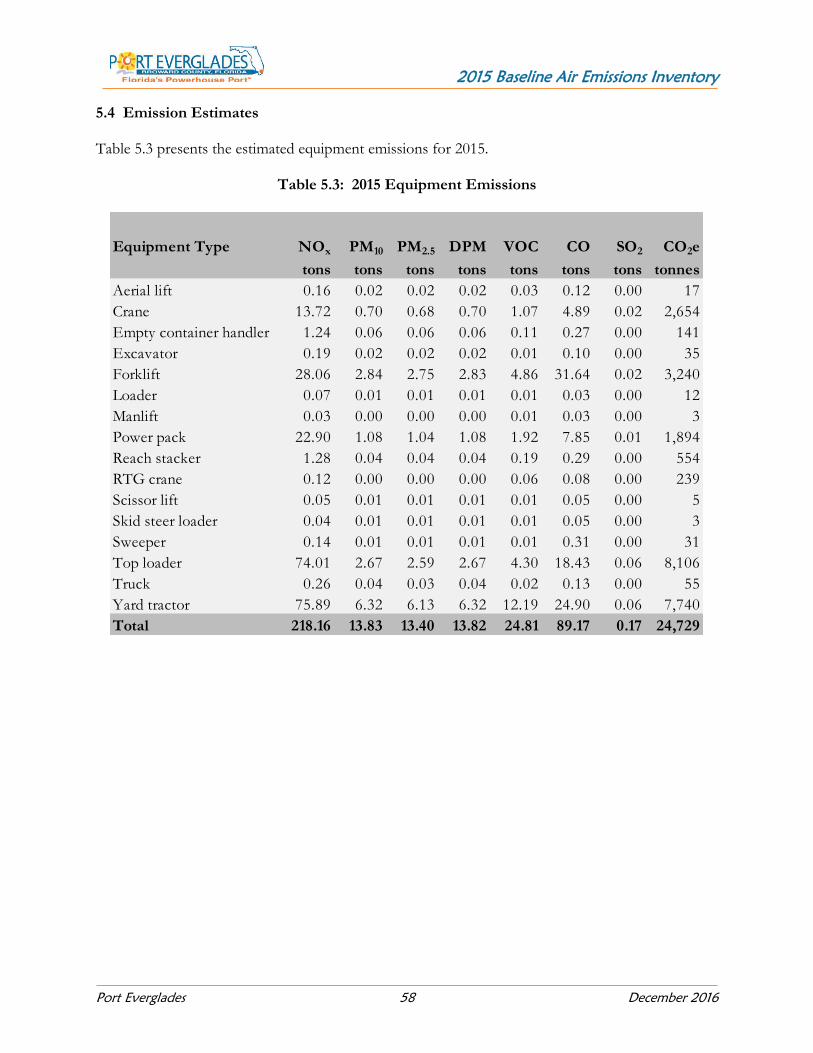
2015 Baseline Air Emissions Inventory
Port Everglades 58 December 2016
5.4 Emission Estimates Table 5.3 presents the estimated equipment emissions for 2015.
Table 5.3: 2015 Equipment Emissions
Equipment Type NOx PM10 PM2.5 DPM VOC CO SO2 CO2e
tons tons tons tons tons tons tons tonnes
Aerial lift 0.16 0.02 0.02 0.02 0.03 0.12 0.00 17
Crane 13.72 0.70 0.68 0.70 1.07 4.89 0.02 2,654
Empty container handler 1.24 0.06 0.06 0.06 0.11 0.27 0.00 141
Excavator 0.19 0.02 0.02 0.02 0.01 0.10 0.00 35
Forklift 28.06 2.84 2.75 2.83 4.86 31.64 0.02 3,240
Loader 0.07 0.01 0.01 0.01 0.01 0.03 0.00 12
Manlift 0.03 0.00 0.00 0.00 0.01 0.03 0.00 3
Power pack 22.90 1.08 1.04 1.08 1.92 7.85 0.01 1,894
Reach stacker 1.28 0.04 0.04 0.04 0.19 0.29 0.00 554
RTG crane 0.12 0.00 0.00 0.00 0.06 0.08 0.00 239
Scissor lift 0.05 0.01 0.01 0.01 0.01 0.05 0.00 5
Skid steer loader 0.04 0.01 0.01 0.01 0.01 0.05 0.00 3
Sweeper 0.14 0.01 0.01 0.01 0.01 0.31 0.00 31
Top loader 74.01 2.67 2.59 2.67 4.30 18.43 0.06 8,106
Truck 0.26 0.04 0.03 0.04 0.02 0.13 0.00 55
Yard tractor 75.89 6.32 6.13 6.32 12.19 24.90 0.06 7,740
Total 218.16 13.83 13.40 13.82 24.81 89.17 0.17 24,729

2015 Baseline Air Emissions Inventory
Port Everglades 59 December 2016
SECTION 6 ON-ROAD VEHICLES This section presents emission estimates for on-road vehicles associated with Port activity, which include the heavy-duty vehicle (HDV) emission source category and the light and medium-duty vehicles that transport passengers to and from the Port’s extensive cruise facilities and that the Port operates on facilities within the Port. The section is organized into the following subsections: emission source description (6.1), data and information acquisition (6.2), emissions estimation methodology (6.3), and the on-road vehicles emission estimates (6.4). 6.1 Source Description The vehicle types included in this inventory are heavy-duty trucks that move cargo, passenger vehicles that transport cruise passengers to and from the port, and passenger cars and light-duty trucks and vans owned by the Port and used on Port facilities. Heavy-duty trucks move cargo to and from the terminals and facilities that serve as the bridge between land and sea transportation. They are primarily driven on the public roads on and near the port and on highways. The vehicles are usually not under the direct control of the ports, the terminals, or the shippers who use the terminals, but are usually either owner-operated or are components of a carrier fleet. The most common configuration of HDVs in maritime freight service is the articulated tractor-trailer (truck and semi-trailer) having five axles, including the trailer axles. Common trailer types in the study area include container trailer or chassis, built to accommodate standard-sized cargo containers, tankers, boxes, and flatbeds. As examples of typical HDVs, Figure 6.1 shows trucks waiting outside a terminal and Figure 6.2 shows a pair of tanker trucks at a loading facility. The images shown in the figures may not be photographs of actual pieces of equipment used at the surveyed terminals, but are for illustrative purposes only. In addition to the heavy-duty on-road vehicles that serve the Port’s terminals, Port roadways are used by passenger cars and medium-duty buses and vans to transport cruise passengers to and from the Port’s cruise terminals. Like the HDVs, these vehicles are generally not associated with the Port or the cruise terminals but are largely privately owned cars and shuttle vehicles operated by area hotels, parking facilities, and other businesses that support the cruise industry. A third category of on-road vehicles included in the inventory consists of the light-duty vehicles such as passenger cars, pickup trucks, and vans owned and operated by the Port within the facilities on the Port. While tenants also own and operate vehicles of these types, not enough information on these vehicles was collected to support a meaningful estimate of emissions. Therefore, only Port-owned vehicles have been included in this inventory.
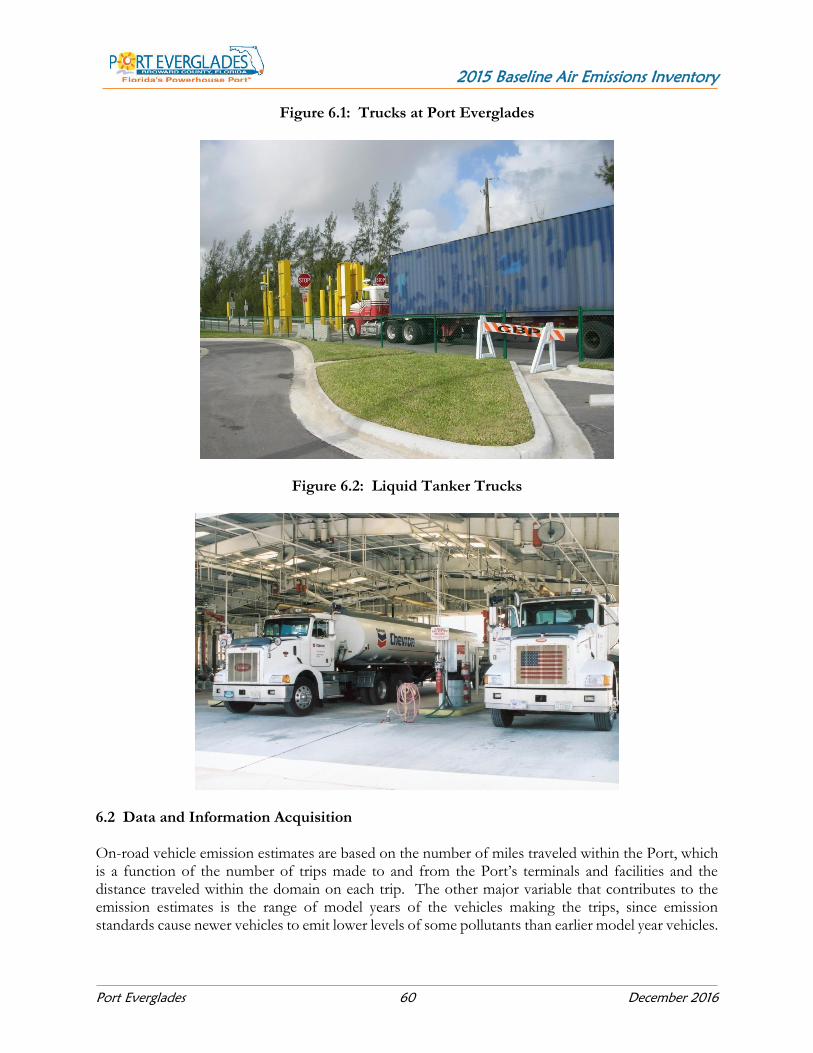
2015 Baseline Air Emissions Inventory
Port Everglades 60 December 2016
Figure 6.1: Trucks at Port Everglades
Figure 6.2: Liquid Tanker Trucks
6.2 Data and Information Acquisition On-road vehicle emission estimates are based on the number of miles traveled within the Port, which is a function of the number of trips made to and from the Port’s terminals and facilities and the distance traveled within the domain on each trip. The other major variable that contributes to the emission estimates is the range of model years of the vehicles making the trips, since emission standards cause newer vehicles to emit lower levels of some pollutants than earlier model year vehicles.
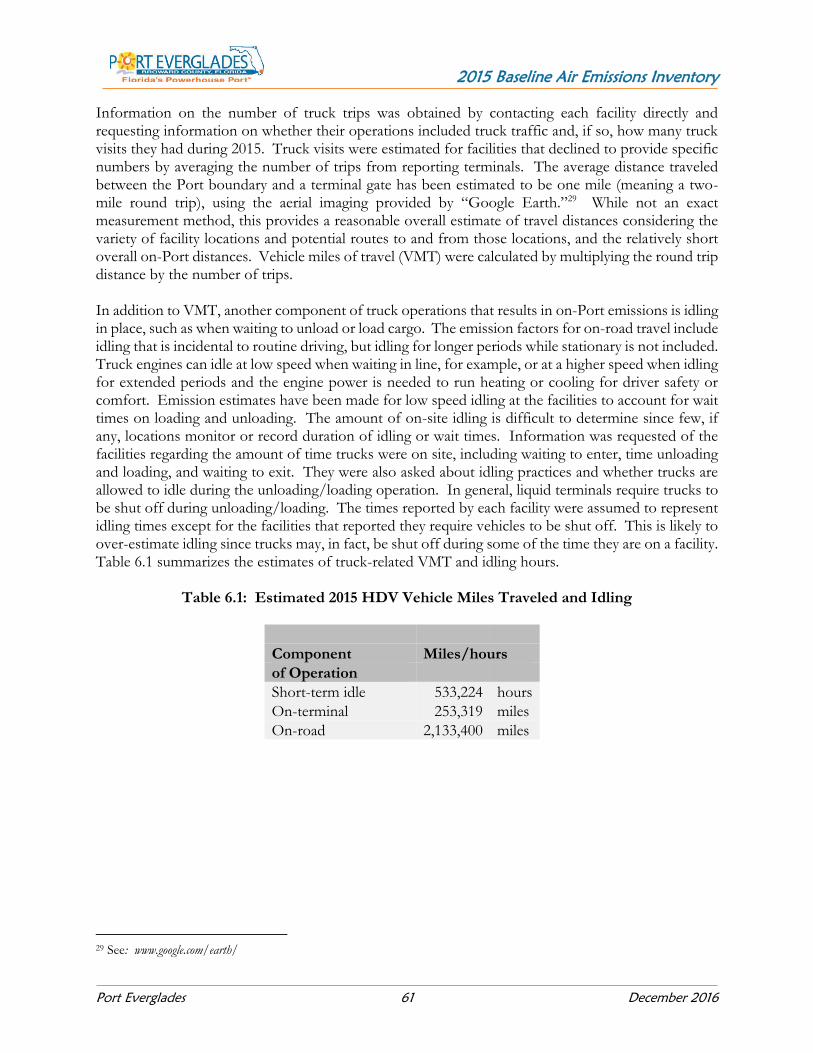
2015 Baseline Air Emissions Inventory
Port Everglades 61 December 2016
Information on the number of truck trips was obtained by contacting each facility directly and requesting information on whether their operations included truck traffic and, if so, how many truck visits they had during 2015. Truck visits were estimated for facilities that declined to provide specific numbers by averaging the number of trips from reporting terminals. The average distance traveled between the Port boundary and a terminal gate has been estimated to be one mile (meaning a two-mile round trip), using the aerial imaging provided by “Google Earth.”29 While not an exact measurement method, this provides a reasonable overall estimate of travel distances considering the variety of facility locations and potential routes to and from those locations, and the relatively short overall on-Port distances. Vehicle miles of travel (VMT) were calculated by multiplying the round trip distance by the number of trips. In addition to VMT, another component of truck operations that results in on-Port emissions is idling in place, such as when waiting to unload or load cargo. The emission factors for on-road travel include idling that is incidental to routine driving, but idling for longer periods while stationary is not included. Truck engines can idle at low speed when waiting in line, for example, or at a higher speed when idling for extended periods and the engine power is needed to run heating or cooling for driver safety or comfort. Emission estimates have been made for low speed idling at the facilities to account for wait times on loading and unloading. The amount of on-site idling is difficult to determine since few, if any, locations monitor or record duration of idling or wait times. Information was requested of the facilities regarding the amount of time trucks were on site, including waiting to enter, time unloading and loading, and waiting to exit. They were also asked about idling practices and whether trucks are allowed to idle during the unloading/loading operation. In general, liquid terminals require trucks to be shut off during unloading/loading. The times reported by each facility were assumed to represent idling times except for the facilities that reported they require vehicles to be shut off. This is likely to over-estimate idling since trucks may, in fact, be shut off during some of the time they are on a facility. Table 6.1 summarizes the estimates of truck-related VMT and idling hours.
Table 6.1: Estimated 2015 HDV Vehicle Miles Traveled and Idling
Component Miles/hours
of Operation Short-term idle 533,224 hours
On-terminal 253,319 miles
On-road 2,133,400 miles
29 See: www.google.com/earth/
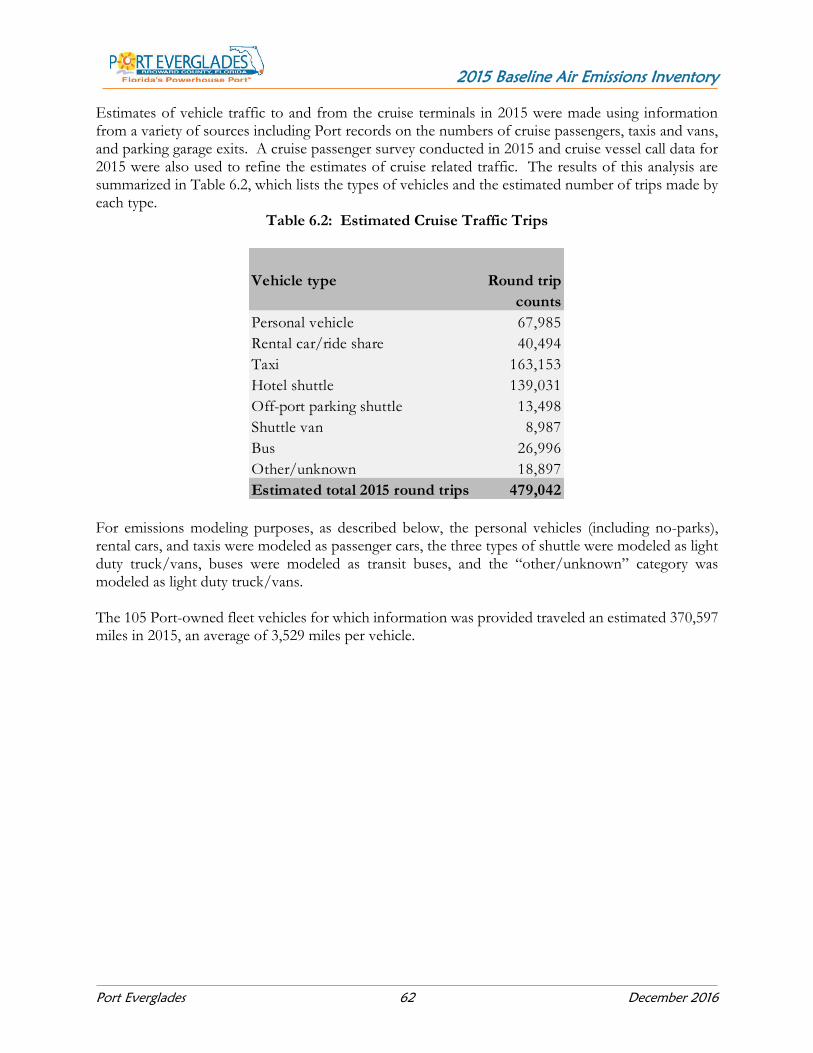
2015 Baseline Air Emissions Inventory
Port Everglades 62 December 2016
Estimates of vehicle traffic to and from the cruise terminals in 2015 were made using information from a variety of sources including Port records on the numbers of cruise passengers, taxis and vans, and parking garage exits. A cruise passenger survey conducted in 2015 and cruise vessel call data for 2015 were also used to refine the estimates of cruise related traffic. The results of this analysis are summarized in Table 6.2, which lists the types of vehicles and the estimated number of trips made by each type.
Table 6.2: Estimated Cruise Traffic Trips
For emissions modeling purposes, as described below, the personal vehicles (including no-parks), rental cars, and taxis were modeled as passenger cars, the three types of shuttle were modeled as light duty truck/vans, buses were modeled as transit buses, and the “other/unknown” category was modeled as light duty truck/vans. The 105 Port-owned fleet vehicles for which information was provided traveled an estimated 370,597 miles in 2015, an average of 3,529 miles per vehicle.
Vehicle type Round trip
counts
Personal vehicle 67,985
Rental car/ride share 40,494
Taxi 163,153
Hotel shuttle 139,031
Off-port parking shuttle 13,498
Shuttle van 8,987
Bus 26,996
Other/unknown 18,897
Estimated total 2015 round trips 479,042
2015 Baseline Air Emissions Inventory
Port Everglades 63 December 2016
6.3 Emission Estimation Methodology In general, emissions from on-road vehicles are estimated using the general equation.
Equation 6.1
𝑬 = 𝑬𝑭 × 𝑨𝒄𝒕𝒊𝒗𝒊𝒕𝒚
Where:
E = mass of emissions per defined period (such as a year) EF = emission factor (mass per unit of distance or time) Activity = activity (distance driven, or time at idle, during the defined period)
Emissions are estimated by multiplying the emission factor by the distance driven or the amount of idling time. The units of distance in this inventory are miles; the idling units are hours, and the emission factors are expressed as grams of emissions per mile of travel (g/mile) or grams of emissions per hour of idling (g/hr). Annual emissions are expressed in short tons for the criteria pollutants and metric tons (tonnes) for greenhouse gases. The emission factors have been developed using the EPA model MOVES2014a, which estimates emissions and emission factors for on-road vehicles of all types. The MOVES2014a model is EPA’s latest iteration in a series of on-road vehicle emission estimating models. The model can be run in such a way as to produce emission estimates for different vehicle types in a given county, and the estimated total number of miles driven in the county. These model outputs are used to calculate g/mile and g/hr emission factors that are used to estimate driving and idling emissions from a particular type of vehicle such as the trucks serving the Port terminals and the automobiles transporting cruise passengers to and from the cruise terminals. The MOVES2014a model was run for Broward County using the model’s own data related to average road speeds and distribution of vehicle model years. The emission factors estimated for “urban unrestricted access” roads were used to estimate on-road emissions. These represent driving on surface streets in urban areas and are generally the highest of the road type options (which are urban and rural restricted and unrestricted access for a total of four options). On-site low-speed emissions were modeled at 15 miles per hour. The model’s design dictates that idling and speed-specific emissions are estimated for single hours rather than a one-year period, so the model was run for a January morning hour and a July afternoon hour to cover the range of typical temperature conditions, and the results of the two runs were averaged to estimate average hourly idling emissions. To take into account the seasonal nature of port traffic, the average for each type of vehicle was weighted to account for higher activity in winter months versus summer months. As noted above, the cruise terminal related vehicles were modeled as passenger cars, light duty truck/vans, and transit buses. The trucks were modeled as a weighted average of combination short-haul and combination long-haul trucks (weighted by the model’s internal VMT data).

2015 Baseline Air Emissions Inventory
Port Everglades 64 December 2016
Table 6.3 lists the emission factors used to estimate on-road emissions for the various vehicle types, while Table 6.4 presents the emission factors used for on-terminal emission estimates for heavy-duty trucks and for Port-owned fleet vehicles.
Table 6.3: Emission Factors for On-Road Vehicle Operations
Table 6.4: Emission Factors for On-Site (On-terminal) Vehicle Operations
Vehicle Type NOx PM10 PM2.5 DPM VOC CO SO2 CO2 N2O CH4
grams per mile
Passenger car 0.479 0.005 0.005 0.000 0.437 4.750 0.009 453 0.004 0.007
Light truck 0.730 0.012 0.011 0.007 0.398 5.894 0.011 545 0.006 0.011
Transit bus 8.775 0.310 0.285 0.310 0.728 3.512 0.012 1,392 0.003 0.031
Combination truck 8.212 0.497 0.457 0.497 0.535 2.499 0.019 2,158 0.003 0.050
Activity Type NOx PM10 PM2.5 DPM VOC CO SO2 CO2 N2O CH4
grams per mile or grams per hour
Diesel combination trucks
Short-term idle (g/hr) 50.25 4.31 3.96 4.31 6.36 16.69 0.066 8,450 0.000 0.519
On-terminal (g/mi) 11.35 0.74 0.68 0.74 0.83 3.56 0.022 2,691 0.000 0.081
Fleet vehicles on-terminal (g/mi)
Passenger car 0.591 0.010 0.009 0.000 0.300 6.436 0.011 585 0.000 0.010
Light truck, gasoline 0.782 0.010 0.009 0.000 0.349 8.097 0.013 684 0.000 0.015
Light truck, diesel 3.150 0.180 0.166 0.180 0.620 5.311 0.008 956 0.000 0.029

2015 Baseline Air Emissions Inventory
Port Everglades 65 December 2016
6.4 Emission Estimates The estimated emissions from heavy-duty trucks, cruise terminal-related vehicles, and Port-owned fleet vehicles are presented in Table 6.5. Since virtually all of the trucks involved with port-related transportation are diesel fueled, DPM is the same as PM10 for these vehicles. Almost all of the passenger cars and vans are gasoline powered so no DPM is reported for these vehicle categories.
Table 6.5: 2015 Estimated Emissions from Onroad Vehicles
Component NOx PM10 PM2.5 DPM VOC CO SO2 CO2e
of Operation tons tons tons tons tons tons tons tonnes
Heavy-Duty Trucks
Short-term idle 29.5 2.50 2.30 2.50 3.70 9.80 0.039 4,513
On-terminal 3.2 0.20 0.20 0.20 0.20 1.00 0.006 683
On-road 19.3 1.20 1.10 1.20 1.30 5.90 0.044 4,610
Subtotal 52.0 3.90 3.60 3.90 5.20 16.70 0.089 9,805
Cruise-Related Vehicles
Passenger car 0.39 0.004 0.004 0.000 0.35 3.84 0.007 333
Light truck/van 0.39 0.010 0.010 0.000 0.21 3.16 0.006 267
Transit bus 0.71 0.020 0.020 0.020 0.06 0.28 0.001 101
Subtotal 1.49 0.034 0.034 0.020 0.62 7.28 0.014 701
Port-Owned Fleet Vehicles
Passenger car 0.01 0.000 0.000 0.000 0.01 0.15 0.000 12
Light truck, gasoline 0.22 0.003 0.003 0.000 0.10 2.29 0.004 176
Light truck, diesel 0.32 0.018 0.017 0.018 0.06 0.54 0.001 89
Subtotal 0.56 0.021 0.020 0.018 0.17 2.98 0.005 277
Total 54.05 3.96 3.65 3.94 5.99 26.96 0.108 10,783

2015 Baseline Air Emissions Inventory
Port Everglades 66 December 2016
SECTION 7 RAIL LOCOMOTIVES This section presenting emissions estimates for the railroad locomotives source category is organized into following subsections: source description (7.1), data and information acquisition (7.2), emissions estimation methodology (7.3), and the locomotive emission estimates (7.4). 7.1 Source Description Rail service is provided to the Port by the Florida East Coast Railway (FECR) at the Intermodal Container Transfer Facility (ICTF) located in the southwestern portion of the Port. Opened in 2014, the ICTF is the starting point for international cargo destined for eastern U.S. markets by rail, and is the arrival point at the port for export cargo brought in from eastern U.S. origins. The facility also handles domestic cargo that arrives by rail for local delivery by truck or that is brought to the port by truck from local sources for rail shipment to eastern U.S. markets. The ICTF has 9,000 feet of processing track for building trains, 12,000 feet of storage track, and three rubber-tired gantry cranes (RTGs) for loading and unloading railcars.30 FECR moves cargo between the Port and Jacksonville, FL where the railroad connects with CSX and Norfolk Southern, the railroad companies that service the eastern part of the U.S. 7.2 Data and Information Acquisition FECR provided information on their locomotives and on typical operating characteristics within the port. The locomotives operated by FECR are 4,400 horsepower diesel locomotives meeting Tier 3 emission requirements and equipped with idling shutoff devices. They are used in sets of two to move trains between the Port and Jacksonville. The schedule is one northbound train and two southbound trains per day, each train remaining on port from four to six hours. The Port provided container throughput information in terms of in-bound and outbound international and domestic containers on a monthly basis. A total of 53,202 international and 37,868 domestic containers were moved by rail through the ICTF in 2015, a total of 91,070 containers.
30 ICTF information from: www.porteverglades.net/expansion/ship-to-rail/
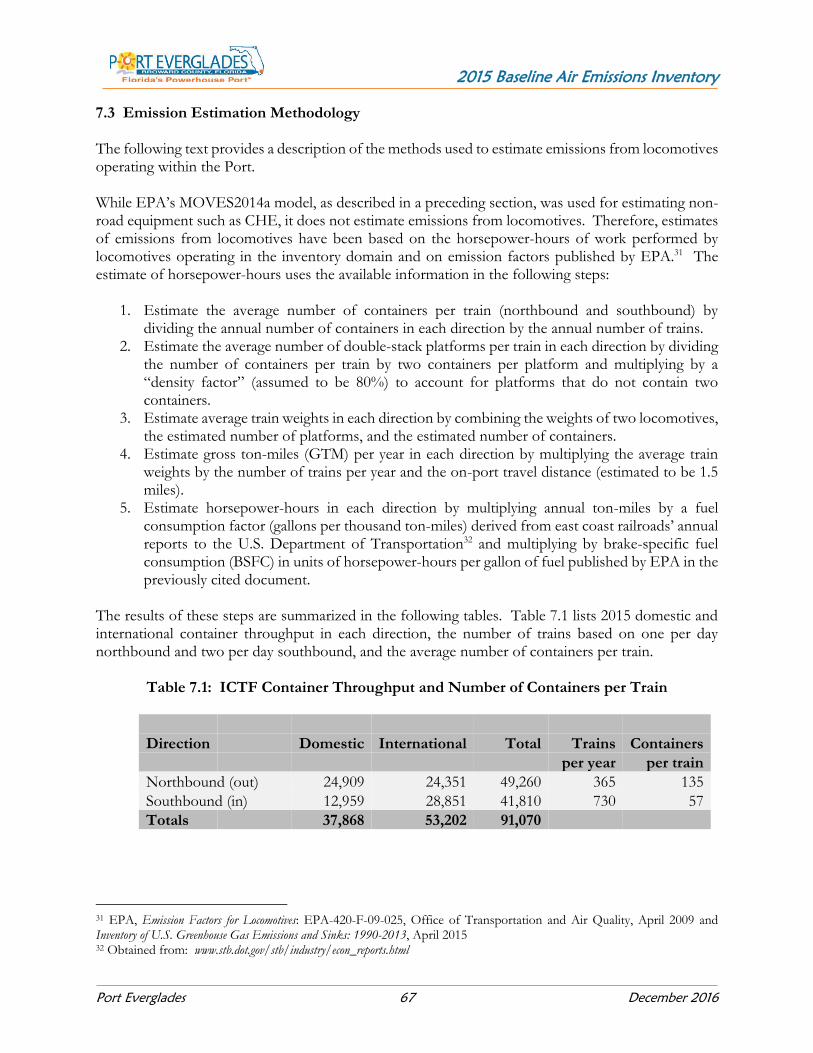
2015 Baseline Air Emissions Inventory
Port Everglades 67 December 2016
7.3 Emission Estimation Methodology The following text provides a description of the methods used to estimate emissions from locomotives operating within the Port. While EPA’s MOVES2014a model, as described in a preceding section, was used for estimating non-road equipment such as CHE, it does not estimate emissions from locomotives. Therefore, estimates of emissions from locomotives have been based on the horsepower-hours of work performed by locomotives operating in the inventory domain and on emission factors published by EPA.31 The estimate of horsepower-hours uses the available information in the following steps:
1. Estimate the average number of containers per train (northbound and southbound) by dividing the annual number of containers in each direction by the annual number of trains.
2. Estimate the average number of double-stack platforms per train in each direction by dividing the number of containers per train by two containers per platform and multiplying by a “density factor” (assumed to be 80%) to account for platforms that do not contain two containers.
3. Estimate average train weights in each direction by combining the weights of two locomotives, the estimated number of platforms, and the estimated number of containers.
4. Estimate gross ton-miles (GTM) per year in each direction by multiplying the average train weights by the number of trains per year and the on-port travel distance (estimated to be 1.5 miles).
5. Estimate horsepower-hours in each direction by multiplying annual ton-miles by a fuel consumption factor (gallons per thousand ton-miles) derived from east coast railroads’ annual reports to the U.S. Department of Transportation32 and multiplying by brake-specific fuel consumption (BSFC) in units of horsepower-hours per gallon of fuel published by EPA in the previously cited document.
The results of these steps are summarized in the following tables. Table 7.1 lists 2015 domestic and international container throughput in each direction, the number of trains based on one per day northbound and two per day southbound, and the average number of containers per train.
Table 7.1: ICTF Container Throughput and Number of Containers per Train
Direction Domestic International Total Trains Containers
per year per train
Northbound (out) 24,909 24,351 49,260 365 135
Southbound (in) 12,959 28,851 41,810 730 57
Totals 37,868 53,202 91,070
31 EPA, Emission Factors for Locomotives: EPA-420-F-09-025, Office of Transportation and Air Quality, April 2009 and Inventory of U.S. Greenhouse Gas Emissions and Sinks: 1990-2013, April 2015 32 Obtained from: www.stb.dot.gov/stb/industry/econ_reports.html
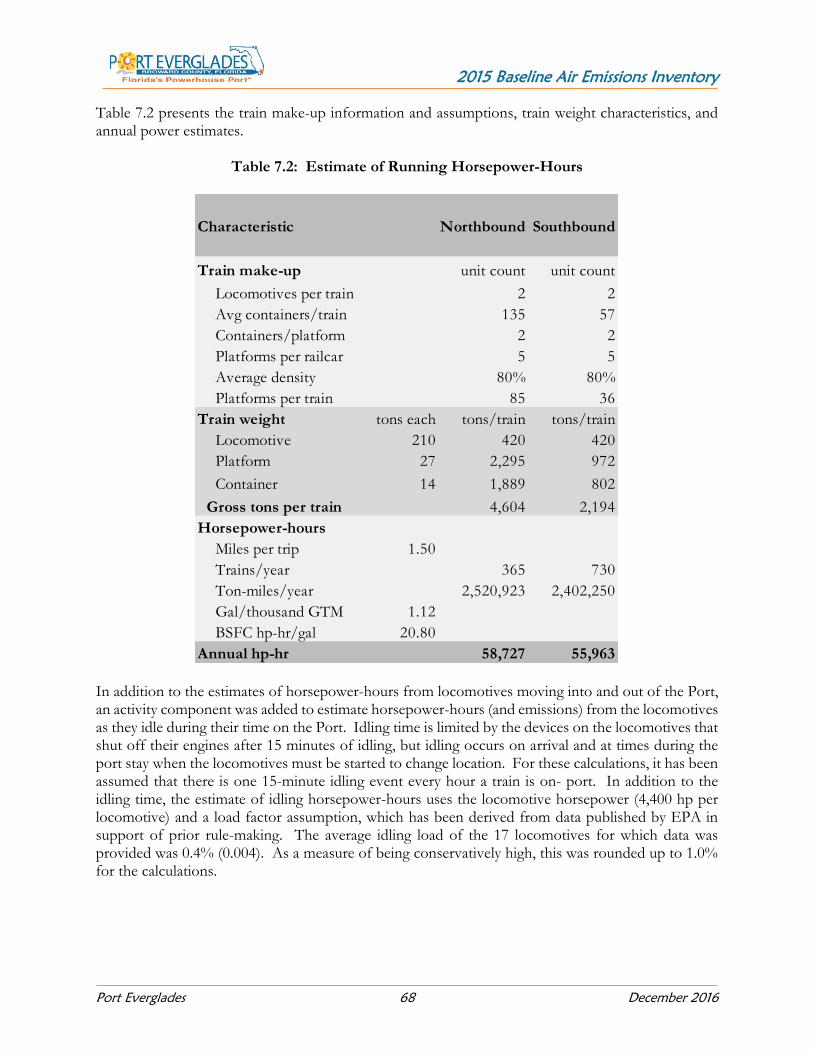
2015 Baseline Air Emissions Inventory
Port Everglades 68 December 2016
Table 7.2 presents the train make-up information and assumptions, train weight characteristics, and annual power estimates.
Table 7.2: Estimate of Running Horsepower-Hours
In addition to the estimates of horsepower-hours from locomotives moving into and out of the Port, an activity component was added to estimate horsepower-hours (and emissions) from the locomotives as they idle during their time on the Port. Idling time is limited by the devices on the locomotives that shut off their engines after 15 minutes of idling, but idling occurs on arrival and at times during the port stay when the locomotives must be started to change location. For these calculations, it has been assumed that there is one 15-minute idling event every hour a train is on- port. In addition to the idling time, the estimate of idling horsepower-hours uses the locomotive horsepower (4,400 hp per locomotive) and a load factor assumption, which has been derived from data published by EPA in support of prior rule-making. The average idling load of the 17 locomotives for which data was provided was 0.4% (0.004). As a measure of being conservatively high, this was rounded up to 1.0% for the calculations.
Characteristic Northbound Southbound
Train make-up unit count unit count
Locomotives per train 2 2
Avg containers/train 135 57
Containers/platform 2 2
Platforms per railcar 5 5
Average density 80% 80%
Platforms per train 85 36
Train weight tons each tons/train tons/train
Locomotive 210 420 420
Platform 27 2,295 972
Container 14 1,889 802
Gross tons per train 4,604 2,194
Horsepower-hours
Miles per trip 1.50
Trains/year 365 730
Ton-miles/year 2,520,923 2,402,250
Gal/thousand GTM 1.12
BSFC hp-hr/gal 20.80
Annual hp-hr 58,727 55,963
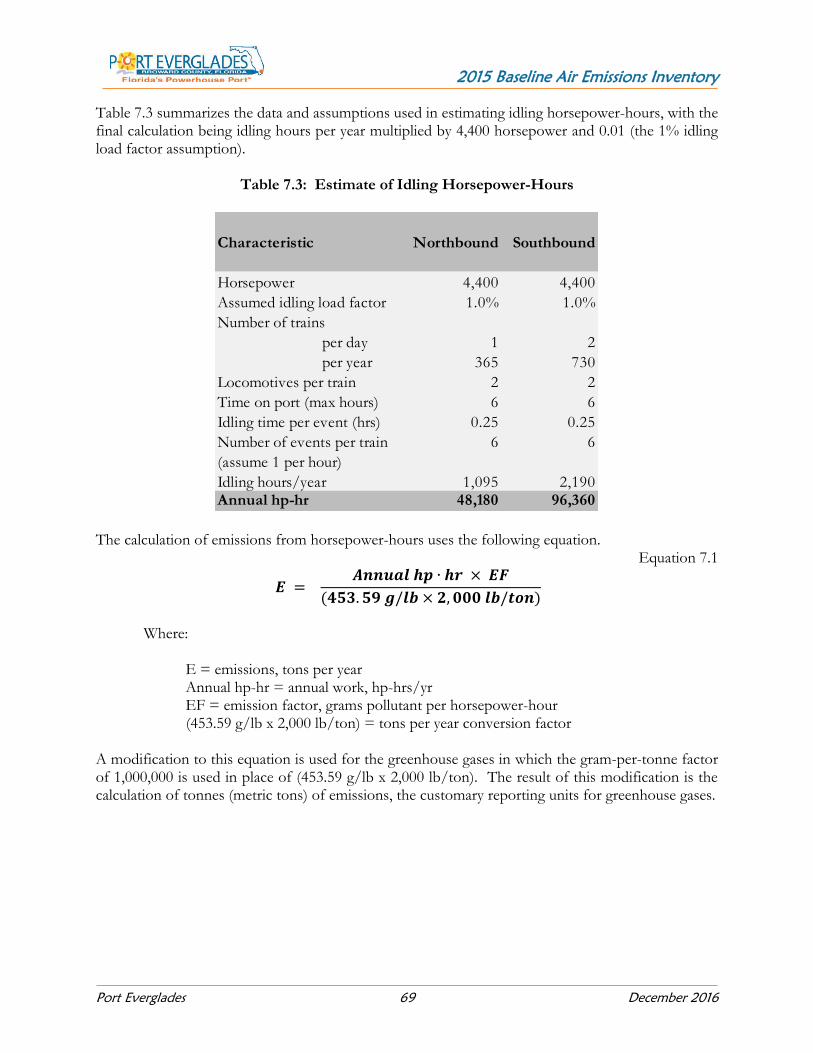
2015 Baseline Air Emissions Inventory
Port Everglades 69 December 2016
Table 7.3 summarizes the data and assumptions used in estimating idling horsepower-hours, with the final calculation being idling hours per year multiplied by 4,400 horsepower and 0.01 (the 1% idling load factor assumption).
Table 7.3: Estimate of Idling Horsepower-Hours
The calculation of emissions from horsepower-hours uses the following equation.
Equation 7.1
𝑬 = 𝑨𝒏𝒏𝒖𝒂𝒍 𝒉𝒑 ∙ 𝒉𝒓 × 𝑬𝑭
(𝟒𝟓𝟑. 𝟓𝟗 𝒈/𝒍𝒃 × 𝟐, 𝟎𝟎𝟎 𝒍𝒃/𝒕𝒐𝒏)
Where:
E = emissions, tons per year Annual hp-hr = annual work, hp-hrs/yr EF = emission factor, grams pollutant per horsepower-hour (453.59 g/lb x 2,000 lb/ton) = tons per year conversion factor
A modification to this equation is used for the greenhouse gases in which the gram-per-tonne factor of 1,000,000 is used in place of (453.59 g/lb x 2,000 lb/ton). The result of this modification is the calculation of tonnes (metric tons) of emissions, the customary reporting units for greenhouse gases.
Characteristic Northbound Southbound
Horsepower 4,400 4,400
Assumed idling load factor 1.0% 1.0%
Number of trains
per day 1 2
per year 365 730
Locomotives per train 2 2
Time on port (max hours) 6 6
Idling time per event (hrs) 0.25 0.25
Number of events per train 6 6
(assume 1 per hour)
Idling hours/year 1,095 2,190Annual hp-hr 48,180 96,360

2015 Baseline Air Emissions Inventory
Port Everglades 70 December 2016
The EPA emission factors for line haul locomotives cover particulate, NOx, CO, and HC emissions, published as g/gal factors and converted to g/hp-hr using the BSFC value for line haul noted above. SOx emission factors have been developed to reflect the use of 15 ppm ULSD using a simplified mass balance approach. This approach assumes that all of the sulfur in the fuel is converted to SO2 and emitted during the combustion process. While the mass balance approach calculates SO2 specifically, it is a reasonable approximation of SOx. The following example shows the calculation of the SOx emission factor.
Equation 7.2
𝟏𝟓 𝒈 𝑺
𝟏, 𝟎𝟎𝟎, 𝟎𝟎𝟎 𝒈 𝒇𝒖𝒆𝒍 ×
𝟑, 𝟐𝟎𝟎 𝒈 𝒇𝒖𝒆𝒍
𝒈𝒂𝒍 𝒇𝒖𝒆𝒍 ×
𝟐 𝒈 𝑺𝑶𝟐
𝒈 𝑺 ×
𝒈𝒂𝒍 𝒇𝒖𝒆𝒍
𝟐𝟎. 𝟖 𝒉𝒑 𝒉𝒓 = 𝟎. 𝟎𝟎𝟓 𝒈 𝑺𝑶𝟐/𝒉𝒑𝒉𝒓
In this calculation, 15 ppm S is written as 15 g S per million g of fuel. The value of 20.8 hp-hr/gallon of fuel is the average brake specific fuel consumption (BSFC) noted in EPA’s technical literature on locomotive emission factors (EPA, 2009). Two grams of SO2 is emitted for each gram of sulfur in the fuel because the atomic weight of sulfur is 32 while the molecular weight of SO2 is 64, meaning that the mass of SO2 is two times that of sulfur. Greenhouse gas emission factors from EPA references33 have been used to estimate emissions of the greenhouse gases CO2, CH4, and N2O from locomotives. Additionally, all particulate emissions are assumed to be PM10 and DPM. PM2.5 emissions have been estimated as 92% of PM10 emissions to be consistent with the PM2.5 ratio used by MOVES in estimating PM2.5 emissions from other types of nonroad engines. Table 7.4 lists the emission factors, as g/hphr, used in calculating locomotive emissions. The emission factors in the row labelled “TIER 2+ & TIER 3” have been used to estimate emissions from the Tier 3 locomotives used by FECR. The hydrocarbon (HC) emission factor was converted to VOC using an EPA-published conversion factor of 1.053.34
Table 7.4: EPA Tier Level Emission Factors for Locomotives
33 EPA, Inventory of U.S. Greenhouse Gas Emissions and Sinks: 1990-2013, April 2015 34 Conversion Factors for Hydrocarbon Emission Components. EPA-420-R-10-015 NR-002d July 2010
Tier Level PM10 HC NOx CO
g/hp-hr g/hp-hr g/hp-hr g/hp-hr
Uncontrolled 0.32 0.48 13 1.28
Tier 0 0.32 0.48 8.6 1.28
Tier 0+ 0.2 0.3 7.2 1.28
Tier 1 0.32 0.47 6.7 1.28
Tier 1+ 0.2 0.29 6.7 1.28
Tier 2 0.18 0.26 4.95 1.28
Tier 2+ & Tier 3 0.08 0.13 4.95 1.28
Tier 4 0.015 0.04 1.00 1.28

2015 Baseline Air Emissions Inventory
Port Everglades 71 December 2016
Table 7.5 lists emission factors used for all pollutants, in grams per horsepower hour.
Table 7.5: Summary of Locomotive Emission Factors
7.4 Emission Estimates The estimated running and idling emissions are presented in Table 7.6. Since locomotives are diesel fueled, DPM is the same as PM10. With rounding, the PM2.5 is also the same as PM10.
Table 7.6: 2015 Estimated Emissions from Locomotives
Units NOx PM10 PM2.5 DPM VOC CO SO2 CO2 N2O CH4
g/hp-hr 4.95 0.08 0.07 0.08 0.14 1.28 0.005 494 0.013 0.040
Activity NOx PM10 PM2.5 DPM VOC CO SO2 CO2e
Component tons tons tons tons tons tons tons tonnes
Running 0.63 0.01 0.01 0.01 0.02 0.16 0.0006 57
Idling 0.79 0.01 0.01 0.01 0.02 0.20 0.0008 79
Total 1.42 0.02 0.02 0.02 0.04 0.36 0.0014 136

2015 Baseline Air Emissions Inventory
Port Everglades 72 December 2016
SECTION 8 ELECTRICAL POWER CONSUMPTION This section presenting emissions estimates for the electrical power consumption is organized into following subsections: source description (8.1), data and information acquisition (8.2), emissions estimation methodology (8.3), and the electrical power consumption emission estimates (8.4). 8.1 Source Description For this study, the electrical power consumption from public and private facilities was collected to calculate greenhouse gas emissions for this source. The electrical power consumption is a measure of electricity generated for buildings and facilities that is used to light the buildings, provide outdoor lighting, and to power air conditioners and computers. 8.2 Data and Information Acquisition Data was requested from private terminals, such as the petroleum facilities, and from Port Everglades. The electricity consumption, in kW-hrs, was provided for both the public and private terminals. The data provided was actual electricity usage from the electricity bills for the year 2015. A few facilities did not provide electricity consumption. An average was included for the facilities that were not able to provide data prior to summing up the total electricity consumption. The amount of refrigerant used to cool buildings or the fuel used by stationary generators was also part of data collection. Since this was the first time producing an inventory, and data related to the amount of refrigerant used per year or fuel consumed by mobile and stationary sources operated by the port for administrative duties was not easily available. Therefore, the emissions from these sources are not quantified for this study due to data not being readily available for the 2015 calendar year. 8.3 Emission Estimation Methodology GHG emissions from energy usage were estimated using the following general equation.
Equation 8.1 𝑬 = 𝑬𝑭 × 𝑨𝒄𝒕𝒊𝒗𝒊𝒕𝒚
Where:
E = mass of emissions per defined period (such as a year), metric tons (tonnes) EF = emission factor (mass per unit of energy produced), g/MWhr Activity = activity, measured in energy consumption, MWhr
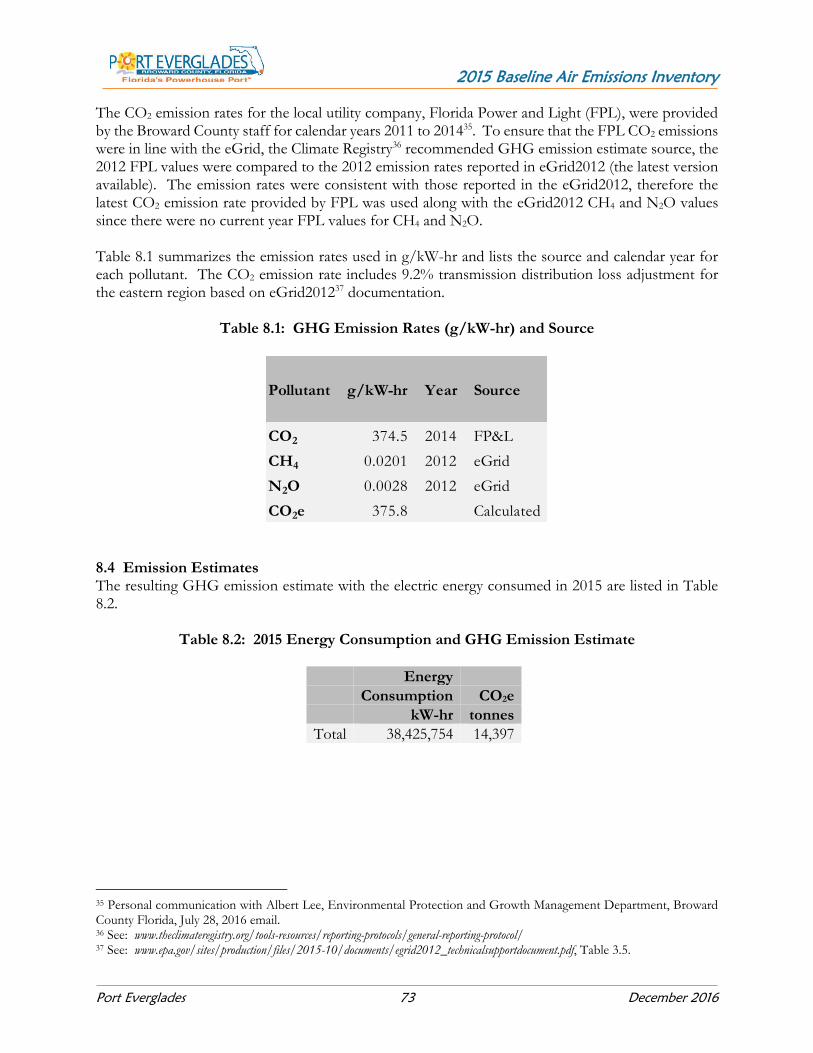
2015 Baseline Air Emissions Inventory
Port Everglades 73 December 2016
The CO2 emission rates for the local utility company, Florida Power and Light (FPL), were provided by the Broward County staff for calendar years 2011 to 201435. To ensure that the FPL CO2 emissions were in line with the eGrid, the Climate Registry36 recommended GHG emission estimate source, the 2012 FPL values were compared to the 2012 emission rates reported in eGrid2012 (the latest version available). The emission rates were consistent with those reported in the eGrid2012, therefore the latest CO2 emission rate provided by FPL was used along with the eGrid2012 CH4 and N2O values since there were no current year FPL values for CH4 and N2O. Table 8.1 summarizes the emission rates used in g/kW-hr and lists the source and calendar year for each pollutant. The CO2 emission rate includes 9.2% transmission distribution loss adjustment for the eastern region based on eGrid201237 documentation.
Table 8.1: GHG Emission Rates (g/kW-hr) and Source
8.4 Emission Estimates The resulting GHG emission estimate with the electric energy consumed in 2015 are listed in Table 8.2.
Table 8.2: 2015 Energy Consumption and GHG Emission Estimate
Energy Consumption CO2e
kW-hr tonnes
Total 38,425,754 14,397
35 Personal communication with Albert Lee, Environmental Protection and Growth Management Department, Broward County Florida, July 28, 2016 email. 36 See: www.theclimateregistry.org/tools-resources/reporting-protocols/general-reporting-protocol/ 37 See: www.epa.gov/sites/production/files/2015-10/documents/egrid2012_technicalsupportdocument.pdf, Table 3.5.
Pollutant g/kW-hr Year Source
CO2 374.5 2014 FP&L
CH4 0.0201 2012 eGrid
N2O 0.0028 2012 eGrid
CO2e 375.8 Calculated

2015 Baseline Air Emissions Inventory
Port Everglades December 2016
APPENDIX A – TRANSIT EMISSIONS

2015 Baseline Air Emissions Inventory
Port Everglades A-1 December 2016
Emissions from domestic transitory marine traffic through the Atlantic Intracoastal Waterway (ICW) are included in this appendix. As part of the scope for the project, the Port requested that the impact from other commercial marine traffic in the ICW be identified. Recreational vessels and private yachts were not part of the scope and thus not included in this report. In 2015, there were 91 activities for transitory towboats that traveled through the study area, but did not call at the Port. The same emission calculation methodology discuss in Section 4.3 was used to estimate the transitory towboat emissions. The transitory towboat emissions are listed in Table A.1.
Table A.1: 2015 Transitory Towboat Emissions
Vessel type NOx PM10 PM2.5 DPM VOC CO SO2 CO2e
tons tons tons tons tons tons tons tonnes
Towboat 71 2.45 2.25 2.45 2.92 26.60 0.04 4,045

2015 Baseline Air Emissions Inventory
Port Everglades December 2016
APPENDIX B - GLOSSARY

2015 Baseline Air Emissions Inventory
Port Everglades B-1 December 2016
Air toxics– Toxic air pollutants, also known as hazardous air pollutants, are those pollutants that are known or suspected to cause cancer or other serious, chronic health effects, such as reproductive effects or birth defects, or adverse environmental effects. Auxiliary engine – A small engine often used when a ship is in-transit, maneuvering, or hotelling. Baseline Air Emissions Inventory – For a given air emission source category, a baseline inventory establishes a reference point with more detailed emission data than previously existed. An established baseline allows comparison with future inventories of similar precision to describe changes to the characteristics of the source category and intensity of the emissions. Brake Specific Fuel Consumption – A way to measure the efficiency of an engine by dividing rate of fuel consumption by the rate of power production. Cargo Handling Equipment (CHE) – Equipment used to move cargo to and from marine vessels, railcars and trucks. This includes equipment such as cranes, rubber tired gantry cranes, terminal trucks, container handlers, bulk loaders, and forklifts. Criteria pollutants – A regulatory term that refers specifically to six outdoor air pollutants for which EPA is required to develop National Ambient Air Quality Standards (NAAQS), as codified in the federal Clean Air Act. These six are carbon monoxide (CO), lead, nitrogen dioxide (NO2), particulate matter (PMx), ozone, and sulfur oxides (SOx). Deterioration factor – For use in emission or performance calculation, this number accounts for the effect of gradual wear in the internal engine components during normal operation. Diesel – In standard use, this refers to a specific fractional distillate of fuel oil that is used as fuel in a combustion-ignition (CI) engine. Practically, diesel can refer generally to any hydrocarbon-dense oil with relatively low volatility that can be used as a combustion fuel. In common maritime use, diesel can refer to several varieties of distillate fuels including “Marine Diesel Oil” (MDO, aka DMB or DMC) and “Marine Gas Oil” (MGO, aka DMA or DMX) as specified by ISO 8217. Diesel can also be referred to by its sulfur content, such as the case of LSD (low sulfur diesel with less than 500 ppm sulfur) or ULSD (ultra-low sulfur diesel with less than 15 ppm sulfur). Diesel electric – Refers to equipment that uses electric motive systems that rely on electricity from diesel generators. Diesel Particulate Matter (DPM) – Refers to particulate components of combustion products that are directly emitted from diesel engines. These include soot (“elemental” or “black” carbon) and other aerosols that are complex aggregates of hydrocarbons, metals, silicates, and other chemicals. In recent years, exposure to diesel DPM has been singled out as posing a likely carcinogenic risk. The International Agency for Research on Cancer (IARC) has designated diesel engine emissions as carcinogenic to humans. This risk is of greatest concern to people who regularly work in proximity to diesel equipment over the course of many years. Emission factor– A number specific to an engine or system that describes the amount of a pollutant that is generated per unit of activity, e.g. mg/mile or g/hr.
2015 Baseline Air Emissions Inventory
Port Everglades B-2 December 2016
Fuel correction factor (FCF) – A number used in emission inventory models to reflect the impact on emissions of commercially dispensed fuel compared to fuel used during the certification process. These factors are derived as the ratio of the impact of the dispensed fuel to the impact of the certification fuel. Fuel Oil – A general term for viscous liquid fuels used for powering engines. In the maritime industry the following classifications are used.
MGO (Marine gas oil) – A purely distillate fuel (see “diesel”)
MDO (Marine diesel oil) – A blend of gas oil and heavy fuel oil
IFO (Intermediate fuel oil) – A blend of gas oil and heavy fuel oil, with less gas oil than marine diesel oil
MFO (Medium fuel oil) – A blend of gas oil and heavy fuel oil, with less gas oil than intermediate fuel oil
HFO (Heavy fuel oil) – Pure or nearly pure residual oil (bunker fuel) Greenhouse Gas – Substances in the atmosphere that absorb radiated heat form the earth’s surface and also radiate heat back to the surface, causing a net retention of heat energy. Carbon dioxide, methane, and nitrous oxide are common examples. Harbor craft – A term that generally refers to vessels that do not make regular ocean passage. These include fishing boats, tug boats, ferries, and other commercial workboats. For the purpose of this report, any craft that is not an ocean-going vessel, recreational vessel, or tank barge, has been categorized as a harbor craft. Heavy-duty vehicle – A class 8 truck fueled by diesel and has a gross vehicle weight of 33,001 lbs or higher. Hotelling – The period during which a vessel is secured at berth. Hydrocarbon – A chemical term referring to compounds that consists of carbon and hydrogen in various structures. Most common liquid fuels are primarily comprised of some form of hydrocarbon. Intermediate fuel oil (IFO) – See Fuel Oil Intermodal Container Transfer Facility – A rail yard that is located close to a port facility and is where a cargo transition between two different transportation modes (e.g. trucks, trains, or ships) occurs. Light duty vehicle (LDV) – Class 1 and 2 vehicles that can use gas or diesel fuel and have a gross vehicle weight of 6,000 lbs or less (class 1) or between 6,001 and 10,000 lbs (class 2). Load Factor (LF) – A ratio of an engine’s average actual power used to its maximum power rating.

2015 Baseline Air Emissions Inventory
Port Everglades B-3 December 2016
Main propulsion engine – The engines on a vessel that are dedicated to movement of a ship over long distances. Marine Diesel Oil (MDO) – See “Fuel Oil” Maximum continuous rating – A value assigned to a piece of equipment by its manufacturer that sets a guideline for which the equipment can be operated for an unlimited period of time without damage. Mobile Source – emissions from motor vehicles, airplanes, locomotives, vessels, harbor craft, cargo handling equipment and any other equipment that can be moved from one location to another. Ocean-going vessel (OGV) – Vessels that operate in open oceanic waters. Nonpoint source – Any source of pollution that does not meet the definition of point source. Particulate Matter (PM) – A general term for any substance, except pure water, that exists as a liquid or solid in the atmosphere under normal conditions and is of microscopic or sub-microscopic size but larger than molecular dimensions. Airborne PM can result from direct emissions of particles (primary PM) or from condensation of certain gases that have themselves been directly emitted or chemically transformed in the atmosphere (secondary PM). PM is often classified by size:
PM2.5 – Also known as “fine” particulate matter, PM2.5 refers to the fraction of PM in a sample that is 2.5 microns in diameter or less. This size of PM is commonly associated with combustion and secondary PM.
PM10 – Also known as “coarse” particulate matter, PM10 refers to the fraction of PM in a sample that is 10 microns in diameter or less.
Point source – A single, stationary point source of emissions that is immoveable for all practical purposes. Residual oil – “Residual Fuel Oil” or “Bunker Fuel” – See “Fuel Oil” Roll-on/Roll-off (RoRo) – A vessel featuring a built-in ramp for wheeled cargo to be ‘rolled-on’ and ‘rolled-off” of the vessel. Rubber Tired Gantry (RTG) Crane – A common piece of cargo handling equipment at marine terminals used to transfer containers from stacked storage to a vehicle. Selective Catalytic Reduction (SCR) – A process where a gaseous or liquid reductant (most commonly ammonia or urea) is added to the flue or exhaust gas stream and absorbed onto a catalyst. The reductant reacts with NOx in the exhaust gas to form H2O (water vapor) and N2 (nitrogen gas). Stationary source – large, fixed sources of air pollution and include power plants, refineries and factories. Stationary sources include both point and nonpoint sources.
2015 Baseline Air Emissions Inventory
Port Everglades B-4 December 2016
Switching locomotive – A locomotive that is used exclusively in a facility where rail cars are organized and assembled into trains. Twenty-foot Equivalent Unit (TEU) – A measure used for containerized cargo. One TEU is equivalent to one standard cargo container measured 20’ x 8’ x 8’6”. Two-stroke engines – A type of internal combustion engine that completes the same four processes as a four-stroke engine (intake, compression, power, and exhaust) in only two strokes of the piston rather than four. This is accomplished by using the space below the piston for air intake and compression, thus allowing the chamber above the piston to be used for just the power and exhaust strokes. This results in a power stroke with every revolution of the crank, instead of every second revolution as in a four-stroke engine. For this reason, two-stroke engines provide high specific power, so they are valued for use in portable, lightweight applications. Two stoke diesel engines are common in large marine vessels. Ultra-Low Sulfur Diesel (ULSD) – See “diesel” Volatile Organic Compound (VOC) – A very broad term used to describe the entire set of vapor-phase atmospheric organic chemicals except CO and CO2.