portfolio budget statements 2015-16 budget related...
TRANSCRIPT
Portfolio Budget Statements 2015-16 Budget Related Paper No. 1.9
Foreign Affairs and Trade Portfolio
Budget Initiatives and Explanations of Appropriations Specified by Outcomes
and Programmes by Entity

ii
© Commonwealth of Australia 2015
Printed Version: ISBN 978-1-74322-223-2
PDF Version: ISBN 978-1-74322-224-9
This publication is available for your use under a Creative Commons BY Attribution
3.0 Australia licence, with the exception of the Commonwealth Coat of Arms, the
Department of Foreign Affairs and Trade logo, photographs, images, signatures and
where otherwise stated. The full licence terms are available from http://creativecommons.org/licenses/by/3.0/au/legalcode.
Use of Foreign Affairs and Trade Portfolio material under a Creative Commons BY
Attribution 3.0 Australia licence requires you to attribute the work (but not in any way
that suggests that the Foreign Affairs and Trade Portfolio endorses you or your use of
the work).
Foreign Affairs and Trade Portfolio material used 'as supplied'
Provided you have not modified or transformed Foreign Affairs and Trade Portfolio
material in any way including, for example, by changing the Foreign Affairs and Trade
Portfolio text; calculating percentage changes; graphing or charting data; or deriving
new statistics from published Foreign Affairs and Trade Portfolio statistics – then
Foreign Affairs and Trade Portfolio prefers the following attribution:
Source: The Australian Government Foreign Affairs and Trade Portfolio
Derivative material
If you have modified or transformed Foreign Affairs and Trade Portfolio material, or
derived new material from those of the Foreign Affairs and Trade Portfolio in any way,
then the Foreign Affairs and Trade Portfolio prefers the following attribution:
Based on The Australian Government Foreign Affairs and Trade Portfolio data
Use of the Coat of Arms
The terms under which the Coat of Arms can be used are set out on the It’s an Honour
website (see www.itsanhonour.gov.au).

MINISTER FOR FOREIGN AFFAIRS
MINISTER FOR TRADE AND INVESTMENT PARLIAMENT HOUSE
CANBERRA 2600
President of the Senate
Australian Senate
Parliament House
CANBERRA ACT 2600
Speaker
House of Representatives
Parliament House
CANBERRA ACT 2600
Dear Mr President
Dear Madam Speaker
We hereby submit Portfolio Budget Statements in support of the 2015-16 Budget for
the Foreign Affairs and Trade portfolio.
These statements have been developed, and are submitted to the Parliament, as a
statement on the outcomes for the portfolio.
We present these statements to provide accountability to the Parliament and, through
it, the public.
Yours sincerely
The Hon Julie Bishop MP The Hon Andrew Robb AO MP
Minister for Foreign Affairs Minister for Trade and Investment

iv
Abbreviations and conventions
The following notation may be used:
NEC/nec not elsewhere classified
- nil
.. not zero, but rounded to zero
na not applicable (unless otherwise specified)
nfp not for publication
$m $ million
$b $ billion
Figures in tables and in the text may be rounded. Figures in text are generally rounded
to one decimal place, whereas figures in tables are generally rounded to the nearest
thousand. Discrepancies in tables between totals and sums of components are due to
rounding.
Enquiries
Should you have any enquiries regarding this publication please contact
Mr Paul Wood, Chief Finance Officer, Department of Foreign Affairs and Trade
on (02) 6261 1111.
A copy of this document can be located on the Australian Government Budget website
at: www.budget.gov.au.

USER GUIDE TO THE
PORTFOLIO BUDGET STATEMENTS

vi
USER GUIDE
The purpose of the 2015-16 Portfolio Budget Statements (PB Statements) is to inform
Senators and Members of Parliament of the proposed allocation of resources to
government outcomes by entities within the portfolio. Entities receive resources from
the annual appropriations acts, special appropriations (including standing
appropriations and special accounts), and revenue from other sources.
A key role of the PB Statements is to facilitate the understanding of proposed annual
appropriations in Appropriation Bills (No. 1 and No. 2) 2015-16 (or Appropriation
(Parliamentary Departments) Bill (No. 1) 2015-16 for the parliamentary departments). In
this sense the PB Statements are Budget related papers and are declared by the
Appropriation Acts to be ‘relevant documents’ to the interpretation of the Acts
according to section 15AB of the Acts Interpretation Act 1901.
The PB Statements provide information, explanation and justification to enable
Parliament to understand the purpose of each outcome proposed in the Bills.
As required under section 12 of the Charter of Budget Honesty Act 1998, non-general
government sector entities are not consolidated into the Commonwealth general
government sector fiscal estimates and accordingly, these entities are not reported in
the PB Statements.

vii
CONTENTS
Portfolio overview ......................................................................................................... 1
Foreign Affairs and Trade portfolio overview .................................................................. 3
Entity resources and planned performance ............................................................... 9
Department of Foreign Affairs and Trade (DFAT) ......................................................... 11
Australian Trade Commission (Austrade) ..................................................................... 79
Australian Centre for International Agricultural Research (ACIAR) ............................ 121
Australian Secret Intelligence Service (ASIS) ............................................................. 147
Tourism Australia ........................................................................................................ 165
Glossary ..................................................................................................................... 191


PORTFOLIO OVERVIEW


3
FOREIGN AFFAIRS AND TRADE PORTFOLIO OVERVIEW
Ministers and portfolio responsibilities
The portfolio ministers are the Minister for Foreign Affairs, the Hon Julie Bishop MP,
and the Minister for Trade and Investment, the Hon Andrew Robb AO MP. They are
supported by the Parliamentary Secretary to the Minister for Foreign Affairs and the
Minister for Trade and Investment, the Hon Steven Ciobo MP.
The portfolio consists of the Department of Foreign Affairs and Trade (DFAT), the
Australian Trade Commission (Austrade), Tourism Australia, the Export Finance and
Insurance Corporation (EFIC), the Australian Centre for International Agricultural
Research (ACIAR) and the Australian Secret Intelligence Service (ASIS).
DFAT’s purpose is to help make Australia stronger, safer and more prosperous by
promoting and protecting our interests internationally and contributing to global
stability and economic growth, particularly in the Indo-Pacific region.
The department leads the Government’s efforts to shape the regional and international
environment and strengthen global cooperation in ways that advance Australia’s
interests. It advances Australia’s security interests internationally and works to open
up new markets and create conditions for increased trade and investment to
strengthen Australia’s economy and create jobs. Strengthening Australia’s key regional
partnerships is a priority for the department.
The Government’s economic diplomacy agenda – led by DFAT with support from
Austrade, Tourism Australia, EFIC and ACIAR – is key to advancing Australia’s
prosperity. DFAT will support the implementation of the new free trade agreements
with the Republic of Korea, Japan and China and other existing agreements. The
department will negotiate other priority bilateral and regional trade agreements, and
step up efforts to make progress in plurilateral and multilateral trade negotiations.
As an open trading economy, Australia’s economic success is closely tied to the
transparency and openness of international markets. DFAT, working with Austrade,
will focus on expanding access to markets for Australian exporters and lowering the
cost of doing business into Australia. DFAT will also encourage two-way flows of
investment that are in the national interest and help to ensure trade and investment
reform is tied to the broader domestic economic policy agenda.
Australia’s aid program will acknowledge the different development trajectories
across the region. It will maintain a strong commitment to development in the Pacific
and focus on building economic partnerships in growing Asia. DFAT will strengthen

Portfolio overview
4
the aid program’s engagement with the private sector and its promotion of the
empowerment of women and girls. The innovationXchange, based in DFAT, will aim to
significantly increase innovation in the delivery of the aid program, to be more cost-
effective, have greater impact, and to leverage additional development finance in the
region.
By supporting Australian undergraduates to study and undertake internships in the
region, the New Colombo Plan will continue to increase knowledge of the Indo-Pacific
in Australia and strengthen people to people links. In 2015-16, the program will
expand, offering more opportunities for young Australian students.
With more Australians travelling overseas than ever before, DFAT will continue to
provide high quality consular services, responsive travel advice and a secure and
efficient passport service. The department will implement a new Consular Strategy,
which will change consular policy and practices to respond to current demands while
maintaining Australia’s consular service at the forefront of world’s best practice.
Austrade will also deliver consular and passport services in specific locations overseas.
The effectiveness and security of Australia’s network of overseas diplomatic missions
will remain a high priority. The department will continue to maintain and protect
Australia’s secure government communications system. DFAT will provide high-
quality protocol services to diplomatic and consular missions and international
organisations accredited to Australia.
Austrade will contribute to Australia’s economic prosperity by promoting Australia’s
international trade, investment and education interests, and providing advice to
Government on tourism policy. Austrade has a particular focus on growth and
emerging markets, including those in Asia that offer commercial potential, and
provide opportunities aligned with Australia’s comparative advantage. Within these
markets there is a clear role for Austrade, as a government agency, to support
Australian businesses and education institutions. Austrade will also promote the
opportunities created by the three recently-concluded free trade agreements with the
Republic of Korea, Japan and China.
Austrade will partner with state and territory governments and other Commonwealth
Government agencies to attract productive foreign direct investment in priority sectors
from established and other emerging markets. Austrade will also promote Australia as
a preferred education destination and provider of education services, and continue to
administer several grant programs.
Austrade will also implement the Government’s tourism policy, Tourism 2020, working
on tourism policy, projects, programs and research to strengthen Australia's tourism
industry, and grow Australia's tourism market share. The international tourism

Portfolio overview
5
engagement function, including bilateral tourism relations with other governments
and international bodies, is led by DFAT.
Tourism Australia is responsible for promoting Australia as a compelling tourism
destination for international leisure and business events visitors. Tourism Australia
undertakes marketing that targets consumers in key international markets, working in
partnership with state and territory tourism organisations, industry and commercial
partners to increase the economic benefits of tourism to Australia by building demand
and increasing visitation and visitor spending.
DFAT will continue to strengthen bilateral tourism relationships with major source
countries and increase participation in key multilateral tourism forums.
ACIAR works in Australia’s national interest by contributing to economic growth and
poverty reduction in the Indo-Pacific region. ACIAR will continue to improve the
productivity and profitability of agricultural systems, through international
agricultural research partnerships. In 2015-16, ACIAR’s research partnerships will
have a stronger focus on developing market opportunities for smallholder farmers.
Projects will tackle gender inequality in their design, delivery and impact. ACIAR will
maintain its core mandate of producing excellent research, and will work through
others to achieve up-scaling and broader development outcomes. The strong emphasis
on impact, and on capacity building, will remain. ACIAR will also continue to
administer and manage Australia’s investment in multilateral innovation through the
CGIAR (formerly ‘the Consultative Group on International Agricultural Research’).
Through ASIS, the portfolio will continue to enhance government understanding of
the overseas environment affecting Australia’s vital interests and take appropriate
action, consistent with applicable legislation, to protect identified interests.
EFIC helps Australian exporters and companies investing in projects overseas to gain
access to finance and insurance services. EFIC provides financial facilities for
exporters, including loans, guarantees, medium-term credit insurance, bonds and
political risk insurance, with a focus on small and medium enterprises (SMEs) and
those seeking to do business in new and emerging markets. EFIC will continue to work
closely with DFAT and Austrade in the delivery of these services. It will also manage
the National Interest Account on behalf of the Commonwealth.

Portfolio overview
6
Figure 1: Foreign Affairs and Trade Portfolio Structure and Outcomes

Portfolio overview
7
PORTFOLIO RESOURCES
Table 1 shows the total new resources provided to the portfolio in the 2015-16 Budget
year by entity.
Table 1: Portfolio resources 2015-16
Appropriation
Bill No. 1
($m)
Appropriation
Bill No. 2
($m)
Special
appropriation
($m)
Receipts
($m)
Total
($m)
Department of Foreign
Affairs and Trade
Administered appropriations 3,579.9 13.5 1.0 - 3,594.4
Departmental appropriations 1,400.0 205.2 - 81.6 1,686.8
Total: 5,281.3
Australian Trade
Commission
Administered appropriations 145.3 - - - 145.3
Departmental appropriations 221.2 2.7 - 20.0 243.9
Total: 389.2
Australian Centre for
International Agricultural
Research
Administered appropriations 90.0 - - - 90.0
Departmental appropriations 9.9 0.2 - 1.9 12.0
Total: 102.0
Australian Secret
Intelligence Service
Administered appropriations - - - -
Departmental appropriations 256.9 11.0 - 54.5 322.4
Total: 322.4
Tourism Australia
Administered appropriations - - - - -
Departmental appropriations 137.3 - - - 137.3
Total: 137.3
Portfolio total 5,576.0 222.0 1.0 104.0 6,232.2
6,232.2Resources available w ithin portfolio:


9
ENTITY RESOURCES AND PLANNED PERFORMANCE
Department of Foreign Affairs and Trade (DFAT) .................................................... 11
Australian Trade Commission (Austrade) ................................................................ 79
Australian Centre for International Agricultural Research (ACIAR) .................... 121
Australian Secret Intelligence Service (ASIS) ........................................................ 147
Tourism Australia ...................................................................................................... 165


Department of Foreign Affairs and Trade (DFAT)
Entity resources and planned performance


13
DEPARTMENT OF FOREIGN AFFAIRS AND TRADE (DFAT)
Section 1: Entity overview and resources ................................................................ 15
1.1 Strategic direction statement .......................................................................... 15 1.2 Entity resource statement ............................................................................... 21 1.3 Budget measures ............................................................................................ 24
Section 2: Outcomes and planned performance ..................................................... 27 2.1 Outcomes and performance information ........................................................ 27
Section 3: Explanatory tables and budgeted financial statements ....................... 58
3.1 Explanatory tables .......................................................................................... 58
3.2 Budgeted financial statements........................................................................ 61


15
DEPARTMENT OF FOREIGN AFFAIRS AND TRADE
(DFAT)
Section 1: Entity overview and resources
1.1 STRATEGIC DIRECTION STATEMENT
The Department of Foreign Affairs and Trade (DFAT) supports Ministers in the
delivery of Australia’s foreign, trade and investment, development and international
security policy priorities. In 2015-16, the department will work to make Australia
stronger, safer and more prosperous by promoting and protecting our interests
internationally and contributing to global stability and economic growth, particularly
in the Indo-Pacific region.
Australia has global interests, with a strong focus on the Indo-Pacific region.
Strengthening Australia’s key regional partnerships will be a priority for the
department. The engagement of the United States in the Indo-Pacific provides major
security and economic benefits to the region, and to Australia. Through Australia’s
alliance with the United States, and extensive economic ties, the department will work
to strengthen the relationship and support the US contribution to regional and global
security and prosperity.
The department will work to strengthen Australia’s partnerships with Japan, China
and the Republic of Korea, building on shared strategic perspectives and
implementing the new free trade agreements. The department has worked with
Indonesian agencies across a range of issues, including on regional security, trade and
investment, economic growth and development challenges. Following the successful
reciprocal Prime Ministerial visits in 2014, the department will continue to enhance
Australia’s strategic and economic relationship with India, including by working to
conclude the Comprehensive Economic Cooperation Agreement (CECA).
It is in Australia’s interest to have secure, stable and prosperous neighbours, including
in the Pacific. The department will drive Australia’s comprehensive engagement with
Papua New Guinea (PNG) to strengthen the bilateral strategic, economic and business
partnership. The Pacific Leadership and Governance Precinct initiative to strengthen
PNG public sector leadership will be a priority. Australia will promote continued
peace and development in PNG’s Bougainville.
Australia will continue to normalise bilateral relations with Fiji and strengthen
relations with other Pacific island countries. As the drawdown of the Regional
Assistance Mission to Solomon Islands (RAMSI) continues out to mid-2017, the

DFAT Budget Statements
16
department will work to enhance Australia’s engagement with the Solomon Islands.
Further deepening of Australia’s close relationship with New Zealand and our
cooperation in the Pacific will be a priority.
Australia will continue to strengthen partnerships bilaterally with the nations of
Southeast Asia and regionally through the Association of Southeast Asian Nations
(ASEAN). The department will leverage new economic partnerships in the region
through the aid program, including with Indonesia, the Philippines and Vietnam.
DFAT will continue efforts to strengthen the East Asia Summit (EAS) and build
support for increased regional cooperation on maritime issues and countering violent
extremism. The department will work closely with the Philippines, the 2015 Asia-
Pacific Economic Cooperation (APEC) host, and Peru, the 2016 host, to support APEC
in promoting economic growth and prosperity in the region.
The New Colombo Plan is deepening Australia’s relationships in the Indo-Pacific by
offering undergraduate students opportunities for scholarships and grants for study
and internships/mentorships in the region. Operating in 38 locations, more than 4,800
grants will be offered in 2016 as the program expands to enable more students to live,
study and work in the Indo-Pacific.
The department will continue to support whole-of-government efforts to prevent
people-smuggling, and engage with key countries on related returns and resettlement
initiatives in support of Operation Sovereign Borders.
The department will support cooperation in the Indian Ocean region through the
Indian Ocean Rim Association (IORA), which Australia chairs until October 2015. As
part of the MIKTA grouping (Mexico, Indonesia, Korea, Turkey and Australia),
Australia will discuss global issues of common interest, and strategies to enhance
bilateral and plurilateral ties.
The department will work to strengthen Australia’s political and economic relations
with Europe, including by sustaining momentum in Australia-UK Ministerial
(AUKMIN) meetings and the strategic partnerships with France and Germany.
Following the conclusion of negotiations for a Framework Agreement with the
European Union, the department will further enhance relations, including exploration
of a possible free trade agreement (FTA). The department will facilitate continued
cooperation with Ukraine, including on the international investigations on the
downing of Malaysia Airlines Flight MH17.
The department will also continue to drive Australia’s growing economic, strategic
and security interests in South Asia, the Americas, the Middle East and Africa,
including by identifying further opportunities for trade and investment.

DFAT Budget Statements
17
Through the measure Australia’s embassy in Baghdad – continuation, the department will
maintain Australia’s diplomatic presence in Iraq to pursue bilateral engagement and
support Australia’s participation in the international coalition to assist Iraq to combat
the terrorist group, Daesh. The department will also support Australian Government
efforts to stop Australians joining terrorist networks and travelling overseas to become
foreign fighters.
Through the measure Australia’s diplomatic engagement in Afghanistan – continuation, the
department will support Australia’s continuing engagement with Afghanistan,
including as part of the NATO-led ‘Resolute Support’ mission.
Australia depends on open and transparent international markets for jobs and
economic growth. DFAT is leading the economic diplomacy agenda which is driven
by the core objectives of trade, growth, investment and business. It applies across the
department’s work, drawing together foreign, trade, investment, tourism and
development policies and leveraging our international networks and diplomatic assets.
The department will continue to support the implementation of recently concluded
FTAs with the Republic of Korea, Japan and China. Through the measure Free Trade
Agreement Promotion, the department and Austrade will communicate the practical
commercial opportunities and other benefits of these FTAs to Australian businesses.
The department will continue to leverage the benefits of existing FTAs with countries
in South-East Asia, New Zealand, the United States and Chile.
The department will work towards the timely conclusion of the CECA with India, and
to progress closer economic relations with Indonesia. It will also work to conclude the
Trans Pacific Partnership (involving twelve Pacific-rim members), and to progress
negotiations with the Gulf Cooperation Council, the Regional Comprehensive
Economic Partnership (involving ASEAN, China, India, Japan, the Republic of Korea
and New Zealand), and the Pacific island countries and New Zealand through the
Pacific Agreement on Closer Economic Relations – PACER Plus. The department will
also explore opportunities for new FTAs.
Australia is committed to the pursuit of global trade reform. The department will
work to progress negotiations in the Doha Round, including through participation at
the Tenth World Trade Organisation (WTO) Ministerial Conference (MC10) in
December 2015. DFAT will support a stronger, more competitive Australian
agriculture and agribusiness sector by pushing for agricultural trade reform in the
WTO, including through the Cairns Group and seek to unlock new opportunities for
exports of manufactures, services, and mineral and energy products. Australia will
also provide leadership in major plurilateral negotiations, including the Trade in
Services Agreement that Australia co-chairs, which will further liberalise global
services trade and the Environmental Goods Agreement, which Australia also chairs.

DFAT Budget Statements
18
DFAT will continue to implement the Government’s development policy Australian
aid: promoting prosperity, reducing poverty, enhancing stability. The aid program’s
purpose is to promote Australia’s national interests by contributing to sustainable
economic growth and poverty reduction. The program is focused on supporting
private sector development and strengthening human development.
The department will work to make Australian aid more innovative and catalytic, by
leveraging other drivers for development such as private sector investment and
domestic finance. A new development hub, the innovationXchange, based in DFAT, is
engaging creative thinkers from inside and outside the public sector, from Australia
and overseas, to look at new ways to deliver aid.
Australia will continue to support its developing country partners, but will adopt an
approach that acknowledges the different development trajectories of the Pacific and
growing Asia. Australia will maintain a leadership role through our aid program to
the Pacific and respond to the needs identified in each country. In most of Asia, where
economic growth and poverty reduction have continued apace, Australian aid will be
targeted primarily toward leveraging domestic capacity and resources.
Gender equality and women and girls' empowerment will be addressed across the aid
program. Expenditure on aid for trade will be increased to 20 per cent of official
development assistance (ODA) by 2020 and will include investments in economic
infrastructure, agriculture, fisheries and other productive capacity.
The department will continue to support countries that have been affected by natural
disasters, including Vanuatu in the wake of Cyclone Pam and Nepal after the
earthquake. We will also work to reduce risks from, prepare for and respond to crises,
particularly within the Indo-Pacific region.
The department will apply the new aid program performance framework, Making
Performance Count, to strengthen the link between funding and performance at all
levels of the program and ensure a stronger focus on results and value for money.
Australia has finished its term on the United Nations Security Council but the
department will remain actively involved in the United Nations system to pursue
Australia’s interests. DFAT will work for Australia’s election to the Human Rights
Council for the 2018-20 term. As well as promoting Australia’s interests in advancing
global environmental sustainability in multilateral forums, the department will work
to maintain Australia’s economic competitiveness and seek broad-based international
action and agreement in the UN climate negotiations, other international climate
forums, and through bilateral climate change engagement with major economies.
DFAT Budget Statements
19
Australia will work within the Group of Twenty (G20) to deliver substantial actions
agreed during its 2014 presidency including, lifting global growth and job
opportunities and making the global economy more resilient. Australia will remain in
the G20 troika of immediate past, present and future hosts, alongside Turkey and
China (2016 host) until 1 December 2015.
The department will continue to work to counter the proliferation of nuclear weapons,
constrain the illicit arms trade, and counter terrorism. It will pursue non-proliferation
and disarmament objectives related to Iran and the Democratic People's Republic of
Korea. The department will expand our network of bilateral cyber policy dialogues to
include India as well as China, Japan and the Republic of Korea, contribute to the
Government’s review of cyber security, and support work to elaborate how
international law applies to state behaviour in cyberspace. The department will also
contribute to EU-initiated efforts to finalise and promote adherence to the proposed
International Code of Conduct for Outer Space Activities.
Through public diplomacy, the department will advance initiatives that promote
Australia’s economic, artistic and cultural, sporting, scientific and education assets and
underline Australia’s credentials as a destination for business, investment, tourism and
study, and emphasise Australia’s engagement with the Indo-Pacific region. A new
sports diplomacy strategy will capitalise on Australia’s sporting assets and expertise to
promote Australia’s diplomatic, development and economic interests.
The delivery of high quality consular services is one of the department’s foreign policy
priorities. A new three-year Consular Strategy will drive improved effectiveness in the
delivery of consular services and enhanced public messaging. The department will
also promote safe travel messages through accurate and timely travel advice, including
through the Smartraveller campaign. The department will sustain its development and
testing of strong contingency plans across its network of overseas posts.
The department will continue to deliver an efficient passport service for Australian
citizens. The new ‘P-series’ passport, introduced in 2014, includes enhanced security
measures. The department is also working to develop a new Australian travel
document issuance system which will deliver increased processing capability,
improved client services and enhanced fraud and investigation controls.
Australia’s diplomatic footprint will expand through the measure Expanding Australia’s
Diplomatic Footprint. The department will establish five new posts in Makassar
(Indonesia), Phuket (Thailand), Buka (Papua New Guinea), Doha (Qatar) and
Ulaanbaatar (Mongolia). New posts in Makassar, Doha and Ulaanbaatar will advance
trade and investment opportunities for Australia. A consulate in Phuket will help
manage Australia’s significant consular load while a new post in Buka will provide
greater focus for Australia’s development assistance to Bougainville.

DFAT Budget Statements
20
The security and safety of Australian Government personnel and their dependants
overseas, together with the security of its missions, will remain a high priority for the
department in an increasingly unpredictable, and often worsening, international
security environment. This will require the implementation and maintenance of
comprehensive and effective strategic risk mitigation strategies and operational
security measures.
The department will continue its efforts to build a more resilient, flexible and cohesive
organisation that can better deliver the Government’s agenda. The department will
implement its first workforce plan as a tool to improve its capabilities to meet
Australia’s foreign, trade and economic, international security, development and
consular challenges. The department will continue to implement changes required by
the Public Governance, Performance and Accountability (PGPA) Act, including
enhancements to the Commonwealth performance framework. The department will
implement a new approach to risk management which will encourage staff to engage
with risk in a positive way to improve policy development and service delivery. The
department will also continue to support the Government’s deregulation agenda
through streamlining, where possible, its engagement with Australian individuals,
business and the not-for-profit sector.

DFAT Budget Statements
21
1.2 ENTITY RESOURCE STATEMENT
Table 1.1 shows the total resources from all sources. The table summarises how
resources will be applied by outcome and by administered and departmental
classification.
Table 1.1: Department of Foreign Affairs and Trade resource statement — Budget estimates for 2015-16 as at Budget May 2015
Actual
Available
Appropriation
2014-15
$'000
Estimate of
prior year
amounts
available in
2015-16
$'000
Proposed at
2015-16
Budget
$'000
Total 2015-16
estimate
$'000
Ordinary annual services (a)
Departmental appropriation
Prior year appropriations (b) 433,050 369,384 - 369,384
Departmental appropriation (c) 1,377,316 - 1,399,990 1,399,990
s74 Retained revenue receipts (d) 81,599 - 81,599 81,599
Total 1,891,965 369,384 1,481,589 1,850,973
Administered expenses
Outcome 1 (e) 4,530,015 392,637 3,579,158 3,971,795
Outcome 2 750 - 750 750
Payments to corporate entities (f) 138,865 - 137,290 137,290
Total 4,669,630 392,637 3,717,198 4,109,835
Total ordinary annual services [A] 6,561,595 762,021 5,198,787 5,960,808
Departmental non-operating
Prior year appropriations (b) 84,497 170,997 - 170,997
Equity injections (g) 120,920 - 205,241 205,241
Total 205,417 170,997 205,241 376,238
Administered non-operating
Prior year appropriations (b) 2,530,391 2,207,765 - 2,207,765
Administered assets and liabilities 212,698 - 13,527 13,527
Total 2,743,089 2,207,765 13,527 2,221,292
Total other services [B] 2,948,506 2,378,762 218,768 2,597,530
Total available annual appropriations
[A+B] 9,510,101 3,140,783 5,417,555 8,558,338 Table continued on the following page.

DFAT Budget Statements
22
Table 1.1: Department of Foreign Affairs and Trade resource statement — Budget estimates for 2015-16 as at Budget May 2015 (continued)
Actual
Available
Appropriation
2014-15
$'000
Estimate of
prior year
amounts
available in
2015-16
$'000
Proposed at
2015-16
Budget
$'000
Total 2015-16
estimate
$'000
Spe c ia l a ppropria tions
Spe c ia l a ppropria tions limite d by
c rite ria /e ntitle me nt
Public Governance, Performance and
Accountability Act 2013 - s77 (h) Passport
Refunds 1,010 - 1,010 1,010
Tota l spe c ia l a ppropria tions [C] 1,010 - 1,010 1,010
Tota l a ppropria tions e xc luding
spe c ia l a c c ounts
9,511,111 3,140,783 5,418,565 8,559,348
Spe c ia l a c c ounts
Opening balance (i) 281,327 153,078 949 154,027
Appropriation receipts (j) 61,728 - 65,765 65,765
Appropriation receipts - other entities (k) 23,780 - 24,271 24,271
Non- appropriation receipts to Special
Accounts 6,456 - 5,540 5,540
Tota l spe c ia l a c c ounts [D] 373,291 153,078 96,525 249,603
Tota l re sourc ing [A+B+C+D] 9,884,402 3,293,861 5,515,090 8,808,951
Less appropriations drawn from annual or
special appropriations above and credited
to special accounts (61,728) - (65,765) (65,765)and/or payments to corporate entities
through annual appropriations (138,865) - (137,290) (137,290)
Tota l ne t re sourc ing for DFAT 9,683,809 3,293,861 5,312,035 8,605,896 (a) Appropriation Bill (No. 1) 2015-16. (b) Estimated adjusted balance carried forward from previous year. (c) Includes an amount of $52.171m for the Departmental Capital Budget (refer to Table 3.2.5 for further
details). For accounting purposes this amount has been designated as ‘contributions by owners’. (d) Estimated retained revenue receipts under section 74 of the PGPA Act. (e) Includes an amount of $2.325m for the Administered Capital Budget (refer to Table 3.2.10 for further
details). For accounting purposes this amount has been designated as ‘contributions by owners’. (f) ‘Corporate entities’ are corporate Commonwealth entities and Commonwealth companies as defined
under the PGPA Act 2013. (g) Appropriation Bill (No. 2) 2015-16. (h) Repayments not provided for under other appropriations. Amounts received on or before 30 June 2014
were repaid under section 28 of the Financial Management and Accountability Act 1997. (i) Estimated opening balance for special accounts (less ‘Special Public Money’ held in accounts like Other
Trust Monies accounts (OTM), Services for other Government and Non-agency Bodies accounts (SOG), or Services for Other Entities and Trust Moneys accounts (SOETM)). For further information on special accounts, see Table 3.1.2.
(j) Appropriation receipts from DFAT’s annual and special appropriations for 2015-16 included above. (k) Appropriation receipts from other entities credited to DFAT’s special accounts. Reader note: All figures are GST exclusive.

DFAT Budget Statements
23
Third party payments from and on behalf of other entities
2014-15
$'000
2015-16
$'000
Receipts received from other entities for the provision of services
(disclosed above in s74 Retained revenue receipts section above) 81,599 81,599
Payments made to corporate entities w ithin the Portfolio
Tourism Australia Appropriation 138,865 137,290

DFAT Budget Statements
24
1.3 BUDGET MEASURES
Budget measures in Part 1 relating to the Department of Foreign Affairs and Trade are
detailed in Budget Paper No. 2 and are summarised below.
Table 1.2: Entity 2015-16 Budget measures
Part 1: Measures announced since the 2014-15 Mid-Year Economic and Fiscal Outlook (MYEFO)
Programme 2014-15
$'000
2015-16
$'000
2016-17
$'000
2017-18
$'000
2018-19
$'000
Revenue measures
Passport Fees and Charges -
reforms2.2
Administered - 1,716 4,959 5,025 5,430
Total - 1,716 4,959 5,025 5,430
Total revenue measures
Administered - 1,716 4,959 5,025 5,430
Departmental - - - - -
Total - 1,716 4,959 5,025 5,430
Expense measures
Expanding Australia's Diplomatic
Footprint (a)
1.1, 2.1,
3.1
Departmental expenses - 10,705 16,329 17,771 16,938
Total - 10,705 16,329 17,771 16,938
Australian embassy in Baghdad -
continuation
1.1, 2.1,
3.1
Departmental expenses - 46,431 48,342 - -
Total - 46,431 48,342 - -
Australia's diplomatic engagment
in Afghanistan - continuation
1.1, 2.1,
3.1
Departmental expenses - 64,134 68,005 - -
Total - 64,134 68,005 - -
Passport Fees and Charges -
reforms2.2
Departmental expenses - - - 10 42
Total - - - 10 42
Free Trade Agreement Promotion 1.1
Departmental expenses - 1,239 1,419 - -
Total - 1,239 1,419 - - Table continued on the following page.

DFAT Budget Statements
25
Part 1: Measures announced since the 2014-15 Mid-Year Economic and Fiscal Outlook (MYEFO) (continued)
Programme 2014-15
$'000
2015-16
$'000
2016-17
$'000
2017-18
$'000
2018-19
$'000
Digital Transformation Agenda -
portfolio contributions1.1
Departmental expenses - (581) (581) (581) (582)
Total - (581) (581) (581) (582)
Cadbury - redirection of grant
funding1.8
Administered expenses (4,000) (8,000) (4,000) - -
Total (4,000) (8,000) (4,000) - -
Total expense measures
Administered (4,000) (8,000) (4,000) - -
Departmental - 121,928 133,514 17,200 16,398
Total (4,000) 113,928 129,514 17,200 16,398
Capital measures
Expanding Australia's Diplomatic
Footprint3.1, 3.2
Departmental capital - 20,681 15,498 203 202
Total - 20,681 15,498 203 202
Australian embassy in Baghdad -
continuation3.1
Departmental capital - 10,979 205 - -
Total - 10,979 205 - -
Australia's diplomatic engagment
in Afghanistan - continuation3.1
Departmental capital - 5,011 1,286 - -
Total - 5,011 1,286 - -
Washington Chancery -
construction3.2
Capital expenses from the
Overseas Property Special
Account - 696 9,425 30,789 36,214
Total - 696 9,425 30,789 36,214 Table continued on the following page.

DFAT Budget Statements
26
Part 1: Measures announced since the 2014-15 Mid-Year Economic and Fiscal Outlook (MYEFO) (continued)
Programme 2014-15
$'000
2015-16
$'000
2016-17
$'000
2017-18
$'000
2018-19
$'000
Bangkok and Jakarta Chanceries -
divestment3.2
Overseas Property Special
Account - nfp nfp nfp nfp
Total - nfp nfp nfp nfp
Total capital measures
Departmental - 36,671 16,989 203 202
Overseas Property Special
Account - 696 9,425 30,789 36,214
Total - 37,367 26,414 30,992 36,416 (a) Measure includes payments to Overseas Property Office of $0.462m which does not impact on fiscal or
underlying cash balance. nfp – not for publication. Prepared on a Government Finance Statistics (fiscal) basis.

DFAT Budget Statements
27
Section 2: Outcomes and planned performance
2.1 OUTCOMES AND PERFORMANCE INFORMATION
Government outcomes are the intended results, impacts or consequences of actions by
the Government on the Australian community. Commonwealth programmes are the
primary vehicle by which government entities achieve the intended results of their
outcome statements. Entities are required to identify the programmes which contribute
to government outcomes over the Budget and forward years.
Each outcome is described below together with its related programmes, specifying the
performance indicators and targets used to assess and monitor the performance of
Department of Foreign Affairs and Trade in achieving government outcomes.
Outcome 1: The advancement of Australia’s international strategic, security and economic interests including through bilateral, regional and multilateral engagement on Australian Government foreign, trade and international development priorities
Outcome 1 strategy
The department will assist the Government to meet its foreign, trade and investment,
development and international security policy priorities over 2015-16 and forward
years through:
strengthening further Australia’s relations with key international partners and
countries of growing significance to Australia’s national interests;
driving the economic diplomacy agenda through trade, growth, investment and
business to encourage Australian prosperity and global prosperity;
contributing to national prosperity by maximising Australia’s trade
opportunities and market access gains through multilateral, regional and
bilateral means;
assisting developing countries by contributing to sustainable economic growth
and poverty reduction, particularly in the Indo-Pacific region, through support
to private sector development and strengthening human development;
working multilaterally to address global challenges relating to peace and
security, climate change, sustainable growth and human rights and to advance
Australia’s interests through the United Nations, G20 and significant regional
fora;
DFAT Budget Statements
28
promoting and strengthening regional and global cooperation and governance
in countering terrorism, people smuggling, human trafficking and nuclear
proliferation; and
developing and implementing programs and projects to enhance international
awareness and understanding of Australia and Australian policies to advance
our national interests.
As the lead agency managing Australia’s external affairs, the department will also
continue to provide leadership at Australia’s diplomatic missions overseas, manage
and maintain Australia’s diplomatic network, including the provision of services to
other agencies represented overseas, and deliver services to diplomatic and consular
representatives in Australia.

DFAT Budget Statements
29
Table 2: Changes to the outcome and programme structures since the last portfolio statement
Programme
No.
Programme title Description of change
1.1 Foreign Affairs and Trade
Operations
Includes Programme 1.4: International Climate
Change Engagement Programme published in 2014-
15 PBS
1.2 Official Development Assistance New programme (Programme 1.2: ODA) created
effective from 01 July 2015 w hich combines
Programmes 1.9 to 1.14 as listed below
1.3 Official Development Assistance -
Multilateral Replenishments
2014-15 PBS programme reference amended from
1.11
1.4 Official Development Assistance -
East Asia AIPRD
2014-15 PBS programme reference amended from
1.8
1.5 Payments to International
Organisations
2014-15 PBS programme reference amended from
1.2
1.6 New Colombo Plan - Transforming
Regional Relationships
2014-15 PBS programme reference amended from
1.5
1.7 Public Information Services and
Public Diplomacy
2014-15 PBS programme reference amended from
1.3
1.8 Programmes to Promote Australia's
International Tourism Interests
2014-15 PBS programme reference amended from
1.14
1.9 Official Development Assistance -
PNG & Pacif ic
New programme (Programme 1.2: ODA) has been
created effective 01 July 2015 w hich combines
the forw ard estimates of this programme.
2014-15 PBS programme reference is 1.6
1.10 Official Development Assistance -
East Asia
New programme (Programme 1.2: ODA) has been
created effective 01 July 2015 w hich combines
the forw ard estimates of this programme.
2014-15 PBS programme reference is 1.7
1.11 Official Development Assistance -
Africa, South and Central Asia,
Middle East and Other
New programme (Programme 1.2: ODA) has been
created effective 01 July 2015 w hich combines
the forw ard estimates of this programme.
2014-15 PBS programme reference is 1.9
1.12 Official Development Assistance -
Emergency, Humanitarian and
Refugee Programme
New programme (Programme 1.2: ODA) has been
created effective 01 July 2015 w hich combines
the forw ard estimates of this programme.
2014-15 PBS programme reference is 1.10
1.13 Official Development Assistance -
UN Commonw ealth and Other
International Organisations
New programme (Programme 1.2: ODA) has been
created effective 01 July 2015 w hich combines
the forw ard estimates of this programme.
2014-15 PBS programme reference is 1.12
1.14 Official Development Assistance -
NGO, Volunteer and Community
Programmes
New programme (Programme 1.2: ODA) has been
created effective 01 July 2015 w hich combines
the forw ard estimates of this programme.
2014-15 PBS programme reference is 1.13

DFAT Budget Statements
30
Outcome expense statement
Table 2.1.1 provides an overview of the total expenses for Outcome 1, by programme.
Table 2.1.1: Budgeted expenses for Outcome 1
Outcome 1: The advancement of Australia's international
strategic, security and economic interests including through
bilateral, regional and multilateral engagement on Australian
Government foreign, trade and international development
policy priorities
2014-15
Estimated
actual
expenses
$'000
2015-16
Estimated
expenses
$'000
Programme 1.1: Foreign Affairs and Trade Operations
Administered expenses
Ordinary annual services (Appropriation Bill No. 1) 9,194 8,539
Other services (Appropriation Bill No. 2) (a ) 212,033 13,452
Special accounts (b) 257,000 257,000
Departmental expenses
Departmental appropriation (c) 616,464 665,161
Expenses not requiring appropriation in the Budget year (d) 38,857 38,855
Total for programme 1.1 1,133,548 983,007
Programme 1.2: Official Development Assistance
Administered expenses
Ordinary annual services (Appropriation Bill No. 1) - 3,105,723
Expenses not requiring appropriation in the Budget year - 1,507
Other services (Appropriation Bill No. 2) - -
Departmental expenses
Departmental appropriation (c) 231,898 230,823
Expenses not requiring appropriation in the Budget year (d) 17,168 16,612
Total for programme 1.2 249,066 3,354,665
Programme 1.3: Official Development Assistance - Multilateral
Replenishments
Administered expenses
Ordinary annual services (Appropriation Bill No. 1) 106,868 -
Other services (Appropriation Bill No. 2 ) - -
Expenses not requiring appropriation in the Budget year (e) - -
Total for Programme 1.3 106,868 -
Programme 1.4: Official Development Assistance - East Asia
AIPRD
Administered expenses
AIPRD Loans Special Account (b) 19,282 -
AIPRD Loans Special Account 2015 (b) 18,775 -
Total for Programme 1.4 38,057 -
Programme 1.5: Payments to International Organisations
Administered expenses
Ordinary annual services (Appropriation Bill No. 1) 328,421 415,804
Total for Programme 1.5 328,421 415,804 Table continued on the following page.

DFAT Budget Statements
31
Table 2.1.1: Budgeted expenses for Outcome 1 (continued)
Outcome 1:
2014-15
Estimated
actual
expenses
$'000
2015-16
Estimated
expenses
$'000
Programme 1.6: New Colombo Plan - Transforming Regional
Relationships
Administered expenses
Ordinary annual services (Appropriation Bill No. 1) 10,958 27,742
Other services (Appropriation Bill No. 2) 665 75
Total for Programme 1.6 11,623 27,817
Programme 1.7: Public Information Services and Public
Diplomacy
Administered expenses
Ordinary annual services (Appropriation Bill No. 1) 15,182 5,044
Total for Programme 1.7 15,182 5,044
Programme 1.8: Programmes to Promote Australia's
International Tourism Interests
Administered expenses
Tourism Australia - Corporate Commonw ealth Entity 138,865 137,290
Ordinary annual services (Appropriation Bill No. 1) 22,590 14,000
Total for Programme 1.8 161,455 151,290
Programme 1.9: Official Development Assistance - PNG &
Pacific (f)
Administered expenses
Ordinary annual services (Appropriation Bill No. 1) 918,607 -
Total for Programme 1.9 918,607 -
Programme 1.10: Official Development Assistance - East Asia
(f)
Administered expenses
Ordinary annual services (Appropriation Bill No. 1) 1,053,144 -
Total for Programme 1.10 1,053,144 -
Programme 1.11: Official Development Assistance - Africa,
South and Central Asia, Middle East and Other (f)
Administered expenses
Ordinary annual services (Appropriation Bill No. 1) 1,011,039 -
Expenses not requiring appropriation in the Budget year 1,507 -
Total for Programme 1.11 1,012,546 -
Programme 1.12: Official Development Assistance -
Emergency, Humanitarian and Refugee Programme (f)
Administered expenses
Ordinary annual services (Appropriation Bill No. 1) 292,886 -
Total for Programme 1.12 292,886 -
Programme 1.13: Official Development Assistance - UN
Commonwealth and Other International Organisations (f)
Administered expenses
Ordinary annual services (Appropriation Bill No. 1) 552,600 -
Total for Programme 1.13 552,600 - Table continued on the following page.

DFAT Budget Statements
32
Table 2.1.1: Budgeted expenses for Outcome 1 (continued)
Outcome 1:
2014-15
Estimated
actual
expenses
$'000
2015-16
Estimated
expenses
$'000
Programme 1.14: Official Development Assistance - NGO,
Volunteer and Community Programmes (f)
Administered expenses
Ordinary annual services (Appropriation Bill No. 1) 203,972 -
Total for Programme 1.14 203,972 -
Outcome 1 Totals by appropriation type
Administered Expenses
Ordinary annual services (Appropriation Bill No. 1) 4,525,461 3,576,852
Corporate Commonw ealth Entity 138,865 137,290
Other services (Appropriation Bill No. 2) 212,698 13,527
Special Accounts 295,057 257,000
Expenses not requiring appropriation in the Budget year 1,507 1,507
Departmental expenses
Departmental appropriation (a) 848,362 895,984
Expenses not requiring appropriation in the Budget year (c) 56,025 55,467
Total expenses for Outcome 1 6,077,975 4,937,627
2014-15 2015-16
Average staffing level (number) 3,762 3,772 (a) Includes payments for the Debt-to-Health Swap with the Government of Indonesia of $12.0 million in
2014-15 and $13.4 million in 2015-16. (b) This reflects the amount of funding to be disbursed on a cash basis, not an expense basis. (c) Departmental appropriation combines 'Ordinary annual services (Appropriation Bill No. 1)' and 'Revenue
from independent sources (s 74)'. (d) Expenses not requiring appropriation in the Budget year are made up of depreciation expenses,
amortisation expenses, makegood expenses, audit fees. (e) Expenses not requiring appropriation in the Budget year relates to the concessional investment discount
for the discounting of the investment component for the International Development Association and Asian Development Fund.
(f) A new programme (Programme 1.2: Official Development Assistance) has been created effective from 01 July 2015 which combines the forward estimates of these programmes.
Note: Departmental appropriation splits and totals are indicative estimates and may change in the course of the budget year as government priorities change.

DFAT Budget Statements
33
Contributions to Outcome 1
Programme 1.1: Foreign Affairs and Trade Operations
Programme objective
• To protect and advance the national interest through engaging in effective
advocacy in Australia and overseas that promotes Australia’s foreign, trade and
investment, tourism, development and international security interests.
• To deliver accurate and timely policy advice to Ministers and other key clients
that addresses the challenges of an evolving international environment.
• To promote a whole of government approach in pursuit of Australia’s interests
abroad, including through leadership at overseas missions and coordination of
the overseas diplomatic network.
• To ensure the security and protect the dignity of the diplomatic and consular
corps serving in Australia by delivering a quality service and upholding
Australia’s obligations under the Vienna Conventions.

DFAT Budget Statements
34
Programme expenses
2014-15
Estimated
actual
$'000
2015-16
Budget
$'000
2016-17
Forw ard
estimate
$'000
2017-18
Forw ard
estimate
$'000
2018-19
Forw ard
estimate
$'000
Annual administered expenses:
Foreign Affairs and Trade Operations
Export Finance and Insurance Corporation
(EFIC) - National Interest Account Expenses 3,116 2,076 1,300 1,300 1,300
International Climate Change Engagement (a) 3,000 3,000 3,000 3,000 3,000
Personal Benefits - Locally Engaged Staff
pension schemes 2,512 2,872 2,801 2,903 2,908
Other Administered Items 566 591 618 647 647
Other services (Appropriation Bill No. 2)
Capital Injection for EFIC 200,000 - - - -
Special Account Expenses
Administered Payments and Receipts for
Other Entities 250,000 250,000 250,000 250,000 250,000
Services for Other Entities and Trust
Moneys - Foreign Affairs and Trade 7,000 7,000 7,000 7,000 7,000
Expositions - - - - -
Annual departmental expenses:
Foreign Affairs and Trade Operations 616,464 665,161 663,923 606,134 606,508
Expenses not requiring appropriation in the
Budget year (b) 38,857 38,855 38,844 38,851 40,732
Debt-to-Health Sw ap w ith Government of
Indonesia 12,033 13,452 15,027 - -
Total programme expenses 1,133,548 983,007 982,513 909,835 912,095 (a) Includes previous Programme 1.4: International Climate Change Engagement Programme published in
Portfolio Additional Estimates Statements 2014-15. (b) Expenses not requiring appropriation in the Budget year are made up of depreciation expenses,
amortisation expenses, make-good expenses, and audit fees.

DFAT Budget Statements
35
Programme 1.1 deliverables
• Australia’s foreign, trade and investment, tourism, development, and international security policy interests and international standing are advanced through:
― strengthened key international relationships, including a strong alliance and
economic ties with the United States, and high-level political and economic
engagement with Japan, China, India, the Republic of Korea, Indonesia and
other countries of South-East Asia;
― enhanced engagement with Pacific island countries, including deepening our partnership with Papua New Guinea, supporting normalisation of relations with Fiji and supporting capacity building in the Solomon Islands;
― a stronger partnership with the European Union and key European countries, and continued close ties with New Zealand, the United Kingdom and Canada;
― sustained engagement with South Asia, the Middle East, Africa, the Americas, and Turkey to meet shared challenges and to promote global and regional stability, security and prosperity;
― strong participation in the United Nations and other multilateral fora, advocacy of human rights, gender equality and promotion of sustainable development and effective international action on climate change and other environmental outcomes;
― contribution to enhanced regional architecture through the East Asia Summit (EAS), dialogue with the Association of Southeast Asian Nations (ASEAN), the Asia-Pacific Economic Cooperation (APEC) forum, the Indian Ocean Rim Association (IORA) and MIKTA (Mexico, Indonesia, Korea, Turkey and Australia);
― promotion of high-quality public diplomacy, international media and cultural visit programs which improve understanding of Australia and Australian Government foreign and trade policies; and
― measurable influence on the agenda of key multilateral tourism fora to align with the Australian Government’s priorities under Tourism 2020 and strengthen bilateral tourism relationships with important tourist markets such as China and India.

DFAT Budget Statements
36
• Australia’s trade and investment opportunities are maximised, including through:
― negotiating, finalising and implementing Australia’s free trade agreement (FTA) agenda and exploring opportunities for FTAs with other trading partners;
― enhancing Australia’s commitment to regional trade negotiations, including the Trans Pacific Partnership, Regional Comprehensive Economic Partnership and PACER Plus;
― effective participation in the World Trade Organization (WTO), including working with other WTO Members to conclude the negotiations of the Doha Round, leadership of the Cairns Group of agricultural exporting countries, and to promote and defend Australia’s interests through means such as WTO dispute settlement; and
― implementing the WTO Agreement on Trade Facilitation, negotiating the Trade in Services Agreement, and negotiating the Environmental Goods Agreement.
• An enhanced environment for security and development, including through:
― effective whole of government efforts to promote international stability and development;
― promotion of nuclear non-proliferation and disarmament, and counter-proliferation and arms control efforts, including as chair of the Australia Group;
― participation in counter-terrorism programs and activities, including in South Asia, South-East Asia, the Middle East, eastern and West Africa, and in the Global Counter Terrorism Forum; and
― contribution to whole of government efforts bilaterally and regionally to counter people smuggling and human trafficking, including through the Bali Process on People Smuggling, Trafficking in Persons and Related Transnational Crime.
• Australia’s international and portfolio responsibilities are met through:
― effective coordination and sound advice to Ministers, members of parliament, government agencies, state and territory governments, business, non-government organisations, media and members of the public;

DFAT Budget Statements
37
― sound advice on compliance with international legal obligations and contribution to the development of a strong international legal framework;
― effective leadership of, and provision of advice and support to, other government agencies at overseas missions in line with the Prime Minister’s Directive on the Guidelines for the Management of the Australian Government Presence Overseas and service level agreements;
― quality service to the diplomatic and consular corps in Australia, including the processing of agrément, visas and accreditation; provision of airport facilitation, tax concessions, and reciprocal working agreements; consideration of mission, post and office establishment; and management of privileges and immunities in accordance with the Vienna Conventions; and
― administration of the Export Finance and Insurance Corporation National Interest Account.
Programme 1.1 Key Performance Indicators
• High level of satisfaction of Ministers and high-level clients with the quality and
timeliness of advice, briefing and support in relation to Australia’s foreign, trade
and economic, development and international security interests.
• The department’s advocacy, negotiation and liaison on Australia’s foreign, trade
and economic, development and international security interests contributes
positively to bilateral, regional and multilateral outcomes that help ensure the
security and prosperity of Australia and Australians.
• Government agencies at overseas missions are satisfied with service provided in
accordance with the Prime Minister’s Directive on the Guidelines for the
Management of the Australian Government Presence Overseas and service level
agreements in place.
• The diplomatic and consular corps posted or accredited to Australia are satisfied
with the level of service provided, including in terms of responsiveness and
timeliness in meeting Australia’s obligations under the Vienna Conventions.

DFAT Budget Statements
38
Programme 1.2: Official Development Assistance
Programme Objective
• To promote Australia’s national interests by contributing to sustainable economic growth and poverty reduction.
Programme expenses
2014-15
Estimated
actual
$'000
2015-16
Budget
$'000
2016-17
Forw ard
estimate
$'000
2017-18
Forw ard
estimate
$'000
2018-19
Forw ard
estimate
$'000
Annual administered expenses:
Official Development Assistance - 3,105,723 2,935,547 3,308,173 3,360,130
Expenses not requiring appropriation in the
Budget year (a) - 1,507 1,489 1,489 2,440
Annual departmental expenses:
Official Development Assistance 231,898 230,823 245,466 254,532 263,523
Expenses not requiring appropriation in the
Budget year (a) 17,168 16,612 16,612 16,612 9,914
Total programme expenses 249,066 3,354,665 3,199,114 3,580,806 3,636,007 (a) Expenses not requiring appropriation in the Budget year are made up of depreciation expenses,
amortisation expenses, make-good expenses, and audit fees.
Programme 1.2 Deliverables
• The Australian Government’s new development policy Australian aid: promoting prosperity, reducing poverty, enhancing stability is shaping the way we deliver our overseas development assistance. It focuses on two development outcomes: supporting private sector development and strengthening human development.
• Investments will be focused on priority areas:
― infrastructure, trade facilitation and international competitiveness;
― agriculture, fisheries and water;
― effective governance through policies, institutions and functioning economies;
― education and health;
― building resilience through humanitarian assistance, disaster risk reduction and social protection; and
― gender equality and empowering women and girls.

DFAT Budget Statements
39
Programme 1.2 Key Performance Indicators
• Achievement of significant development results and demonstrated organisational effectiveness, including progress towards the strategic targets contained in the Australian aid program’s performance framework, Making Performance Count.
• Detailed reporting against the performance framework, including individual program and investment performance, will be published annually in the Performance of Australian Aid report.

DFAT Budget Statements
40
Programme 1.3: Official Development Assistance – Multilateral Replenishments
Programme objective
• To assist developing countries by contributing to sustainable economic growth and poverty reduction through contributions to multilateral organisations.
Programme expenses
2014-15
Estimated
actual
$'000
2015-16
Budget
$'000
2016-17
Forw ard
estimate
$'000
2017-18
Forw ard
estimate
$'000
2018-19
Forw ard
estimate
$'000
Annual administered expenses:
Administered item
Administered item (Appropriation Bill No. 1) 106,868 - 377,274 12,622 105,000
Administered item (Appropriation Bill No. 2) - - 1,103,505 - -
Expenses not requiring appropriation in the
Budget year (a) - - 953,505 - -
Total programme expenses 106,868 - 2,434,284 12,622 105,000 (a) Expenses not requiring appropriation in the Budget year relate to the concessional investment discount
for the discounting of the investment components for International Development Association and Asian Development Fund.
Programme 1.3 Deliverables
• Australia’s aid program objectives will be advanced through our work with multilateral organisations. Their reach, leverage, specialisation and other strengths play a critical role in helping Australia to meet its international development objectives.
Programme 1.3 Key Performance Indicators
• Australia assesses the performance of its multilateral partners to inform our engagement with them and to ensure value for money from our multilateral funding.
• Australia is strengthening its approach to the assessment of performance of multilateral organisations in line with the aid performance framework, Making Performance Count.
• Strengthened systems for assessing the performance of multilateral aid delivery partners will be in place by July 2015.

DFAT Budget Statements
41
Programme 1.4: Official Development Assistance – East Asia AIPRD
Programme Objective and Deliverables
• To continue to assist Indonesia in reconstruction and development in the aftermath of the 2004 Indian Ocean Tsunami.
Programme expenses
2014-15
Estimated
actual
$'000
2015-16
Budget
$'000
2016-17
Forw ard
estimate
$'000
2017-18
Forw ard
estimate
$'000
2018-19
Forw ard
estimate
$'000
Annual administered expenses:
Special Account Expenses
AIPRD Loans Special Account (a) 19,282 - - - -
AIPRD Loans Special Account 2015 (a) 18,775 - - - -
Total programme expenses 38,057 - - - - (a) This reflects the amount of funding to be disbursed on a cash basis, not an expense basis.
Programme 1.4 Key Performance Indicators
• Achievement of significant development results, including progress towards aid performance benchmarks, which provide a rigorous approach to achieving value for money and results.
• Demonstrated organisational effectiveness, including against relevant strategic targets under the Making Performance Count performance framework.

DFAT Budget Statements
42
Programme 1.5: Payments to International Organisations
Programme objective
• To advance Australia’s foreign, trade and investment, development and international security interests through participation in international organisations.
Programme expenses
2014-15
Estimated
actual
$'000
2015-16
Budget
$'000
2016-17
Forw ard
estimate
$'000
2017-18
Forw ard
estimate
$'000
2018-19
Forw ard
estimate
$'000
Annual administered expenses:
Administered item
Payments to International Organisations 328,421 415,804 436,595 460,595 484,251
Total programme expenses 328,421 415,804 436,595 460,595 484,251
Programme 1.5 Deliverables
• Australian membership of international organisations and international treaty secretariats through payments of assessed and voluntary contributions.
• Effective participation in the United Nations and its Specialised Agencies, the World Trade Organization and other multilateral fora in support of Australia’s foreign, trade and economic, development and international security interests.
• To assist developing countries reduce poverty and lift living standards through sustainable economic growth, by providing contributions to UN and other international organisations.
Programme 1.5 Key Performance Indicators
• Payments to international organisations are timely and within budget.
• The department’s contributions influence multilateral outcomes which enhance Australia’s security and prosperity, maximise the impact of Australia’s aid program and represent value for money.

DFAT Budget Statements
43
Programme 1.6: New Colombo Plan – Transforming Regional Relationships
Programme objective
• Australia’s interests and bilateral relationships are enhanced through enduring
people to people, institutional and business links with the Indo-Pacific region.
Programme expenses
2014-15
Estimated
actual
$'000
2015-16
Budget
$'000
2016-17
Forw ard
estimate
$'000
2017-18
Forw ard
estimate
$'000
2018-19
Forw ard
estimate
$'000
Annual administered expenses:
Administered item
New Colombo Plan - Transforming Regional
Relationships 10,958 27,742 27,790 50,933 50,933
Administered item (Appropriation Bill No. 2) 665 75 425 150 -
Total programme expenses 11,623 27,817 28,215 51,083 50,933
Programme 1.6 Deliverables
• Full implementation of the New Colombo Plan (NCP) in 38 Indo-Pacific
locations, fostering closer people to people and institutional links and
contributing to an overall increase in the number of Australian undergraduate
students undertaking study and internships in the region.
Programme 1.6 Key Performance Indicators
• More Australian undergraduates supported to study and intern in the Indo-Pacific region.
• NCP participants build relationships in the region and promote the value of the NCP experience.
• Universities, the private sector and partner governments support the implementation of the NCP.
• Alumni are engaged through networks that foster professional development and ongoing connections with the region.

DFAT Budget Statements
44
Programme 1.7: Public Information Services and Public Diplomacy
Programme objective
• To project a positive and contemporary image of Australia and promote a clear understanding of government policies and objectives and engagement with the Indo-Pacific region through the department’s public diplomacy, cultural and media activities.
Programme expenses
2014-15
Estimated
actual
$'000
2015-16
Budget
$'000
2016-17
Forw ard
estimate
$'000
2017-18
Forw ard
estimate
$'000
2018-19
Forw ard
estimate
$'000
Annual administered expenses:
International Relations Grants Programme 4,594 4,594 4,594 4,594 4,594
Australia Netw ork 10,588 - - - -
Bali Peace Park - 450 - - -
Total programme expenses 15,182 5,044 4,594 4,594 4,594
Programme 1.7 Deliverables
• Promotion of people to people links and a contemporary and positive image of Australia as a destination for business, investment, tourism and study and support for the Government’s international policy goals.
• Advancement of Australia’s national interests through new approaches which engage audiences on contemporary Australia and facilitate networks, collaboration and connections between people and institutions to build understanding, trust and influence.
Programme 1.7 Key Performance Indicators
• An understanding of contemporary Australia and the government’s foreign, trade, investment and development credentials, and strengthened people to people and institutional links and trade, economic and cultural ties.

DFAT Budget Statements
45
Programme 1.8: Programmes to Promote Australia’s International Tourism Interests
Programme expenses
The functions captured by this table are the responsibility of other portfolio agencies. The Tourism Industry Regional Development Fund, Tasmanian Regional Tourism Package and T-Qual Grants annual administered expenses have been transferred to Austrade. Refer to the Austrade Agency Resource and Planned Performance section for 2015-16 objectives, deliverables and key performance indicators. Refer to Tourism Australia, Outcome 1, for objectives, deliverables and key performance indicators relating to Tourism Australia-Asia Marketing Fund and Tourism Australia-Corporate Commonwealth Entity.
2014-15
Estimated
actual
$'000
2015-16
Budget
$'000
2016-17
Forw ard
estimate
$'000
2017-18
Forw ard
estimate
$'000
2018-19
Forw ard
estimate
$'000
Annual administered expenses:
Tourism Industry Regional Development Fund 3,896 - - - -
Tasmanian Regional Tourism Package 120 - - - -
T-Qual Grants (a) 4,474 - - - -
Transfer of T-Qual Accreditation to
Industry(b)
600 - - - -
Tourism Australia -Asia Marketing Fund 13,500 14,000 14,000 14,000 14,000
Tourism Australia - Corporate
Commonw ealth Entity 138,865 137,290 136,760 138,438 140,059
Total programme expenses 161,455 151,290 150,760 152,438 154,059 (a) The balance of this program has been transferred to Austrade. Refer to Austrade Table 3.1.1. (b) There was no successful tenderer for the T-Qual accreditation program and the Minister for Trade and
Investment has approved the reallocation of these funds to activities consistent with achieving quality tourism outcomes.

DFAT Budget Statements
46
Outcome 2: The protection and welfare of Australians abroad and access to secure international travel documentation through timely and responsive travel advice and consular and passport services in Australia and overseas
Outcome 2 strategy
With more Australians travelling overseas each year, the department will continue to give high priority to the delivery of effective consular services and helping Australians to help themselves, including through the implementation of the new three-year Consular Strategy. The department will help Australians make informed decisions about their security, safety and wellbeing by maintaining its comprehensive system of travel advisories. The department’s consular outreach program will continue in 2015-16, promoting safe travel messages and delivering accurate and timely travel advice, including through the Smartraveller campaign and targeted outreach.
Practical planning for contingency and rapid crisis response will remain a focus through 2015-16. The department will work to enhance its ability to respond quickly to consular incidents, particularly in remote locations or where consular representation is less concentrated. It will also continue to lead whole of government responses to future consular crises and serious incidents overseas, activating the department’s Crisis Centre as needed.
The department will continue to deliver an efficient passport service for Australian citizens. The new ‘P-series’ passport, introduced in 2014, includes enhanced security measures, making it one of the most secure and trustworthy passport documents in the world. In 2015-16, we will continue work on development of the next generation Australian travel document issuance system.
Outcome expense statement
Table 2.1.2 provides an overview of the total expenses for Outcome 2, by programme.

DFAT Budget Statements
47
Table 2.1.2: Budgeted expenses for Outcome 2
Outcome 2: The protection and welfare of Australians abroad
and access to secure international travel documentation
through timely and responsive travel advice and consular and
passport services in Australia and overseas
2014-15
Estimated actual
expenses
$'000
2015-16
Estimated
expenses
$'000
Programme 2.1: Consular Services
Administered expenses
Ordinary annual services (Appropriation Bill No. 1) 200 200
Special accounts (a) 100 100
Departmental expenses (b)
Consular Services 83,651 101,680
Expenses not requiring appropriation in the Budget year (c) 5,626 5,627
Total for programme 2.1 89,577 107,607
Programme 2.2: Passport Services
Administered expenses
Special appropriations 1,010 1,010
Departmental expenses (b)
Passport Services 236,986 238,411
Expenses not requiring appropriation in the Budget year (c) 15,672 15,674
Total for programme 2.2 253,668 255,095
Outcome 2 Totals by appropriation type
Administered expenses
Ordinary annual services (Appropriation Bill No. 1) 200 200
Special appropriations 1,010 1,010
Special accounts 100 100
Departmental expenses
Departmental appropriation (b) 320,637 340,091
Expenses not requiring appropriation in the Budget year (c) 21,298 21,301
Total expenses for Outcome 2 343,245 362,702
2014-15 2015-16
Average staffing level (number) 1,088 1,088 (a) This reflects actual cash disbursements from the property account. (b) Departmental appropriation combines ‘Ordinary annual services (Appropriation Bill No. 1)’ and ‘Revenue
from independent sources (s 74)’. (c) Expenses not requiring appropriation in the Budget year are made up of depreciation expenses,
amortisation expenses, makegood expenses, and audit fees. Note: Departmental appropriation splits and totals are indicative estimates and may change in the course of the budget year as government priorities change.

DFAT Budget Statements
48
Contributions to Outcome 2
Programme 2.1: Consular Services
Programme objective
• To support and assist Australian travellers and Australians overseas through high-quality consular services, including accurate and timely travel advice, practical contingency planning and rapid crisis response.
Programme expenses
2014-15
Estimated
actual
$'000
2015-16
Budget
$'000
2016-17
Forw ard
estimate
$'000
2017-18
Forw ard
estimate
$'000
2018-19
Forw ard
estimate
$'000
Annual administered expenses:
Administered item
Consular Emergency Services (a) 200 200 200 200 200
Special account expenses:
Consular Services Special Account 100 100 100 100 100
Annual departmental expenses:
Consular Services 83,651 101,680 101,664 92,850 92,930
Expenses not requiring appropriation in the
Budget year (b)
5,626 5,627 5,627 5,627 5,900
Total programme expenses 89,577 107,607 107,591 98,777 99,130 (a) This expense does not include $0.55m for Traveller’s Emergency Loans, as these are treated as
receivables and form part of the receivable balance in Table 3.2.8. (b) Expenses not requiring appropriation in the Budget year are made up of depreciation expenses,
amortisation expenses, makegood expenses, and audit fees.
Programme 2.1 Deliverables
• High-quality consular services to an increasing number of Australian travellers and Australian citizens living overseas, including notarial services and assistance with welfare issues, whereabouts enquiries, arrest or detention matters, deaths, medical emergencies and payment of travellers emergency loans to Australians in need.
• High-quality travel advisory services, including issuing accurate and timely travel information on travel destinations, promoting this information through the continuation of the Smartraveller campaign and effectively managing an online travel registration service.
• Effective consular contingency planning for major events or high-risk scenarios, including through regular reviews of procedures and available resources, training of staff, and coordination with other government agencies and foreign governments.

DFAT Budget Statements
49
• Coordination of whole of government responses to large-scale crises involving conflict, civil unrest, natural disasters or terrorist incidents.
Programme 2.1 Key Performance Indicators
• The department’s delivery of consular services is effective, efficient, timely and responsive, and within the scope of Australian Government responsibility.
• Travel advisories are accurate and timely and provide clear guidance to a broad audience of potential risks and the extent of Australian Government assistance; public use of the Smartraveller website and the online registration service continues to grow.
• Consular contingency planning accurately anticipates high-risk events and scenarios, necessary resources for response are readily available, procedures and networks remain valid and viable, and plans are tested and reviewed regularly.
• Timely and effective consular support to Australians through well-coordinated implementation of whole of government responses to large-scale crises.

DFAT Budget Statements
50
Programme 2.2: Passport Services
Programme objective
• To provide Australians access to secure international travel documentation through the delivery of high-quality passport services.
Programme expenses
2014-15
Estimated
actual
$'000
2015-16
Budget
$'000
2016-17
Forw ard
estimate
$'000
2017-18
Forw ard
estimate
$'000
2018-19
Forw ard
estimate
$'000
Annual administered expenses:
Special appropriations:
PGPA Act s77 - Passport Refunds 1,010 1,010 1,010 1,010 1,010
Annual departmental expenses:
Passport Services 236,986 238,411 238,590 238,898 238,673
Expenses not requiring appropriation in the
Budget year (a) 15,672 15,674 15,674 15,674 16,436
Total programme expenses 253,668 255,095 255,274 255,582 256,119 (a) Expenses not requiring appropriation in the Budget year are made up of depreciation expenses,
amortisation expenses, makegood expenses, and audit fees.
Programme 2.2 Deliverables
• High-quality passport services to Australians, including processing new passport applications, registering lost or stolen passports, issuing emergency passports, and detecting passport fraud.
• Maintenance of security standards, promotion of web-enabled services, and adherence to the client service commitment of passport issue, while effectively managing an increasing workload.
• Ongoing implementation of the National Security – Improved Passport Integrity and Strengthened Issuance Systems program.
DFAT Budget Statements
51
Programme 2.2 Key Performance Indicators
• Public and travel industry clients are satisfied with the department’s efficiency and effectiveness in delivering passport services, with passport issues dealt with in a timely and responsive manner.
• Staged delivery of the National Security – Improved Passport Integrity and Strengthened Issuance Systems program within budget and against timelines.
• Prevention, detection and prosecution of passport fraud.

DFAT Budget Statements
52
Outcome 3: A secure Australian Government presence overseas through the provision of security services and information and communication technology infrastructure, and the management of the Commonwealth’s overseas property estate
Outcome 3 strategy
The department continues to prioritise the security and safety of Australian
Government personnel overseas and their dependants, the security of its diplomatic
and consular posts and the safeguarding of Government information commensurate
with an environment of increasing security risk. This will require the implementation
and maintenance of comprehensive and effective strategic risk mitigation strategies
and operational security measures.
The department will work to enhance information and communications technology (ICT) capabilities, at home and at Australia’s overseas missions. It will continue to respond to emerging influences on its ICT operating environment, including the increasing use of the internet, a greater focus on whole of government programs and solutions, and a continuing increase in the number of staff from other agencies using departmental ICT systems and a challenging cyber-threat environment.
The department will continue to manage the Government’s overseas property estate in an efficient and effective manner. The department’s forward plan for maintaining, upgrading and refurbishing the overseas property estate will continue with the objective of meeting the Government’s accommodation needs and enhancing the estate’s value. The department will more efficiently manage the overseas estate by examining where co-location of overseas missions with likeminded countries may be both practical and in our national interest. In managing the estate, the department will remain focused on providing an appropriate level of protective security, and capability to respond promptly when new or unforeseen security-related challenges arise.
Outcome expense statement
Table 2.1.3 provides an overview of the total expenses for Outcome 3, by programme.

DFAT Budget Statements
53
Table 2.1.3: Budgeted expenses for Outcome 3
Outcome 3: A secure Australian presence overseas through
the provision of security services and information and
communication technology infrastructure, and the
management of the Commonwealth's overseas owned estate
2014-15
Estimated
actual
expenses
$'000
2015-16
Estimated
expenses
$'000
Programme 3.1: Foreign Affairs and Trade Security and IT
Departmental expenses
Foreign Affairs and Trade Security and IT (a) 198,526 193,343
Expenses not requiring appropriation in the Budget year (b) 10,023 10,026
Total for programme 3.1 208,549 203,369
Programme 3.2: Overseas Property
Departmental expenses
Special Accounts (c) 219,264 158,785
Expenses not requiring appropriation in the Budget year (b) 28,503 31,472
Total for programme 3.2 247,767 190,257
Outcome 3 Totals by appropriation type
Departmental expenses
Departmental appropriation (a) 198,526 193,343
Special accounts 219,264 158,785
Expenses not requiring appropriation in the Budget year (b) 38,526 41,498
Total expenses for Outcome 3 456,316 393,626
2014-15 2015-16
Average staffing level (number) 872 874 (a) Departmental appropriation combines ‘Ordinary annual services (Appropriation Bill No. 1)’ and ‘Revenue
from independent sources (s 74)’. (b) Expenses not requiring appropriation in the Budget year are made up of depreciation expenses,
amortisation expenses, makegood expenses, and audit fees. (c) This reflects actual cash disbursement from the property account. Note: Departmental appropriation splits and totals are indicative estimates and may change in the course of the budget year as government priorities change.

DFAT Budget Statements
54
Contributions to Outcome 3
Programme 3.1: Foreign Affairs and Trade Security and IT
Programme objective
• To ensure a secure Australian Government presence overseas for personnel, assets and information by sustaining and improving physical and operational security.
• To strengthen information and communications technology (ICT) capability at Australia’s missions overseas and DFAT offices in Australia.
Programme expenses
2014-15
Estimated
actual
$'000
2015-16
Budget
$'000
2016-17
Forw ard
estimate
$'000
2017-18
Forw ard
estimate
$'000
2018-19
Forw ard
estimate
$'000
Annual departmental expenses:
Foreign Affairs and Trade Security and IT 198,526 193,343 196,705 146,362 146,634
Expenses not requiring appropriation in the
Budget year (a) 10,023 10,026 10,026 10,026 10,512
Total programme expenses 208,549 203,369 206,731 156,388 157,146 (a) Expenses not requiring appropriation in the Budget year are made up of depreciation expenses,
amortisation expenses, makegood expenses, and audit fees.
Programme 3.1 Deliverables
• Strengthened physical and operational security mitigation measures commensurate with the evolving international security environment.
• Protection of official information through effective management of ICT systems, security vetting processes, and security training to ensure high standards of security awareness and vigilance.
• Continued progress in moving the department’s ICT systems infrastructure to a common platform that can be more efficiently integrated and supported, and implementation of key elements of the Government’s ICT Reform Program and ICT elements of the Government’s national security policy and objectives.
• High-quality overseas ICT services to other government agencies. • Ongoing implementation of the International Communications Network –
upgrade program.

DFAT Budget Statements
55
Programme 3.1 Key Performance Indicators
• Effective threat analysis, risk assessments and mitigation strategies appropriate to increased security risks, including timely and effective responses to security incidents.
• Reduced security risks to official information, through a strengthened security culture, evidenced by fewer security breaches.
• Client satisfaction with the accessibility, reliability and effectiveness of the secure
cable network (Official Diplomatic Information Network) and the global secure telecommunications infrastructure.
• Staged delivery of the International Communications Network – upgrade
program within budget and against timelines.

DFAT Budget Statements
56
Programme 3.2: Overseas Property
Programme objective
• To ensure a secure Australian Government presence overseas through the effective management of the Commonwealth’s overseas owned estate and of the contracts for the leased estate.
Programme expenses
2014-15
Estimated
actual
$'000
2015-16
Budget
$'000
2016-17
Forw ard
estimate
$'000
2017-18
Forw ard
estimate
$'000
2018-19
Forw ard
estimate
$'000
Annual departmental expenses:
Overseas Property Special Account (a) 219,264 158,785 141,362 162,073 131,541
Expenses not requiring appropriation in the
Budget year (b) 28,503 31,472 33,934 38,685 43,415
Total programme expenses 247,767 190,257 175,296 200,758 174,956 (a) This reflects actual cash disbursements from the property account. (b) Expenses not requiring appropriation in the Budget year are made up of depreciation expenses,
amortisation expenses, makegood expenses, and audit fees.
Programme 3.2 Deliverables
• Efficient and effective management and delivery of a substantial construction and refurbishment program in the overseas property estate, including:
― completion of the Jakarta chancery; and
― commencement of planning to construct a new chancery in Washington.
• Efficient and effective management of the overseas property estate to meet the Government’s requirements and maintain conditions and service capabilities.
• Effective management of outsourced property contract arrangements.
Programme 3.2 Key Performance Indicators
• Completion of construction and refurbishment projects within an agreed timeframe and budget.
• Effective and accountable management of the property services contract and construction project contracts.
• Achieve a portfolio condition and utility rating of good or better.

DFAT Budget Statements
57
• The majority of tenants rate the performance of the service provider and the Overseas Property Office as good or better.
• Asset management plans are in place for all owned properties in the estate.
• Achieve a management expense ratio appropriate to the unique nature of the Commonwealth’s overseas owned estate.

DFAT Budget Statements
58
Section 3: Explanatory tables and budgeted financial statements
Section 3 presents explanatory tables and budgeted financial statements which provide
a comprehensive snapshot of entity finances for the 2015-16 Budget year. It explains
how budget plans are incorporated into the financial statements and provides further
details of the reconciliation between appropriations and programme expenses,
movements in administered funds, special accounts and government indigenous
expenditure.
3.1 EXPLANATORY TABLES
3.1.1 Movement of administered funds between years(a)
Administered funds can be provided for a specified period, for example under annual
Appropriation Acts. Funds not used in the specified period with the agreement of the
Finance Minister may be moved to a future year. Table 3.1.1 shows the movement of
administered funds approved between years.
Table 3.1.1: Movement of administered funds between years
2014-15
$'000
2015-16
$'000
2016-17
$'000
2017-18
$'000
2018-19
$'000
Outcome 1, Programme 1.7: Public
Information Services and Public
Diplomacy
Public Information Services and Public
Diplomacy- Bali Peace Park (a) (450) 450 - - -
Total movement of administered
funds (450) 450 - - - (a) Figures displayed as a negative (-) represent a decrease in funds and a positive reflect an increase in
funds.

DFAT Budget Statements
59
3.1.2 Special accounts
Special accounts provide a means to set aside and record amounts used for specified
purposes. Special accounts can be created by a Finance Minister’s determination
under section 78 of the PGPA Act or under separate enabling legislation (section 80 of
the PGPA Act refers). Table 3.1.2 shows the expected additions (receipts) and
reductions (payments) for each account used by DFAT.
Table 3.1.2: Estimates of special account flows and balances Outcome Opening
balance
$'000
Receipts
$'000
Payments
$'000
Adjustments
$'000
Closing
balance
$'000
Administered Payments and Receipts for
Other Entities Special Account - s20 FMA
Act Det 2000/13 (A) - 2015-16
1 5,000 250,000 (250,000) - 5,000
Administered Payments and Receipts for
Other Entities Special Account - s20 FMA
Act Det 2000/13 (A) - 2015-16
1 5,000 250,000 (250,000) - 5,000
Consular Services Special Account - s20
FMA Act Det 2005/38 (A) - 2015-162 34 100 (100) - 34
Consular Services Special Account - s20
FMA Act Det 2005/38 (A) - 2014-152 34 100 (100) - 34
-
Expositions Special Accounts - s20 FMA
Act Det 2007/14 (A) 2015-16 (A) - 2015-161 994 - - - 994
Expositions Special Accounts - s20 FMA
Act Det 2007/14 (A) - 2014-151 994 - - - 994
Australia-Indonesia Partnership for
Reconstruction and Development (Loans)
Special Account - s20 FMA Act Det
2005/03 (A) - 2014-15 (a)
1 38,057 - (19,282) (18,775) -
-Australia-Indonesia Partnership for
Reconstruction and Development (Loans)
Special Account - s78 PGPA Act
Determination 2015/01 (A) - 2015-16
1 - - - - -
Australia-Indonesia Partnership for
Reconstruction and Development (Loans)
Special Account - s78 PGPA Act
Determination 2015/01 (A) - 2014-15
1 - 18,775 (18,775) - -
Table continued on the following page.

DFAT Budget Statements
60
Table 3.1.2: Estimates of special account flows and balances (continued) Outcome Opening
balance
$'000
Receipts
$'000
Payments
$'000
Adjustments
$'000
Closing
balance
$'000
Services for Other Entities and Trust Monies -
s20 FMA Act Det 2009/25 (A) - 2015-161 6,977 7,000 (7,000) 6,977
Services for Other Entities and Trust
Monies - s20 FMA Act Det 2009/25 (A) -
2014-15
1 6,977 7,000 (7,000) 6,977
Overseas Property Special Account - DFAT -
s20 FMA Act Det 2002/01 (D) - 2015-163 154,027 95,576 (158,785) 90,818
Overseas Property Special Account -
DFAT - s20 FMA Act Det 2002/01 (D) -
2014-15
3 281,327 91,964 (219,264) 154,027
Total Special Accounts
2015-16 Budget estimate 167,032 352,676 (415,885) 103,823
Total Special Accounts
2014-15 estimated actual 332,389 367,839 (514,421) (18,775) 167,032 (A) = Administered (D) = Departmental (a) Note that this account was closed in April 2015 and replaced with the Australia-Indonesia Partnership
for Reconstruction and Development (Loans) Special Account - s78 PGPA Act Determination 2015/01.
3.1.3 Australian Government Indigenous expenditure
Table 3.1.3: Australian Government Indigenous expenditure (AGIE)
Outcome
Approp
Bill No.
1
$'000
(A)
Approp
Bill No.
2
$'000
(B)
Special
approp
$'000
(C)
Total
approp
$'000
(D)
Other
$'000
(E)
Total
$'000
(F)=
(D)+(E)
Programme
(G)
Department of Foreign Affairs
and Trade
Outcome 1
Departmental 2015-16 1,000 - - 1,000 - 1,000 1.1
Departmental 2014-15 995 - - 995 - 995 1.1
Total outcome 1 2015-16 1,000 - - 1,000 - 1,000
Total outcome 1 2014-15 995 - - 995 - 995
Total Departmental
2015-161,000 - - 1,000 - 1,000
Total Departmental 2014-15 995 - - 995 - 995
Total AGIE 2015-16 1,000 - - 1,000 - 1,000
Total AGIE 2014-15 995 - - 995 - 995
DFAT Budget Statements
61
3.2 BUDGETED FINANCIAL STATEMENTS
3.2.1 Differences in entity resourcing and financial statements
In accordance with the Government Finance Statistics provided by the Australian
Bureau of Statistics, the budgeted financial statements do not recognise concessionality
and the associated discounting of concessional loans. Australian Accounting
Standards require concessional loans to reflect a market related rate of interest and be
discounted over the loan maturity period. DFAT has two programs that are affected
by this treatment:
Asian Development Fund replenishments – investment component; and
International Development Association replenishments – investment
component.
The investment component does not impact on the fiscal or underlying cash balances,
as the provision of a loan only affects the composition of the Australian Government
investment in financial assets.
3.2.2 Analysis of budgeted financial statements
Budgeted Departmental Income Statement
The total budgeted appropriation in 2015-16 is $1,347.8 million, which represents an
increase of $61.9 million in appropriations from 2014-15 as shown in Table 3.2.1. The
increase is primarily attributable to:
• funding for new measures;
• parameter adjustments for overseas inflation; and
• foreign exchange movements.
This is partially offset by:
savings measures agreed in the 2013-14 Mid-Year Economic and Fiscal Outlook;
parameter adjustments for domestic inflation;
re-classification of operating funding to capital funding; and
offsets for new measures.
The Income Statement shows a budgeted deficit in 2015-16 of $77.2 million, due to the
removal of appropriation funding for depreciation and amortisation under the Net
Cash funding arrangements. Adjusting for the changed funding arrangements, the
operating result attributable to the department is a surplus of $40.4 million in 2015-16,
all of which relates to the Overseas Property Special Account (OPSA).

DFAT Budget Statements
62
Budgeted Departmental Balance Sheet
The department will receive an equity injection of $205.2 million in 2015-16 for the
purchase or construction of new assets. The department will also receive $52.2 million
through its Departmental Capital Budget to fund the replacement of existing assets.
For 2015-16, the department’s non-financial asset position is budgeted to be $3,175.2
million at year-end. The major asset component is $2,548.6 million for Land and
Buildings which includes $2,372.0 million managed in the OPSA.
Schedule of Budgeted Income and Expenses Administered on behalf of the Government
In 2015-16 DFAT will receive administered appropriation of $3,579.9 million
(excluding capital funding) for programs administered on behalf of the Government.
The significant decrease in appropriations of $950.9 million from 2014-15 is due
primarily to the reduction in expenditure on the Australian Aid Program.
Administered expenses for ‘International Development Assistance’ are budgeted at
$3,105.4 million, a decrease of $374.1 million from the 2014-15 estimated actual.
Administered expenses for ‘Other – International Development Assistance program’ is
budgeted at $0.0 million, a decrease of $659.6 million from the 2014–15 estimated
actual. This is due to the restructure of the aid program where from 1 July 2015, with
the exception of new pledges to multilateral replenishments, all future estimates have
been merged into the ‘International Development Assistance’ line.
This reduction has been partially offset by forecast increases in estimated payments to
International Organisations and United Nations Peacekeeping Operations of
$87.3 million and an increase of $16.8 million for the New Colombo Plan –
Transforming Regional Relationships.
Expenses under ‘Concessional loan discount’ relate to the discounting of the Australia
Indonesia Partnerships for Reconstruction and Development (AIPRD) loans.
Expenses under ‘Concessional investment discount’ relate to the discounting of the
investment components of the replenishments for the International Development
Association (IDA) and the Asian Development Fund (ADF).
Schedule of Budgeted Assets and Liabilities Administered on behalf of the Government
Administered assets and liabilities administered on behalf of the Government are
budgeted at $4,154.2 million and $1,947.2 million respectively for the year ending
30 June 2016.
Administered assets are expected to decrease in 2015-16 by $226.2 million. This is due
primarily to no new multilateral replenishments being entered into in 2015-16.

DFAT Budget Statements
63
Administered liabilities are expected to decrease in 2015-16 by $313.4 million. This is
due primarily to reduced liabilities for existing multilateral replenishments.
Schedule of Budgeted Administered Cash Flows
Administered cash receipts is primarily comprised of receipts from passport and
consular services and is budgeted at $517.8 million, an increase of $41.9 million.
Administered cash used in 2015-16 is estimated to decrease by $985.4 million
compared to 2014-15. This is due primarily to the reduction in expenditure on the
Australian Aid Program.

DFAT Budget Statements
64
3.2.3 Budgeted financial statements tables
Table 3.2.1: Comprehensive income statement (showing net cost of services) for the period ended 30 June
2014-15
Estimated
actual
$'000
2015-16
Budget
$'000
2016-17
Forw ard
estimate
$'000
2017-18
Forw ard
estimate
$'000
2018-19
Forw ard
estimate
$'000
EXPENSES
Employee benefits 714,888 730,089 735,281 719,059 721,884
Suppliers 635,433 682,736 688,710 601,945 606,691
Grants 5,000 5,000 4,930 4,930 4,930
Depreciation and amortisation 115,169 117,579 120,023 124,774 126,201
Other expenses 103 103 102 102 102
Total expenses 1,470,593 1,535,507 1,549,046 1,450,810 1,459,808
LESS:
OWN-SOURCE INCOME
Own-source revenue
Sale of goods and rendering of services 73,299 73,299 73,299 73,299 73,299
Rental income 27,980 28,240 32,803 34,213 35,270
Other 8,300 8,300 8,300 8,300 8,300
Total own-source revenue 109,579 109,839 114,402 115,812 116,869
Gains
Other 680 687 694 701 708
Gain on sale of asset - - 21,345 102,698 -
Total gains 680 687 22,039 103,399 708
Total own-source income 110,259 110,526 136,441 219,211 117,577
Net cost of/(contribution by)
services 1,360,334 1,424,981 1,412,605 1,231,599 1,342,231
Revenue from Government 1,285,926 1,347,819 1,364,749 1,257,177 1,266,669
Deficit attributable to the Australian
Government (74,408) (77,162) (47,856) 25,578 (75,562)
OTHER COMPREHENSIVE INCOME
Changes in asset revaluation surplus - - - - -
Total other comprehensive income - - - - -
Total comprehensive loss (74,408) (77,162) (47,856) 25,578 (75,562)
Total comprehensive loss
attributable to the Australian
Government (74,408) (77,162) (47,856) 25,578 (75,562) Table continued on the following page.

DFAT Budget Statements
65
Table 3.2.1: Comprehensive income statement (showing net cost of services) for the period ended 30 June (continued)
2014-15
$'000
2015-16
$'000
2016-17
$'000
2017-18
$'000
2018-19
$'000
Total comprehensive income
excluding depreciation/amortisation
expenses previously funded
through revenue appropriations40,761 40,417 72,167 150,352 50,639
less depreciation/amortisation
expenses previously funded through
revenue appropriations (a)115,169 117,579 120,023 124,774 126,201
Total comprehensive loss - as per
the statement of comprehensive
income (74,408) (77,162) (47,856) 25,578 (75,562) (a) From 2010-11, the Government introduced net cash arrangements where Bill 1 revenue appropriations
for the depreciation/amortisation expenses of non-corporate Commonwealth entities (and select corporate Commonwealth entities) were replaced with a separate capital budget (the Departmental Capital Budget, or DCB) provided through Bill 1 equity appropriations. For information regarding DCBs, please refer to Table 3.2.5 Departmental Capital Budget Statement.
Prepared on Australian Accounting Standards basis.

DFAT Budget Statements
66
Table 3.2.2: Budgeted departmental balance sheet (as at 30 June)
2014-15
Estimated
actual
$'000
2015-16
Budget
$'000
2016-17
Forw ard
estimate
$'000
2017-18
Forw ard
estimate
$'000
2018-19
Forw ard
estimate
$'000
ASSETS
Financial assets
Cash and cash equivalents 73,716 73,716 73,716 73,716 73,716
Trade and other receivables 933,817 834,902 844,694 883,009 880,521
Total financial assets 1,007,533 908,618 918,410 956,725 954,237
Non-financial assets
Land and buildings 2,424,884 2,548,563 2,616,129 2,655,436 2,764,476
Property, plant and equipment 221,068 424,853 456,183 495,815 521,175
Intangibles 78,481 81,868 78,792 83,972 84,208
Inventories 35,326 28,326 28,326 28,326 28,326
Other non-financial assets 91,227 91,608 91,991 94,376 94,763
Total non-financial assets 2,850,986 3,175,218 3,271,421 3,357,925 3,492,948
Assets held for sale
Total assets 3,858,519 4,083,836 4,189,831 4,314,650 4,447,185
LIABILITIES
Payables
Suppliers 107,306 115,943 118,583 79,226 79,872
Other payables 36,193 36,193 36,193 36,193 36,193
Total payables 143,499 152,136 154,776 115,419 116,065
Provisions
Employee provisions 243,715 244,934 246,159 247,390 248,627
Other provisions 22,981 23,096 23,211 23,327 23,444
Total provisions 266,696 268,030 269,370 270,717 272,071
Total liabilities 410,195 420,166 424,146 386,136 388,136
Net assets 3,448,324 3,663,670 3,765,685 3,928,514 4,059,049
EQUITY*
Parent entity interest
Contributed equity 2,148,985 2,406,397 2,547,725 2,634,271 2,712,700
Reserves 777,915 813,011 821,554 872,259 999,927
Retained surplus 521,424 444,262 396,406 421,984 346,422
Total parent entity interest 3,448,324 3,663,670 3,765,685 3,928,514 4,059,049
Total Equity 3,448,324 3,663,670 3,765,685 3,928,514 4,059,049 * ‘Equity’ is the residual interest in assets after deduction of liabilities. Prepared on Australian Accounting Standards basis.

DFAT Budget Statements
67
Table 3.2.3: Departmental statement of changes in equity — summary of movement (Budget year 2015-16)
Retained
earnings
$'000
Asset
revaluation
reserve
$'000
Contributed
equity/ capital
$'000
Total equity
$'000
Opening balance as at 1 July 2015
Balance carried forw ard from previous
period 521,424 777,915 2,148,985 3,448,324
Adjusted opening balance 521,424 777,915 2,148,985 3,448,324
Comprehensive income
Other comprehensive income - 35,096 - 35,096
Surplus/(deficit) for the period (77,162) - - (77,162)
Total comprehensive income (77,162) 35,096 - (42,066)
of w hich:
Attributable to the Australian
Government (77,162) 35,096 - (42,066)
Transactions with owners
Distributions to owners
Returns of capital:
Cash transfer to the OPA - - - -
Contributions by owners
Equity Injection - Appropriation - - 205,241 205,241
Departmental Capital Budget (DCB) - - 52,171 52,171
Sub-total transactions with owners - - 257,412 257,412
Estimated closing balance as at 30
June 2016 444,262 813,011 2,406,397 3,663,670
Closing balance attributable to the
Australian Government 444,262 813,011 2,406,397 3,663,670 Prepared on Australian Accounting Standards basis.

DFAT Budget Statements
68
Table 3.2.4: Budgeted departmental statement of cash flows (for the period ended 30 June)
2014-15
Estimated
actual
$'000
2015-16
Budget
$'000
2016-17
Forw ard
estimate
$'000
2017-18
Forw ard
estimate
$'000
2018-19
Forw ard
estimate
$'000
OPERATING ACTIVITIES
Cash received
Appropriations 1,285,926 1,347,819 1,364,749 1,257,177 1,266,669
Sale of goods and rendering of
services 109,579 109,839 114,402 115,812 116,869
Total cash received 1,395,505 1,457,658 1,479,151 1,372,989 1,383,538
Cash used
Employees 714,888 728,870 734,056 717,828 720,647
Suppliers 674,856 723,685 743,869 689,563 657,859
Other 5,103 5,103 5,032 5,032 5,032
Total cash used 1,394,847 1,457,658 1,482,957 1,412,423 1,383,538
Net cash from/(used by) operating
activities 658 - (3,806) (39,434) -
INVESTING ACTIVITIES
Cash received
Proceeds from sales of property, plant
and equipment - - 21,345 102,698 -
Total cash received - - 21,345 102,698 -
Cash used
Purchase of property, plant, equipment
and intangibles 242,294 535,016 313,092 111,764 178,291
Total cash used 242,294 535,016 313,092 111,764 178,291
Net cash from/(used by) investing
activities (242,294) (535,016) (291,747) (9,066) (178,291)
FINANCING ACTIVITIES
Cash received
Contributed equity 137,034 230,404 69,892 39,898 5,806
Other 105,260 304,612 243,200 71,866 172,485
Total cash received 242,294 535,016 313,092 111,764 178,291
Cash used
Returns of equity 658 - 17,539 63,264 -
Total cash used 658 - 17,539 63,264 -
Net cash used by financing activities 241,636 535,016 295,553 48,500 178,291
Net increase in cash held - - - - -
Cash and cash equivalents at the
beginning of the reporting period 73,716 73,716 73,716 73,716 73,716
Cash and cash equivalents at the
end of the reporting period 73,716 73,716 73,716 73,716 73,716 Prepared on Australian Accounting Standards basis.

DFAT Budget Statements
69
Table 3.2.5: Departmental capital budget statement (for the period ended 30 June)
2014-15
Estimated
actual
$'000
2015-16
Budget
$'000
2016-17
Forw ard
estimate
$'000
2017-18
Forw ard
estimate
$'000
2018-19
Forw ard
estimate
$'000
NEW CAPITAL APPROPRIATIONS
Capital budget - Bill 1 (DCB) 53,032 52,171 52,010 47,730 72,623
Equity injections - Bill 2 121,064 205,241 69,892 38,816 5,806
Total new capital appropriations 174,096 257,412 121,902 86,546 78,429
Provided for:
Purchase of non-financial assets 174,096 257,412 121,902 86,546 78,429
Total Items 174,096 257,412 121,902 86,546 78,429
PURCHASE OF NON-FINANCIAL
ASSETS
Funded by capital appropriations (a) 137,034 230,404 69,892 39,898 5,806
Funded by capital appropriation -
DCB (b) 53,032 52,171 52,010 47,730 72,623
Funded internally from departmental
resources (c) 52,228 252,441 191,190 24,136 99,862
TOTAL 242,294 535,016 313,092 111,764 178,291
RECONCILIATION OF CASH USED TO
ACQUIRE ASSETS TO ASSET
MOVEMENT TABLE
Total purchases 242,294 535,016 313,092 111,764 178,291
Total cash used to acquire assets 242,294 535,016 313,092 111,764 178,291 (a) Includes both current Bill 2 and prior Act 2/4/6 appropriations and special capital appropriations. (b) Does not include annual finance lease costs. Includes purchases from current and previous years’
Departmental Capital Budgets (DCBs). (c) Includes the following sources of funding:
- current Bill 1 and prior year Act 1/3/5 appropriations (excluding amounts from the DCB); - internally developed assets; - s74 Retained revenue receipts; and - proceeds from the sale of assets.
Prepared on Australian Accounting Standards basis.

DFAT Budget Statements
70
Table 3.2.6: Statement of asset movements (Budget year 2015-16) Land
$'000
Buildings
$'000
Other
property,
plant and
equipment
Computer
softw are
and
intangibles
Total
$'000
As at 1 July 2015
Gross book value 1,247,470 1,024,667 370,592 110,805 2,753,534
Accumulated depreciation/amortisation
and impairment - (138,431) (149,524) (72,324) (360,279)
Work in progress - 291,178 - 40,000 331,178
Opening net book balance 1,247,470 1,177,414 221,068 78,481 2,724,433
Capital asset additions
Estimated expenditure on new or
By purchase - appropriation equity (a) - - 220,981 9,423 230,404
By purchase - appropriation ordinary
annual services (b) - 277,336 27,276 - 304,612
Total additions - 277,336 248,257 9,423 535,016
Other movements
Depreciation/amortisation expense - (67,071) (44,472) (6,036) (117,579)
Other 9,749 25,347 - - 35,096
Work in progress movements (121,682) - - (121,682)
Total other movements 9,749 (163,406) (44,472) (6,036) (204,165)
As at 30 June 2016
Gross book value 1,257,219 1,327,350 618,849 120,228 3,323,646
Accumulated depreciation/amortisation
and impairment - (205,502) (193,996) (78,360) (477,858)
Work in progress - 169,496 - 40,000 209,496
Closing net book balance 1,257,219 1,291,344 424,853 81,868 3,055,284 (a) ‘Appropriation equity’ refers to equity injections appropriations provided through Appropriation Bill (No. 2)
2015-16. (b) ‘Appropriation ordinary annual services’ refers to funding provided through Appropriation Bill (No. 1)
2015-16 for depreciation/amortisation expenses, or other operational expenses. Prepared on Australian Accounting Standards basis.
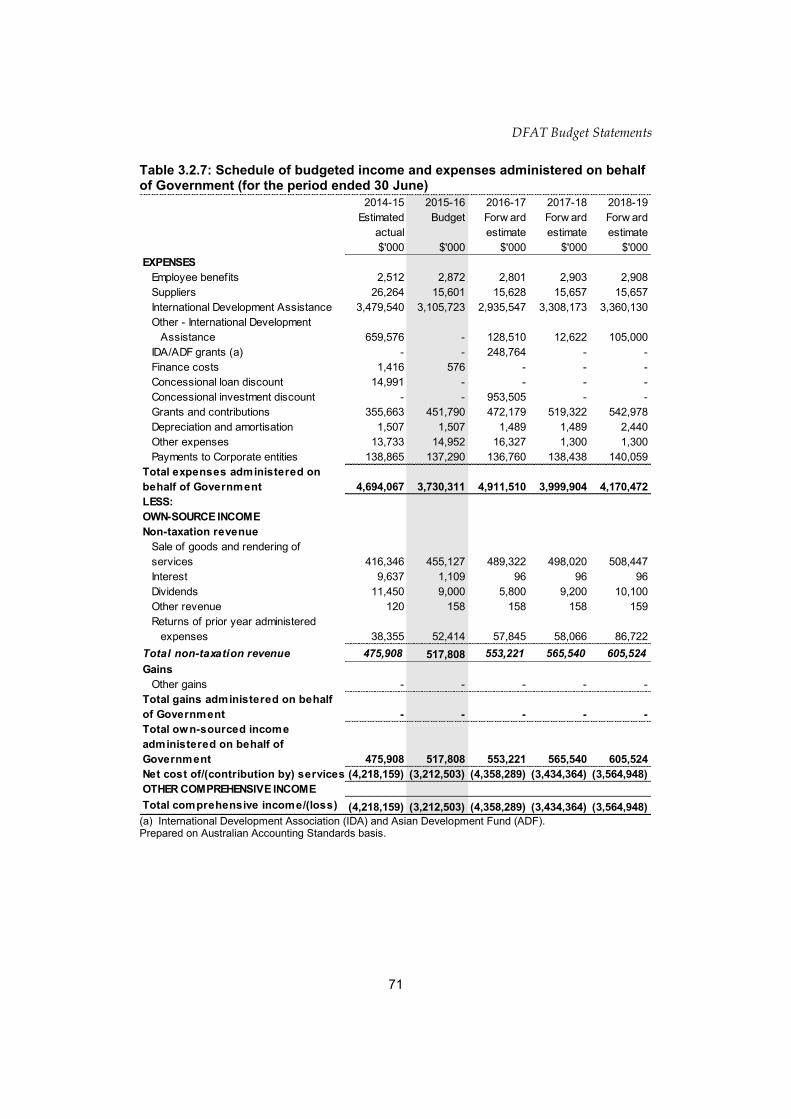
DFAT Budget Statements
71
Table 3.2.7: Schedule of budgeted income and expenses administered on behalf of Government (for the period ended 30 June)
2014-15
Estimated
actual
$'000
2015-16
Budget
$'000
2016-17
Forw ard
estimate
$'000
2017-18
Forw ard
estimate
$'000
2018-19
Forw ard
estimate
$'000
EXPENSES
Employee benefits 2,512 2,872 2,801 2,903 2,908
Suppliers 26,264 15,601 15,628 15,657 15,657
International Development Assistance 3,479,540 3,105,723 2,935,547 3,308,173 3,360,130
Other - International Development
Assistance 659,576 - 128,510 12,622 105,000
IDA/ADF grants (a) - - 248,764 - -
Finance costs 1,416 576 - - -
Concessional loan discount 14,991 - - - -
Concessional investment discount - - 953,505 - -
Grants and contributions 355,663 451,790 472,179 519,322 542,978
Depreciation and amortisation 1,507 1,507 1,489 1,489 2,440
Other expenses 13,733 14,952 16,327 1,300 1,300
Payments to Corporate entities 138,865 137,290 136,760 138,438 140,059
Total expenses administered on
behalf of Government 4,694,067 3,730,311 4,911,510 3,999,904 4,170,472
LESS:
OWN-SOURCE INCOME
Non-taxation revenue
Sale of goods and rendering of
services 416,346 455,127 489,322 498,020 508,447
Interest 9,637 1,109 96 96 96
Dividends 11,450 9,000 5,800 9,200 10,100
Other revenue 120 158 158 158 159
Returns of prior year administered
expenses 38,355 52,414 57,845 58,066 86,722
Total non-taxation revenue 475,908 517,808 553,221 565,540 605,524
Gains
Other gains - - - - -
Total gains administered on behalf
of Government - - - - -
Total own-sourced income
administered on behalf of
Government 475,908 517,808 553,221 565,540 605,524
Net cost of/(contribution by) services (4,218,159) (3,212,503) (4,358,289) (3,434,364) (3,564,948)
OTHER COMPREHENSIVE INCOME
Total comprehensive income/(loss) (4,218,159) (3,212,503) (4,358,289) (3,434,364) (3,564,948) (a) International Development Association (IDA) and Asian Development Fund (ADF). Prepared on Australian Accounting Standards basis.

DFAT Budget Statements
72
Table 3.2.8: Schedule of budgeted assets and liabilities administered on behalf of Government (as at 30 June)
2014-15
Estimated
actual
$'000
2015-16
Budget
$'000
2016-17
Forw ard
estimate
$'000
2017-18
Forw ard
estimate
$'000
2018-19
Forw ard
estimate
$'000
ASSETS
Financial assets
Cash and cash equivalents 16,414 16,414 16,414 16,414 16,414
Trade and other receivables 16,033 16,709 16,709 16,709 16,709
Loans and receivables 124,984 125,151 125,701 126,251 126,801
Investments (IDA/ADF)(a) 1,544,835 1,544,835 1,694,835 1,694,835 1,694,835
Investment accounted for
using the equity method 442,249 442,249 442,249 442,249 442,249
Appropriation receivable
- other 2,212,723 1,984,820 3,102,979 2,750,258 2,596,545
Appropriation receivable
- special accounts 13,005 13,005 13,005 13,005 13,005
Total financial assets 4,370,243 4,143,183 5,411,892 5,059,721 4,906,558
Non-financial assets
Leasehold improvements 2,938 3,759 4,638 4,124 3,717
Infrastructure, plant and equipment 11 26 41 1,509 1,980
Intangibles 5,136 5,118 5,118 5,118 5,118
Other non-financial assets 2,089 2,089 2,089 2,089 2,089
Total non-financial assets 10,174 10,992 11,886 12,840 12,904
Total assets administered on behalf
of Government 4,380,417 4,154,175 5,423,778 5,072,561 4,919,462
LIABILITIES
Payables
Suppliers 75,071 75,443 75,445 75,447 75,449
IDA/ADF grant component (a) 378,004 299,767 466,409 388,834 326,415
IDA/ADF concessional component (a) 1,280,336 1,022,377 1,850,047 1,590,742 1,385,998
Aid programme payable 372,872 392,467 489,342 473,345 586,788
Other payables 134,243 136,723 138,992 138,994 138,997
Total payables 2,240,526 1,926,777 3,020,235 2,667,362 2,513,647
Provisions
Employee provisions 13,184 13,184 13,184 13,184 13,184
Other provisions 6,888 7,263 7,265 7,267 7,269
Total provisions 20,072 20,447 20,449 20,451 20,453
Total liabilities administered on
behalf of Government 2,260,598 1,947,224 3,040,684 2,687,813 2,534,100
Net assets 2,119,819 2,206,951 2,383,094 2,384,748 2,385,362 (a) International Development Association (IDA) and Asian Development Fund (ADF). Prepared on Australian Accounting Standards basis.

DFAT Budget Statements
73
Table 3.2.9: Schedule of budgeted administered cash flows (for the period ended 30 June)
2014-15
Estimated
actual
$'000
2015-16
Budget
$'000
2016-17
Forw ard
estimate
$'000
2017-18
Forw ard
estimate
$'000
2018-19
Forw ard
estimate
$'000
OPERATING ACTIVITIES
Cash received
Sales of goods and rendering of
services 416,346 455,127 489,322 498,020 508,447
Interest 9,637 1,109 96 96 96
Dividends 11,450 9,000 5,800 9,200 10,100
Return of prior year administered
expenses 38,355 52,414 57,845 58,066 86,722
Other 120 158 158 158 159
Total cash received 475,908 517,808 553,221 565,540 605,524
Cash used
Grants and contributions 908,372 451,790 472,179 519,322 542,978
Personal benefits 2,512 2,872 2,801 2,903 2,908
International Development
Assistance 3,837,406 3,479,378 3,336,921 3,681,347 3,661,367
Suppliers 26,264 15,601 15,628 15,657 15,657
Borrow ing costs 1,416 576 - - -
Payments to corporate entities 138,865 137,290 136,760 138,438 140,059
Cash to OPA 475,788 517,650 553,063 565,382 605,365
Total cash used 5,390,623 4,605,157 4,517,352 4,923,049 4,968,334
Net cash used by operating
activities(4,914,715) (4,087,349) (3,964,131) (4,357,509) (4,362,810)
INVESTING ACTIVITIES
Cash used
Purchase of property, plant and
equipment 2,293 2,325 2,383 2,443 2,504
Purchase of concessional
f inancial instruments 200,000 - - - -
Total cash used 202,293 2,325 2,383 2,443 2,504
Net cash used by investing
activities(202,293) (2,325) (2,383) (2,443) (2,504)
Net increase/(decrease)
in cash held (5,117,008) (4,089,674) (3,966,514) (4,359,952) (4,365,314)
Cash and cash equivalents at
beginning of reporting period16,414 16,414 16,414 16,414 16,414
Cash from Official Public Account for:
- Appropriations 4,574,619 3,740,723 3,595,887 4,033,177 4,110,648
- Special accounts
- Capital Appropriations 540,096 346,626 368,244 324,332 252,162
- Administered Capital Budget 2,293 2,325 2,383 2,443 2,504
Total cash from Official Public
Account 5,117,008 4,089,674 3,966,514 4,359,952 4,365,314
Cash and cash equivalents at end
of reporting period 16,414 16,414 16,414 16,414 16,414 Prepared on Australian Accounting Standards basis.

DFAT Budget Statements
74
Table 3.2.10: Administered capital budget statement (for the period ended 30 June)
2014-15
Estimated
actual
$'000
2015-16
Budget
$'000
2016-17
Forw ard
estimate
$'000
2017-18
Forw ard
estimate
$'000
2018-19
Forw ard
estimate
$'000
NEW CAPITAL APPROPRIATIONS
Capital budget - Bill 1 (ACB) 2,293 2,325 2,383 2,443 2,504
Administered Assets and Liabilities
- Bill 2 212,698 13,527 1,118,957 150 -
Total new capital appropriations 214,991 15,852 1,121,340 2,593 2,504
Provided for:
Purchase of non-financial assets 2,293 2,325 2,383 2,443 2,504
Other Items 212,698 13,527 1,118,957 150 -
Total items 214,991 15,852 1,121,340 2,593 2,504
PURCHASE OF NON-FINANCIAL
ASSETS
Funded by capital appropriation - ACB (a) 2,293 2,325 2,383 2,443 2,504
TOTAL 2,293 2,325 2,383 2,443 2,504
RECONCILIATION OF CASH USED TO
ACQUIRE ASSETS TO ASSET
MOVEMENT TABLE
Total accrual purchases 2,293 2,325 2,383 2,443 2,504
Total cash used to acquire assets 2,293 2,325 2,383 2,443 2,504 (a) Includes purchases from current and previous years' administered capital budgets (ACBs).

DFAT Budget Statements
75
DF
AT
Bu
dg
et Statem
ents
Table 3.2.11: Statement of administered asset movements (Budget year 2015-16)
Buildings
$'000
Other
property,
plant and
equipment
$'000
Other
$'000
Total
$'000
As at 1 July 2015
Gross book value 8,087 1,629 11,693 21,409
Accumulated depreciation/amortisation and
impairment (5,149) (1,618) (6,557) (13,324)
Opening net book balance 2,938 11 5,136 8,085
CAPITAL ASSET ADDITIONS
Estimated expenditure on new or
replacement assets
By purchase - appropriation ordinary annual
services (a) 1,830 495 - 2,325
Total additions 1,830 495 - 2,325
Other movements
Depreciation/amortisation expense (1,009) (480) (18) (1,507)
Total other movements (1,009) (480) (18) (1,507)
As at 30 June 2016
Gross book value 9,917 2,124 11,693 23,734
Accumulated depreciation/amortisation and
impairment (6,158) (2,098) (6,575) (14,831)
Closing net book balance 3,759 26 5,118 8,903 (a) ‘Appropriation ordinary annual services’ refers to funding provided through Appropriation Bill (No. 1)
2015-16 for depreciation/amortisation expenses, ACBs or other operational expenses. Prepared on Australian Accounting Standards basis.
DFAT Budget Statements
76
DF
AT
Bu
dg
et Statem
ents
3.2.4 Notes to the financial statements
Departmental Financial Statements and Schedule of Administered Activity
Under the Australian Government’s budgeting framework, and consistent with
Australian Accounting Standards, transactions that agencies control (departmental
transactions) are budgeted for, and reported on, separately to transactions which
agencies do not have control over (administered transactions). This ensures that
agencies are only held fully accountable for the transactions over which they have
control.
• Departmental items are those assets, liabilities, revenues and expenses in relation to
an agency or authority that are controlled by the agency. Departmental expenses
include employee and supplier expenses and other administrative costs, which are
incurred by the agency in providing its goods and services.
• Administered items are revenues, expenses, assets and liabilities that are managed
by an agency or authority on behalf of the Government according to set
Government directions. Administered expenses include subsidies, grants and
personal benefit payments and administered revenues include taxes, fees, fines and
excises.
Appropriations in the budgeting framework
Under the Australian Government’s budgeting framework, separate annual
appropriations are provided for:
• departmental appropriations: representing the Government’s funding for agency
programmes;
• departmental capital budget appropriations: representing the Government’s
funding through additional equity for the replacement of existing agency assets as
they reach the end of their useful life;
• departmental capital appropriations: for new investments by the Government
through additional equity;
• administered expense appropriations: for the estimated administered expenses
relating to specific programmes; and
• administered capital appropriations: for increases in administered equity through
funding non-expense administered payments.
Administered investments in controlled entities
The department has one administered investment in the Export Finance and Insurance
Corporation (EFIC) with an estimated asset value of $436.5 million as at 30 June 2016.
This investment is revalued once each financial year based on the net asset position of
EFIC as at 30 June.
Asset Valuation
In accordance with current Australian accounting standards and the Finance Minister’s
Orders, the department’s assets are carried at fair value.


DF
AT
Bu
dg
et Statem
ents
Australian Trade Commission (Austrade)
Entity resources and planned performance


81
DF
AT
Bu
dg
et Statem
ents
AUSTRALIAN TRADE COMMISSION (AUSTRADE)
Section 1: Entity overview and resources ................................................................ 83
1.1 Strategic direction statement .......................................................................... 83 1.2 Entity resource statement ............................................................................... 86 1.3 Budget measures ............................................................................................ 87
Section 2: Outcomes and planned performance ..................................................... 88 2.1 Outcomes and performance information ........................................................ 88
Section 3: Explanatory tables and budgeted financial statements ..................... 103
3.1 Explanatory tables ........................................................................................ 103
3.2 Budgeted financial statements...................................................................... 105


83
AUSTRALIAN TRADE COMMISSION (AUSTRADE)
Section 1: Entity overview and resources
1.1 STRATEGIC DIRECTION STATEMENT
The Australian Trade Commission (Austrade) is the Australian Government’s
international trade, investment and education promotion agency. Austrade also has
responsibility for policies and programs to strengthen Australia’s tourism sector.
Austrade’s outcomes are:
contribute to Australia’s economic prosperity by promoting Australia’s export and
other international economic interests through the provision of information, advice
and services to business, associations, institutions and governments; and
the protection and welfare of Australians abroad through timely and responsive
consular and passport services in specific locations overseas.
Austrade’s trade, investment, education and tourism activities play a central role in
helping to secure Australia’s future prosperity, advancing the Government’s ‘Open for
Business’ activities around the world, and promoting opportunities for Australian
businesses and institutions overseas, including those which will flow from the recent
completion of three significant trade agreements with the Republic of Korea, Japan and
China.
Drawing on its commercial knowledge, its international network, and its relationships
and connections (with international customers, investors and decision makers),
Austrade will continue to identify valuable international business opportunities for
Australian businesses and institutions, and provide them with practical advice and
services. Austrade’s unique perspective, gained from its international market presence
and its firm-level interactions, will continue to inform businesses and institutions as
well as inform policy advice to Government, including supporting the Government’s
vision for developing Northern Australia.
Austrade will continue to take the lead role in coordinating international business
missions led by ministers and the Prime Minister. The Government has provided
$9.2 million over four years to Austrade to continue the successful program of Australia
Week events in China, India, USA and ASEAN countries. Austrade will also provide
information to Australian firms on the new market access offered by recently
concluded free trade agreements, and the Government has provided $21.6 million to
Austrade (and $2.7 million to DFAT) over two years to support this activity.

Austrade Budget Statements
84
Austrade will, through its trade promotion and investment attraction activities,
continue to contribute to the Government’s economic diplomacy agenda. This work
will be closely coordinated with other agencies in the Foreign Affairs and Trade
portfolio.
Austrade’s overseas network is weighted towards growth and emerging markets that
have high commercial potential, and where Austrade’s assistance can have the most
impact. Austrade’s trade promotion work will continue to focus on markets where it is
more difficult for companies acting alone to access commercial opportunities, where
there are language, business and cultural barriers, where regulatory frameworks and
business processes are less open or transparent and where the ‘badge of government’
helps to secure commercial outcomes. In established markets, such as North America
and Europe, Austrade will continue to use partners, referrals and online services to
support Australian businesses’ trade development activities. Austrade will continue to
focus on those sectors with high growth potential and where Australia has a
comparative advantage.
Austrade will support the Government’s reinvigorated investment agenda with the
resources of its international network and its offshore and onshore investment
specialists. While Austrade’s investment promotion and attraction activities will
continue to be concentrated in North America, Western Europe and Japan, as those
markets represent Australia’s largest sources of foreign investment, Austrade will also
pursue foreign investors in other regions, including China, India, Singapore and the
Republic of Korea. The Government has provided $30.0 million to Austrade over four
years to significantly enhance Australia’s ability to attract foreign investment in the
Government’s five priority areas: food and agribusiness, resources and energy,
economic infrastructure, tourism infrastructure, and advanced manufacturing, services
and technologies sectors. This will be complemented by $5.2 million for Austrade’s
Match Australia program, which uses the occasion of major sporting events to engage
global business leaders and introduce them to opportunities in Australia. The
Government has also provided Austrade with $8.5 million to target tropical medicine
commercialisation activities (to be provided in partnership with the Department of
Industry and Science) to improve Australian researchers’ position with foreign
investors.
Austrade’s activities in key student-source markets will continue to contribute to the
growth in demand for Australian education services. Its activities will help to position
Australia as a provider of high quality education services, and contribute to the
development of a sustainable international education sector. In 2015-16, Austrade will
develop, along with the education sector, a long-term plan titled Australian
International Education 2025, for development of international markets. This plan will
support the vision of the Government’s new National Strategy for International
Education, which recognises Australian international education as a core element of
Australia’s economic prosperity, social advancement and international standing.

Austrade Budget Statements
85
Within Australia, Austrade operates in 11 locations. Its reach is extended through its
TradeStart network, managed in partnership with state, territory and local
governments and industry bodies in locations across regional and metropolitan
Australia.
Austrade’s Tourism Division will continue to have responsibility for policies to
improve the competitiveness of Australia’s tourism industry, and will continue to
implement the national long-term tourism strategy, Tourism 2020, to strengthen
Australia’s tourism industry and help grow Australia’s tourism market share.
Austrade will also continue to administer various tourism programmes to support the
Australian tourism sector.
Austrade will continue to administer the Export Market Development Grants (EMDG)
scheme, which helps small and medium-sized Australian businesses meet the
challenges associated with undertaking promotion in export markets. The EMDG
scheme is undergoing its legislated, periodic review, with the report of this review
being tabled in the second half of 2015. While Austrade will continue to administer
existing funding agreements for Asian Business Engagement (ABE) plan grants, no
new grants will be awarded.
Austrade will continue to deliver timely consular and passport services to Australians
in 17 overseas locations (at 1 July 2015).
To support the delivery of all of Austrade’s outcomes, Austrade will continue to invest
in developing the capabilities and language skills of both Australian and locally-
engaged staff.

Austrade Budget Statements
86
1.2 ENTITY RESOURCE STATEMENT
Table 1.1 shows the total resources from all sources. The table summarises how
resources will be applied by outcome and by administered and departmental
classification.
Table 1.1: Austrade resource statement — Budget estimates for 2015-16 as at Budget May 2015
Actual Estimate of Proposed at Total
Available prior year 2015-16 2015-16
Appropriation amounts Budget estimate
2014-15 available in
2015-16
$'000 $'000 $'000 $'000
Ordinary annual services (a)
Departmental appropriation
Prior year departmental appropriation (b) 37,801 42,914 - 42,914
Departmental appropriation (c) 197,528 - 221,215 221,215
s74 retained revenue receipts (d) 21,024 - 20,000 20,000
Total 256,353 42,914 241,215 284,129
Administered expenses
Outcome 1 (e) 139,400 - 145,277 145,277
Total 139,400 - 145,277 145,277
Total ordinary annual services A 395,753 42,914 386,492 429,406
Other services (f)
Departmental non-operating
Equity injections 505 - 2,718 2,718
Total 505 - 2,718 2,718
Total other services B 505 - 2,718 2,718
Total available annual
appropriations 396,258 42,914 389,210 432,124
Total appropriations excluding
Special Accounts 396,258 42,914 389,210 432,124
Total resourcing (A+B) 396,258 42,914 389,210 432,124
Total net resourcing for Austrade 396,258 42,914 389,210 432,124 (a) Appropriation Bill (No. 1) 2015-16. (b) Estimated adjusted balance carried forward from previous year. (c) Includes an amount of $14.2m for the Departmental Capital Budget (refer to Table 3.2.5 for further
details). For accounting purposes this amount has been designated as ‘contributions by owners’. (d) Estimated retained revenue receipts under section 74 of the PGPA Act. (e) Appropriation relating to Tourism grants programs for 2014-15 is reflected in the Department of Foreign
Affairs and Trade resource statement. (f) Appropriation Bill (No. 2) 2015-16. Reader note: All figures are GST exclusive.

Austrade Budget Statements
87
1.3 BUDGET MEASURES
Budget measures in Part 1 relating to Austrade are detailed in Budget Paper No. 2 and
are summarised below.
Table 1.2: Entity 2015-16 Budget measures
Part 1: Measures announced since the 2014-15 Mid-Year Economic and Fiscal Outlook (MYEFO)
2014-15 2015-16 2016-17 2017-18 2018-19
Programme $'000 $'000 $'000 $'000 $'000
Expense measures
Free Trade Agreement
Promotion
Administered expenses 1.2 - 1,372 773 - -
Departmental expenses 1.1 - 12,025 7,426 - -
Total - 13,397 8,199 - -
Strengthening Australia's ability
to attract foreign investment
Departmental expenses 1.1 - 5,873 8,209 8,057 7,861
Total - 5,873 8,209 8,057 7,861
Developing Northern Australia -
positioning the north as a leader
in tropical health
Administered expenses 1.2 - 1,025 1,841 2,258 2,046
Departmental expenses 1.1 - 352 344 417 222
Total - 1,377 2,185 2,675 2,268
Match Australia - continuation
and expansion (a)
Administered expenses 1.2 - (900) (1,300) (1,500) (1,500)
Departmental expenses 1.1 - 1,100 1,300 1,300 1,500
Total - 200 - (200) -
Australia Week Events
Departmental expenses 1.1 - 800 2,792 2,814 2,836
Total - 800 2,792 2,814 2,836
Total expense measures
Administered - 1,497 1,314 758 546
Departmental - 20,150 20,071 12,588 12,419
Total - 21,647 21,385 13,346 12,965 (a) The continuation and expansion of Match Australia is offset by the savings achieved from the termination
of Asian Business Engagement plan grants program. The net impact on cash is nil. Prepared on a Government Finance Statistics (fiscal) basis.

Austrade Budget Statements
88
Section 2: Outcomes and planned performance
2.1 OUTCOMES AND PERFORMANCE INFORMATION
Government outcomes are the intended results, impacts or consequences of actions by
the Government on the Australian community. Commonwealth programmes are the
primary vehicle by which Government agencies achieve the intended results of their
outcome statements. Agencies are required to identify the programmes which
contribute to Government outcomes over the Budget and forward years.
Each outcome is described below together with its related programmes, specifying the
performance indicators and targets used to assess and monitor the performance of
Austrade in achieving Government outcomes.
Outcome 1: Contribute to Australia’s economic prosperity by promoting Australia’s export and other international economic interests through the provision of information, advice and services to business, associations, institutions and government
Outcome 1 strategy
Austrade will promote Australia’s export and other international economic interests by
providing information, advice and services to businesses, associations, institutions and
government.
Regarding trade promotion, Australian businesses and institutions face a range of
barriers in different markets that impede successful market entry and identification of
relevant commercial opportunities. Austrade can provide the most value to Australian
businesses and institutions by focussing on markets where those barriers are strongest.
This includes where different language and business cultures can be challenging,
where there is less openness of regulatory frameworks and transparency of business
processes, where there are difficulties accessing distribution channels and commercial
connections, and where the value of the ‘badge of government’ is highest. Austrade
will therefore direct more of its resources to Asian and other growth and emerging
markets that offer commercial potential and that provide opportunities aligned with
Australia’s comparative advantage.
Australia’s international education sector is highly competitive, but faces new
challenges, including from the increasing spread of digital education platforms and
emerging technologies. During the year, Austrade will be working with the
international education sector to develop Australian International Education (AIE) 2025,
a long-term market development plan for the next decade.
Currently, education and training is one of Australia’s largest service export industries.
The number of international students is forecast to grow globally by nearly 100 per

Austrade Budget Statements
89
cent from 4.3 million in 2011 to 8 million by 2025,1 and the market is highly
competitive. Austrade, through the use of the Future Unlimited brand, provides a
single, focused message and a coordinated national approach to the international
marketing and promotion of the Australian education and training sector. This helps
to maximise international student enrolments and position Australia’s education
system as world-class and globally connected. Through Austrade’s international
network, quality commercial opportunities are identified and timely market
intelligence is provided to the Australian education sector to assist it to make informed
decisions, shape strategies, and develop international relationships and business. As a
key priority, Austrade will work to increase diversification within the education sector,
focusing on opportunities in Asia and other growth and emerging markets especially
in the delivery of education, training and skills offshore.
To attract productive foreign direct investment into Australia, Austrade works in
partnership with Australian government departments and state and territory
governments to provide a coordinated national approach to promoting, attracting and
facilitating investment. Recently appointed senior investment specialists have
provided Austrade with additional capability to work with potential investors to
finalise investments and identify investor-ready projects in Australia, in conjunction
with state and territory governments. This activity draws on Austrade’s broad
network of in-market contacts, and is centred on markets which have significant
investment stock in Australia, such as Europe, Japan and North America; or show
increasing outward foreign direct investment flows, such as China, India, Singapore
and the Republic of Korea.
Working across government, Austrade will ensure tourism interests are taken into
account in broader government policy development and implementation, including in
labour and skills, infrastructure development, and regulatory issues. Austrade will
continue to progress agreed Tourism 2020 priorities for 2015, including implementing
policy reforms and encouraging industry to make use of the tools and programs
Tourism 2020 has delivered. Key actions in the Tourism 2020 Strategic Plan (2015-2020)
will be progressed in 2015. Austrade will also support policy development and the
tourism sector by providing economic research, analysis and forecasting.
1 OECD, Education at a Glance 2013, and Institute of International Education, Project Atlas Workshop, 2014.

Austrade Budget Statements
90
Outcome expense statement
Table 2.1 provides an overview of the total expenses for Outcome 1 by programme.
Table 2.1: Budgeted expenses for Outcome 1
2014-15 2015-16
Estimated Estimated
actual expenses
expenses
$'000 $'000
Program 1.1: Promotion of Australia's export and
other international economic interests
Departmental expenses
Departmental appropriation (a) 186,590 213,904
Special Account 1,077 1,163
Expenses not requiring appropriation in the Budget year (b) 17,500 17,500
Total for Program 1.1 205,167 232,567
Program 1.2: Programmes to promote Australia's
exports and other international economic interests
Administered expenses
Ordinary annual services (Appropriation Bill No. 1) 139,400 145,277
Total for Program 1.2 139,400 145,277
Outcome 1 Totals by appropriation type
Administered Expenses
Ordinary annual services (Appropriation Bill No. 1) 139,400 145,277
Departmental expenses
Departmental appropriation (a) 186,590 213,904
Special Account 1,077 1,163
Expenses not requiring appropriation in the Budget year (b) 17,500 17,500
Total expenses for Outcome 1 344,567 377,844
2014-15 2015-16
Average Staffing Level (number) 971 978
Outcome 1: Contribute to Australia’s economic prosperity by
promoting Australia’s export and other international
economic interests through the provision of information,
advice and services to business, associations, institutions
and government.
(a) Departmental appropriation combines ‘Ordinary annual services (Appropriation Bill No. 1)’ and ‘Revenue
from independent sources (s 74)’. (b) Expenses not requiring appropriation in the Budget year are made up of depreciation expenses and
amortisation expenses. Note: Departmental appropriation splits and totals are indicative estimates and may change in the course of the budget year as government priorities change.
.
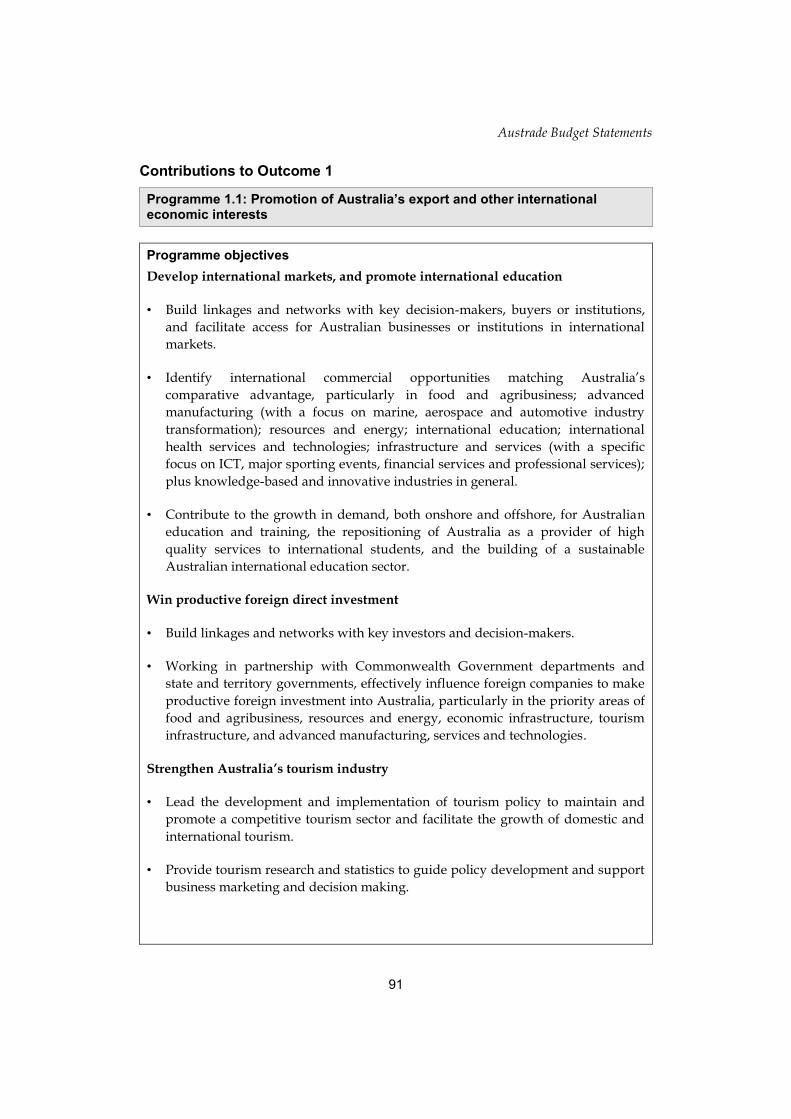
Austrade Budget Statements
91
Contributions to Outcome 1
Programme 1.1: Promotion of Australia’s export and other international economic interests
Programme objectives
Develop international markets, and promote international education
• Build linkages and networks with key decision-makers, buyers or institutions,
and facilitate access for Australian businesses or institutions in international
markets.
• Identify international commercial opportunities matching Australia’s
comparative advantage, particularly in food and agribusiness; advanced
manufacturing (with a focus on marine, aerospace and automotive industry
transformation); resources and energy; international education; international
health services and technologies; infrastructure and services (with a specific
focus on ICT, major sporting events, financial services and professional services);
plus knowledge-based and innovative industries in general.
• Contribute to the growth in demand, both onshore and offshore, for Australian
education and training, the repositioning of Australia as a provider of high
quality services to international students, and the building of a sustainable
Australian international education sector.
Win productive foreign direct investment
• Build linkages and networks with key investors and decision-makers.
• Working in partnership with Commonwealth Government departments and
state and territory governments, effectively influence foreign companies to make
productive foreign investment into Australia, particularly in the priority areas of
food and agribusiness, resources and energy, economic infrastructure, tourism
infrastructure, and advanced manufacturing, services and technologies.
Strengthen Australia’s tourism industry
• Lead the development and implementation of tourism policy to maintain and
promote a competitive tourism sector and facilitate the growth of domestic and
international tourism.
• Provide tourism research and statistics to guide policy development and support
business marketing and decision making.

Austrade Budget Statements
92
• Effectively co-ordinate with other Commonwealth Government agencies, and the
state and territory governments.
Programme expenses
2014-15 2015-16 2016-17 2017-18 2018-19
Estimated Budget Forw ard Forw ard Forw ard
actual estimate estimate estimate
$'000 $'000 $'000 $'000 $'000
Special account expenses:
Services for Other Entities and Trust
Money Special Account 1,077 1,163 - - -
Annual departmental expenses:
Departmental item 186,590 213,904 210,700 205,026 206,805
Expenses not requiring appropriation in
the Budget year (a) 17,500 17,500 17,500 18,500 18,500
Total programme expenses 205,167 232,567 228,200 223,526 225,305 (a) Expenses not requiring appropriation in the Budget year are made up of depreciation expenses and
amortisation expenses.

Austrade Budget Statements
93
Programme 1.1 deliverables
Develop international markets, and promote international education
• Provide access to in-market networks and decision makers, and access in-market
opportunities identified by Austrade and others through the provision of
relevant and commercially useful information and market-related services and
advice.
• Take the lead role in coordinating ministerial-led overseas business missions,
including delivery of the second Australia Week in China event in 2016, and
inaugural Australia Week events in ASEAN and the US.
• Assist and facilitate Australian businesses’ and institutions’ participation at
international business events.
• Assist Australian firms and institutions with ‘behind the border’ barriers to trade
and outwards investment, consistent with legal obligations, including anti-
bribery and corruption laws, in Australia and overseas.
• Provide Australian businesses and education providers with quality referrals to
third-party professional and business service providers to assist them in complex
and unfamiliar international services markets.
• Work with the education, business and government sectors to develop a long
term market development plan for the Australian international education sector
known as AIE 2025.
• Help to increase demand for Australia’s education services, particularly
transnational education, by positioning Australia as a provider of high-quality
services to international students.
• Manage the Study in Australia website, which promotes the benefits of studying
in Australia to international students, provides information on courses that meet
Australia's registration, accreditation and quality assurance standards in their
own country, guidance on study costs, and information about living in Australia.
• Assess applications for the income tax exemption available under Section 23AF
of the Income Tax Assessment Act 1936, to assist the international competitiveness
of Australian companies and government organisations competing to win
international tenders.

Austrade Budget Statements
94
Win productive foreign direct investment
• Partnering with Australian, state and territory government agencies to
implement productive, direct foreign investment strategies in agreed national
investment priority areas.
• Proactively target potential investors, promoting specific investment
opportunities, promoting Australia’s economic credentials and detailing the
regulatory environment.
• Introducing potential foreign investors to state and territory governments.
• From 1 July 2015, Austrade will become a nominating entity for the Significant
Investment Visas (SIV) program, complementing the current state and territory
governments’ role as nominators; and be the sole nominating entity for the
Premium Investment Visas (PIV) program. All nominations will be provided to
the Department of Immigration and Border Protection for final assessment.
Strengthen Australia’s tourism industry
• Continue to implement Tourism 2020 to improve the productive capacity of
Australia’s tourism industry, including contributing to the delivery of policy
priorities agreed by tourism ministers, and implementation of the Tourism 2015-
2020 Strategic Plan.
• Work with state and territory governments to facilitate the transfer of funds from
the Commonwealth Government for the Tourism Demand Driver Infrastructure
Programme.
• Work with the Tasmanian Government to facilitate transfer of funds from the
Commonwealth Government for the Tasmanian Regional Tourism Package.
• Deliver an enhanced China Approved Destination Status (ADS) Scheme, to
ensure a quality tourism experience for Chinese group leisure tourists.
• Produce and disseminate strategic tourism research and forecasts.
• Administer and manage the Tourism Research Australia website, which provides
information and research services that underpin tourism policy development and
help improve the performance of the tourism industry for the benefit of the
Australian community.

Austrade Budget Statements
95
Whole of Government
• Draw on Austrade’s global and commercial perspective to provide policy advice
and economic insight to the Government.
Austrade website
• Administer and manage the main Austrade website, which provides information
and online services to Australian businesses and institutions, showcases
Australia’s capability and potential to international buyers and investors, and
provides a centralised point of contact and engagement between businesses,
institutions and Austrade.
Programme 1.1 key performance indicators
Satisfaction
• High level of satisfaction for ministers, Australian business community,
institutions and key partners with Austrade’s services.
Develop international markets, and promote international education
• Proportion of Australian businesses which have engaged with Austrade, and say
Austrade made a positive contribution to their international business activities.
• Proportion of Australian businesses which have engaged with Austrade, and say
they achieved some form of commercial outcome as a result of working with
Austrade.
• Proportion of Australian education institutions which have engaged with
Austrade, and say Austrade made a positive contribution to their international
business activities.
• Proportion of Australian education institutions which have engaged with
Austrade, and say they achieved some form of commercial outcome as a result of
working with Austrade.
Win productive foreign direct investment
Austrade has a shared set of key performance indicators with the states and
territories:
• the number of investment outcomes facilitated;
the amount of capital expenditure associated with foreign direct investment
outcomes facilitated;

Austrade Budget Statements
96
• the number of new jobs created/retained (ongoing full time equivalents) as a
direct result of investment outcomes facilitated; and
• the anticipated annual exports from investment outcomes facilitated.
Noting that investments can have gestation times that span multiple years, from the
initial investor contact to actual investment commitment, results will not be fully
realised in the short-term. Therefore, in accordance with the protocols developed
with the states and territories, Austrade is responsible for proactively promoting
Australia as an attractive investment destination, which is measured by:
• the number of information, project and visitation requests, and stakeholder
introductions generated from potential investors.
Strengthen Australia’s tourism industry
• Priorities and outputs outlined in the Tourism 2015-2020 Implementation Plan, progressed in accordance with agreed timeframes.
• Proportion of tourism operators which use Austrade’s tourism research and information and say it helped support their marketing and business decisions.
Whole of Government
• Effective contribution to whole of government policy development using Austrade’s commercial perspectives on export, investment, international
education and tourism.

Austrade Budget Statements
97
Programme 1.2: Programmes to promote Australia’s export and other international economic interests
Programme objective
Administer programs that support Australian businesses’ engagement in
international business, provide an incentive for small-to-medium businesses to enter
into export markets and grow to become sustainable exporters, or that strengthen
and stimulate growth in the tourism industry.
Programme expenses
2014-15 2015-16 2016-17 2017-18 2018-19
Estimated Budget Forw ard Forw ard Forw ard
actual estimate estimate estimate
$'000 $'000 $'000 $'000 $'000
Annual administered expenses:
EMDG 137,900 137,900 137,900 137,900 137,900
ABE plan 1,500 600 200 - -
Free Trade Agreement Promotion - 1,372 773 - -
Tasmania Regional Tourism Package - 4,380 - - -
Developing Northern Australia - positioning
the north as a leader in tropical health - 1,025 1,841 2,258 2,046
Total programme expenses 139,400 145,277 140,714 140,158 139,946
Programme 1.2 deliverables
Export Market Development Grants (EMDG) scheme
Administration of the Export Market Development Grants (EMDG) scheme,
providing partial reimbursement for expenditure on eligible export promotion
activities.
Deliverables 2014-15 2015-16 2016-17 2017-18 2018-19 Estimated Budget Forward Forward Forward actual estimate estimate estimate
3,000- 3,100 3,200- 3,300-
Number of grant applications 3,195 3,500 3,600 3,700 3,800
2,800- 2,900- 3,000- 3,100-
Number of grant recipients 3,000 3,300 3,400 3,500 3,600

Austrade Budget Statements
98
Free Trade Agreement Promotion
Funding has been provided over two years for both Austrade and DFAT to promote
the awareness and usage of free trade agreements (FTAs) with China, Japan and the
Republic of Korea; and improve the awareness of FTAs more generally. Specific
deliverables will consist of a national series of roadshows, a grants program for
businesses and industry groups, and regional training for business chambers, local
councils and other third parties. These grants and training programs would increase
businesses’ access to FTA information; and targeted advertising will also be
undertaken in digital and mass media.
Linked to: Free Trade Agreement Promotion linked to DFAT Programme 1.1.
Tasmanian Regional Tourism Package (TRTP)
Administration of the Tasmanian Regional Tourism Package – comprised of the
Tasmanian Whisky and Cider Trails project and the Regional Tourism Infrastructure
and Innovation Fund - to fund projects which align with state and national tourism
priorities.
Tourism Demand Driver Infrastructure (TDDI) program
Administration of the Tourism Demand Driver Infrastructure program, providing
funding to the state and territory governments, which are responsible for
implementing projects that create and encourage quality tourism infrastructure.
Linked to: Tourism Demand Driver Infrastructure payments made through the
National Partnership Payments arrangements – Programme code SPP666.
Asian Business Engagement (ABE) plan
Funding for this grant program has concluded, and no new applications will be
considered. However, as previous grants were awarded under multi-year
agreements, residual payments to previous recipients will continue in 2015-16.
Residual payments will be made to recipients that continue to meet their obligations
subject to the ABE plan and the Commonwealth Grant Guidelines.
Developing Northern Australia - positioning the north as a leader in tropical
health
Administration of a component of the Global Leader in Tropical Health program,
providing funding to the Department of Industry and Science under a
Memorandum of Understanding. Austrade will support the program by providing
sectoral expertise and advice to support decision making by the Department of
Industry and Science in relation to commercialising tropical medicine research.

Austrade Budget Statements
99
Programme 1.2 key performance indicators
Export Market Development Grants (EMDG) scheme
• Proportion of EMDG scheme recipients reporting that the receipt of a grant
supported their business to become a more sustainable exporter.
• Proportion of EMDG scheme recipients reporting that the receipt of a grant
enabled them to grow their international revenue.
Free Trade Agreement Promotion
• Proportion of seminar and roadshow attendees reporting an increased awareness
of FTAs.
• Proportion of seminar and roadshow attendees reporting an increased
understanding of how to use and benefit from FTAs.
Tasmanian Regional Tourism Package (TRTP)
• TRTP funding distributed to projects identified by the Tasmanian Government in
the National Partnership Agreement, consistent with agreed principles.
Tourism Demand Driver Infrastructure (TDDI) program
• Budgeted TDDI funding distributed to state and territory governments.
• TDDI funding distributed to projects identified by state and territory
governments in National Partnership Agreements, consistent with funding
principles agreed by tourism ministers.
Asian Business Engagement (ABE) plan
• Proportion of grant recipients reporting that the receipt of a grant helped to
expand the capability of their organisation to assist members’ in-market access to
business networks; and to develop new business relationships in Asia.
Developing Northern Australia - positioning the north as a leader in tropical
health
• Funds and advice provided to the Department of Industry and Science,
consistent with agreed principles, to increase foreign investment in the
commercialisation of Australian Tropical Medicine research and development.

Austrade Budget Statements
100
Outcome 2: The protection and welfare of Australians abroad through timely and responsive consular and passport services in specific locations overseas
Outcome 2 strategy
In overseas locations where Austrade has designated consular management
responsibilities, Austrade will continue to place a high priority on helping Australians
through the delivery of effective consular services, efficient passport services and
practical contingency planning, in accordance with DFAT’s Consular Services and
Passports Client Services charters.
Outcome expense statement
Table 2.2 provides an overview of the total expenses for Outcome 2 by programme.
Table 2.2: Budgeted expenses for Outcome 2
2014-15 2015-16
Estimated Estimated
actual expenses
expenses
$'000 $'000
Program 2.1: Consular and passport services
Departmental expenses
Departmental appropriation (a) 12,818 13,001
Total for Program 2.1 12,818 13,001
Outcome 2 Totals by appropriation type
Departmental expenses
Departmental appropriation (a) 12,818 13,001
Total expenses for Outcome 2 12,818 13,001
2014-15 2015-16
Average Staffing Level (number) 39 40
Outcome 2: The protection and welfare of Australians abroad
through timely and responsive consular and passport services
in specific locations overseas
(a) Appropriation combines ‘Ordinary annual services (Appropriation Bill No. 1)’ and ‘Revenue from
independent sources (s 74)’. Note: Departmental appropriation splits and totals are indicative estimates and may change in the course of the budget year as government priorities change.
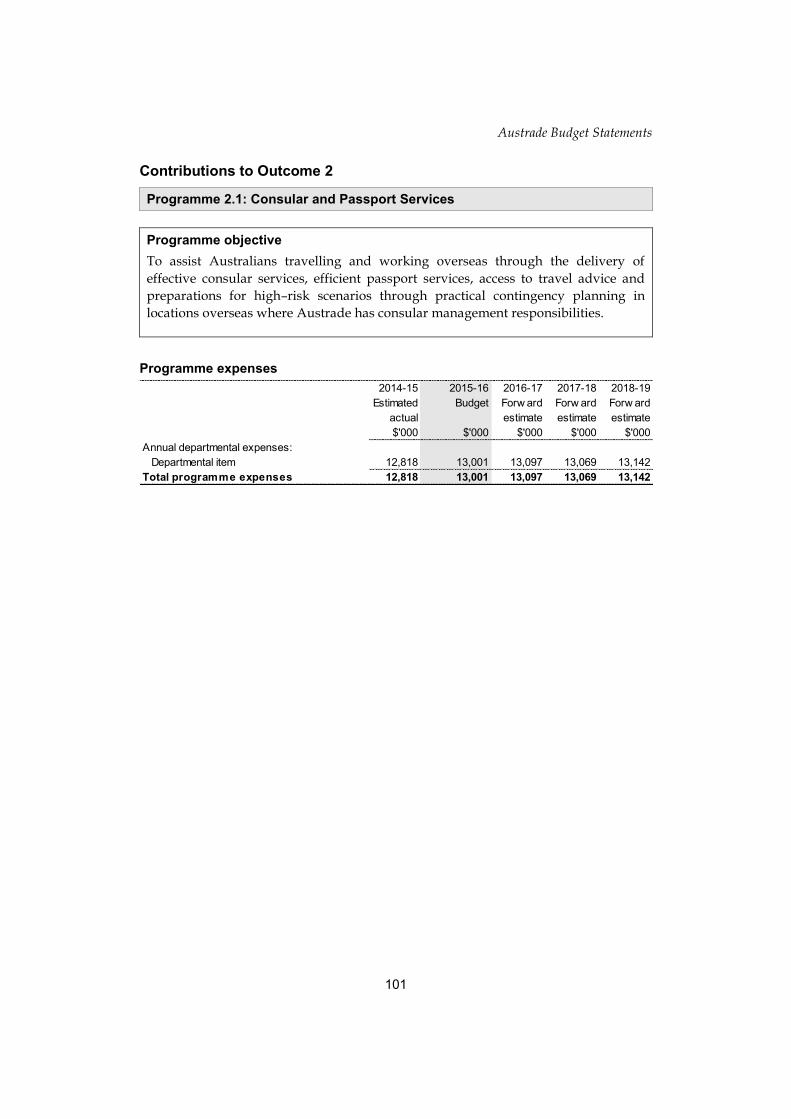
Austrade Budget Statements
101
Contributions to Outcome 2
Programme 2.1: Consular and Passport Services
Programme objective
To assist Australians travelling and working overseas through the delivery of
effective consular services, efficient passport services, access to travel advice and
preparations for high–risk scenarios through practical contingency planning in
locations overseas where Austrade has consular management responsibilities.
Programme expenses
2014-15 2015-16 2016-17 2017-18 2018-19
Estimated Budget Forw ard Forw ard Forw ard
actual estimate estimate estimate
$'000 $'000 $'000 $'000 $'000
Annual departmental expenses:
Departmental item 12,818 13,001 13,097 13,069 13,142
Total programme expenses 12,818 13,001 13,097 13,069 13,142

Austrade Budget Statements
102
Programme 2.1 deliverables
• Comprehensive, responsive, and high-quality consular services are delivered to
an increasing number of Australian travellers and citizens living overseas,
including notarial services and assistance with welfare issues, whereabouts
enquiries, arrest or detention matters, deaths and medical emergencies.
• High-quality passport services are provided to Australians, including processing
new passport applications, registering lost or stolen passports, issuing
emergency passports, and detecting passport fraud.
• Consular contingency planning is reviewed and updated annually, and effective
contingency planning for major events or high-risk scenarios is undertaken,
through regular reviews of procedures and available resources, training of staff
and coordination with other government agencies and foreign governments.
Deliverables 2014-15 2015-16 2016-17 2017-18 2018-19 Estimated Budget Forward Forward Forward actual estimate estimate estimate
Number of passport applications
received 12,000 12,000 12,000 12,000 12,000
Number of notarial acts 12,750 14,500 14,500 14,500 14,500
Programme 2.1 key performance indicators
In accordance with the Department of Foreign Affairs Passport Client Services
Charter:
• normal passport applications are scanned within 24 hours – three per cent
tolerance;
• routine passports are issued in a timely and responsive manner; and
• urgent passport issues are dealt with in a timely responsive manner. Where a
priority processing fee is paid, the passport is to be provided within two working
days.
In accordance with the Department of Foreign Affairs Consular Services Charter:
• notarial services are to be delivered within three working days of the lodgement
of documents from a client.

Austrade Budget Statements
103
Section 3: Explanatory tables and budgeted financial statements
Section 3 presents explanatory tables and budgeted financial statements which provide
a comprehensive snapshot of entity finances for the 2015-16 budget year. It explains
how budget plans are incorporated into the financial statements and provides further
details of the reconciliation between appropriations and programme expenses,
movements in administered funds, special accounts and government indigenous
expenditure.
3.1 EXPLANATORY TABLES
3.1.1 Movement of administered funds between years
Administered funds can be provided for a specified period, for example under annual
Appropriation Acts. Funds not used in the specified period with the agreement of the
Finance Minister may be moved to a future year.
Table 3.1.1: Movement of administered funds between years(a)
2014-15
$'000
2015-16
$'000
2016-17
$'000
2017-18
$'000
2018-19
$'000
Outcome 1:
Tasmanian Regional Tourism
Package (b)
Total movement of administered
funds (2,130) 2,310 - - -
(2,130) 2,130 - - -
(a) Figures displayed as a negative (-) represent a decrease in funds and a positive represent an increase in
funds. (b) The administered funds relating to 2014-15 are reflected in the Department of Foreign Affairs and Trade
resource statement.
3.1.2 Special accounts
Special accounts provide a means to set aside and record amounts used for specified
purposes. Special accounts can be created by a Finance Minister’s determination under
section 78 of the PGPA Act or under separate enabling legislation (section 80 of the
PGPA Act refers). Table 3.1.2 shows the expected additions (receipts) and reductions
(payments) for each account used by Austrade.

Austrade Budget Statements
104
Table 3.1.2: Estimates of special account flows and balances
Opening Receipts Payments Adjustments Closing
balance balance
$'000 $'000 $'000 $'000 $'000
Admin Payments and
Receipts for Other Entities
Special Account (a) (A)
2015-16
Admin Payments and
Receipts for Other Entities
Special Account (a) (A)
2014-15
Services for Other
Entities and Trust Moneys 1
Special Account (b) (D)
2015-16
Services for Other
Entities and Trust Moneys
Special Account (b) (D)
2014-15
Total special accounts
2015-16 Budget estimate 1,030 9,433 (10,363) - 100
Total special accounts
2014-15 estimated actual 1,047 10,260 (10,277) - 1,030
100 9,200 (9,200)
1 947 1,060 (1,077)
1
Outcome
- 100
930
-
100 9,200 (9,200) - 100
930 233 (1,163) -
-
1
(a) s20 Financial Management and Accountability Act, 1997 Determination 2006/15 (b) s20 Financial Management and Accountability Act, 1997 Determination 2008/05 (A) = Administered (D) = Departmental
3.1.3 Australian Government Indigenous expenditure
Table 3.1.3: Australian Government Indigenous expenditure (AGIE)
Approp Total Other Total Programme
Outcome Bill No. 1 approp
$'000 $'000 $'000 $'000
Austrade
Outcome 1
Departmental 2015-16 346 346 - 346 1.1
Departmental 2014-15 273 273 - 273 1.1
Total outcome 2015-16 346 346 - 346
Total outcome 2014-15 273 273 - 273
Total AGIE 2015-16 346 346 - 346
Total AGIE 2014-15 273 273 - 273

Austrade Budget Statements
105
3.2 BUDGETED FINANCIAL STATEMENTS
3.2.1 Differences in entity resourcing and financial statements
There has been no difference between the resource information presented in the
Budget Papers and in Austrade’s Portfolio Budget Statements.
3.2.2 Analysis of budgeted financial statements
An analysis of Austrade’s budgeted financial statements, as reflected in the
departmental financial statements and administered schedules, is provided below.
Departmental financial statements
The departmental financial statements represent the assets, liabilities, revenues and
expenses which are controlled by Austrade. Departmental expenses include employee
and supplier expenses and other administrative costs which are incurred by Austrade
in undertaking its operations.
Budgeted departmental comprehensive income statement
This statement provides estimated actual financial results for 2014-15 and the
estimated revenue and expenses for 2015-16 and forward years.
Total income in 2015-16 is estimated to be $227.3 million, which represents an increase
of $26.8 million in appropriations from the 2014-15 estimated actual shown at Table
3.2.1. The increase is a result of:
Free Trade Agreement Promotion – an increase of $12.0 million;
Strengthening Australia’s ability to attract foreign investment – an increase of
$5.9 million;
Match Australia – continuation and expansion – an increase of $1.1 million;
Australia Week Events – an increase of $0.8 million;
Developing Northern Australia - positioning the north as a leader in tropical
health – an increase of $0.4 million;
foreign exchange variation – an increase of $4.9 million;
indexation adjustment – an increase of $0.3 million; and
measures and parameters adjustments in prior budget rounds – an increase of
$1.9 million.

Austrade Budget Statements
106
Offset by:
one-off severance funding in 2014-15 – a decrease of $0.4 million.
Austrade is receiving funding of $16.9 million to fund the department’s capital
expenditure which is treated as an equity injection.
Total estimated expenses for 2015-16 have increased by $27.6 million to reflect the
increase in income.
Budgeted departmental balance sheet
This statement discloses the estimated end of year financial position for Austrade.
Austrade’s budgeted net asset position at the end of 2015-16 of $60.6 million represents
an increase of $0.3 million from the 2014-15 estimated actual in table 3.2.2 due to the
variation among capital program funding ($16.9 million), estimated depreciation
expense ($17.5 million) and estimated revaluation surplus ($0.9 million).
Departmental statement of changes in equity — summary of movement
This statement shows changes in equity resulting from the net impact of movements in
accumulated results, assets revaluation and other reserves, and contributed equity.
Total equity at the end of 2015-16 is estimated to be $60.6 million, an increase of
$0.3 million due to the variation among capital program funding ($16.9 million),
estimated depreciation expense ($17.5 million) and estimated revaluation surplus
($0.9 million).
Budgeted departmental statement of cash flows
This statement shows the extent and nature of cash flows as a result of Austrade’s
operating, investing and financing activities. Austrade’s cash balance at the end of
2015-16 is estimated to be $5.5 million.
Departmental capital budget statement
This statement shows all planned departmental capital expenditure on non-financial
assets, whether funded through capital appropriations, additional equity, borrowings,
or funds from internal sources.
Departmental statement of asset movements
This statement shows budgeted acquisitions and disposals of non-financial assets
during the budget year.

Austrade Budget Statements
107
Schedule of administered activity
Details of transactions administered by Austrade on behalf of the Government are
shown in the following schedules to the financial statements.
Schedule of budgeted income and expenses administered on behalf of
Government
This schedule discloses revenue and expenses administered on behalf of the
Government.
Administered expenses of $145.3 million for 2015-16 relate to the EMDG scheme
($137.9 million), ABE plan ($0.6 million), FTA Promotion ($1.4 million), Developing
Northern Australia - positioning the north as a leader in tropical health ($1.0 million)
and TRTP grants ($4.4 million). The EMDG scheme is comprised of $131.0 million in
grant expenditure and $6.9 million in expenditure for the costs of administration on
behalf of the Government. The ABE plan, FTA Promotion, Developing Northern
Australia - positioning the north as a leader in tropical health and TRTP are comprised
of grants expenditure only.
Schedule of budgeted assets and liabilities administered on behalf of
Government
This schedule identifies the assets and liabilities administered on behalf of the
Government.
Total administered assets and liabilities for 2015-16 are estimated at $0.1 million and
$9.0 million respectively.
Schedule of budgeted administered cash flows
This schedule shows cash flows administered on behalf of the Government. All cash received is expected to be expended on the relevant programs.

Austrade Budget Statements
108
3.2.3 Budgeted financial statements tables
Table 3.2.1: Comprehensive income statement (showing net cost of services) for the period ended 30 June
2014-15 2015-16 2016-17 2017-18 2018-19
Estimated Budget Forw ard Forw ard Forw ard
actual estimate estimate estimate
$'000 $'000 $'000 $'000 $'000
EXPENSES
Employee benefits 126,581 133,522 136,058 136,351 137,485
Suppliers 73,904 94,546 87,739 81,744 82,462
Depreciation and amortisation 17,500 17,500 17,500 18,500 18,500
Total expenses 217,985 245,568 241,297 236,595 238,447
LESS:
OWN-SOURCE INCOME
Own-source revenue
Sale of goods and rendering of services 19,024 18,233 18,000 18,000 18,000
Rental income 500 100 100 100 100
Other 1,500 1,900 1,900 1,900 1,900
Total own-source revenue 21,024 20,233 20,000 20,000 20,000
Gains
Total gains - - - - -
Total own-source income 21,024 20,233 20,000 20,000 20,000
Net cost of/(contribution by)
services 196,961 225,335 221,297 216,595 218,447
Revenue from Government 180,241 207,055 203,797 198,095 199,947
Surplus/(deficit) attributable to
the Australian Government (16,720) (18,280) (17,500) (18,500) (18,500)
OTHER COMPREHENSIVE INCOME
Changes in asset revaluation surplus 2,500 900 3,500 3,500 -
Total other comprehensive income 2,500 900 3,500 3,500 -
Total comprehensive income/(loss) (14,220) (17,380) (14,000) (15,000) (18,500)
Total comprehensive income/(loss)
attributable to the Australian
Government (14,220) (17,380) (14,000) (15,000) (18,500) Table continued on the following page.

Austrade Budget Statements
109
Table 3.2.1: Comprehensive income statement (showing net cost of services) for the period ended 30 June (continued)
2014-15 2015-16 2016-17 2017-18 2018-19
$'000 $'000 $'000 $'000 $'000
Total comprehensive income/(loss)
excluding depreciation/amortisation
expenses previously funded
through revenue appropriations 3,280 120 3,500 3,500 -
less depreciation/amortisation
expenses previously funded through
revenue appropriations(a) (17,500) (17,500) (17,500) (18,500) (18,500)
Total comprehensive income/(loss)-
as per the statement of
comprehensive income (14,220) (17,380) (14,000) (15,000) (18,500)
Note: Impact of net cash appropriation arrangements
(a) From 2010-11, the Government introduced net cash appropriation arrangements where Bill 1 revenue
appropriations for the depreciation/amortisation expenses of Commonwealth entities (and select corporate Commonwealth entities) were replaced with a separate capital budget (the Departmental Capital Budget, or DCB) provided through Bill 1 equity appropriations. For information regarding DCBs, please refer to Table 3.2.5 Departmental Capital Budget Statement.
Prepared on Australian Accounting Standards basis.

Austrade Budget Statements
110
Table 3.2.2: Budgeted departmental balance sheet (as at 30 June)
2014-15 2015-16 2016-17 2017-18 2018-19
Estimated Budget Forw ard Forw ard Forw ard
actual estimate estimate estimate
$'000 $'000 $'000 $'000 $'000
ASSETS
Financial assets
Cash and cash equivalents 5,500 5,500 5,500 5,500 5,500
Trade and other receivables 41,052 40,272 40,272 40,272 40,272
Total financial assets 46,552 45,772 45,772 45,772 45,772
Non-financial assets
Land and buildings 12,846 13,281 16,276 16,276 15,276
Property, plant and equipment 21,814 21,695 21,751 21,254 20,391
Intangibles 24,128 24,090 22,351 22,196 20,041
Other non-financial assets 7,913 7,913 7,913 7,913 7,913
Total non-financial assets 66,701 66,979 68,291 67,639 63,621
Total assets 113,253 112,751 114,063 113,411 109,393
LIABILITIES
Payables
Suppliers 12,163 12,163 12,163 12,163 12,163
Other payables 670 670 670 670 670
Total payables 12,833 12,833 12,833 12,833 12,833
Provisions
Employee provisions 36,989 36,989 36,989 36,989 36,989
Other provisions 2,342 2,342 2,342 2,342 2,342
Total provisions 39,331 39,331 39,331 39,331 39,331
Total liabilities 52,164 52,164 52,164 52,164 52,164
Net assets 61,089 60,587 61,899 61,247 57,229
EQUITY*
Parent equity interest
Contributed equity 84,493 101,371 116,683 131,031 145,513
Reserves 68,515 69,415 72,915 76,415 76,415
Retained surplus (accumulated
deficit) (91,919) (110,199) (127,699) (146,199) (164,699)
Total non-controlling interest 61,089 60,587 61,899 61,247 57,229
Total Equity 61,089 60,587 61,899 61,247 57,229 *‘Equity’ is the residual interest in assets after deduction of liabilities. Prepared on Australian Accounting Standards basis.

Austrade Budget Statements
111
Table 3.2.3: Departmental statement of changes in equity — summary of movement (Budget year 2015-16)
Retained Asset Other Contributed Total
earnings revaluation reserves equity/ equity
reserve capital
$'000 $'000 $'000 $'000 $'000
Opening balance as at 1 July 2015
Balance carried forw ard from
previous period (91,919) 29,790 38,725 84,493 61,089
Adjusted opening balance (91,919) 29,790 38,725 84,493 61,089
Comprehensive income
Surplus/(deficit) for the period (18,280) 900 - - (17,380)
Total comprehensive income (18,280) 900 - - (17,380)
Transactions with owners
Contributions by owners
Equity Injection - Appropriation 2,718 2,718
Departmental Capital Budget (DCB) 14,160 14,160
Sub-total transactions with owners - - - 16,878 16,878
Estimated closing balance
as at 30 June 2016 (110,199) 30,690 38,725 101,371 60,587
Closing balance attributable to the
Australian Government (110,199) 30,690 38,725 101,371 60,587 Prepared on Australian Accounting Standards basis.

Austrade Budget Statements
112
Table 3.2.4: Budgeted departmental statement of cash flows (for the period ended 30 June)
2014-15 2015-16 2016-17 2017-18 2018-19
Estimated Budget Forw ard Forw ard Forw ard
actual estimate estimate estimate
$'000 $'000 $'000 $'000 $'000
OPERATING ACTIVITIES
Cash received
Appropriations 181,367 207,835 203,797 198,095 199,947
Sale of goods and rendering
of services 19,524 18,333 18,100 18,100 18,100
Net GST received 5,714 5,714 5,714 5,714 5,714
Other 1,500 1,900 1,900 1,900 1,900
Total cash received 208,105 233,782 229,511 223,809 225,661
Cash used
Employees 126,581 133,522 136,058 136,351 137,485
Suppliers 73,904 94,546 87,739 81,744 82,462
Net GST paid 5,714 5,714 5,714 5,714 5,714
Total cash used 206,199 233,782 229,511 223,809 225,661
Net cash from/(used by)
operating activities 1,906 - - - -
INVESTING ACTIVITIES
Cash received
Proceeds from sales of property,
plant and equipment - - - - -
Total cash received - - - - -
Cash used
Purchase of property, plant
and equipment 17,792 16,878 15,312 14,348 14,482
Total cash used 17,792 16,878 15,312 14,348 14,482
Net cash from/(used by)
investing activities (17,792) (16,878) (15,312) (14,348) (14,482)
FINANCING ACTIVITIES
Cash received
Contributed equity 17,792 16,878 15,312 14,348 14,482
Total cash received 17,792 16,878 15,312 14,348 14,482
Net cash from/(used by)
financing activities 17,792 16,878 15,312 14,348 14,482
Net increase/(decrease)
in cash held 1,906 - - - -
Cash and cash equivalents at the
beginning of the reporting period 3,594 5,500 5,500 5,500 5,500
Cash and cash equivalents at the
end of the reporting period 5,500 5,500 5,500 5,500 5,500 Prepared on Australian Accounting Standards basis.

Austrade Budget Statements
113
Table 3.2.5: Departmental capital budget statement (for the period ended 30 June)
2014-15 2015-16 2016-17 2017-18 2018-19
Estimated Budget Forw ard Forw ard Forw ard
actual estimate estimate estimate
$'000 $'000 $'000 $'000 $'000
NEW CAPITAL APPROPRIATIONS
Capital budget - Bill 1 (DCB) 17,287 14,160 14,317 14,348 14,482
Equity injections - Bill 2 505 2,718 995 - -
Total new capital appropriations 17,792 16,878 15,312 14,348 14,482
Provided for:
Purchase of non-financial assets 17,792 16,878 15,312 14,348 14,482
Total Items 17,792 16,878 15,312 14,348 14,482
PURCHASE OF NON-FINANCIAL
ASSETS
Funded by capital appropriations(a) 505 2,718 995 - -
Funded by capital appropriation -
DCB (b) 14,287 14,160 14,317 14,348 14,482
Funded internally from departmental
resources (c) 3,000 - - - -
TOTAL 17,792 16,878 15,312 14,348 14,482
RECONCILIATION OF CASH
USED TO ACQUIRE ASSETS
TO ASSET MOVEMENT TABLE
Total purchases 17,792 16,878 15,312 14,348 14,482
Total cash used to acquire assets 17,792 16,878 15,312 14,348 14,482 (a) Includes both current Bill 2 and prior Act 2/4/6 appropriations and special capital appropriations. (b) Includes purchases from current and previous years’ Departmental Capital Budgets (DCBs). (c) Includes $3.0m reallocated from departmental to DCB. Prepared on Australian Accounting Standards basis.

Austrade Budget Statements
114
Dep
artmen
t abbreviation
Bu
dg
et Statem
ents
Table 3.2.6: Statement of asset movements (Budget year 2015-16) Buildings
$'000
Other
property,
plant and
equipment
$'000
Computer
softw are and
intangibles
$'000
Total
$'000
As at 1 July 2015
Gross book value 17,346 32,869 67,729 117,944
Accumulated depreciation/amortisation
and impairment (4,500) (11,055) (43,601) (59,156)
Opening net book balance 12,846 21,814 24,128 58,788
CAPITAL ASSET ADDITIONS
Estimated expenditure on
new or replacement assets
By purchase - appropriation equity (a) 2,718 - - 2,718
By purchase - appropriation ordinary
annual services (b) 2,500 3,660 8,000 14,160
Total additions 5,218 3,660 8,000 16,878
Other movements
Depreciation/amortisation expense (4,783) (4,279) (8,438) (17,500)
Other (c) - 500 400 900
Total other movements (4,783) (3,779) (8,038) (16,600)
As at 30 June 2016
Gross book value 22,564 37,029 76,129 135,722
Accumulated depreciation/amortisation
and impairment (9,283) (15,334) (52,039) (76,656)
Closing net book balance 13,281 21,695 24,090 59,066 (a) ‘Appropriation equity’ refers to equity injections appropriations provided through Appropriation Bill (No. 2)
2015-16. (b) ‘Appropriation ordinary annual services’ refers to funding provided through Appropriation Bill (No. 1)
2015-16 for depreciation/amortisation expenses, DCBs or other operational expenses. (c) Revaluation/fair movements. Prepared on Australian Accounting Standards basis.

Austrade Budget Statements
115
Table 3.2.7: Schedule of budgeted income and expenses administered on behalf of Government (for the period ended 30 June)
2014-15 2015-16 2016-17 2017-18 2018-19
Estimated Budget Forw ard Forw ard Forw ard
actual estimate estimate estimate estimate
$'000 $'000 $'000 $'000 $'000
EXPENSES ADMINISTERED ON
BEHALF OF GOVERNMENT
Employee benefits 5,000 5,000 5,000 5,000 5,000
Suppliers 1,895 1,895 1,895 1,895 1,895
Grants 132,505 138,382 133,819 133,263 133,051
Total expenses administered
on behalf of Government 139,400 145,277 140,714 140,158 139,946
LESS:
OWN-SOURCE INCOME
Total own-sourced income
administered on behalf of
Government - - - - -
Net cost of/(contribution by)
services 139,400 145,277 140,714 140,158 139,946
Surplus/(Deficit) 139,400 145,277 140,714 140,158 139,946
Total comprehensive income/(loss) 139,400 145,277 140,714 140,158 139,946 Prepared on Australian Accounting Standards basis.

Austrade Budget Statements
116
Table 3.2.8: Schedule of budgeted assets and liabilities administered on behalf of Government (as at 30 June)
2014-15 2015-16 2016-17 2017-18 2018-19
Estimated Budget Forw ard Forw ard Forw ard
actual estimate estimate estimate
$'000 $'000 $'000 $'000 $'000
ASSETS
Financial assets
Cash and cash equivalents - - - - -
Other f inancial assets 90 90 90 90 90
Total financial assets 90 90 90 90 90
Total assets administered
on behalf of Government 90 90 90 90 90
LIABILITIES
Payables
Suppliers 79 79 79 79 79
Other payables 160 160 160 160 160
Total payables 239 239 239 239 239
Provisions
Employee provisions 2,331 2,331 2,331 2,331 2,331
Other provisions 6,438 6,438 6,438 6,438 6,438
Total provisions 8,769 8,769 8,769 8,769 8,769
Total liabilities administered
on behalf of Government 9,008 9,008 9,008 9,008 9,008
Net assets/(liabilities) (8,918) (8,918) (8,918) (8,918) (8,918) Prepared on Australian Accounting Standards basis.

Austrade Budget Statements
117
Table 3.2.9: Schedule of budgeted administered cash flows (for the period ended 30 June)
2014-15 2015-16 2016-17 2017-18 2018-19
Estimated Budget Forw ard Forw ard Forw ard
actual estimate estimate estimate
$'000 $'000 $'000 $'000 $'000
OPERATING ACTIVITIES
Cash received
Net GST received 195 195 195 195 195
Total cash received 195 195 195 195 195
Cash used
Grant 132,505 138,382 133,819 133,263 133,051
Suppliers 1,895 1,895 1,895 1,895 1,895
Net GST paid 195 195 195 195 195
Employees 5,000 5,000 5,000 5,000 5,000
Total cash used 139,595 145,472 140,909 140,353 140,141
Net cash from/(used by)
operating activities (139,400) (145,277) (140,714) (140,158) (139,946)
Net increase/(decrease) in
cash held (139,400) (145,277) (140,714) (140,158) (139,946)
Cash and cash equivalents at
beginning of reporting period - - - - -
Cash from Official Public Account for:
- Appropriations 139,400 145,277 140,714 140,158 139,946
Cash and cash equivalents at end
of reporting period - - - - - Prepared on Australian Accounting Standards basis.

Austrade Budget Statements
118
3.2.3 Notes to the Financial Statements
Austrade’s budgeted statements are prepared on an Australian Equivalents to
International Financial Reporting Standards (AEIFRS) basis.
Under the Government’s budgeting framework, transactions that agencies control
(departmental transactions) are separately budgeted for and reported on from
transactions that agencies do not have control over (administered transactions). This
ensures that agencies are only held fully accountable for the transactions over which
they have control.
Departmental
Departmental assets, liabilities, revenues and expenses in relation to an agency or
authority are those which are controlled by the agency. Departmental expenses include
employee and supplier expenses and other administrative costs which are incurred by
the agency in providing its goods and services.
Administered
Administered items are revenues, expenses, assets and liabilities which are managed
by an agency or authority on behalf of the Government according to set Government
directions. Administered expenses include subsidies, grants and personal benefit
payments and administered revenues include taxes, fees, fines and excises.

Dep
artmen
t abbreviation
Bu
dg
et Statem
ents

Dep
artmen
t abbreviation
Bu
dg
et Statem
ents

Dep
artmen
t abbreviation
Bu
dg
et Statem
ents
Australian Centre for International Agricultural
Research (ACIAR)
Entity resources and planned performance

Dep
artmen
t abbreviation
Bu
dg
et Statem
ents

123
Dep
artmen
t abbreviation
Bu
dg
et Statem
ents
AUSTRALIAN CENTRE FOR INTERNATIONAL
AGRICULTURAL RESEARCH (ACIAR)
Section 1: Entity overview and resources .............................................................. 125
1.1 Strategic direction statement ........................................................................ 125 1.2 Entity resource statement ............................................................................. 127 1.3 Budget measures .......................................................................................... 128
Section 2: Outcomes and planned performance ................................................... 129 2.1 Outcomes and performance information ...................................................... 129
Section 3: Explanatory tables and budgeted financial statements ..................... 133
3.1 Explanatory tables ........................................................................................ 133
3.2 Budgeted financial statements...................................................................... 134


125
AUSTRALIAN CENTRE FOR INTERNATIONAL
AGRICULTURAL RESEARCH (ACIAR)
Section 1: Entity overview and resources
1.1 STRATEGIC DIRECTION STATEMENT
ACIAR works to improve the productivity and profitability of agricultural systems in
countries of the Asia–Pacific region and Indian Ocean rim, through international
agricultural research partnerships. In a whole of government context, ACIAR’s
research agenda underpins the Government’s overarching development policy,
Australian aid: promoting prosperity, reducing poverty, enhancing stability and aligns with
key sectoral priorities outlined in the Strategy for Australia’s aid investments in
agriculture, fisheries and water.
ACIAR will generate new technologies, new knowledge, greater capability and better
decision-making through these research partnerships. By focusing on impact
pathways, ACIAR will deliver benefits to farmers and consumers in developing
countries and Australia.
ACIAR puts Australia’s agricultural innovation system to work to reduce poverty and
contribute to the long-term economic prosperity of developing countries. This work
contributes to stronger economies and to poverty alleviation, and is central to
Australia’s aid agenda. ACIAR contributes to economic diplomacy through improving
agricultural competitiveness and sustainability, increasing value chain efficiency and
effectiveness, and overcoming regulatory impediments in relation to both domestic
and international markets.
Stronger economies in our region assist Australian exporters and investors to access
and profit from foreign markets. Support for more-productive, market-led agricultural
systems, that engage smallholder farmers, encourages developing countries to
effectively tap into new market opportunities. In these ways, ACIAR works towards a
future of shared prosperity. Importantly, ACIAR’s support to international research
partnerships increases the numbers of skilled professionals at research, extension and
farm levels which then builds the potential for sustained agricultural innovation in the
region, an essential element for economic growth and development.
ACIAR will continue to focus research on four areas: crops; livestock and fisheries;
natural resources and forestry; and socioeconomics and policy, with a stronger focus
across all four on developing market opportunities for smallholder farmers. ACIAR
will implement interdisciplinary research approaches between these focal areas and
address key issues, such as gender inequality, that cut across these focal areas. The
research will tackle gender inequality in the design, delivery and impacts of our

ACIAR Budget Statements
126
projects. We will maintain our core mandate of producing excellent research, and work
through others to achieve up-scaling (institutional development) and out-scaling
(broader development).
ACIAR will continue to deepen the existing partnerships and explore new and more
diverse partnerships. Australian aid will become more innovative and catalytic,
particularly through leveraging private sector partnerships and investment, and
ACIAR will continue a greater emphasis on the private sector, and new, innovative
partnerships with emerging economies. In Australia, ACIAR will move towards more
strategic institutional partnerships, and a more programmatic approach in delivery.
ACIAR’s partnership model will also adapt to the increasing skills and expertise in
some of our partner countries. In Australia, ACIAR will seek to increase our
partnership base and support efforts to increase the involvement of young
professionals in international agricultural research. In developing countries, ACIAR
will continue to develop new partnership models increasing regional collaborations
and approaches and developing greater collaboration with the commercial sector.
In 2015-16 in line with the refocusing of the Australian aid program, ACIAR will
increase funding to the Pacific region, particularly PNG. In Fiji, strengthened
development cooperation with Australia will open opportunities for ACIAR to
broaden collaboration aimed at sustainable economic development.
ACIAR will also increase funding to East Asia, working with DFAT to take advantage
of emerging opportunities to develop agricultural programs in the region. In Timor
Leste, ACIAR will continue to work with DFAT to identify ways of building on the
successes of Seeds of Life to further increase the opportunity for economic growth and
linkages with the private sector.
In West and South Asia, we will reduce slightly our engagement and monitor the
security situation in Afghanistan that will define the future of our engagement in that
country. We will continue our engagement in Africa in line with both the priorities of
the Australian aid program and the targets established in ACIAR’s Strategic Plan but
in that process consolidate our work with regional research organisations.
On a global level, ACIAR will monitor the development of the ASEAN zone economic
cooperation by 2015, which will see pressures for cooperation on cross border issues
which intersect with ACIAR’s interests, such as biosecurity, agrifood chains and food
safety. ACIAR will continue to engage in the CGIAR (formerly ‘the Consultative
Group on International Agricultural Research’) reform and positively influence its
future directions.

ACIAR Budget Statements
127
1.2 ENTITY RESOURCE STATEMENT
Table 1.1 shows the total resources from all sources. The table summarises how
resources will be applied by outcome and by administered and departmental
classification.
Table 1.1: ACIAR resource statement — Budget estimates for 2015-16 as at Budget May 2015
Actual
Available
Appropriation
2014-15
$'000
Estimate of
prior year
amounts
available in
2015-16
$'000
Proposed at
2015-16
Budget
$'000
Total 2015-16
estimate
$'000
Ordinary annual services (a)
Departmental appropriation
Prior year appropriations (b) 3,429 3,593 - 3,593
Departmental appropriation (c) 10,051 - 9,905 9,905
s74 Retained revenue receipts (d) 1,697 - 1,933 1,933
Total 15,177 3,593 11,838 15,431
Administered expenses
Outcome 1 86,289 - 81,629 81,629
Total 86,289 - 81,629 81,629
Total ordinary annual services [A] 101,466 3,593 93,467 97,060
Other services (e)
Departmental non-operating
Equity injections 3 - 161 161
Total other services [B] 3 - 161 161
Total available annual appropriations
[A+B] 101,469 3,593 93,628 97,221
Total appropriations excluding special
accounts 101,469 3,593 93,628 97,221
Special accounts
Opening balance (f) 21,177 26,159 - 26,159
Non-appropriation receipts to special
accounts 26,235 - 25,239 25,239
Total special accounts [C] 47,412 26,159 25,239 51,398
Total resourcing [A+B+C] 148,881 29,752 118,867 148,619
Total net resourcing for ACIAR 148,881 29,752 118,867 148,619 (a) Appropriation Bill (No. 1) 2015-16. (b) Estimated adjusted balance carried forward from previous year. (c) Includes an amount of $0.248 for the Departmental Capital Budget (refer to Table 3.2.5 for further
details). For accounting purposes this amount has been designated as ‘contributions by owners’. (d) Estimated Retained revenue receipts under section 74 of the PGPA Act. (e) Appropriation Bill (No. 2) 2015-16. (f) Estimated opening balance for special accounts (less ‘Special Public Money’ held in accounts like Other
Trust Monies accounts (OTM), Services for other Government and Non-agency Bodies accounts (SOG), or Services for Other Entities and Trust Moneys accounts (SOETM)). For further information on special accounts, see Table 3.1.2.
Reader note: All figures are GST exclusive.

ACIAR Budget Statements
128
1.3 BUDGET MEASURES
ACIAR has no new budget measures.

ACIAR Budget Statements
129
Section 2: Outcomes and planned performance
2.1 OUTCOMES AND PERFORMANCE INFORMATION
Government outcomes are the intended results, impacts or consequences of actions by
the Government on the Australian community. Commonwealth programmes are the
primary vehicle by which government entities achieve the intended results of their
outcome statements. Entities are required to identify the programmes which contribute
to government outcomes over the Budget and forward years.
ACIAR’s outcome is described below together with its related programme, specifying
the performance indicators and targets used to assess and monitor the performance of
ACIAR in achieving government outcomes.
Outcome 1: To achieve more productive and sustainable agricultural systems for the benefit of developing countries and Australia through international agricultural research and training partnerships
Outcome 1 strategy
To achieve more productive and sustainable agricultural systems for the benefit of
developing countries and Australia through international agricultural research and
training partnerships ACIAR will:
concentrate efforts in developing countries of Asia and the Pacific, while also
engaging in high-payoff partnerships in other regions in support of Australia’s
foreign policy objectives;
work through bilateral (at least 70%) and multilateral (up to 30%) modalities;
generate new technologies, new knowledge, greater capability and better
decision-making from our research partnerships;
focus research on four areas: crops; livestock and fisheries; natural resources and
forestry; and socioeconomics and policy;
develop a stronger focus on developing market opportunities for smallholder
farmers;
implement cross-disciplinary and interdisciplinary research approaches;
tackle gender inequality, in the design, delivery and impacts of projects;
maintain our core mandate of producing excellent research, and work through
others to achieve up-scaling and broader development;
deepen our existing partnerships and explore new and more diverse
partnerships, with greater emphasis on the private sector and non-government
organisations, and new, innovative partnerships with emerging economies; and

ACIAR Budget Statements
130
move towards more-strategic institutional partnerships, and a more
programmatic approach in delivery.
Outcome expense statement
Table 2.1 provides an overview of the total expenses for Outcome 1, by programme.
Table 2.1: Budgeted expenses for Outcome 1
Outcome 1: To achieve more productive and sustainable
agricultural systems for the benefit of developing countries
and Australia through international agricultural research and
training partnerships
2014-15
Estimated
actual
expenses
$'000
2015-16
Estimated
expenses
$'000
Programme 1: International Agricultural Research and
Development
Administered expenses
Ordinary annual services (Appropriation Bill No. 1) 86,289 81,629
Special accounts 28,235 25,239
Departmental expenses
Departmental appropriation (a) 11,118 11,590
Expenses not requiring appropriation in the Budget year (b) 282 284
Total for programme 1 125,924 118,742
Outcome 1 Totals by appropriation type
Administered expenses
Ordinary annual services (Appropriation Bill No. 1) 86,289 81,629
Special accounts 28,235 25,239
Departmental expenses
Departmental appropriation (a) 11,118 11,590
Expenses not requiring appropriation in the Budget year (b) 282 284
Total expenses for Outcome 1 125,924 118,742
2014-15 2015-16
Average staffing level (number) 74 74 (a) Departmental appropriation combines ‘Ordinary annual services (Appropriation Bill No. 1)’ and ‘Revenue
from independent sources (s 74). (b) Expenses not requiring appropriation in the Budget year are made up of depreciation expenses,
amortisation expenses and audit fees. Note: Departmental appropriation splits and totals are indicative estimates and may change in the course of the budget year as government priorities change.

ACIAR Budget Statements
131
Contributions to Outcome 1
Programme 1: International agricultural research for development for more productive and sustainable agriculture
Programme objective
ACIAR has the single administered programme of international agricultural research for development for more productive and sustainable agriculture, delivered through a number of initiatives aligning closely with the Australian aid policy. The objective of the Programme is to contribute to economic diplomacy through improving agricultural competitiveness and sustainability, increasing value chain efficiency and effectiveness, and alleviating regulatory impediments in relation to both domestic and international markets.
Programme expenses
Aligned to the broader aid program, ACIAR will refocus partnerships towards the Indo Pacific region, with modest increase in percentage allocations of budget made to Pacific and East Asia. The programme in Sub Saharan Africa will target countries in the continent’s east and south.
2014-15
Estimated
actual
$'000
2015-16
Budget
$'000
2016-17
Forw ard
estimate
$'000
2017-18
Forw ard
estimate
$'000
2018-19
Forw ard
estimate
$'000
Annual administered expenses:
Administered item 86,289 81,629 94,836 96,261 97,993
Special account expenses:
ACIAR special account 28,235 25,239 24,156 23,000 21,000
Annual departmental expenses:
Departmental item 11,118 11,590 11,721 11,947 11,809
Expenses not requring appropriation in the
Budget year (a) 282 284 345 349 349
Total programme expenses 125,924 118,742 131,058 131,557 131,151 (a) Expenses not requiring appropriation in the Budget year are made up of depreciation expenses,
amortisation expenses, make-good expenses and audit fees.

ACIAR Budget Statements
132
Programme 1 deliverables
Through diverse research partnerships and both individual and institutional capacity building, ACIAR will deliver:
increased availability of and access to meat, fish, milk, grains, fruits and vegetables;
reduced postharvest losses;
improved nutritional quality and diversity of diets;
increased productivity, quality and market access for smallholder agriculture, aquaculture and forestry products;
greater resilience and diversity of production systems; and
strengthened plant and animal biosecurity.
Programme 1 key performance indicators
ACIAR will improve agricultural competitiveness and sustainability, increase value chain efficiency and effectiveness, and alleviate regulatory impediments in relation to both domestic and international markets. These performance indicators will be measured through monitoring and evaluation of project outputs, analysis of the adoption of project outcomes and through an ongoing impact assessment programme. These will be delivered by generating:
new technologies that enhance agricultural productivity, food sufficiency, diversification and health and nutrition;
new knowledge that improves agricultural productivity and management systems and enhances market opportunities;
greater capability for scientific excellence, agricultural innovation and agribusiness development among researchers, research institutions, policy makers and development partners; and
better decision-making within research and policy institutions to support agricultural innovation and agribusiness development.

ACIAR Budget Statements
133
Section 3: Explanatory tables and budgeted financial statements
Section 3 presents explanatory tables and budgeted financial statements which provide
a comprehensive snapshot of entity finances for the 2015-16 Budget year. It explains
how budget plans are incorporated into the financial statements and provides further
details of the reconciliation between appropriations and programme expenses,
movements in administered funds and special accounts.
3.1 EXPLANATORY TABLES
3.1.1 Movement of administered funds between years
Administered funds can be provided for a specified period, for example under annual
Appropriation Acts. Funds not used in the specified period with the agreement of the
Finance Minister may be moved to a future year.
There has been no movement of administered funds between years for ACIAR since
the 2014-15 Budget.
3.1.2 Special accounts
Special accounts provide a means to set aside and record amounts used for specified
purposes. Special accounts can be created by a Finance Minister’s determination under
section 78 of the PGPA Act or under separate enabling legislation (section 80 of the
PGPA Act refers). Table 3.1.2 shows the expected additions (receipts) and reductions
(payments) for ACIAR’s special account.
Table 3.1.2: Estimates of special account flows and balances
Outcome Opening
balance
$'000
Receipts
$'000
Payments
$'000
Adjustments
$'000
Closing
balance
$'000
Australian Centre for International
Agricultural Research Account (A) 1
26,159 25,239 (25,239) 26,159
Total special accounts
2015-16 Budget estimate 26,159 25,239 (25,239) - 26,159
Total special accounts
2014-15 estimated actual 26,159 28,235 (28,235) - 26,159 (A) = Administered

ACIAR Budget Statements
134
3.2 BUDGETED FINANCIAL STATEMENTS
3.2.1 Budgeted financial statements tables
Table 3.2.1: Comprehensive income statement (showing net cost of services) for the period ended 30 June
2014-15
Estimated
actual
$'000
2015-16
Budget
$'000
2016-17
Forw ard
estimate
$'000
2017-18
Forw ard
estimate
$'000
2018-19
Forw ard
estimate
$'000
EXPENSES
Employee benefits 7,750 8,195 8,300 8,486 8,412
Suppliers 3,397 3,424 3,450 3,490 3,426
Depreciation and amortisation 253 255 316 320 320
Total expenses 11,400 11,874 12,066 12,296 12,158
LESS:
OWN-SOURCE INCOME
Own-source revenue
Sale of goods and rendering of services 1,316 1,933 2,144 2,310 2,110
Total own-source revenue 1,316 1,933 2,144 2,310 2,110
Gains
Other 29 29 29 29 29
Total gains 29 29 29 29 29
Total own-source income 1,345 1,962 2,173 2,339 2,139
Net cost of/(contribution by) services 10,055 9,912 9,893 9,957 10,019
Revenue from Government 9,802 9,657 9,577 9,637 9,699
Surplus/(deficit) attributable to the
Australian Government (253) (255) (316) (320) (320)
Total comprehensive income/(loss)
attributable to the Australian
Government (253) (255) (316) (320) (320) Table continued on the following page.

ACIAR Budget Statements
135
Table 3.2.1: Comprehensive income statement (showing net cost of services) for the period ended 30 June (continued)
Note: Impact of net cash appropriation arrangements
2014-15
$'000
2015-16
$'000
2016-17
$'000
2017-18
$'000
2018-19
$'000
Total comprehensive income/(loss)
excluding depreciation/amortisation
expenses previously funded through
revenue appropriations. (253) (255) (316) (320) (320)
less depreciation/amortisation expenses
previously funded through revenue
appropriations (a) - - - - -
Total comprehensive income/(loss) -
as per the statement of
comprehensive income (253) (255) (316) (320) (320) (a) From 2010-11, the Government introduced net cash appropriation arrangements where Bill 1 revenue appropriations for the depreciation/amortisation expenses of non-corporate Commonwealth entities (and select corporate Commonwealth entities) were replaced with a separate capital budget (the Departmental Capital Budget, or DCB) provided through Bill 1 equity appropriations. For information regarding DCBs, please refer to Table 3.2.5 Departmental Capital Budget Statement. Prepared on Australian Accounting Standards basis.

ACIAR Budget Statements
136
Table 3.2.2: Budgeted departmental balance sheet (as at 30 June)
2014-15
Estimated
actual
$'000
2015-16
Budget
$'000
2016-17
Forw ard
estimate
$'000
2017-18
Forw ard
estimate
$'000
2018-19
Forw ard
estimate
$'000
ASSETS
Financial assets
Cash and cash equivalents 83 83 83 83 83
Trade and other receivables 3,593 3,643 3,690 3,748 3,806
Total financial assets 3,676 3,726 3,773 3,831 3,889
Non-financial assets
Land and buildings 359 445 315 234 212
Property, plant and equipment 511 583 637 666 645
Intangibles 103 99 108 90 65
Other non-financial assets 136 136 136 136 136
Total non-financial assets 1,109 1,263 1,196 1,126 1,058
Total assets 4,785 4,989 4,969 4,957 4,947
LIABILITIES
Payables
Suppliers 299 307 319 329 339
Other payables 24 26 25 25 25
Total payables 323 333 344 354 364
Provisions
Employee provisions 2,086 2,126 2,164 2,212 2,260
Total provisions 2,086 2,126 2,164 2,212 2,260
Total liabilities 2,409 2,459 2,508 2,566 2,624
Net assets 2,376 2,530 2,461 2,391 2,323
EQUITY*
Parent entity interest
Contributed equity 1,738 2,147 2,393 2,643 2,895
Reserves 751 751 751 751 751
Retained surplus (accumulated deficit) (113) (368) (683) (1,003) (1,323)
Total parent entity interest 2,376 2,530 2,461 2,391 2,323
Total Equity 2,376 2,530 2,461 2,391 2,323 *‘Equity’ is the residual interest in assets after deduction of liabilities. Prepared on Australian Accounting Standards basis.

ACIAR Budget Statements
137
Table 3.2.3: Departmental statement of changes in equity — summary of movement (Budget year 2015-16)
Retained
earnings
$'000
Asset
revaluation
reserve
$'000
Contributed
equity/ capital
$'000
Total equity
$'000
Opening balance as at 1 July 2015
Balance carried forw ard from previous
period (113) 751 1,738 2,376
Adjusted opening balance (113) 751 1,738 2,376
Comprehensive income
Surplus/(deficit) for the period (255) - - (255)
Total comprehensive income (255) - - (255)
of w hich:
Attributable to the Australian
Government (255) - - (255)
Transactions with owners
Contributions by owners
Equity Injection - Appropriation - - 161 161
Departmental Capital Budget (DCB) - - 248 248
Sub-total transactions with owners - - 409 409
Closing balance attributable to the
Australian Government (368) 751 2,147 2,530 Prepared on Australian Accounting Standards basis.
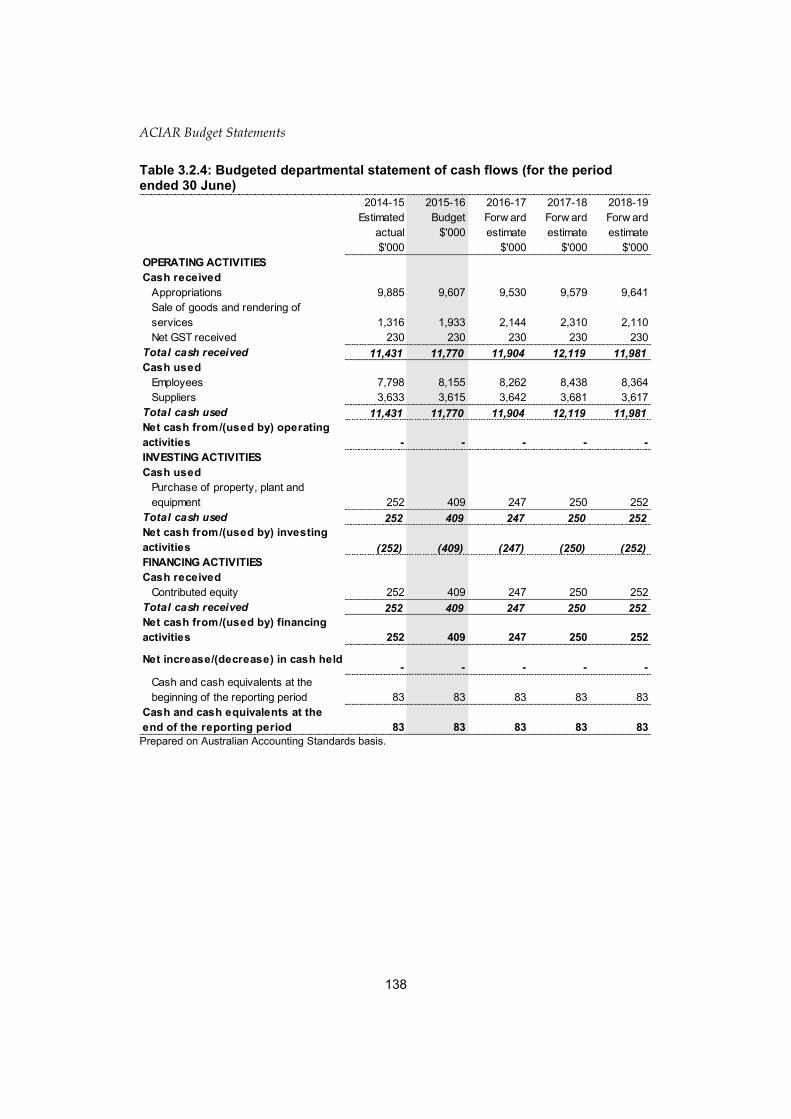
ACIAR Budget Statements
138
Table 3.2.4: Budgeted departmental statement of cash flows (for the period ended 30 June)
2014-15
Estimated
actual
$'000
2015-16
Budget
$'000
2016-17
Forw ard
estimate
$'000
2017-18
Forw ard
estimate
$'000
2018-19
Forw ard
estimate
$'000
OPERATING ACTIVITIES
Cash received
Appropriations 9,885 9,607 9,530 9,579 9,641
Sale of goods and rendering of
services 1,316 1,933 2,144 2,310 2,110
Net GST received 230 230 230 230 230
Total cash received 11,431 11,770 11,904 12,119 11,981
Cash used
Employees 7,798 8,155 8,262 8,438 8,364
Suppliers 3,633 3,615 3,642 3,681 3,617
Total cash used 11,431 11,770 11,904 12,119 11,981
Net cash from/(used by) operating
activities - - - - -
INVESTING ACTIVITIES
Cash used
Purchase of property, plant and
equipment 252 409 247 250 252
Total cash used 252 409 247 250 252
Net cash from/(used by) investing
activities (252) (409) (247) (250) (252)
FINANCING ACTIVITIES
Cash received
Contributed equity 252 409 247 250 252
Total cash received 252 409 247 250 252
Net cash from/(used by) financing
activities 252 409 247 250 252
Net increase/(decrease) in cash held- - - - -
Cash and cash equivalents at the
beginning of the reporting period 83 83 83 83 83
Cash and cash equivalents at the
end of the reporting period 83 83 83 83 83 Prepared on Australian Accounting Standards basis.

ACIAR Budget Statements
139
Table 3.2.5: Departmental capital budget statement (for the period ended 30 June)
2014-15
Estimated
actual
$'000
2015-16
Budget
$'000
2016-17
Forw ard
estimate
$'000
2017-18
Forw ard
estimate
$'000
2018-19
Forw ard
estimate
$'000
NEW CAPITAL APPROPRIATIONS
Capital budget - Bill 1 (DCB) 249 248 247 250 252
Equity injections - Bill 2 3 161 - - -
Total new capital appropriations 252 409 247 250 252
Provided for:
Purchase of non-financial assets 252 409 247 250 252
Total Items 252 409 247 250 252
PURCHASE OF NON-FINANCIAL
ASSETS
Funded by capital appropriations (a) 3 161 - - -
Funded by capital appropriation - DCB (b) 249 248 247 250 252
TOTAL 252 409 247 250 252
RECONCILIATION OF CASH USED TO
ACQUIRE ASSETS TO ASSET
MOVEMENT TABLE
Total purchases 252 409 247 250 252
Total cash used to acquire assets 252 409 247 250 252 (a) Includes both current Bill 2 and prior Act 2/4/6 appropriations and special capital appropriations. (b) Does not include annual finance lease costs. Includes purchases from current and previous years’
Departmental Capital Budgets (DCBs). Prepared on Australian Accounting Standards basis.

ACIAR Budget Statements
140
Dep
artmen
t abbreviation
Bu
dget S
tatemen
ts
Table 3.2.6: Statement of asset movements (Budget year 2015-16)
Buildings
$'000
Other property,
plant and
equipment
$'000
Computer
softw are and
intangibles
$'000
Total
$'000
As at 1 July 2015
Gross book value 434 636 689 1,759
Accumulated depreciation/amortisation and
impairment (75) (125) (586) (786)
Opening net book balance 359 511 103 973
Capital asset additions
Estimated expenditure on new or
replacement assets
By purchase - appropriation equity (a) 161 - - 161
By purchase - appropriation ordinary annual
services (b) - 196 52 248
Total additions 161 196 52 409
Other movements
Depreciation/amortisation expense (75) (124) (56) (255)
Total other movements (75) (124) (56) (255)
As at 30 June 2016
Gross book value 595 832 741 2,168
Accumulated depreciation/amortisation and
impairment (150) (249) (642) (1,041)
Closing net book balance 445 583 99 1,127 (a) ‘Appropriation equity’ refers to equity injections appropriations provided through Appropriation Bill (No. 2)
2015-16, including CDABs. (b) ‘Appropriation ordinary annual services’ refers to funding provided through Appropriation Bill (No. 1)
2015-16 for depreciation/amortisation expenses, DCBs or other operational expenses. Prepared on Australian Accounting Standards basis.

ACIAR Budget Statements
141
Dep
artmen
t abbreviation
Bu
dg
et Statem
ents
Table 3.2.7: Schedule of budgeted income and expenses administered on behalf of Government (for the period ended 30 June)
2014-15
Estimated
actual
$'000
2015-16
Budget
$'000
2016-17
Forw ard
estimate
$'000
2017-18
Forw ard
estimate
$'000
2018-19
Forw ard
estimate
$'000
EXPENSES
Employee benefits 303 315 328 342 342
Suppliers 114,221 106,553 118,664 118,919 118,651
Total expenses administered on
behalf of Government 114,524 106,868 118,992 119,261 118,993
LESS:
OWN-SOURCE INCOME
Own-source revenue
Non-taxation revenue
Sale of goods and rendering of
services 28,235 25,239 24,156 23,000 21,000
Total non-taxation revenue 28,235 25,239 24,156 23,000 21,000
Total own-source revenue
administered on behalf of
Government 28,235 25,239 24,156 23,000 21,000
Total own-sourced income
administered on behalf of
Government 28,235 25,239 24,156 23,000 21,000
Net cost of/(contribution by) services 86,289 81,629 94,836 96,261 97,993
Total comprehensive income/(loss) 86,289 81,629 94,836 96,261 97,993 Prepared on Australian Accounting Standards basis.

ACIAR Budget Statements
142
Table 3.2.8: Schedule of budgeted assets and liabilities administered on behalf of Government (as at 30 June)
2014-15
Estimated
actual
$'000
2015-16
Budget
$'000
2016-17
Forw ard
estimate
$'000
2017-18
Forw ard
estimate
$'000
2018-19
Forw ard
estimate
$'000
ASSETS
Financial assets
Cash and cash equivalents 26,159 26,159 26,159 26,159 26,159
Taxation receivables 785 785 785 785 785
Other f inancial assets 4,046 4,046 4,046 4,046 4,046
Total financial assets 30,990 30,990 30,990 30,990 30,990
Total assets administered on behalf
of Government 30,990 30,990 30,990 30,990 30,990
LIABILITIES
Payables
Suppliers 2,522 2,572 2,572 2,572 2,572
Other payables 678 678 678 678 678
Total payables 3,200 3,250 3,250 3,250 3,250
Provisions
Employee provisions 33 33 33 33 33
Total provisions 33 33 33 33 33
Total liabilities administered on
behalf of Government 3,233 3,283 3,283 3,283 3,283
Net assets/(liabilities) 27,757 27,707 27,707 27,707 27,707 Prepared on Australian Accounting Standards basis.

ACIAR Budget Statements
143
Table 3.2.9: Schedule of budgeted administered cash flows (for the period ended 30 June)
2014-15
Estimated
actual
$'000
2015-16
Budget
$'000
2016-17
Forw ard
estimate
$'000
2017-18
Forw ard
estimate
$'000
2018-19
Forw ard
estimate
$'000
OPERATING ACTIVITIES
Cash received
External Funds 28,235 25,239 24,156 23,000 21,000
Net GST received 4,600 4,500 4,500 4,500 4,500
Total cash received 32,835 29,739 28,656 27,500 25,500
Cash used
Suppliers 114,172 106,503 118,664 118,919 118,651
Employees 303 315 328 342 342
Total cash used 114,475 106,818 118,992 119,261 118,993
Net cash from/(used by) operating
activities (81,640) (77,079) (90,336) (91,761) (93,493)
Net increase/(decrease) in cash held (81,640) (77,079) (90,336) (91,761) (93,493)
Cash and cash equivalents at beginning
of reporting period 26,159 26,159 26,159 26,159 26,159
Cash from Official Public Account for:
- Appropriations 86,240 81,579 94,836 96,261 97,993
Total cash from Official Public
Account 86,240 81,579 94,836 96,261 97,993
Cash to Official Public Account for:
- Appropriations (4,600) (4,500) (4,500) (4,500) (4,500)
Total cash to Official Public Account (4,600) (4,500) (4,500) (4,500) (4,500)
Cash and cash equivalents at end of
reporting period 26,159 26,159 26,159 26,159 26,159 Prepared on Australian Accounting Standards basis.

ACIAR Budget Statements
144
Dep
artmen
t abbreviation
Bu
dg
et Statem
ents
3.2.2 Notes to the financial statements
Departmental financial statements and schedule of administered activity
Under the Australian Government’s budgeting framework, and consistent with
Australian Accounting Standards, transactions that agencies control (departmental
transactions) are budgeted for, and reported on, separately to transactions which
agencies do not have control over (administered transactions). This ensures that
agencies are only held fully accountable for the transactions over which they have
control.
• Departmental items are those assets, liabilities, revenues and expenses in relation to
an agency or authority that are controlled by the agency. Departmental expenses
include employee and supplier expenses and other administrative costs, which are
incurred by the agency in providing its goods and services.
• Administered items are revenues, expenses, assets and liabilities that are managed
by an agency or authority on behalf of the Government according to set
government directions. Administered expenses include subsidies, grants and
personal benefit payments and administered revenues include taxes, fees, fines and
excises.
Appropriations in the budgeting framework
Under the Australian Government’s budgeting framework, separate annual
appropriations are provided for:
• departmental appropriations: representing the Government’s funding for agency
programs;
• departmental capital budget appropriations: representing the Government’s
funding through additional equity for the replacement of existing agency assets as
they reach the end of their useful life;
• departmental capital appropriations: for new investments by the Government
through additional equity; and
• administered expense appropriations: for the estimated administered expenses
relating to specific programs.
Asset valuation
In accordance with current Australian accounting standards and the Finance Minister’s
Orders, the Agency’s assets are carried at fair value.

Dep
artmen
t abbreviation
Bu
dg
et Statem
ents

Dep
artmen
t abbreviation
Bu
dg
et Statem
ents

Dep
artmen
t abbreviation
Bu
dg
et Statem
ents
Australian Secret Intelligence Service (ASIS)
Entity resources and planned performance

Dep
artmen
t abbreviation
Bu
dg
et Statem
ents

149
Dep
artmen
t abbreviation
Bu
dg
et Statem
ents
AUSTRALIAN SECRET INTELLIGENCE SERVICE (ASIS)
Section 1: Entity overview and resources .............................................................. 151
1.1 Strategic direction statement ........................................................................ 151 1.2 Entity resource statement ............................................................................. 152 1.3 Budget measures .......................................................................................... 153
Section 2: Outcomes and planned performance ................................................... 154 2.1 Outcomes and performance information ...................................................... 154
Section 3: Budgeted financial statements .............................................................. 158
3.2 Budgeted financial statements...................................................................... 159


151
Dep
artmen
t abbreviation
Bu
dg
et Statem
ents
AUSTRALIAN SECRET INTELLIGENCE SERVICE (ASIS)
Section 1: Entity overview and resources
1.1 STRATEGIC DIRECTION STATEMENT
In 2015-16 the Australian Secret Intelligence Service (ASIS) will continue to enhance
Government understanding of the overseas environment affecting Australia’s vital
interests. ASIS will take appropriate action, consistent with applicable legislation, to
protect and promote Australia’s vital interests through the provision of unique foreign
intelligence services as directed by the Government.
The primary functions of ASIS are:
(a) to obtain, in accordance with the Government’s requirements, intelligence about
the capabilities, intentions or activities of people or organisations outside
Australia;
(b) to communicate, in accordance with the Government’s requirements, such
intelligence;
(c) to conduct counter-intelligence activities;
(d) to liaise with intelligence or security services, or other authorities, of other
countries; and
(e) to undertake such other activities as the responsible Minister directs relating to
the capabilities, intentions or activities of people or organisations outside
Australia.

ASIS Budget Statements
152
1.2 ENTITY RESOURCE STATEMENT
Table 1.1 shows the total resources from all sources. The table summarises how
resources will be applied by outcome and by departmental classification.
Table 1.1: ASIS resource statement — Budget estimates for 2015-16 as at Budget May 2015
Actual
Available
Appropriation
2014-15
$'000
Estimate of
prior year
amounts
available in
2015-16
$'000
Proposed at
2015-16
Budget
$'000
Total
2015-16
estimate
$'000
Ordinary annual services (a)
Departmental appropriation
Prior year appropriations (b) 93,402 83,159 - 83,159
Departmental appropriation (c) 236,133 - 256,909 256,909
s74 Retained revenue receipts (d) 34,500 - 54,500 54,500
Total 364,035 83,159 311,409 394,568
Total ordinary annual services [A] 364,035 83,159 311,409 394,568
Other services (e)
Departmental non-operating
Equity injections 8,725 - 10,964 10,964
Total 8,725 - 10,964 10,964
Total other services [B] 8,725 - 10,964 10,964
Total available annual appropriations
[A+B] 372,760 83,159 322,373 405,532 (a) Appropriation Bill (No. 1) 2015-16. (b) Estimated adjusted balance carried forward from previous year. (c) Includes an amount for the Departmental Capital Budget. For accounting purposes this amount
has been designated as ‘contributions by owners’. (d) Estimated Retained revenue receipts under section 74 of the PGPA Act. (e) Appropriation Bill (No. 2) 2015-16. Reader note: All figures are GST exclusive.

ASIS Budget Statements
153
1.3 BUDGET MEASURES
Budget measures in Part 1 relating to ASIS are detailed in Budget Paper No. 2 and are
summarised below.
Table 1.2: Entity 2015-16 Budget measures
Part 1: Measures announced since the 2014-15 Mid-Year Economic and Fiscal Outlook (MYEFO)
Programme
2014-15
$'000
2015-16
$'000
2016-17
$'000
2017-18
$'000
2018-19
$'000
Expense measures
National Security - Australian Secret
Intelligence Service - Strengthening
Capabilities
Departmental expenses 1.1 7,955 10,725 15,241 18,062
Departmental expenses 1.2 2,652 3,575 5,080 6,021
Total 10,607 14,300 20,321 24,083
Total expense measures 10,607 14,300 20,321 24,083
Capital measures
National Security - Australian Secret
Intelligence Service - Strengthening
Capabilities
Departmental capital 1.1 5,168 35,116 39,844 23,094
Departmental capital 1.2 1,723 11,705 13,282 7,698
Total 6,891 46,821 53,126 30,792
Total capital measures 6,891 46,821 53,126 30,792 Prepared on a Government Finance Statistics (fiscal) basis.

ASIS Budget Statements
154
Section 2: Outcomes and planned performance
2.1 OUTCOMES AND PERFORMANCE INFORMATION
Government outcomes are the intended results, impacts or consequences of actions by
the Government on the Australian community. Commonwealth programmes are the
primary vehicle by which Government entities achieve the intended results of their
outcome statements. Entities are required to identify the programmes which contribute
to Government outcomes over the Budget and forward years.
Each outcome is described below together with its related programmes, specifying the
performance indicators and targets used to assess and monitor the performance of
ASIS in achieving Government outcomes.
Outcome 1: Enhanced understanding for the Government of the overseas environment affecting Australia’s interests through the provision of covert intelligence services about the capabilities, intentions or activities of people or organisations outside Australia
Outcome 1 strategy
Enhanced understanding for the Government of the overseas environment
affecting Australia’s interests through the provision of covert intelligence
services about the capabilities, intentions or activities of people or organisations
outside Australia.

ASIS Budget Statements
155
Outcome expense statement
Table 2.1 provides an overview of the total expenses for Outcome 1 by programme.
Table 2.1: Budgeted expenses for Outcome 1
Outcome 1: Enhanced understanding for the Government of
the overseas environment affecting Australia’s interests
through the provision of covert intelligence services about the
capabilities, intentions or activities of people or organisations
outside Australia.
2014-15
Estimated
actual
expenses
$'000
2015-16
Estimated
expenses
$'000
Programme 1.1: Secret Intelligence
Departmental expenses
Departmental appropriation (a) 194,338 220,922
Expenses not requiring appropriation in the Budget year (b) 15,168 16,735
Total for programme 1.1 209,506 237,657
Programme 1.2: Other Services
Departmental expenses
Departmental appropriation (a) 59,976 73,641
Expenses not requiring appropriation in the Budget year (b) 5,056 5,578
Total for programme 1.2 65,032 79,219
Outcome 1 Totals by appropriation type
Departmental expenses
Departmental appropriation (a) 254,314 294,563
Expenses not requiring appropriation in the Budget year (b) 20,224 22,313
Total expenses for Outcome 1 274,538 316,876 (a) Departmental Appropriation combines ‘Ordinary annual services (Appropriation Bill No. 1)’ and ‘Revenue
from independent sources (s 74)’. (b) Expenses not requiring appropriation in the Budget year is made up of depreciation expense. Note: Departmental appropriation splits and totals are indicative estimates and may change in the course of the budget year as Government priorities change.
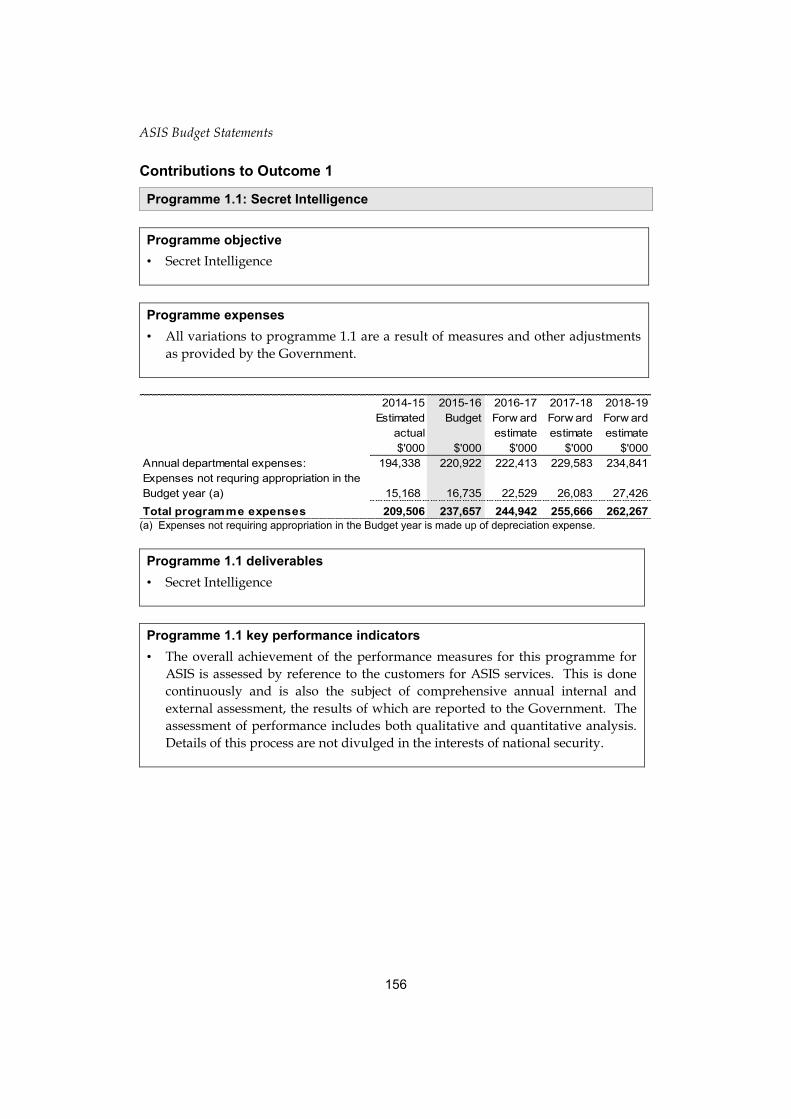
ASIS Budget Statements
156
Contributions to Outcome 1
Programme 1.1: Secret Intelligence
Programme objective
• Secret Intelligence
Programme expenses
• All variations to programme 1.1 are a result of measures and other adjustments
as provided by the Government.
2014-15
Estimated
actual
$'000
2015-16
Budget
$'000
2016-17
Forw ard
estimate
$'000
2017-18
Forw ard
estimate
$'000
2018-19
Forw ard
estimate
$'000
Annual departmental expenses: 194,338 220,922 222,413 229,583 234,841
Expenses not requring appropriation in the
Budget year (a) 15,168 16,735 22,529 26,083 27,426
Total programme expenses 209,506 237,657 244,942 255,666 262,267 (a) Expenses not requiring appropriation in the Budget year is made up of depreciation expense.
Programme 1.1 deliverables
• Secret Intelligence
Programme 1.1 key performance indicators
• The overall achievement of the performance measures for this programme for
ASIS is assessed by reference to the customers for ASIS services. This is done
continuously and is also the subject of comprehensive annual internal and
external assessment, the results of which are reported to the Government. The
assessment of performance includes both qualitative and quantitative analysis.
Details of this process are not divulged in the interests of national security.

ASIS Budget Statements
157
Programme 1.2: Other Services
Programme objective
• Other Services
Programme expenses
• All variations to programme 1.2 are a result of measures and other adjustments
as provided by the Government.
2014-15
Estimated
actual
$'000
2015-16
Budget
$'000
2016-17
Forw ard
estimate
$'000
2017-18
Forw ard
estimate
$'000
2018-19
Forw ard
estimate
$'000
Annual departmental expenses: 59,976 73,641 74,138 76,528 78,280
Expenses not requiring appropriation in the
Budget year (a) 5,056 5,578 7,509 8,694 9,142
Total programme expenses 65,032 79,219 81,647 85,222 87,422
(a) Expenses not requiring appropriation in the Budget year is made up of depreciation expense.
Programme 1.2 deliverables
• Other Services
Programme 1.2 key performance indicators
• The overall achievement of the performance measures for this programme for
ASIS is assessed by reference to the customers for ASIS services. This is done
continuously and is also the subject of comprehensive annual internal and
external assessment, the results of which are reported to the Government. The
assessment of performance includes both qualitative and quantitative analysis.
Details of this process are not divulged in the interests of national security.

ASIS Budget Statements
158
Section 3: Budgeted financial statements
Section 3 presents budgeted financial statements which provide a comprehensive
snapshot of entity finances for the 2015-16 budget year. It explains how budget plans
are incorporated into the financial statements and provides further details of the
reconciliation between appropriations and programme expenses.

ASIS Budget Statements
159
3.2 BUDGETED FINANCIAL STATEMENTS
3.2.3 Budgeted financial statements tables
Table 3.2.1: Comprehensive income statement (showing net cost of services) for the period ended 30 June
2014-15
Estimated
actual
$'000
2015-16
Budget
$'000
2016-17
Forw ard
estimate
$'000
2017-18
Forw ard
estimate
$'000
2018-19
Forw ard
estimate
$'000
EXPENSES
Total expenses 274,538 316,876 326,589 340,888 349,689
LESS:
OWN-SOURCE INCOME
Own-source revenue
Other 34,500 54,500 55,500 56,500 57,500
Total own-source revenue 34,500 54,500 55,500 56,500 57,500
Gains
Other - - - - -
Total gains - - - - -
Total own-source income 34,500 54,500 55,500 56,500 57,500
Net cost of/(contribution by)
services 240,038 262,376 271,089 284,388 292,189
Revenue from Government 219,814 240,063 241,051 249,611 255,621
Surplus/(deficit) attributable to the
Australian Government (20,224) (22,313) (30,038) (34,777) (36,568)
Total comprehensive income/(loss)
attributable to the Australian
Government (20,224) (22,313) (30,038) (34,777) (36,568)
Note: Impact of net cash appropriation arrangements
2014-15
$'000
2015-16
$'000
2016-17
$'000
2017-18
$'000
2018-19
$'000
Total comprehensive income/(loss)
excluding depreciation/amortisation
expenses previously funded
through revenue appropriations. - - - - -
less depreciation/amortisation
expenses previously funded through
revenue appropriations (a) 20,224 22,313 30,038 34,777 36,568
Total comprehensive income/(loss) -
as per the statement of
comprehensive income (20,224) (22,313) (30,038) (34,777) (36,568) a) From 2010-11, the Government introduced net cash appropriation arrangements where Bill 1 revenue
appropriations for the depreciation/amortisation expenses of non-corporate Commonwealth entities (and select corporate Commonwealth entities) were replaced with a separate capital budget (the Departmental Capital Budget, or DCB) provided through Bill 1 equity appropriations.
Prepared on Australian Accounting Standards basis.

ASIS Budget Statements
160
Table 3.2.2: Budgeted departmental balance sheet (as at 30 June)
2014-15
Estimated
actual
$'000
2015-16
Budget
$'000
2016-17
Forw ard
estimate
$'000
2017-18
Forw ard
estimate
$'000
2018-19
Forw ard
estimate
$'000
ASSETS
Financial assets 83,159 85,552 86,572 89,072 91,074
Non-financial assets 141,820 147,317 184,327 219,441 230,580
Total assets 224,979 232,869 270,899 308,513 321,654
LIABILITIES
Payables 26,118 22,800 23,457 24,517 25,441
Interest bearing liabilities - - - - -
Provisions 40,041 45,752 46,115 47,554 48,633
Total liabilities 66,159 68,552 69,572 72,071 74,074
Net assets 158,820 164,317 201,327 236,442 247,580
EQUITY*
Parent entity interest
Contributed equity 152,044 179,854 246,902 316,793 364,499
Reserves 73,000 73,000 73,000 73,000 73,000
Retained surplus (accumulated deficit)(66,224) (88,537) (118,575) (153,351) (189,919)
Total parent entity interest 158,820 164,317 201,327 236,442 247,580
Total Equity 158,820 164,317 201,327 236,442 247,580 * ‘Equity’ is the residual interest in assets after deduction of liabilities. Prepared on Australian Accounting Standards basis.

ASIS Budget Statements
161
Table 3.2.3: Departmental statement of changes in equity — summary of movement (Budget year 2015-16)
Retained
earnings
$'000
Asset
revaluation
reserve
$'000
Other
reserves
$'000
Contributed
equity/
capital
$'000
Total
equity
$'000
Opening balance as at 1 July 2015
Balance carried forw ard from
previous period (66,224) - 73,000 152,044 158,820
Adjusted opening balance (66,224) - 73,000 152,044 158,820
Comprehensive income
Other comprehensive income - - - - -
Surplus/(deficit) for the period (22,313) - - - (22,313)
Total comprehensive income (22,313) - - - (22,313)
of w hich:
Attributable to the Australian
Government (22,313) - - - (22,313)
Transactions with owners
Contributions by owners
Equity Injection - Appropriation - - - 10,964 10,964
Departmental Capital Budget (DCB) - - - 16,846 16,846
Sub-total transactions with owners - - - 27,810 27,810
Estimated closing balance as at
30 June 2016 (88,537) - 73,000 179,854 164,317
Closing balance attributable to the
Australian Government (88,537) - 73,000 179,854 164,317 Prepared on Australian Accounting Standards basis.

ASIS Budget Statements
162
Table 3.2.4: Budgeted departmental statement of cash flows (for the period ended 30 June)
2014-15
Estimated
actual
$'000
2015-16
Budget
$'000
2016-17
Forw ard
estimate
$'000
2017-18
Forw ard
estimate
$'000
2018-19
Forw ard
estimate
$'000
OPERATING ACTIVITIES
Cash received
Appropriations 230,655 237,671 240,030 247,112 253,618
Other 34,500 54,500 55,500 56,500 57,500
Total cash received 265,155 292,171 295,530 303,612 311,118
Cash used
Other 265,155 292,171 295,530 303,612 311,118
Total cash used 265,155 292,171 295,530 303,612 311,118
Net cash from/(used by) operating
activities - - - - -
INVESTING ACTIVITIES
Cash received
Other - - - - -
Total cash received - - - - -
Cash used
Other 25,044 27,810 67,048 69,891 47,706
Total cash used 25,044 27,810 67,048 69,891 47,706
Net cash from/(used by) investing
activities (25,044) (27,810) (67,048) (69,891) (47,706)
FINANCING ACTIVITIES
Cash received
Other 25,044 27,810 67,048 69,891 47,706
Total cash received 25,044 27,810 67,048 69,891 47,706
Cash used
Other - - - - -
Total cash used - - - - -
Net cash from/(used by) financing
activities 25,044 27,810 67,048 69,891 47,706
Net increase/(decrease) in cash held- - - - -
Cash and cash equivalents at the
beginning of the reporting period 19,000 19,000 19,000 19,000 19,000
Cash and cash equivalents at the
end of the reporting period 19,000 19,000 19,000 19,000 19,000 Prepared on Australian Accounting Standards basis.
ASIS Budget Statements
163
3.2.4 Notes to the financial statements Under the Australian Government’s budgeting framework, and consistent with
Australian Accounting Standards, ASIS controls all the entity’s transactions. ASIS is
fully accountable for assets, liabilities, revenues and expenses in relation to the entity.
ASIS has no administered transactions.

Dep
artmen
t abbreviation
Bu
dg
et Statem
ents
Dep
artmen
t abbreviation
Bu
dg
et Statem
ents
Tourism Australia
Entity resources and planned performance


167
Dep
artmen
t abbreviation
Bu
dg
et Statem
ents
TOURISM AUSTRALIA
Section 1: Entity overview and resources .............................................................. 169
1.1 Strategic direction statement ........................................................................ 169 1.2 Entity resource statement ............................................................................. 172 1.3 Budget measures .......................................................................................... 173
Section 2: Outcomes and planned performance ................................................... 174
2.1 Outcomes and performance information ...................................................... 174
Section 3: Explanatory tables and budgeted financial statements ..................... 182
3.1 Explanatory tables ........................................................................................ 182
3.2 Budgeted financial statements...................................................................... 183


169
TOURISM AUSTRALIA
Section 1: Entity overview and resources
1.1 STRATEGIC DIRECTION STATEMENT
As Australia’s national tourism marketing organisation, Tourism Australia’s key
contribution to Australia’s economy in 2015-16 will be to increase international leisure
and business events visitation by promoting Australia as a compelling tourism
destination. This will be undertaken through partnership marketing that targets
consumers in key international markets, and working with distribution partners to
convert Australia’s appeal into more visits.
Australian tourism industry outlook
Tourism Australia anticipates a stable environment for inbound tourism in 2015-16,
with global GDP growth forecast to trend at around 3 percent (Tourism Research
Australia). Economic growth in Asia’s economies is expected to ease slightly, while
economic conditions in the USA and Western Europe are expected to improve
moderately.
Australia continues to be rated as one of the most desired tourism destinations in the
world (Future Brand, 2014). Demand for travel to Australia is expected to grow during
2015-16, with international inbound visitors increasing by 5 percent to 7.3 million
visitors (Tourism Forecasting Committee, 2014).
While Australia’s tourism brand is strong, competition is significant with more than
190 countries competing aggressively for the global tourism dollar. Tourism Australia
will respond to this increasing competition by focusing on Australia’s competitive
advantages – its spectacular natural beauty, pristine environment, friendly and
welcoming people and world class food and wine.
Tourism 2020
Tourism 2020 is a whole of government and industry long-term strategy to build the
resilience and competitiveness of Australia’s tourism industry and grow its economic
contribution to Australia’s economy. It focuses on improving the industry’s global
performance and competitiveness by pursuing the strongest opportunities for growth
and addressing supply-side factors.
Under Tourism 2020, Tourism Australia has primary carriage of international tourism
marketing and distribution and works with other Australian government agencies to
support aviation development and to attract investment.

Tourism Australia Budget Statements
170
Objectives 2015-16
Tourism Australia works with industry and all levels of government across Australia
to maximise the economic contribution of Australian tourism. The industry has set a
goal to increase overnight tourism expenditure from $70 billion in 2009 to more than
$115 billion in 2020. To achieve this, Tourism Australia will focus on the following in
2015-16:
continuing to reinforce Tourism Australia’s competitive focus to achieve Tourism 2020 goals;
investing in markets that present the greatest potential for growth;
driving conversion by engaging consumers and making it easier to choose and book a trip to Australia;
growing and extending partnerships;
driving yield by targeting high spending consumers, including increased focus on business events and major events; and
heightening capability and productivity of the Tourism Australia team.
Strategies 2015-16
Two target customers will remain at the core of Tourism Australia’s marketing
activities – the leisure traveller and the business events traveller.
Activity will continue to be implemented via three core strategies:
Customer Focus – marketing activity centres on the target customer.
Partnership Focus – partnerships engage target customers, drive bookings and
yield and facilitate industry development.
Government Focused – committed to a whole of government approach.
Tourism Australia will focus on markets that represent the greatest long-term
expenditure growth potential to 2020. Criteria will be latent demand, current and
short-term performance, expected changes in aviation capacity and the marketing
emphasis of industry and state and territory tourism organisations. In 2015-16 markets
will be categorised as:
worth over $5 billion by 2020 – Greater China (China12and Hong Kong), North
America (USA1 and Canada), United Kingdom;
worth over $2.5 billion by 2020 – Singapore, Malaysia, the Republic of Korea,
New Zealand1;
worth over $1 billion by 2020 – Continental Europe (Germany, Italy, France), India, Indonesia, Japan; and
rest of world – Brazil.
1 Business events marketing will be undertaken in these markets, New Zealand will have a business events focus.

Tourism Australia Budget Statements
171
Marketing communications will continue under the There’s nothing like Australia
campaign umbrella and will lead with the best of Australia’s tourism experiences.
Messaging will focus on extending Australia’s growing food and wine credentials
through continued investment in Restaurant Australia; reclaiming Australia’s
advantage around beaches, coastal and aquatic nature; and reinforcing the breadth of
Australia’s Indigenous offering. The aim will be to raise the urgency to visit, increase
knowledge and build a strong image of what Australia has to offer global travellers.
Research undertaken in 2014 found that Australia’s events and major events have
significant potential to further differentiate Australia’s tourism offerings and drive
visitation and increased spend by consumers. Tourism Australia will increase
emphasis on events in its marketing activity during 2015-16.
Resources and effort will continue to increase in digital and content marketing, led by
a revitalised australia.com (a new version of the site was launched in March 2015).
Tourism Australia’s digital and social marketing emphasis will be to personalise,
socialise and mobilise content to make it more relevant and timely by using insights
from relevant data and analytics.
Tourism Australia’s business events activity will continue to focus on attracting high
yielding visitors to Australia. Following a review in 2014, a new approach which
concentrates on two sectors – associations and incentives – will be undertaken from
2015, including a differentiated marketing approach for each of these streams.

Tourism Australia Budget Statements
172
1.2 ENTITY RESOURCE STATEMENT
Table 1.1 shows the total resources from all sources. The table summarises how
resources will be applied by outcome and by administered and departmental
classification.
Table 1.1: Corporate Entity Tourism Australia resource statement — Budget estimates for 2015-16 as at Budget May 2015
Actual
Available
Appropriation
2014-15
$'000
Estimate of
prior year
amounts
available in
2015-16
$'000
Proposed at
2015-16
Budget
$'000
Total 2015-16
estimate
$'000
Ordinary annual services (a)
Departmental appropriation
Outcome 1 - Grow demand and foster a
competitive and sustainable Australian
tourism industry through partnership
marketing to targeted global consumers in
key markets
138,865 - 137,290 137,290
Funds from Portfolio Agency 13,500 - 14,000 14,000
Total ordinary annual services 152,365 - 151,290 151,290
Total annual appropriations 138,865 - 137,290 137,290
Total funds from Government 152,365 - 151,290 151,290
Funds from other sources
Interest 1,800 - 1,300 1,300
Other 14,726 - 16,574 16,574
Total 16,526 - 17,874 17,874
Total net resourcing for agency 168,891 - 169,164 169,164 (a) Appropriation Bill (No. 1) 2015-16 and Appropriation Bill (No. 3); includes funding for prior year foreign
exchange losses of $9.115 million.

Tourism Australia Budget Statements
173
1.3 BUDGET MEASURES
Budget measures in Part 1 relating to Tourism Australia are detailed in Budget Paper
No.2 and are summarised below.
Table 1.2: Entity 2015-16 Budget measures
Part 1: Measures announced since the 2014-15 Mid-Year Economic and Fiscal Outlook (MYEFO)
Programme
2014-15
$'000
2015-16
$'000
2016-17
$'000
2017-18
$'000
2018-19
$'000
Expense measure
Australia Week Events 1.1
Departmental expenses - - - - -
Total - - - - -
Total expense measures
Departmental - - - - -
Total - - - - -
Total - - - - - Prepared on a Government Finance Statistics (fiscal) basis .
Tourism Australia Budget Statements
174
Section 2: Outcomes and planned performance
2.1 OUTCOMES AND PERFORMANCE INFORMATION
Government outcomes are the intended results, impacts or consequences of actions by
the Government on the Australian community. Commonwealth programmes are the
primary vehicle by which government entities achieve the intended results of their
outcome statements. Entities are required to identify the programmes which contribute
to government outcomes over the Budget and forward years.
Each outcome is described below together with its related programmes, specifying the
performance indicators and targets used to assess and monitor the performance of
Tourism Australia in achieving government outcomes.
Outcome 1: Grow demand and foster a competitive and sustainable Australian tourism industry through partnership marketing to targeted global consumers
Outcome 1 strategy
Programme Component 1.1.1 Grow demand
Tourism Australia will build Australia’s reputation and profile as an exciting and
desirable leisure and business events destination, driving demand, growth in visitor
numbers and increased visitor expenditure by:
targeting consumers who are predisposed to travel to Australia and who are likely
to spend more, do more and disperse more widely beyond capital city gateways;
from a business events perspective, focusing on attracting high yielding visitors
who will also return as repeat visitors. Two sectors will be targeted – associations
and incentives. Business Events Australia will continue to develop strong
relationships with international buyers in key markets;
using research insights to inform product development by governments and
industry operators, match products and experiences relevant to the target
customer (including product bundling to present the best of what Australia has to
offer), refine marketing communications and drive the right messaging in the right
channels;
continuing marketing communications under the There’s nothing like Australia
campaign umbrella, while strengthening competitive positioning through
campaigns that highlight Australia’s food and wine credentials, its pristine
beaches, coastal and aquatic nature, its major events and its Indigenous culture
and experiences;

Tourism Australia Budget Statements
175
actively collaborating and working in partnership with government and industry
to create demand for travel to Australia. Working in partnership increases target
customer reach and ‘share of voice’ in the competitive global tourism environment.
It also demonstrates value by increasing investment in promoting Australia
through industry contributions; and
continuing to work with state and territory tourism organisations to ensure
integration and alignment of activities to achieve efficiency and effectiveness.
Programme Component 1.1.2 Industry development
Tourism Australia will continue to work in partnership with industry and government
stakeholders to promote growth and development of the Australian tourism industry.
Activity that will be implemented in 2015-16 includes:
supporting trade development by building the capability of the travel industry to
confidently sell Australia. This will include training of travel agents through the
Aussie Specialist Program (the program will be re-launched in late 2015-16 and
include delivery of a superior online platform); providing Australian destination
and product content to the distribution system and making direct connections with
travel agents through familiarisation visits and trade events;
managing and participating in a range of trade events in Australia and overseas
that promote Australia as a destination for leisure and business events travel. This
will include delivery of the Australian Tourism Exchange and Dreamtime,
dedicated business events educational programs and industry missions;
working in partnership with Austrade to attract tourism investment and
development of better quality Australian tourism infrastructure;
working with airline and airport partners to support profitable aviation capacity
growth and ensure that Tourism Australia’s investment supports growth on viable
routes;
working with the Department of Immigration and Border Protection to highlight
opportunities to improve competitiveness of Australia’s visa processes for
prospective visitors. Government focus is expected to be on e-visas, streamlining
visa requirements and multi-entry visas;
providing government and industry stakeholders with strategic insights and
research relevant to their needs to drive industry sustainability and strategy
development; and
continuing to build awareness and understanding of and alignment with Tourism
Australia strategies across government and industry through formal industry
briefings, workshops and conferences, as well as a dedicated relationship
management approach with stakeholders and partners.

Tourism Australia Budget Statements
176
Outcome expense statement
Table 2.1 provides an overview of the total expenses for Outcome 1 by programme.
Table 2.1: Budgeted expenses for Outcome 1
Outcome 1 - Grow demand and foster a competitive and
sustainable Australian tourism industry through partnership
marketing to targeted global consumers in key markets.
2014-15
Estimated
actual
expenses
$'000
2015-16
Estimated
expenses
$'000
Programme 1.1: Supporting Outcome 1
Revenue from Government
Ordinary annual services (a) 129,750 137,290
Funds from Portfolio Agency 13,500 14,000
Revenues from other independent sources 16,526 17,874
Total for programme 1.1 159,776 169,164
Outcome 1 Totals by resource type
Revenue from Government
Ordinary annual services (a) 129,750 137,290
Funds from Portfolio Agency 13,500 14,000
Revenues from other independent sources 16,526 17,874
Total expenses for Outcome 1 159,776 169,164
2014-15 2015-16
Average staffing level (number) 204 207 (a) Appropriation Bill (No.1) 2015-16.

Tourism Australia Budget Statements
177
Contributions to Outcome 1
Programme 1. Supporting Outcome 1
Programme objective
Refer to Outcome 1 Strategy and component objectives for further information.
Programme expenses
Table 2.2: Programme 1 Expenses by Component
2014-15
Estimated
actual
$'000
2015-16
Budget
$'000
2016-17
Forw ard
estimate
year 1
$'000
2017-18
Forw ard
estimate
year 2
$'000
2018-19
Forw ard
estimate
year 3
$'000
1.1.1 - Component 1 - Grow Demand
Annual departmental expenses:
Programme Support 137,381 145,453 144,997 146,440 147,834
Total component expenses 137,381 145,453 144,997 146,440 147,834
1.1.2 - Component 2 - Industry Development
Annual departmental expenses:
Programme Support 22,395 23,711 23,637 23,872 24,099
Total component expenses 22,395 23,711 23,637 23,872 24,099
Total programme expenses 159,776 169,164 168,634 170,312 171,933
Contributions to Programme 1
Component 1.1.1 Grow demand
Component 1.1.1 objective
Identify and target best prospect consumers, and inspire them to travel to Australia.
To focus activities and resources, utilise a dedicated market categorisation approach.

Tourism Australia Budget Statements
178
Component 1.1.1 deliverables
Leisure Consumer Marketing
Continued roll-out of the There’s nothing like Australia campaign across all major markets, incorporating the promotion of high impact events.
Further embedding Restaurant Australia into marketing activities in all markets.
Development and roll-out of initiatives to reinforce Australia’s coastal and aquatic nature positioning.
Launch of an Indigenous film to promote Australia’s Indigenous tourism experiences.
Cooperative campaigns and activities to leverage marketing opportunities that align with the Destination Australia brand and promote the best of what Australia has to offer.
Marketing activities to stimulate target markets, including brand advertising and promotions, digital programs, broadcasts, public relations, International Media Hosting Program, media content development, cooperative promotions, consumer events and advocacy programs.
Search engine marketing to lift australia.com and australia.cn ranking.
Australian story-telling content and applications, including social media.
Consumer behaviour research. Business Events Marketing
Activity to promote Australia as a business events destination targeting the Associations and Incentives segments, including trade events, buyer and agent familiarisation visits, direct marketing and public relations campaigns, advocacy, marketing toolkits and stakeholder relations.
Dedicated campaign implementation for the Incentives market in New Zealand, USA and Greater China.
An improved digital offering via a segment specific website on australia.com
Driving visitation via expansion of the delegate boosting program and
visitation extension marketing initiatives to drive pre/post travel.

Tourism Australia Budget Statements
179
Component 1.1.1 key performance indicators
Key performance indicators 2014-15
Estimated
actual
2015-16
Budget
2016-17
Forw ard
estimate
2017-18
Forw ard
estimate
2018-19
Forw ard
estimate
Total International overnight tourism
spend$30.68B
up 8.6%
$34.97B
up 10.9%
$38.4B
up 9.8%
$41.84B
up 8.9%
$45.27B
up 8.2%
Total spend by visitors from Tourism
Australia key markets (all purposes,
excluding rest of w orld)
$24.46B
up 9.2%
$27.59B
up 10.0%
$30.16B
up 9.3%
$32.83B
up 8.8%
$35.59B
up 8.4%
Total spend by leisure visitors from
Tourism Australia key markets (holiday
and visiting friends and relatives)
$11.92B
up 13.6%
$13.79B
up 12.2%
$15.40B
up 11.7%
$17.14B
up 11.3%
$19.03B
up 11.0%
Total spend by business events visitors
from selected Tourism Australia markets
$1.90B
up 3.4%
$2.15B
up 10.2%
$2.35B
up 9.4%
$2.56B
up 8.8%
$2.77B
up 8.2%
Tourism Australia marketing campaign
recall by target customer66% >67% >67% >67% >67%
Total monthly unique visitors to Tourism
Australia ow ned w ebsites30.6M increase 5% increase 5% increase 5% increase 5%
2014-15 actuals based on year end September 2014. Budget and forward estimates based on year ended December.
Contributions to Programme 1
Component 1.1.2 Industry development
Component objective
An Australian tourism industry that is competitive and sustainable and delivers on
the needs of the target customer.

Tourism Australia Budget Statements
180
Component 1.1.2 deliverables
Dissemination of insights on the tourism industry and global target customer
Delivery of an annual conference, regular industry briefings and communications.
Engagement of stakeholders
Continued implementation of a dedicated communications plan to deliver awareness and understanding of Tourism Australia strategies, and monitoring of stakeholder participation and satisfaction with Tourism Australia’s initiatives.
Support attraction of investment in tourism infrastructure, products and services
Share research on the target customer to provide insight into investment and development required to meet the needs of the target customer. This work will be undertaken in partnership with Austrade and stakeholders and governments across Australia.
Support access to Australia, by assisting existing and new route development and addressing visa access issues
Undertake analysis of industry and aviation conditions and provide insights to key stakeholders to assist strategic decision-making.
Work with airports and state and territory tourism organisations to support new route development.
Work to resolve high-level issues that are impediments to growth, including issues around visa access.
Promotion of Indigenous Tourism
Promote Indigenous experiences through Tourism Australia’s consumer marketing activities.
Trade Events
Coordinate and deliver trade events for Australian tourism businesses to showcase their products and do business with the global distribution network.
Manage and deliver premier trade events – the Australian Tourism Exchange (ATE) and Dreamtime – and profile Tourism Australia and industry partners.
Trade Development
Re-launch the Aussie Specialist Program, including new online platform.
Recruit and train travel agents through the Aussie Specialist Program.
Deliver product information and events for the Aussie Specialist Program through coordination with state and territory tourism organisations.
Best of Australia
Continue to work with industry, government agencies and state partners to promote Australia’s best products and experiences.
Supporting existing Best of Australia initiatives (Great Golf Courses of Australia, Great Walks of Australia, Ultimate Wineries of Australia and showcasing the best of Australia’s Indigenous experiences), and development of new programs to reinforce Australia’s food and wine credentials and strengths in coastal and aquatic nature.

Tourism Australia Budget Statements
181
Component 1.1.2 key performance indicators
Key performance indicators 2014-15
Estimated
actual
2015-16
Budget
2016-17
Forw ard
estimate
2017-18
Forw ard
estimate
2018-19
Forw ard
estimate
Key stakeholders indicate Tourism
Australia adds value to their
bsuiness (excellent, very good or
good value)
82% >80% >80% >80% >80%
Event attendees indicate satisfaction
w ith Tourism Australia's key events
(extremely or very satisfied)
88% >90% >90% >90% >90%
Key events include the Australian Tourism Exchange, the Destination Australia Conference and Industry Briefings.

Tourism Australia Budget Statements
182
Section 3: Explanatory tables and budgeted financial statements
Section 3 presents explanatory tables and budgeted financial statements which provide
a comprehensive snapshot of entity finances for the 2015-16 budget year. It explains
how budget plans are incorporated into the financial statements and provides further
details of the reconciliation between appropriations and programme expenses,
movements in administered funds, special accounts and government indigenous
expenditure.
3.1 EXPLANATORY TABLES
3.1.1 Movement of administered funds between years
This statement is not applicable, as Tourism Australia has no administered funds.
3.1.2 Special accounts
This statement is not applicable, as Tourism Australia has no special accounts.
3.1.3 Australian Government Indigenous expenditure
Table 3.1.3: Australian Government Indigenous expenditure (AGIE)
Outcome
Approp Bill
No. 1
$'000
(A)
Approp Bill
No. 2
$'000
(B)
Special
approp
$'000
(C)
Total
approp
$'000
(D)
Other
$'000
(E)
Total
$'000
(F)=
(D)+(E)
Tourism Australia
Outcome 1
Departmental 2015-16 500 - - 500 - 500
Departmental 2014-15 500 - - 500 - 500
Total outcome
2015-16500
- -500
-500
Total outcome
2014-15500
- -500
-500
Total AGIE 2015-16 500 - - 500 - 500
Total AGIE 2014-15 500 - - 500 - 500

Tourism Australia Budget Statements
183
3.2 BUDGETED FINANCIAL STATEMENTS
3.2.1 Differences in entity resourcing and financial statements
Tourism Australia has no significant differences between the resource information
presented in the Budget Papers and in the Portfolio Budget Statements as a result of
differences between whole of government level reporting (under Australian
Accounting Standard 1049) and entity level financial reporting.
3.2.2 Analysis of budgeted financial statements
Total operating revenue for 2015-16 is estimated at $169.1 million and is made up of
government appropriations of $138.7 million, Asian Marketing Fund from government
of $14.0m and revenue from other sources of $17.9 million. The total revenue increases
by $0.2 million from the 2014-15 estimated actual of $168.9 million.
The change includes:
appropriation for 2015-16 reflects normal level of funding for Tourism
Australia adjusted for the efficiency dividend;
impact of wage cost index applied to appropriations; and
Asian Marketing Fund receipts of $14.0 million.
Corresponding total expenses are also estimated to be $169.1 million, an increase of
$9.3 million from the 2014-15 estimated actual of $159.8 million due to the funding of
negative foreign exchange impacts for 2015-16.
Departmental – Balance Sheet
Tourism Australia is budgeting a net asset position of $25.4 million in 2015-16 which
reflect the equity injection of $9.1 million for 2013-14 foreign exchange losses, in the
2014-15 estimated actual. Net assets are projected to remain the same beyond 2015-16.

Tourism Australia Budget Statements
184
3.2.3 Budgeted financial statements tables
Table 3.2.1: Comprehensive income statement (showing net cost of services) for the period ended 30 June
2014-15
Estimated
actual
$'000
2015-16
Budget
$'000
2016-17
Forw ard
estimate
$'000
2017-18
Forw ard
estimate
$'000
2018-19
Forw ard
estimate
$'000
EXPENSES
Employee benefits 28,788 30,473 30,473 31,000 31,000
Suppliers 119,754 129,958 129,428 130,579 132,200
Depreciation and amortisation 4,500 4,500 4,500 4,500 4,500
Finance Costs 33 33 33 33 33
Other 6,701 4,200 4,200 4,200 4,200
Total expenses 159,776 169,164 168,634 170,312 171,933
LESS:
OWN-SOURCE INCOME
Own-source revenue
Interest 1,800 1,300 1,300 1,300 1,300
Other Government Revenue (AMF) 13,500 14,000 14,000 14,000 14,000
Other Revenue 14,726 16,574 16,574 16,574 16,574
Total own-source revenue 30,026 31,874 31,874 31,874 31,874
Total own-source income 30,026 31,874 31,874 31,874 31,874
Net cost of/(contribution by) services 129,750 137,290 136,760 138,438 140,059
Appropriation from Government 138,865 137,290 136,760 138,438 140,059
OTHER COMPREHENSIVE INCOME
plus non-appropriated expenses depreciation
and amortisation expenses 4,500 4,500 4,500 4,500 4,500
Total comprehensive income
attributable to the Australian
Government 4,500 4,500 4,500 4,500 4,500
Note: Reconciliation of comprehensive income attributable to the agency
2014-15
$'000
2015-16
$'000
2016-17
$'000
2017-18
$'000
2018-19
$'000
Total comprehensive income
attributable to the Australian
Government - - - - -
plus non-appropriated expenses,
depreciation and amortisation expenses 4,500 4,500 4,500 4,500 4,500
Total comprehensive income
attributable to the agency 4,500 4,500 4,500 4,500 4,500 Prepared on Australian Accounting Standards basis.

Tourism Australia Budget Statements
185
Table 3.2.2: Budgeted departmental balance sheet (as at 30 June)
2014-15
Estimated
actual
$'000
2015-16
Budget
$'000
2016-17
Forw ard
estimate
$'000
2017-18
Forw ard
estimate
$'000
2018-19
Forw ard
estimate
$'000
ASSETS
Financial assets
Cash and cash equivalents 20,017 20,017 20,017 20,017 20,017
Trade and other receivables 7,529 7,529 7,529 7,529 7,529
Total financial assets 27,546 27,546 27,546 27,546 27,546
Non-financial assets
Land and buildings 4,233 4,233 4,233 4,233 4,233
Property, plant and equipment 974 674 674 674 674
Intangibles 6,981 7,281 7,281 7,281 7,281
Other 3,095 3,095 3,095 3,095 3,095
Total non-financial assets 15,283 15,283 15,283 15,283 15,283
Total assets 42,829 42,829 42,829 42,829 42,829
LIABILITIES
Payables
Suppliers 5,519 5,519 5,519 5,519 5,519
Other 6,227 6,227 6,227 6,227 6,227
Total payables 11,746 11,746 11,746 11,746 11,746
Provisions
Employee provisions 4,853 4,853 4,853 4,853 4,853
Other 792 792 792 792 792
Total provisions 5,645 5,645 5,645 5,645 5,645
Total liabilities 17,391 17,391 17,391 17,391 17,391
Net assets 25,438 25,438 25,438 25,438 25,438 EQUITY*
Parent entity interest
Contributed equity 4,240 4,240 4,240 4,240 4,240
Reserves 1,964 1,964 1,964 1,964 1,964
Retained surplus (accumulated deficit) 19,234 19,234 19,234 19,234 19,234
Total parent entity interest 25,438 25,438 25,438 25,438 25,438
Total Equity 25,438 25,438 25,438 25,438 25,438
* ‘Equity’ is the residual interest in assets after deduction of liabilities. Prepared on Australian Accounting Standards basis.

Tourism Australia Budget Statements
186
Table 3.2.3: Departmental statement of changes in equity — summary of movement (Budget year 2015-16)
Retained
earnings
$'000
Asset
revaluation
reserve
$'000
Contributed
equity/
capital
$'000
Total equity
$'000
Opening balance as at 1 July 2015
Balance carried forw ard from previous period10,119 1,964 4,240 16,323
Adjusted opening balance 10,119 1,964 4,240 16,323
Comprehensive income
Return of Foreign Exchange (a) 9,115 - - -
Total comprehensive income 9,115 - - -
of w hich:
Attributable to the Australian Government 9,115 - - -
Estimated closing balance as at 30 June 201619,234 1,964 4,240 25,438
Closing balance attributable to the Australian
Government 19,234 1,964 4,240 25,438 (a) Appropriation Bill 4 (2014-15) for 2014-15 $9.115m. Prepared on Australian Accounting Standards basis.

Tourism Australia Budget Statements
187
Table 3.2.4: Budgeted departmental statement of cash flows (for the period ended 30 June)
2014-15
Estimated
actual
$'000
2015-16
Budget
$'000
2016-17
Forw ard
estimate
$'000
2017-18
Forw ard
estimate
$'000
2018-19
Forw ard
estimate
$'000
OPERATING ACTIVITIES
Cash received
Appropriations 129,750 137,290 136,760 138,438 140,059
Interest 1,800 1,300 1,300 1,300 1,300
Other 30,680 31,767 30,574 30,574 17,558
Total cash received 162,230 170,357 168,634 170,312 158,917
Cash used
Employees 28,788 30,473 30,473 31,000 31,000
Suppliers 121,308 131,151 129,461 130,612 119,217
Other 7,634 4,233 4,200 4,200 4,200
Total cash used 157,730 165,857 164,134 165,812 154,417
Net cash from/(used by) operating
activities 4,500 4,500 4,500 4,500 4,500
INVESTING ACTIVITIES
Cash used
Purchase of property, plant and
equipment 4,500 4,500 4,500 4,500 4,500
Total cash used 4,500 4,500 4,500 4,500 4,500
Net cash from/(used by) investing
activities (4,500) (4,500) (4,500) (4,500) (4,500)
FINANCING ACTIVITIES
Cash received
Contributed equity (a) 9,115 - - - -
Proceeds from issuing f inancial
instruments - - - - -
Other - - - - -
Total cash received 9,115 - - - -
Cash used
Total cash used - - - - -
Net cash from/(used by) financing 9,115 - - - -
Net increase/(decrease) in cash held 9,115 - - - -
Cash and cash equivalents at the
beginning of the reporting period 10,902 20,017 20,017 20,017 20,017
Effect of exchange rate movements on
cash and cash equivalents at the
beginning of reporting period - - - - -
Cash and cash equivalents at the
end of the reporting period 20,017 20,017 20,017 20,017 20,017 (a) Return of foreign exchange. Prepared on Australian Accounting Standards basis.

Tourism Australia Budget Statements
188
Table 3.2.5: Departmental capital budget statement (for the period ended 30 June)
2014-15
Estimated
actual
$'000
2015-16
Budget
$'000
2016-17
Forw ard
estimate
$'000
2017-18
Forw ard
estimate
$'000
2018-19
Forw ard
estimate
$'000
PURCHASE OF NON-FINANCIAL
ASSETS
Departmental resources 4,500 4,500 4,500 4,500 4,500
TOTAL 4,500 4,500 4,500 4,500 4,500
RECONCILIATION OF CASH USED TO
ACQUIRE ASSETS TO ASSET
MOVEMENT TABLE
Total purchases 4,500 4,500 4,500 4,500 4,500
Total cash used to acquire assets 4,500 4,500 4,500 4,500 4,500 Prepared on Australian Accounting Standards basis.

Tourism Australia Budget Statements
189
Dep
artmen
t abbreviation
Bu
dget S
tatemen
ts
Table 3.2.6: Statement of asset movements (Budget year 2015-16)
Buildings
$'000
Other
property,
plant and
equipment
$'000
Computer
softw are
and
intangibles
$'000
Total
$'000
As at 1 July 2015
Gross book value 8,410 4,463 40,558 53,431
Accumulated depreciation/amortisation and
impairment (4,177) (3,489) (33,577) (41,243)
Opening net book balance 4,233 974 6,981 12,188
Capital asset additions
Estimated expenditure on new or
replacement assets
By purchase - other 600 - 3,900 4,500
Total additions 600 - 3,900 4,500
Other movements
Depreciation/amortisation expense (600) (300) (3,600) (4,500)
Total other movements (600) (300) (3,600) (4,500)
As at 30 June 2016
Gross book value 9,010 4,463 44,458 57,931
Accumulated depreciation/amortisation and
impairment (4,777) (3,789) (37,177) (45,743)
Closing net book balance 4,233 674 7,281 12,188 Prepared on Australian Accounting Standards basis.

Tourism Australia Budget Statements
190
Dep
artmen
t abbreviation
Bu
dg
et Statem
ents
3.2.4 Notes to the financial statements
The financial statements have been prepared in accordance with:
Finance Minister’s Orders; and
Australian Accounting Standards and Accounting Interpretations issued by
the Australian Accounting Standards Board.
Assets and liabilities are recognised in the balance sheet when and only when it
is probable that future economic benefits will flow and the amounts of the assets and
liabilities can be reliably measured.
Revenues and expenses are recognised in the income statement when and only when
the flow or consumption or loss of economic benefit has occurred and can be reliably
measured.
The analysis of budgeted financial statements provides an overview of the key
elements of Tourism Australia’s financial statements, including variations in major
aggregates from actual of 2014-15 to budget estimate of 2015-16.

Glossary
191
PORTFOLIO GLOSSARY
Term Meaning
Accrual accounting System of accounting where items are brought to account and
included in the financial statements as they are earned or
incurred, rather than as they are received or paid.
Accumulated
depreciation
The aggregate depreciation recorded for a particular
depreciating asset.
Additional
Estimates
Where amounts appropriated at Budget time are insufficient,
Parliament may appropriate more funds to portfolios through
the Additional Estimates Acts.
Administered Revenues, expenses, assets or liabilities managed by entities
on behalf of the Commonwealth. Entities do not control
administered items. Administered expenses include grants,
subsidies and benefits. In many cases, administered expenses
fund the delivery of third party outputs.
Annual
appropriation
Two appropriation Bills are introduced into Parliament in
May and comprise the Budget for the financial year beginning
1 July. Further Bills are introduced later in the financial year
as part of the additional estimates. Parliamentary
departments have their own appropriations.
Appropriation An authorisation by Parliament to spend monies from the
Consolidated Revenue Fund for a particular purpose.
Capital
expenditure
Expenditure by an entity on capital projects, for example
purchasing a building.
Consolidated
Revenue Fund
Section 81 of the Constitution stipulates that all revenue raised
or money received by the Commonwealth forms the one
consolidated revenue fund (CRF).
Departmental Revenue, expenses, assets and liabilities that are controlled by
the entity in providing its outputs. Departmental items would
generally include computers, plant and equipment assets used
by entities in providing goods and services and most
employee expenses, supplier costs and other administrative
expenses incurred.

Glossary
192
Depreciation Apportionment of an asset’s capital value as an expense over
its estimated useful life to take account of normal usage,
obsolescence, or the passage of time.
Effectiveness
indicators
Measure the joint or independent contribution of programmes
to the achievement of their specified outcome.
Efficiency
indicators
Measure the adequacy of an entity’s management of its
programmes. Includes price, quality and quantity indicators.
The interrelationship between the three efficiency indicators of
any one programme should be considered when judging
efficiency.
Equity or net assets Residual interest in the assets of an entity after deduction of
its liabilities.
Expense Total value of all of the resources consumed in producing
goods and services or the loss of future economic benefits in
the form of reductions in assets or increases in liabilities of an
entity.
Fair value Valuation methodology: the amount for which an asset could
be exchanged, or a liability settled, between knowledgeable
and willing parties in an arm’s length transaction. The fair
value can be affected by the conditions of the sale, market
conditions and the intentions of the asset holder.
Operating result Equals revenue less expense.
Outcomes The Government’s objectives in each portfolio area. Outcomes
are desired results, impacts or consequences for the Australian
community as influenced by the actions of the Australian
Government. Actual outcomes are assessments of the end
results or impacts actually achieved.
Price One of the three key efficiency indicators. The amount the
government or the community pays for the delivery of
programmes.
Programme Activity that delivers benefits, services or transfer payments to
individuals, industry and/or the community as a whole, with
the aim of achieving the intended result specified in an
outcome statement.

Glossary
193
Quality One of the three key efficiency indicators. Relates to the
characteristics by which customers or stakeholders judge an
organisation, product or service. Assessment of quality
involves use of information gathered from interested parties
to identify differences between the user’s expectations and
experiences.
Quantity One of the three key efficiency indicators. Examples include:
the size of a programme; count or volume measures; how
many or how much.
Revenue Total value of resources earned or received to cover the
production of goods and services.
Special Account Special Accounts allow money in the Consolidated Revenue
Fund (CRF) to be acknowledged as set-aside (hypothecated)
for a particular purpose. Amounts credited to a Special
Account may only be spent for the purposes of the Special
Account. Special Accounts can only be established by a
written determination of the Finance Minister (section 78 of
the Public Governance, Performance and Accountability (PGPA)
Act 2013) or through an Act of Parliament (section 80 of the
PGPA Act 2013).
Special
Appropriations
(including Standing
Appropriations)
An amount of money appropriated by a particular Act of
Parliament for a specific purpose and number of years. For
Special Appropriations the authority to withdraw funds from
the Consolidated Revenue Fund does not generally cease at
the end of the financial year. Standing Appropriations are a
sub-category consisting of ongoing Special Appropriations -
the amount appropriated will depend on circumstances
specified in the legislation.