portfolio evaluation using owa heuristic algorithm - a … kumar singh* dr. r sahu shalini bharadwaj...
TRANSCRIPT

By
Abhay Kumar Singh* Dr. R Sahu Shalini Bharadwaj
*Research Associate- SAFE, Edith Cowan UniversityEmail: [email protected]

INTRODUCTIONó A portfolio is an appropriate mix or collection of
investments held by an institution or private individuals.ó The investor's objective is to get the maximum possible
return on an investment with the minimum possible risk.ó Optimal Portfolio construction leads to two investment
problemsó selecting stocks to be included in the portfolio (asset
selection), and ó appropriately proportioning the total money to be invested
in the selected stocks for best return from the portfolio (assetallocation).

Literature ReviewOrdered Weighted Averaging-OWAó The Ordered Weighted Averaging operators, commonly called
OWA operators, provide a parameterized class of mean type aggregation operators.
ó OWA, takes into account the entire range of between the minimum and the maximum values of expected returns.
ó The operator that has been used in this study is defined as

Heuristic Algorithmó The term heuristic is used for algorithms which find
solutions among all possible ones, but they do not guarantee that the best will be found, therefore they give approximately close results.ó In this study , heuristic algorithm is used to select the
securities which would form the optimal portfolio.ó The steps in the Algorithm Used areó Initialize an array “state” with the no. of elements= no.
of securities=n and the open and closed states of the elements represented by 1 and 0 respectively. The values of the elements in the array change at each level.ó Calculate the functional value of the n securities where
functional value Fi= Ei-Vi for a portfolio comprising of i securities.

Steps Of Algorithm…ó Compare the functional values of all securities and select the
security with the maximum functional value.ó Take the security with the maximum functional value as the
root node and generate its children.ó For the root node and all the subsequent nodes, modify the
binary value in “state” array from 1 to 0 as and when the children are created.
ó Functional value of the current node=1/depth (∑ Functional value of the parent nodes till the root node by backtracking the path from which the current node has been created).
ó Compare the functional values of all the open nodes and select the node with the maximum value.
ó Generate the children of this node and modify the array “state” accordingly.
ó Until state[i] =0 for every i; for all i=0 to n-1 go to step vi.ó Return the path of the node with the maximum functional
value.

Data Envelope Analysis- DEAó Data Envelopment Analysis (DEA) measures the relative efficiencies of
organizations with multiple inputs and multiple outputs. The organizations are called the decision-making units, or DMUs.
ó DEA assigns weights to the inputs and outputs of a DMU that give it the best possible efficiency. It thus arrives at a weighting of the relative importance of the input and output variables that reflects the emphasis that appears to have been placed on them for that particular DMU.
ó DEA is a multi-factor productivity analysis model for measuring the relative efficiencies of a homogenous set of decision making units (DMUs). The efficiency score in the presence of multiple input and output factors is defined as:
Inputs of Sum WeightedOutputs of Sum Weighted Efficiency =

ObjectivesThe objectives towards portfolio optimization include.ó To calculate risk and return of stocks used to form the
optimal portfolio.ó To select stocks for portfolio formation using
Evolutionary Algorithms, and Data Envelope Analysisó To compare the resultant portfolios using a common
benchmark index called as Sharpe’s Performance Index.

Data and MethodologyDataó The data used for both the methodology is from 45
stocks listed in of National Stock Exchange, NSE, of India, the methodology uses the opening and closing rates of these stocks from a period of 3 years.
Methodologyó Broadly-A two step methodology:ó Asset Selection: Using OWA-Heuristics and DEAó Asset Allocation: Using Markowitz mean variance
portfolio theory.

Methodology..The methodology can be stated in following 7 steps
1. Step 1: Calculation of Returns and Risks for stocks take for study
2. Step 2: Normalization of Returns3. Step 3: Selection of Stocks for Representative of Average
Portfolio using OWA4. Step 4: Formation of portfolio using Heuristic Algorithm5. Step 5: Formation of portfolio using Data Envelope
Analysis (DEA) 6. Step 6: Formation of portfolio using common securities
from both asset selection methods.7. Step 7: Comparing all the resultant portfolios using Sharpe
Index

Step1: Calculation of Expected Returns and Risks
) Price itialmonth}/(In theduring Earnings +Price) Initial -Price {(Final=Stock individualan for ReturnsMonthly Expected
•The risk is given by the variance in the prices of stocks

Step 2: Normalization of Expected Returnsó To reveal more meaningful information a relative
performance stocks are further normalized to lie between 0 and 1 using the following scale:
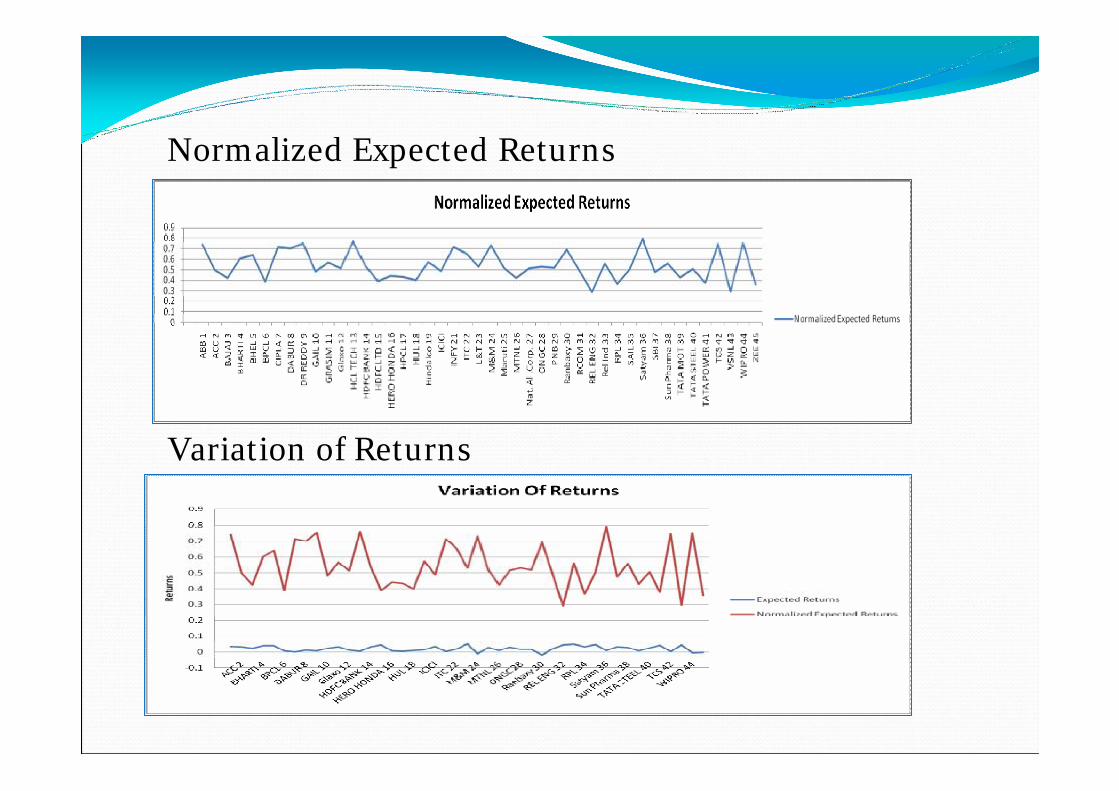
ó Normalized Expected Returns
ó Variation of Returns

Step 3: Selection of Stocks for the Representative Average Portfolio using OWAó The function used for implementing OWA is
The Likeability Ratio , q:p is taken as 8:3 The value of the “average portfolio”, F, representing an average performing stock, is F= Σwi*ai, where ai is the individual normalized expected return of the ith largest element in a1, a2,.......an.

Portfolio Basics

Portfolio Basic..ó The efficient frontier is formed by minimizing the
following expression
ó whereó w is a vector of portfolio weights. Each wi ≥ 0 andó ∑ is the covariance matrix for the assets in portfolioó q is the risk tolerance factor ó R is the vector of expected returns
∑ − TT Rqww *
∑=
=n
iiw
1
1

Step 4: Formation of portfolio using Heuristic Algorithm


Step 5: Formation of Portfolio Using DEA
Efficient Securities from DEA:


Step 6: Formation of portfolio using common stocks
Securities RELENG DABUR CIPLA DRREDDY HCLTECH Satyam L&T ABB
Risky Weights
0 0 0 0.080745 0.29316 0.62325 0 0.002852
Return 0.77831
Risk 0.11523

Step 7: Comparison of Approaches Using Sharpe Index
Deviation StandardReturn) FreeRisk -Return (PortfolioIndex Sharpe =
•To compare Genetic Algorithm with Heuristic and Data Envelope Analysis approach, portfolio having the same return and number of securities as with Heuristic and DEA are formed using Genetic Algorithm

Sharpe Index for Different Approaches
Method 1 Method 2 Combination of Method 1 & 2
Sharpe Performance Index
6.18149 5.8563 6.1469
•Heuristic algorithm outperforms Data Envelope Analysis.•Method 1 is also marginally better than the portfolio formed by the combination of stocks from the two methods.
Conclusionó This paper tries to narrow down the choices of stocks
available for investment in a wide market.ó The paper uses a methodology of asset selection and
then asset allocation and tries to compare two different approaches.ó The research illustrates how evolutionary algorithms
and Data Envelope analysis can be used for optimal portfolio formation. óWork can be furthered by using Integrated Risk
Management Techniques to diversify the portfolio.

Referencesó Barry, Christopher B., Wikler, Robert L., 1976. Nonstationarity and Portfolio
Choice. Journal of Financial and Quantitative Analysis, Vol 11(2), 217-236.ó Blume, Marshall E., 1971. On the Assessment of Risk. Journal of Finance, Vol
26(1), 1-10.ó Chang, T.J., Meade, N., 2000. Heuristics for Cardinality Constrained Portfolio
Optimization. Computers & Operations Research, Vol 27(13), 1271-1302.ó Elton, Edwin, J., Gruber, Martin J., Padberg, Manfred W., 1976. Simple Criteria
for Optimal Portfolio Selection. Journal of Finance, Vol 31(5), 1341-1357.ó Gregoriou, G. N. (2003) “Performance appraisal of hedge funds using
data envelopment analysis” Journal of Wealth Management, 88-95.ó Haslem, J. A., and C. A. Scheraga (2003) “Data envelopment analysis of
Morningstar’s large-cap mutual funds” Journal of Investing Winter, 41-48.ó Lopes, Ana, Edgar Lanzer, Marcus Lima, and Newton da Costa, Jr., (2008)
"DEA investment strategy in the Brazilian stock market." Economics Bulletin, Vol. 13, No. 2 pp. 1-10
References..ó Markowitz, Harry M, 1952. Portfolio Selection, Journal of
Finance, 7 (1), 77-91, 1952.ó Morey, M. R., and R. C. Morey (1999) “Mutual fund
performance appraisals: a multi-horizon perspective with endogenous benchmarking” Omega 27, 241-258.
ó Nawrocki, David N., 2000. Portfolio optimization, Heuristics and the Butterfly Effect. Journal of Financial Planning, Vol 13(2), 68-75.
ó Talluri Srinivas, 2000. Data Envelopment Analysis: Models and Extensions, Decision Line, Silberman College of Business Administration, Fairleigh Dickinson University