“portfolio management and interest rate risk: what …€œportfolio management and interest rate...
TRANSCRIPT
Lester F. Murray | Associate PartnerThe Baker Group LP | Financial Strategies GroupPhone: 405. 415.7208 | [email protected] | www.gobaker.com
“Portfolio Management and Interest Rate Risk:What Worries You About Higher Rates?”
2
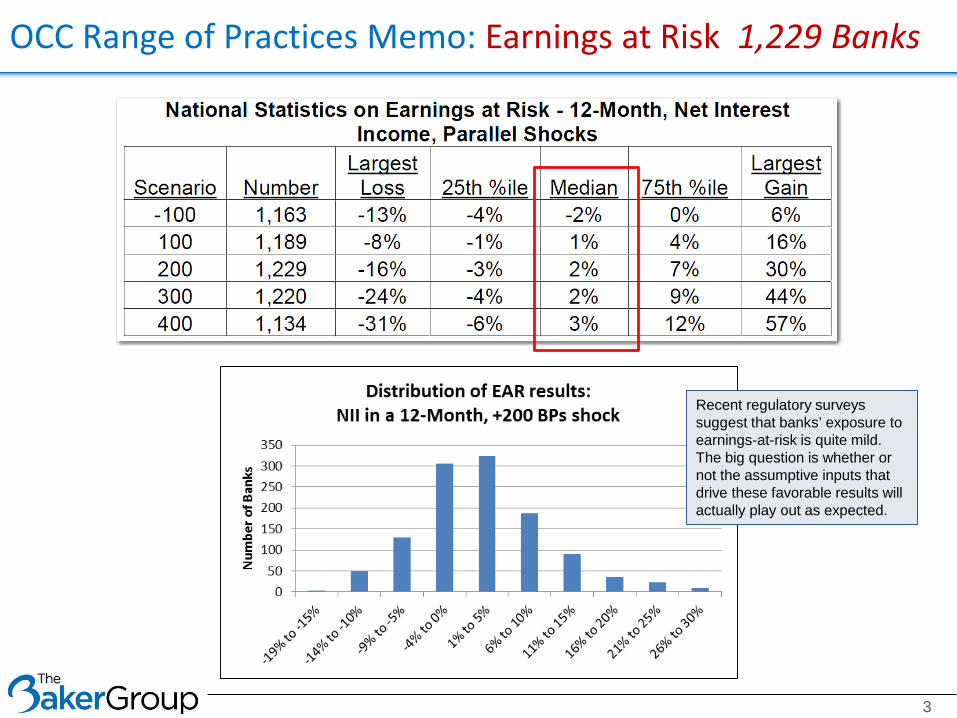
OCC Range of Practices Memo: Earnings at Risk 1,229 Banks
3
Recent regulatory surveys suggest that banks’ exposure to earnings-at-risk is quite mild. The big question is whether or not the assumptive inputs that drive these favorable results will actually play out as expected.
4
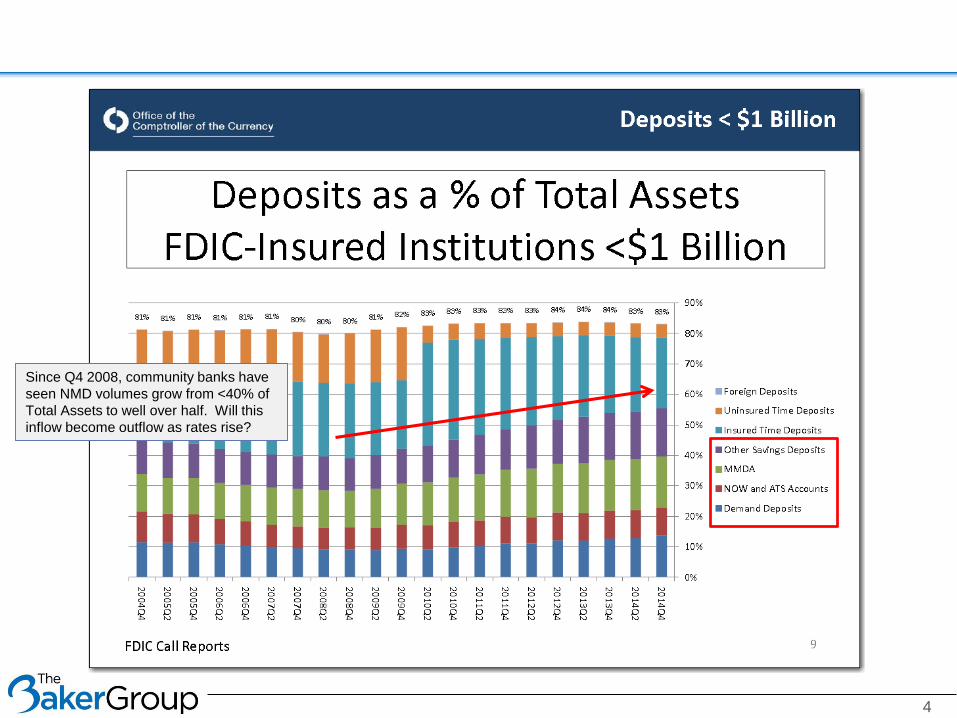
Since Q4 2008, community banks have seen NMD volumes grow from <40% of Total Assets to well over half. Will this inflow become outflow as rates rise?
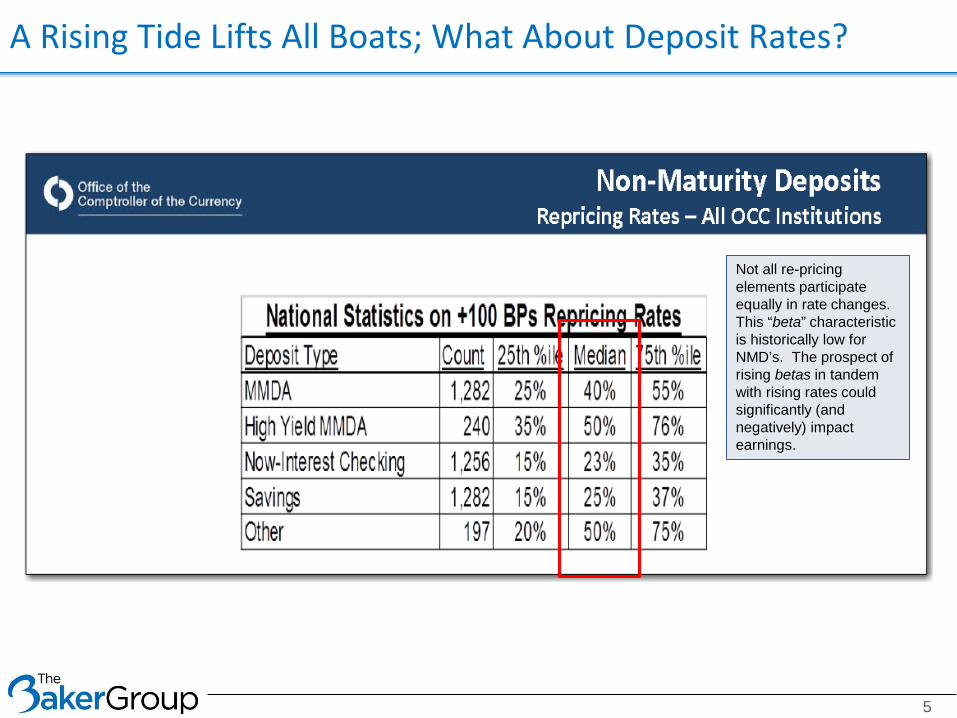
A Rising Tide Lifts All Boats; What About Deposit Rates?
5
Not all re-pricing elements participate equally in rate changes. This “beta” characteristic is historically low for NMD’s. The prospect of rising betas in tandem with rising rates could significantly (and negatively) impact earnings.

Estimating NMD Betas Using Call Report Data
6

NMD as a % of Total Funding Has Surged With Low Rates
7
The average community bank has seen total funding from Non-Maturity Deposits surge from 36% in 2008 to more than 55% today. The long-term average is 42%.
Every institution should understand the impact of NMD funding reverting to the mean.
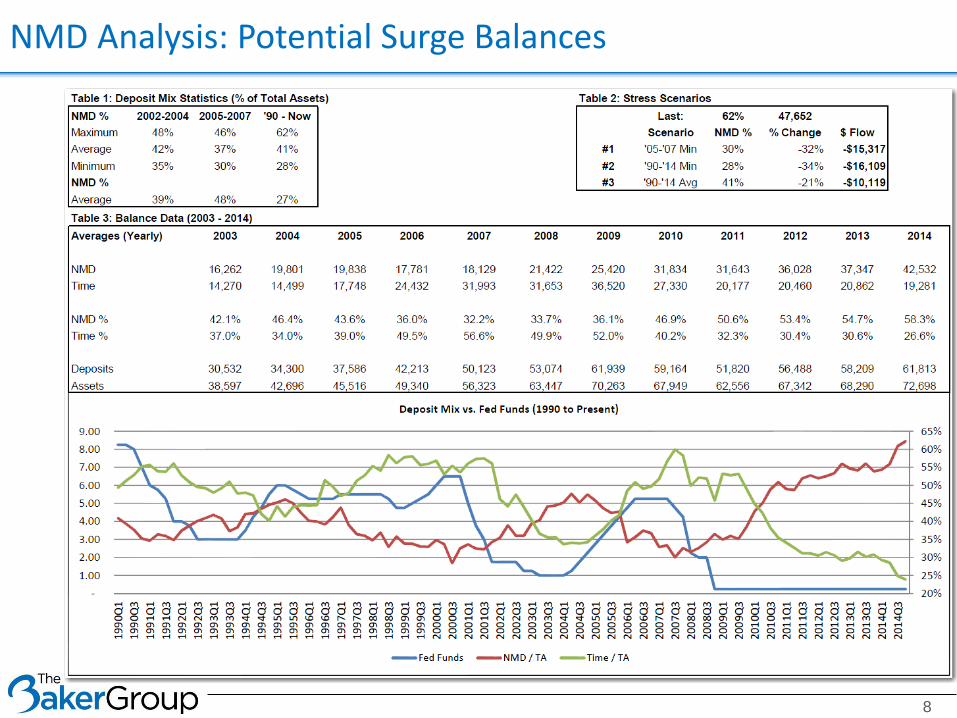
NMD Analysis: Potential Surge Balances
8
Sensitivity Testing: Non-Maturity DepositsWhatever Baseline Assumptions You Use, Stress Test Them
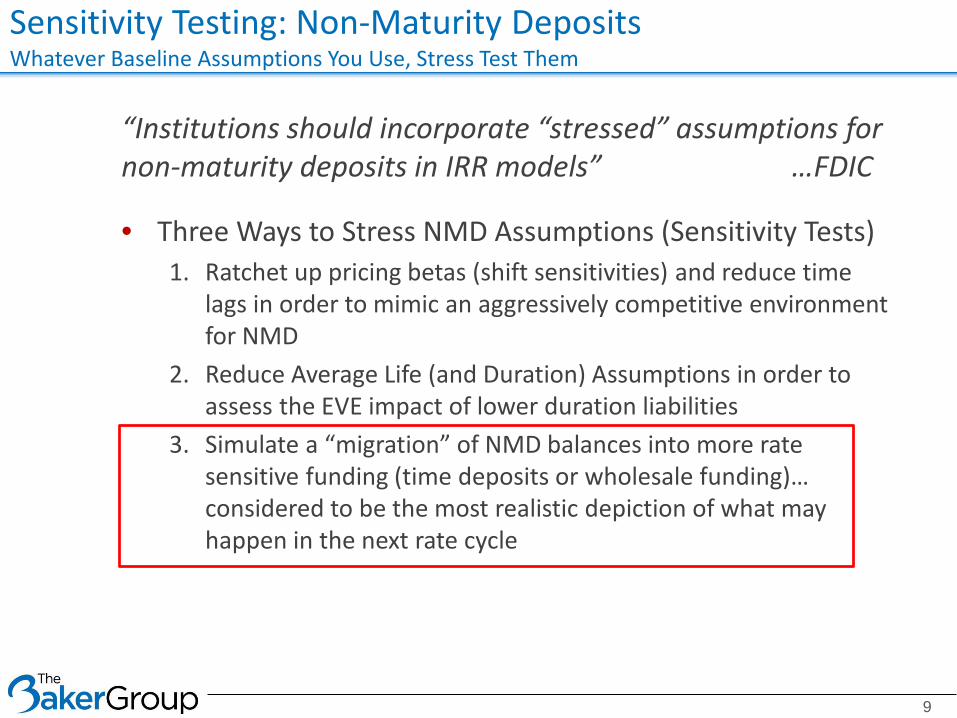
“Institutions should incorporate “stressed” assumptions for non-maturity deposits in IRR models” …FDIC
• Three Ways to Stress NMD Assumptions (Sensitivity Tests)1. Ratchet up pricing betas (shift sensitivities) and reduce time
lags in order to mimic an aggressively competitive environment for NMD
2. Reduce Average Life (and Duration) Assumptions in order to assess the EVE impact of lower duration liabilities
3. Simulate a “migration” of NMD balances into more rate sensitive funding (time deposits or wholesale funding)… considered to be the most realistic depiction of what may happen in the next rate cycle
9
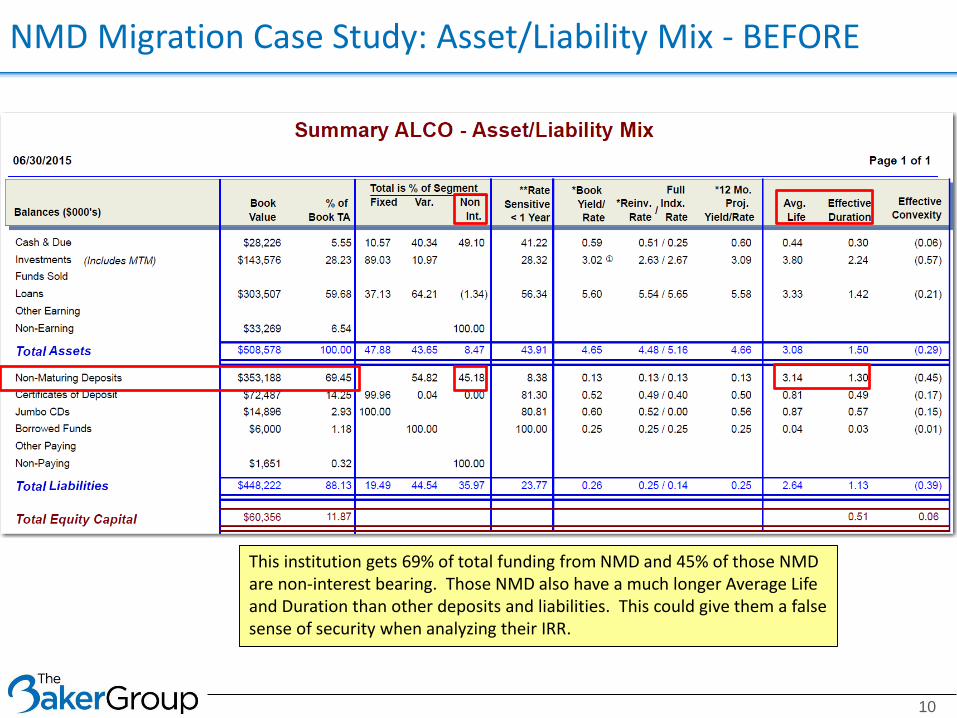
NMD Migration Case Study: Asset/Liability Mix - BEFORE
10
This institution gets 69% of total funding from NMD and 45% of those NMD are non-interest bearing. Those NMD also have a much longer Average Life and Duration than other deposits and liabilities. This could give them a false sense of security when analyzing their IRR.
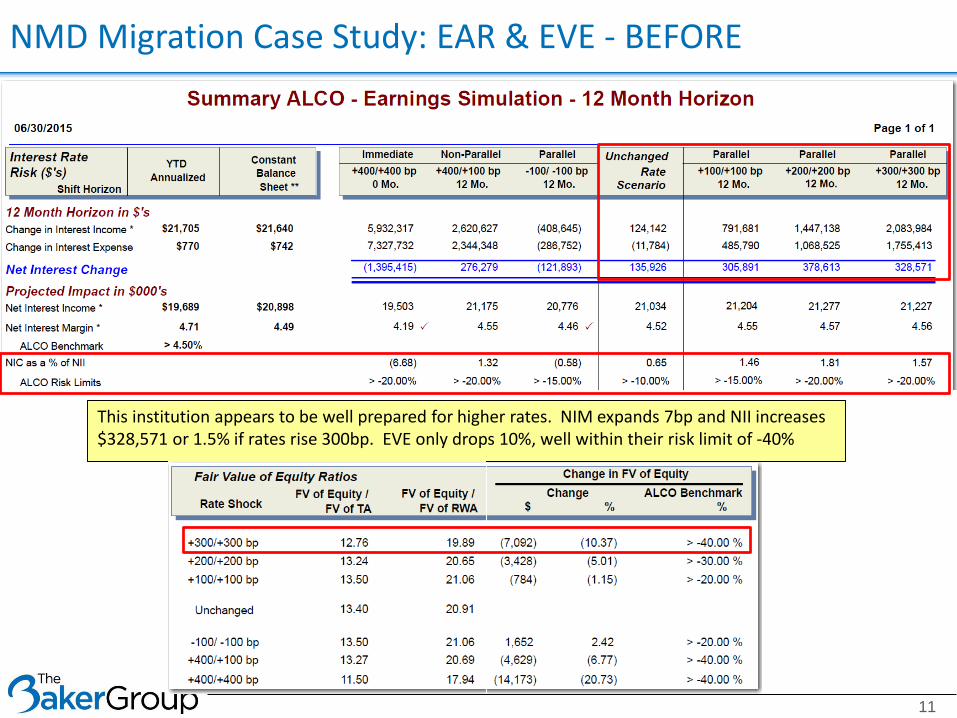
NMD Migration Case Study: EAR & EVE - BEFORE
11
This institution appears to be well prepared for higher rates. NIM expands 7bp and NII increases $328,571 or 1.5% if rates rise 300bp. EVE only drops 10%, well within their risk limit of -40%
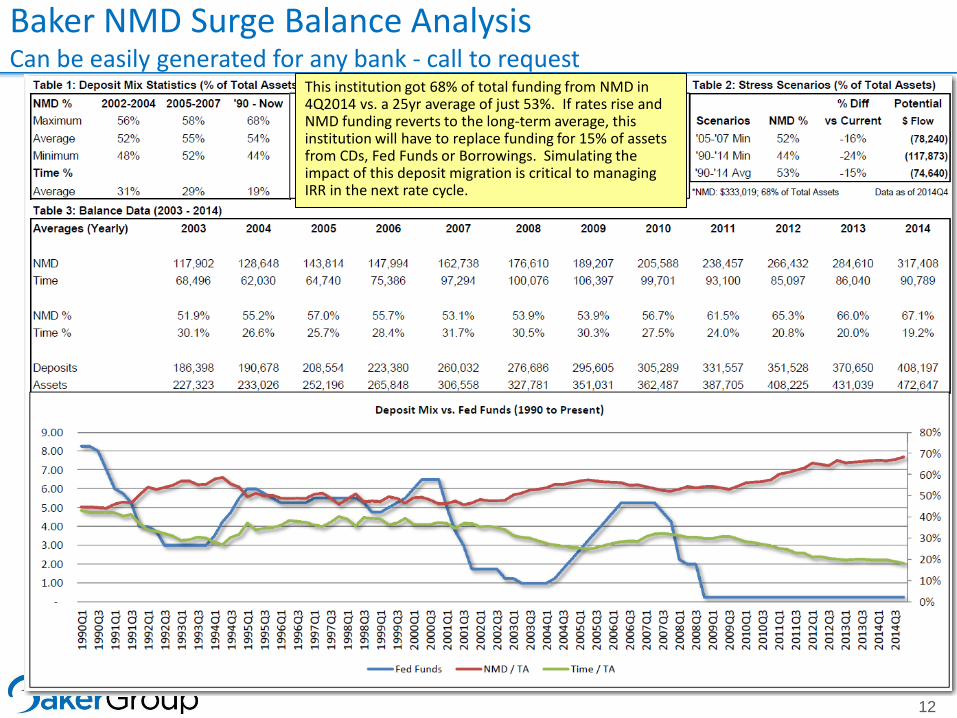
Baker NMD Surge Balance AnalysisCan be easily generated for any bank - call to request
12
This institution got 68% of total funding from NMD in 4Q2014 vs. a 25yr average of just 53%. If rates rise and NMD funding reverts to the long-term average, this institution will have to replace funding for 15% of assets from CDs, Fed Funds or Borrowings. Simulating the impact of this deposit migration is critical to managing IRR in the next rate cycle.

NMD Migration Case Study
• This institution decided to simulate the impact of NMD funding returning to the 25 year average
• They ran two simulations showing 15% of total assets migrating out of NMD and into higher cost, more rate sensitive liabilities
• For Earnings at Risk simulation, migration occurred over 12 months. For EVE simulation, migration occurred immediately.
Simulation # 1All funds into overnight borrowings at 0.25%
Simulation # 245% into FHLB 1yr Advances @ 0.60%33% into FHLB 2yr Advances @ 1.05%22% into FHLB 3yr Advances @ 1.40%
13
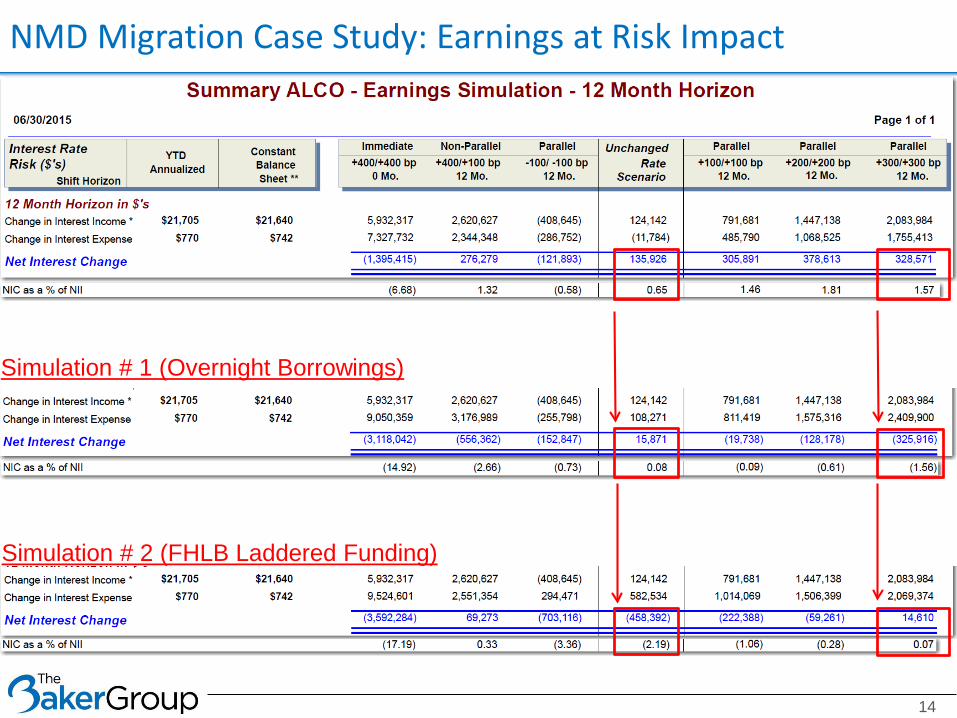
NMD Migration Case Study: Earnings at Risk Impact
14
Simulation # 1 (Overnight Borrowings)
Simulation # 2 (FHLB Laddered Funding)
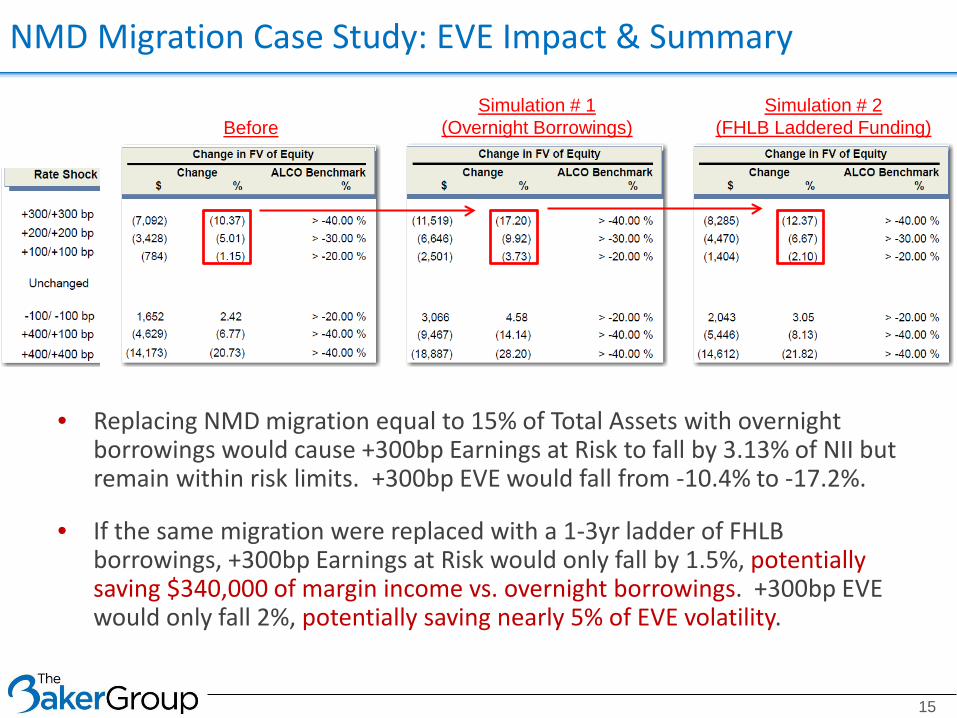
NMD Migration Case Study: EVE Impact & Summary
15
Simulation # 1(Overnight Borrowings)
Simulation # 2(FHLB Laddered Funding)Before
• Replacing NMD migration equal to 15% of Total Assets with overnight borrowings would cause +300bp Earnings at Risk to fall by 3.13% of NII but remain within risk limits. +300bp EVE would fall from -10.4% to -17.2%.
• If the same migration were replaced with a 1-3yr ladder of FHLB borrowings, +300bp Earnings at Risk would only fall by 1.5%, potentially saving $340,000 of margin income vs. overnight borrowings. +300bp EVE would only fall 2%, potentially saving nearly 5% of EVE volatility.

16
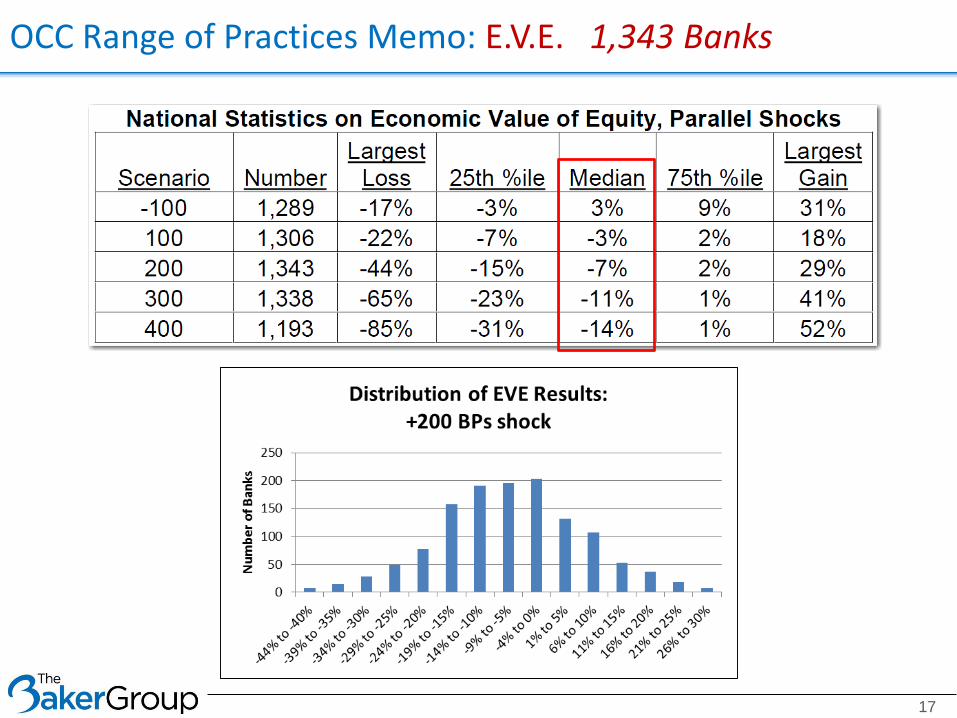
OCC Range of Practices Memo: E.V.E. 1,343 Banks
17

Keep a keen eye on risk management reports… Are we okay with these numbers/levels when rates rise?
18

• What percentage of total assets is represented by the portfolio?
• If we don’t want to risk more than that same percentage of our capital on portfolio depreciation…
then…• Stay within the duration
that would trigger that level of depreciation in a bear market.
Duration Speed Limit
19
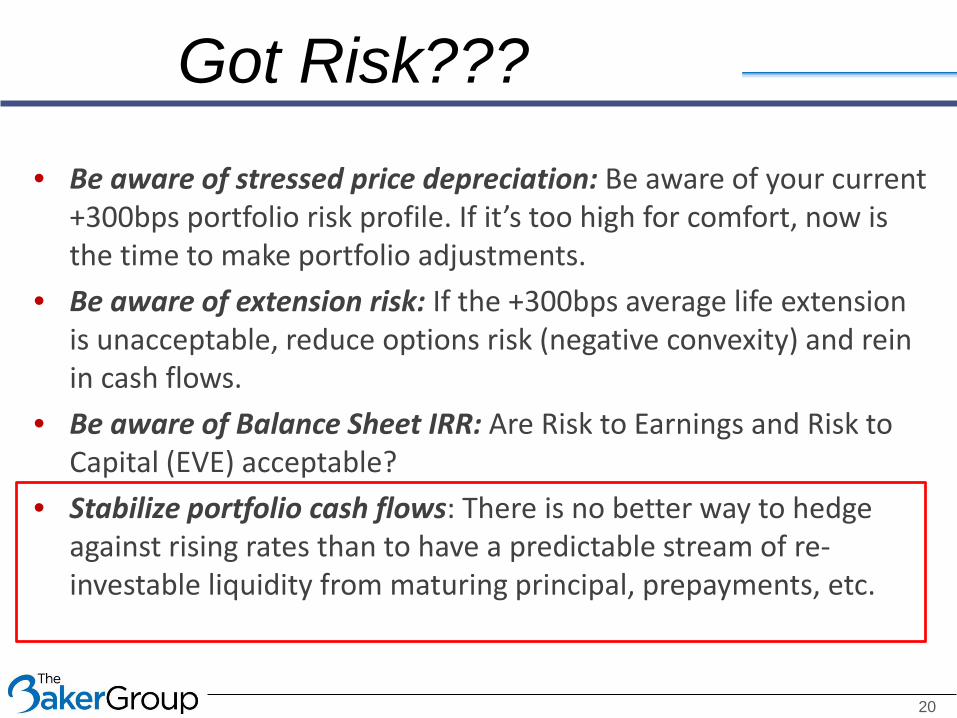
• Be aware of stressed price depreciation: Be aware of your current +300bps portfolio risk profile. If it’s too high for comfort, now is the time to make portfolio adjustments.
• Be aware of extension risk: If the +300bps average life extension is unacceptable, reduce options risk (negative convexity) and rein in cash flows.
• Be aware of Balance Sheet IRR: Are Risk to Earnings and Risk to Capital (EVE) acceptable?
• Stabilize portfolio cash flows: There is no better way to hedge against rising rates than to have a predictable stream of re-investable liquidity from maturing principal, prepayments, etc.
Got Risk???
20
21
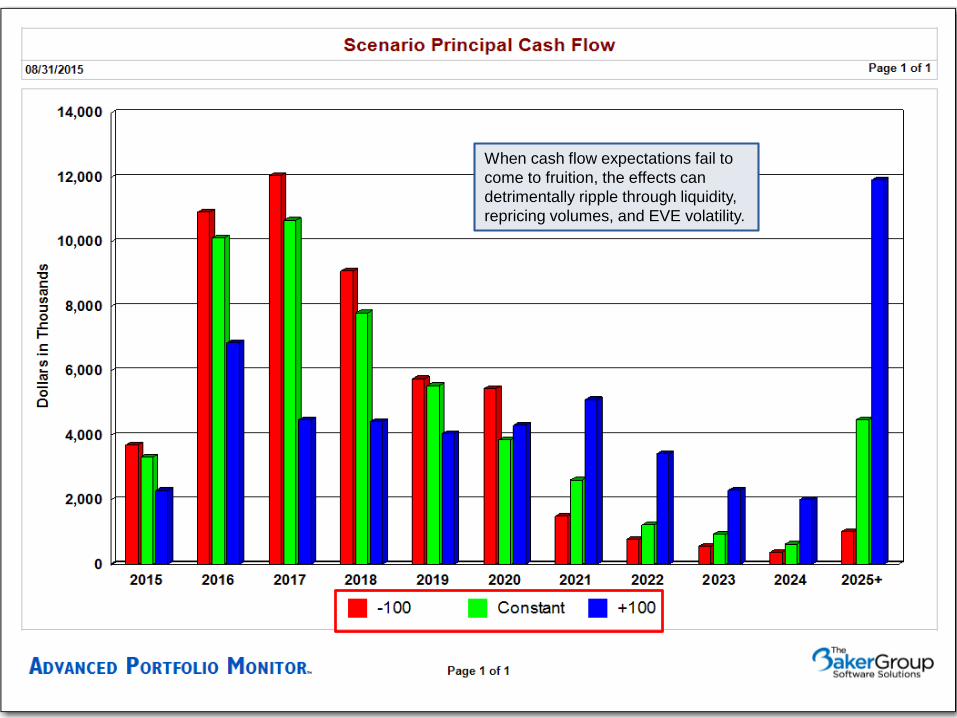
When cash flow expectations fail to come to fruition, the effects can detrimentally ripple through liquidity, repricing volumes, and EVE volatility.
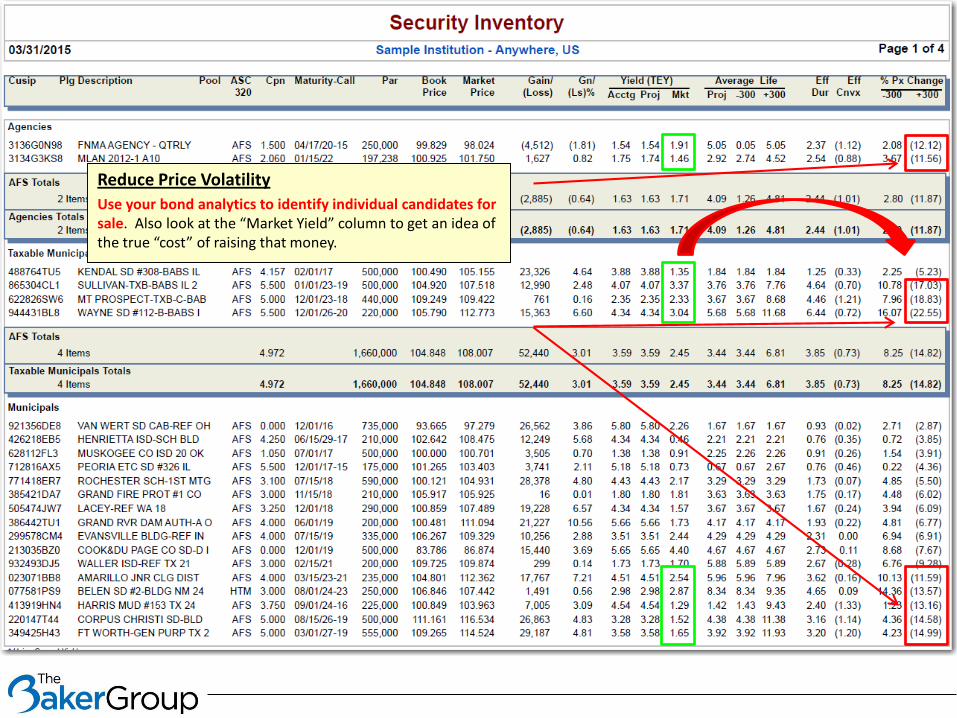
Reduce Price VolatilityUse your bond analytics to identify individual candidates for sale. Also look at the “Market Yield” column to get an idea of the true “cost” of raising that money.
• Investments as an Interest Rate Risk Toolo Most expeditiouso Most predictableo Most autonomous
• …but it does not live alone.• Are your strategies compatible?
o Lendingo Fundingo Investing
Your Portfolio Answers Only to You…
23
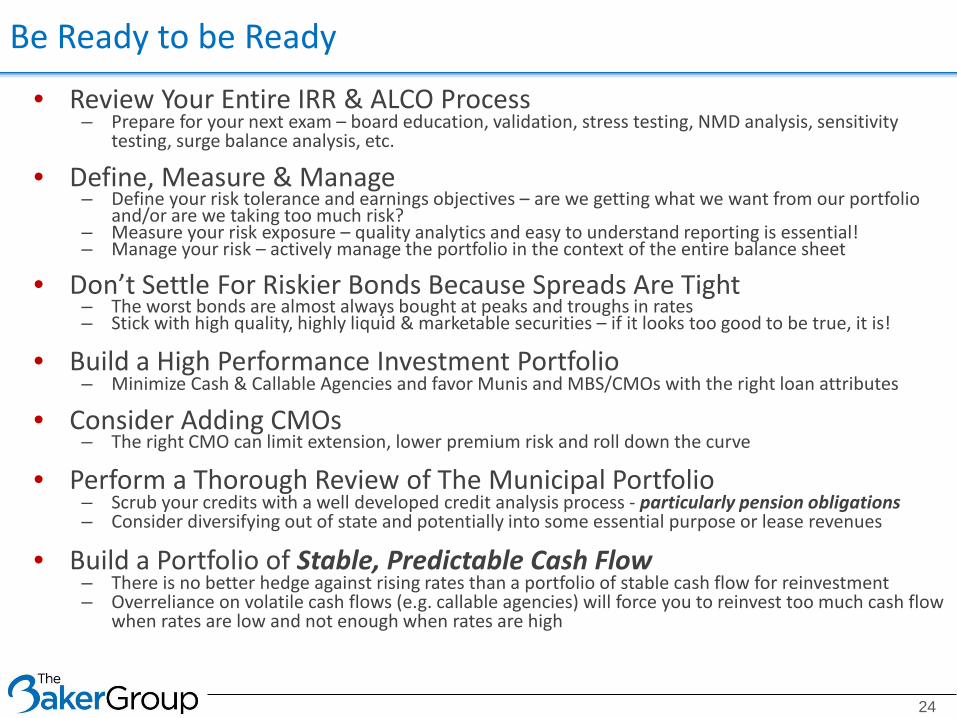
Be Ready to be Ready
24
• Review Your Entire IRR & ALCO Process– Prepare for your next exam – board education, validation, stress testing, NMD analysis, sensitivity
testing, surge balance analysis, etc.
• Define, Measure & Manage– Define your risk tolerance and earnings objectives – are we getting what we want from our portfolio
and/or are we taking too much risk?– Measure your risk exposure – quality analytics and easy to understand reporting is essential!– Manage your risk – actively manage the portfolio in the context of the entire balance sheet
• Don’t Settle For Riskier Bonds Because Spreads Are Tight– The worst bonds are almost always bought at peaks and troughs in rates– Stick with high quality, highly liquid & marketable securities – if it looks too good to be true, it is!
• Build a High Performance Investment Portfolio– Minimize Cash & Callable Agencies and favor Munis and MBS/CMOs with the right loan attributes
• Consider Adding CMOs– The right CMO can limit extension, lower premium risk and roll down the curve
• Perform a Thorough Review of The Municipal Portfolio– Scrub your credits with a well developed credit analysis process - particularly pension obligations– Consider diversifying out of state and potentially into some essential purpose or lease revenues
• Build a Portfolio of Stable, Predictable Cash Flow– There is no better hedge against rising rates than a portfolio of stable cash flow for reinvestment– Overreliance on volatile cash flows (e.g. callable agencies) will force you to reinvest too much cash flow
when rates are low and not enough when rates are high