portfolio preferences of foreign institutional...
TRANSCRIPT

Portfolio Preferences of Foreign Institutional Investors
Reena Aggarwal McDonough School of Business
Georgetown University Washington D.C. 20057
(202) 687-3784 [email protected]
Leora Klapper
The World Bank 1818 H Street, NW
Washington D.C. 20433 (202) 473-8738
Peter D. Wysocki Sloan School of Management
Massachusetts Institute of Technology Cambridge, MA 02139
(617) 253- 6623 [email protected]
World Bank Policy Research Working Paper 3101, July 2003 The Policy Research Working Paper Series disseminates the findings of work in progress to encourage the exchange of ideas about development issues. An objective of the series is to get the findings out quickly, even if the presentations are less than fully polished. The papers carry the names of the authors and should be cited accordingly. The findings, interpretations, and conclusions expressed in this paper are entirely those of the authors. They do not necessarily represent the view of the World Bank, its Executive Directors, or the countries they represent. Policy Research Working Papers are available online at http://econ.worldbank.org.
We thank Asli Demirguc-Kunt, Bill Droms, George Comer, Christian Leuz, Keith Ord, and seminar participants at American University, University of Alabama, University of Florida, Georgetown, Fortis-Georgia Tech Conference on International Finance, London Business School, Penn State, University of Texas-Austin AIM Investment Center Conference, and The World Bank for helpful comments. Emily Drogt, Volkan Muslu, Victor Sulla, Christen Cuculich, Nobuyuki Kobayashi and Aya Okajima provided excellent research assistance. We also thank I/B/E/S for providing analyst data. Aggarwal gratefully acknowledges research support from the Graduate School of Arts and Sciences and the McDonough School of Business, Georgetown University.
Pub
lic D
iscl
osur
e A
utho
rized
Pub
lic D
iscl
osur
e A
utho
rized
Pub
lic D
iscl
osur
e A
utho
rized
Pub
lic D
iscl
osur
e A
utho
rized
Pub
lic D
iscl
osur
e A
utho
rized
Pub
lic D
iscl
osur
e A
utho
rized
Pub
lic D
iscl
osur
e A
utho
rized
Pub
lic D
iscl
osur
e A
utho
rized
2
Portfolio Preferences of Foreign Institutional Investors
Abstract
This paper examines investment allocations in emerging markets by actively-managed U.S. mutual funds. We analyze both country- and firm-level characteristics and policies that influence these investment allocations. At the country-level, we find that U.S. funds invest more in open emerging markets with stronger shareholder rights, legal frameworks and accounting policies. After controlling for country characteristics, U.S. funds are found to invest more in large, growing firms with high analyst following and policies such as an ADR listing and more transparent accounting policies. The impact of an ADR listing and better accounting policies is most pronounced in countries with weaker investor protection. Our results suggest that steps can be taken both at the country- and the firm-level to create an environment conducive to foreign institutional investment.
3
Portfolio Preferences of Foreign Institutional Investors
This paper examines the active investment allocations of U.S. mutual funds in emerging
market equities. We focus on emerging markets because foreign capital plays an important role
in promoting economic growth in countries with developing financial systems.1 Moreover,
emerging markets exhibit wide variation in country-level and firm-level policies that potentially
affect foreign investment flows. Our analysis provides new insights into the country and firm
characteristics and policies that influence U.S. institutional investment decisions. We find that
(a) country-level policies such as floating exchange rates and strong shareholder rights, legal
institutions, and accounting standards, and (b) firm-level characteristics such as greater growth
options, size, and analyst following and policies such as ADR listing and better accounting
disclosures are associated with greater U.S. mutual fund investment. In addition, the impact of
the ADR listing and accounting disclosures is most pronounced in countries with weak
shareholder rights.
Our finding that country and firm-level discretionary policies affect institutional
investment in emerging markets is relevant to the on-going debate on governance reforms in
global markets. U.S. institutions, including mutual funds, constitute the largest source of equity
capital in the world. Both emerging market firms and countries are interested in attracting U.S.
institutional investment to improve individual stock and overall market liquidity. This additional
demand lowers firms’ cost of capital and allows them to compete more effectively in the global
marketplace, hence benefiting a country’s economy. In addition, previous research finds a strong
link between capital market development and economic growth.2
1 Allayannis, Brown and Klapper (2003) and Esty (2003) show the importance of foreign debt for emerging market firms. 2 For example see Levine (1997), King and Levine (1993a, 1993b) and Rajan and Zingales (1998).

4
The focus of our analysis is on the investment allocation strategies of U.S. fund
managers.3 We use a unique combination of databases to examine these investment allocation
decisions, including fund-level investment allocations from Morningstar4; firm-level financial
and accounting information from Worldscope; firm-level and country-level market performance
data from Datastream; and country-level data from the IMF-IFS database and other published
sources. This data allows us to test the impact of country and firm-level policies and their
interactive effect on U.S. mutual fund managers’ investment allocations.
Our sample and methodology provide unique insights into the major factors that
influence institutional investment allocations. First, we focus on the link between the outside
demand for information and firms’ and countries’ policies. Unlike other classes of institutional
investors, mutual funds generally do not engage in active firm-level corporate governance
activities. Therefore, our mutual fund sample allows us to isolate the role of countries’ and firms’
“arms-length” governance policies on foreign investment decisions. Second, in contrast to prior
related research, we analyze funds’ investment allocations that deviate from passive investment
strategies that mirror major market indices.5 We use a sample of actively-managed emerging
market mutual funds that do not simply track a benchmark index. However, the benchmark index
is important because fund managers’ performance-based compensation is generally tied to a
benchmark index. We use the Morgan Stanley Capital International (MSCI) Emerging Markets
Free Index as the benchmark for investment allocations in emerging markets. The MSCI Index is
a widely-used measure of emerging market performance and is often used as a benchmark for
3 Previous literature has studied the portfolio allocation choices of mutual funds across asset classes (Elton and Gruber, 2003). However, to the best of our knowldege, this is the first cross-country study of firm-level fund investments. 4 Prior mutual fund studies typically use the CDA/Spectrum database to obtain portfolio holdings in U.S. firms. However, portfolio holdings in non-U.S. firms is only available from the Morningstar database.

5
fund managers’ performance-based compensation. Perfect tracking of the index is typically
neither feasible nor desirable by actively managed funds. In addition to explicit decisions to
deviate from the index, managers may use stratified and optimization sampling and synthetic
replication to duplicate the index. We perform all empirical analyses in both absolute terms and
relative to the MSCI index.
Our descriptive evidence shows that while there is considerable overlap between the U.S.
fund holdings and the MSCI Emerging Markets Index, the funds do not limit their investments to
stocks in the Index. The Index includes 649 firms in 2001, but our sample of actively-managed
U.S. mutual funds invested in twice that number of emerging market firms in 2001. In addition,
some of the firms included in the Index are not part of the funds’ holdings.
We first examine the relationship between U.S. mutual fund investments and country-
level characteristics. We are particularly interested in discretionary policies that can lead to
greater foreign investment flows.6 La Porta el al. (1997, 1998, 2000) find that strong investor
protection laws, high enforcement and high quality accounting disclosures lead to greater
financial and capital market development. We test these country-level measures as possible
determinants of U.S. mutual fund investment allocations. Our results show that U.S. mutual
funds are more likely to invest in equities in emerging market countries that have floating
exchange rate policies and better shareholder rights, legal institutions, and average accounting
quality. In addition, we find that the impact of average firm-level accounting disclosures on U.S.
investment allocations is higher in countries that have weak shareholder rights.
5 In particular, firm and market attributes such as size and liquidity are systematically related to index membership. Therefore, a finding that U.S. funds “actively” invest in larger and more liquid stocks and markets may simply reflect the funds’ passive indexing strategy. 6 For example, Gelos and Wei (2002) and Borensztein and Gelos (2001) study the behavior of international portfolio flows over time. Kaminsky, Lyons, and Schmukler (2001) examine the relationship between portfolio flows and stock returns. In addition, see Froot, O’Connell, and Seasholes (2001), and Brennan and Cao (1997).
6
Next, we examine the relationship between mutual fund investment and firm-level
characteristics and discretionary policies. Our results show that U.S. mutual funds allocate more
of their assets to large growth firms with high analyst following and low leverage. In addition to
these characteristics, we focus on firms’ discretionary policy choices that potentially attract
foreign investment in spite of the institutional shortcomings in their home country. We focus on
both ADR listings and voluntary accounting disclosures as two important policy choices that
may allow firms to overcome deficiencies in their home country’s protection of outside
investors. A 2002 McKinsey survey found that 71% of emerging market investors identified
“Accounting Disclosure” as “Very Important” for their investment decision.7 These disclosures
have also been shown in previous literature to be a primary source of information for foreign
investors (see, for example, Bradshaw, Bushee and Miller, 2002).
We create an accounting quality index based on a firm’s use of (a) internationally-
recognized accounting standards, (b) quality of the auditor, (c) use of consolidated financial
reports, and (d) audit opinion. In addition, we examine both listed and unlisted ADRs issued by
emerging market firms. Our results show that, over and above other firm-level factors, ADR
issuance and higher quality accounting disclosures lead to greater U.S. mutual fund investment.
More importantly, we find that the impact of ADRs and high quality accounting policies is more
pronounced in countries with weak shareholder protection.
Our findings on allocations by U.S. mutual funds in emerging markets extend the
growing literature on the determinants of global investment flows and allocations. Recent
research has examined macroeconomic, political and legal determinants of portfolio investment
7 McKinsey Global Investor Opinion Survey on Corporate Governance 2002. Following “Accounting Disclosure” in importance to investors is “Shareholder Equality” and “Property Rights”, which are identified as “Very Important” by 47% and 46% of investors, respectively.
7
inflows at the country-level, but very little research has examined firm-level determinants. A few
studies have examined firm-level allocations, but they generally focus on single countries with
uniformly high investor protection laws and accounting standards. For example, Falkenstein
(1996) investigates the allocations of U.S. open-end mutual funds in U.S. stocks; Kang and Stulz
(1994) examine foreign investment in Japan; and Dahlquist and Robertsson (2001) investigate
foreign investment in the Swedish market.
Our results add to the growing literature on foreign investment decisions. The theoretical
model of Brennan and Cao (1997) uses information asymmetries to motivate differences between
domestic and foreign investors. Their empirical analysis shows that domestic investors have
informational advantages. Covrig, Lau and Ng (2002) also conclude that foreign fund managers
have less information about domestic stocks than do domestic fund managers. Dahlquist et al.
(2002) conclude that the difficulties and cost of gathering information on foreign firms creates a
“home bias” and empirically show that a significant proportion of shares are closely held in
several countries, hence reducing the float. Our results complement these studies and show an
important role for country- and firm-level governance policies in overcoming these information
asymmetries.
The rest of the paper is organized as follows. Section I discusses the data used in the
empirical analysis. A description of fund characteristics is presented in Section II. The empirical
results on the relationship between fund holdings and country characteristics are reported in
Section III. Section IV reports results on fund holdings and firm characteristics after controlling
for country attributes. A summary and conclusions are provided in Section V.

8
I. Data and Methodology
A. Mutual Funds Sample
We obtain portfolio holdings from the February 2002 release of the Morningstar database
for each U.S. mutual fund with a stated objective of investing primarily in emerging market
equities.8 Our analysis focuses on active portfolio allocation decisions of U.S. mutual funds and,
therefore, we exclude exchange-traded funds and funds that explicitly follow passive indexing
strategies. Consistent with the MSCI Emerging Markets Free Index, we define the following
countries as emerging markets: Argentina, Brazil, Chile, China, Colombia, Czech Republic,
Egypt, Greece, Hungary, India, Israel, Jordan, Malaysia, Mexico, Morocco, Pakistan, Peru,
Philippines, Poland, Russia, South Africa, South Korea, Sri Lanka, Taiwan, Thailand, Turkey
and Venezuela.
At the fund level, we collect detailed information on each fund’s portfolio holdings, i.e.,
the proportion of the fund’s assets invested in individual firms, the percentage invested in stocks,
bonds and cash, investments by region, and investments by industry sectors.
The U.S. mutual funds examined are classified as: Diversified Emerging Markets,
Pacific/Asia excluding Japan and Latin America. We exclude Diversified Pacific/Asia mutual
funds because the majority of their investments are in countries that are not considered emerging
markets, such as, Japan, Hong Kong and Singapore. Similarly, we exclude European funds
because of their emphasis on developed Western European markets. In the Pacific/Asia
excluding Japan sample of funds, we exclude 11 funds that invest 90 percent or more of their
assets in three or less countries. Finally, we also exclude multiple classes of the same emerging
market mutual fund. Certain funds have multiple classes that have identical portfolio holdings
8 Because different funds report their portfolio holdings at different times, the February 2002 version of the Morningstar database contains funds’ portfolio holdings for October 2001, December 2001, or January 2002.

9
but different fee structures. For example, one fund may have an exit fee but the other does not.
All of the sample funds are primarily equity funds with more than 90 percent of their investment
in equities. The final sample consists of 74 Diversified Emerging funds, 25 Pacific/Asia
excluding Japan funds and 15 Latin America funds.
B. Country Characteristics
Our first objective is to determine the impact of country-level characteristics and policies
on U.S. mutual fund investment allocations. The first set of characteristics examined is
exogenous macroeconomic factors that affect both country-level and firm-level investment
allocations by U.S. mutual funds. We include controls for the following macroeconomic
variables: log GDP per capita (LGDPPC), growth in GDP per capita (GDPPCG) and the size of
the stock market measured as market capitalization/GDP (MKTCAPGDP. Data for the year 2000
on LGDPPC, GDPPCG and MKTCAPGDP is collected from the IMF's International Finance
Statistics (IFS) database. Also included are country-level five-year stock market returns
(MKTRETURN) and market turnover (TURNOVER) from Datastream. Market return is
expected to capture performance and turnover is a measure of liquidity in the country’s stock
market.
We then turn to country-level policy choices that are arguably under the control of
governments or regulatory agencies. Two major monetary and tax policies we examine are the
exchange rate regime and the withholding rate on investment returns. We use an indicator (1-5)
of whether the exchange rate regime is a float, managed float, or pegged (EXRATE) and the
withholding tax rate on dividends (WTAX). WTAX is from the S&P Emerging Markets
Factbook and the exchange rate classification used is according to Reinhart and Rogoff (2003).9
9 The witholding tax rate on dividends, WTAX, is missing for many countries in our sample and therefore is only included for robustness.
10
Next, we focus on country-level policies that protect the claims of outside investors.
Denis and McConnell (2002) define corporate governance as the set of mechanisms designed to
induce managers to make decisions that maximize shareholders' wealth. For example, good
corporate governance deters managers from expropriating shareholder wealth and therefore
shareholders have more confidence investing in a company. La Porta et al. (1997, 1998, 2000a)
discuss the role of strong investor protection laws and enforcement in fostering corporate
governance that protects and attracts outside investors. Their empirical results show that better
investor protection laws, law enforcement institutions, and average accounting quality are
associated with more developed capital markets. The quality of information provided to outside
investors is also higher in countries with strong investor protection (see, for example, Leuz,
Nanda, and Wysocki, 2003). We directly test the impact of these country-level policies on U.S.
mutual fund investment allocations. If good country-level policies protect the claims of outside
investors, then we should find that foreign institutions invest more in countries with policies that
are favorable to them.
To investigate the impact of country-level investor protection policies on foreign
investment, we use three measures of corporate governance: Shareholder rights (SHRIGHTS),
legality (LEGALITY) and average firm-level accounting disclosures (ACCOUNT) as indicators
of shareholder protection, efficiency of the legal framework, and the average quality of financial
reporting to outside investors, respectively. The SHRIGHTS measure is the “anti-director rights”
index developed by La Porta et al. (1998) and updated to include emerging markets by Pistor
(2000). The index is constructed to capture the rights of minority shareholders and is the sum of
dummies identifying one-share/one vote, proxy by mail, unblocked shares, cumulative
vote/proportional representation, preemptive rights, oppressed minority, and % of shares needed
11
to call a shareholders’ meeting. LEGALITY is an index of the strength of the legal system and
institutional environment constructed as a weighted average of judicial efficiency, rule of law,
corruption, risk of expropriation and risk of contract repudiation using principal component
analysis (Berkowitz, Pistor, and Richard, 2002).
To investigate the impact of firms’ accounting disclosure choices on U.S. mutual fund
allocations, we use a country-level variable reported by La Porta et al., 1998. This variable
(ACCOUNT) captures the average quality of firms’ accounting disclosures within each country.
It measures the inclusion or omission of 90 items reported by firms in their annual financial
reports. Therefore, it can be viewed as capturing both the average of individual firm’s
discretionary disclosure policy choices and the effect of country-level mandated accounting
standards.
C. Firm-Specific Attributes
We next extend our analysis to the firm-level. Previous literature has shown a
relationship between better firm-level governance and higher financial and equity performance in
developed and emerging markets (for example, Gompers, Ishi and Metrick (2001), Klapper and
Love (2003) and Black, Jang and Kim (2003), respectively). Prior studies have also shown that
foreign investors are more likely to invest in firms that have high visibility. For example, Lang,
Lins and Miller (2002a) find that firms with ADRs have better information environments that are
then associated with higher market valuations. Edison and Warnock (2003) investigate the
aggregate holdings of U.S. investors in large emerging markets and find that holdings are
weighted more towards large stocks, particularly those listed in the U.S.
We first examine firm characteristics that, while being arguably exogenous, are likely to
affect mutual funds’ investment allocations. These variables are obtained from the Worldscope
12
and I/B/E/S databases and include firm size as measured by log of total assets in U.S. dollars
(LASSETS), the number of analysts following the firm as reported by I/B/E/S (NANALYSTS),
the total stock return for a 12-month period (TRETURN), dividend yield (DYIELD), leverage,
defined as total debt/ total capital (TDTCAP) and performance, measured alternatively as return
on equity (ROE) and price to book ratio (PB).10 We also calculate float (FLOAT) from the
Worldscope data and obtain firm-level turnover (FTURNOVER) from the Emerging Market
Database. However, a large number of observations are missing for these two variables and
therefore results are reported excluding them. Lang, Lins and Miller (2002b) conclude that
analyst following matters most when investors are protected least. Therefore, analysts appear to
play an important role in information gathering and monitoring management’s actions. While
analyst following may indirectly capture the quality of a firm’s discretionary governance
choices, we view it as exogenous from the perspective of the firm.
Finally, we examine firm-level discretionary policies that can directly affect foreign
investment allocations. Firms can decide to adopt U.S. governance and disclosure rules by
issuing an American Depository Receipt (ADR). We use ADR listings as reported by the Bank
of New York website. The ADR dummy is equal to one if the firm has an ADR, and zero
otherwise. In some specifications we distinguish between ADRs listed on NYSE, AMEX and
NASDAQ versus unlisted ADRs trading on OTC or as 144As, because listed ADRs have higher
disclosure and float requirements (i.e. U.S. GAAP, etc.).
10 Total market capitalization is an alternate measure of firm size. However, the total market capitalization is likely to be endogenous to other factors including U.S. mutual fund investment. Therefore, our main analysis focuses on a balance sheet measure of firm size. However, the results are robust to the use of market capitalization or firm sales as alternate measures of firm size.

13
As an alternative to ADR issuance, emerging market firms can also voluntarily adopt
higher quality disclosures. To capture these choices, we include four accounting and disclosure
quality variables: auditor quality, consolidated reporting, auditor opinion and use of
internationally-recognized accounting standards. First, auditor quality, AUDITOR, is a
categorical variable that equals one if the firm uses an international Big-5 accounting firm, and
zero otherwise. Although recent accounting scandals have raised doubts regarding the integrity
of the large, international accounting firms, prior research has shown that audit quality tends to
be higher for Big-5 auditors. Second, we create a consolidation variable, CONSOL, which equals
one if the firm presents consolidated financial statements, and zero otherwise. Consolidated
financial reports are expected to present a more complete performance picture of all of a firm’s
investments and subsidiaries. Consolidated statements are particularly important in emerging
markets where family groups and pyramid ownership schemes are prevalent. Third, we create a
clean audit opinion variable, OPINION, which equals one if the firm receives a clean opinion
from its auditor, and zero otherwise. Finally, ACCSTD is a categorical variable that equals one
for firms that use internationally recognized accounting standards (U.S. GAAP or International
Accounting Standards), and zero otherwise. Firms that use internationally recognized accounting
standards are viewed as having financial statements that present a “true and fair” picture of firm
performance. The relationship between adoption of U.S. GAAP and institutional investment is
examined by Bradshaw, Bushee and Miller (2002). They find that firms with greater degree of
conformity with U.S. GAAP exhibit greater levels of institutional ownership.
We create an index ACQUALITY equal to the sum of the four separate accounting
quality variables. The value of ACQUALITY ranges from 0 to 4, with 0 being the weakest and 4

14
being the strongest accounting quality at the firm-level. We use the index ACQUALITY in our
analysis instead of each of the four separate variables.
D. MSCI Index Benchmark
We use the MSCI Emerging Markets Free Index as the market benchmark. This is a free
float-adjusted market capitalization weighted index designed to measure equity market
performance in global emerging markets. The index reflects investable opportunities for global
investors by taking into account restrictions on foreign ownership. The market capitalization of a
firm is first adjusted for free-float and is further modified by foreign ownership limits that might
have been placed by the firm. The more restrictive of the two limitations is applied. Bailey,
Chung, and Kang (1999) and Bailey and Jagtiani (1994) discuss the impact of ownership
restrictions on stock prices. According to a survey conducted by Pensions & Investments, over
90% of international institutional equity assets in the U.S. are benchmarked to MSCI Indices.11
Our objective is to examine the fund managers’ allocation decisions. These managers oversee
actively managed funds and therefore their portfolio holdings are expected to differ from a
benchmark index. However, fund managers are compensated based on their performance relative
to a benchmark and therefore it is important to also do the analysis relative to the MSCI index.
The weight of each security in the global MSCI index is obtained from Morgan Stanley
Capital International. These global weights also allow us to build separate indices at the regional
and country-levels. For example, in order to construct the Latin American Index we include only
Latin American firms that are included in the broad MSCI Emerging Markets Free Index and to
construct the Asian index we include only the Asian firms. There were 649 firms in the MSCI
Emerging Markets Free Index after excluding multiple classes of securities for which data is
11 This information is from MSCI’s website www.msci.com.

15
available in Worldscope. Multiple classes of securities of the same firm are combined to derive
one weight for each firm. We examine the characteristics of (a) firms that are included in the
MSCI Index and are also included in the mutual funds’ portfolio holdings, (b) firms that are
included in the MSCI Index, but are not included in mutual fund portfolio holdings, and (c) firms
that are not included in the MSCI index, but are included in the mutual fund portfolio holdings.
E. Methodology
E.1 Country-Level
We first conduct our analysis at the country-level. Several regression models are
estimated to study the relationship between fund allocation and country characteristics.12 We
include all categories of funds in the regressions, with dummies identifying fund types:
Diversified Emerging, Asia and Latin America (excluded). In the first model, we only include
macroeconomic factors such as the size of the economy, measured by log of GDP per capita
(LGDPPC), an indicator of the exchange rate regime (EXRATE), and an indicator of equity
market development measured by market capitalization to GDP (MKTCAPGDP).13 The second
regression also includes five-year market returns and liquidity, MKTRETURN and
TURNOVER, respectively.
The third model includes all macroeconomic and market factors, plus the indicator of
shareholder rights (SHRIGHTS), the measure of average firm-level accounting quality
(ACCOUNT), plus the interaction term (SHRIGHTS*ACCOUNT). This interaction term allows
us to determine if, on average, firms’ individual accounting policy choices have a more
12 Although we estimate firm ownership, it is not used as the dependent variable because our objective is to model the fund manager’s decision-making process. The fund manager must decide what proportion of a fund’s assets to allocate to the firm. In addition, Bradshaw, Bushee, and Miller (2002) find that it is the increase in U.S. GAAP conformity that leads to institutional investment and not vice versa. 13 For robustness, we ran a specification that included growth in GDP per capita (GDPPCG). However, this variable is significantly correlated with LGDPPC and therefore we report results with only LGDPPC.

16
pronounced effect on U.S. mutual fund investment allocations in the presence of weak country-
level investor protection policies. The final model is similar to the prior specification, but
substitutes the country-level LEGALITY variable for the SHRIGHTS variable.
The model is expressed as follows:
% Fund Allocation = α0 + β1(macro variables) + γ(SHRIGHTS) + δ(ACCOUNT) +
φ(SHRIGHTS*ACCOUNT) (1)
In order to study the under and over weighting of funds’ investment allocations relative to
the MSCI benchmark, we repeat the above analysis using the “% Relative Spread” as the
dependent variable and is defined as:
% Relative Spread = (% Fund Allocation - % MSCI Weight) (2)
This spread measure captures discretionary investment allocations to countries and firms
that deviate from a passive indexing strategy.
E.2 Firm-Level
At the firm-level, we first estimate a simple logit model to examine the characteristics of
firms that are included in fund holdings relative to the overall population of firms. We assume
that the emerging market firms included in Worldscope constitute the population of investable
firms.14 The dependent variable (DFund) equals one if the firm is included in any fund's
portfolio holdings, and zero otherwise:
DFund = α + β1(macro variables) + β2(firm variables) + γ(SHRIGHTS + φ(ACQUALITY) (3)
We include the basic macroeconomic and market variables included in the country-level
regressions. Firm-level explanatory variables include TDTCAP, TRETURN, DYIELD,
14 We do recognize that Worldscope coverage is biased towards larger, more liquid firms that are of the greatest interest to investors. For this reason, our coverage of less developed equity markets is limited.

17
LASSETS, ROE and PB. In addition, we include a number of indicators of firm-level corporate
governance: the log of market capitalization in U.S. dollars (LMVALUEUSD), since size may be
a proxy for better media coverage and transparency, number of analysts (NANALYSTS), which
may also indicate greater transparency, ADR dummy (ADR), which indicates greater disclosure
and governance requirements, and ACQUALITY, which is our index of accounting quality.
After examining the characteristics of firms included in the funds' portfolio relative to the
population of firms, we next examine mean allocations by the fund to each firm. If a firm is not
included in the funds' portfolio then its allocation is zero. Next, we conduct a firm-level regression
analysis that is similar to the country-level regression model in equation (1). Again, several regression
specifications are estimated. The final model includes country characteristics and policies, firm
characteristics and policies, and the interaction of country and firm governance policies as shown
below. The two firm-level discretionary governance variables included are ACQUALITY and ADR
dummy.
% Fund Allocation = α + β(macro variables)+ γ(firm variables.) + δ(SHRIGHTS) +
φ(ACQUALITY) +(SHRIGHTS*ACQUALITY) (4)
We include an interaction term to test the effect of firm-level accounting quality relative
to country-level investor protection. ACQUALITY is replaced by ADR dummy in one of the
specifications similar to equation (4). Klapper and Love (2001) find that firm-level corporate
governance is more important in countries that have weaker investor protection. Similarly,
Doidge, Karolyi and Stulz (2001) conclude that controlling shareholders give up more of their
benefits of control in countries with low investor protection. We expect that firm-level
governance and accounting quality will matter more to foreign institutional investors in countries
with weaker country-level shareholder protection laws.

18
We also estimate equation 4 using % Relative Spread as the dependent variable at the
firm-level in order to examine the characteristics of firms in which investment is under or over
weighted relative to the MSCI index.
II. Fund Characteristics and Allocations
Table 1 shows summary statistics of mutual fund characteristics, by fund type. We
include three different types of funds that invest in emerging markets. The first category is
Diversified Emerging market funds that invest primarily in emerging markets around the world
and generally do not concentrate their investments in any one region. The second is Latin
American funds that have at least 75% of assets are invested in the region. The third category is
Pacific/Asia excluding Japan funds that invest at least 75% of their assets in Pacific countries,
with less than 10% of stocks invested in Japan. We refer to the last category as Asian funds.
As shown in Table 1, the Diversified Emerging Market funds are on average much larger
in size than any of the other fund categories, with mean net assets of $139.42 million under
management. Latin America funds are the smallest with mean assets of $33.81 million under
management. On average, funds hold positions in 80 firms. The Diversified Emerging category
is the most diversified and also the largest in terms of assets under management and these funds
have 108 holdings on average. Latin American funds on average hold 38 positions, and Asian
funds (Pacific/Asia excluding Japan) hold 31. The actual number of positions taken by funds is
larger than those reported here because a fund may hold several different classes of the same
firm’s equity.
Mean asset turnover is close to 100 percent on average and Diversified Emerging has the
highest turnover at 104 percent. The sensitivity of the fund portfolios relative to the U.S. market
is captured by beta. The three fund categories have much higher volatility than the Standard and

19
Poor’s 500 Index as measured by betas of 1.21-1.39. The Latin America category has the highest
beta at 1.39. These are all equity funds therefore on average 94-95 percent of their assets are
invested in equities and only small amounts are invested in bonds or held as cash. The portfolio
holdings of the funds are concentrated as captured by the proportion of a fund’s portfolio
invested in top-ten holdings. The concentration is lowest for Diversified funds with 28 percent
invested in top-ten holdings and is highest for Latin American funds that have 54 percent of their
assets invested in top-ten holdings.15
III. Fund Allocations and Country Analysis
A. Fund Allocations at Country-Level
The first part of our empirical analysis examines fund investments at the country-level
and then analyzes fund investments in a country relative to the weight of the country in the
MSCI Index. As discussed earlier, the MSCI Index is constructed at three levels: 1) Asia, 2)
Latin America, and 3) Diversified Emerging in order to make the appropriate comparisons with
the three fund categories included in our study. Asian funds invest in nine countries: China,
Indonesia, India, Korea, Malaysia, Philippines, Sri Lanka, Taiwan and Thailand. Of the 25 funds,
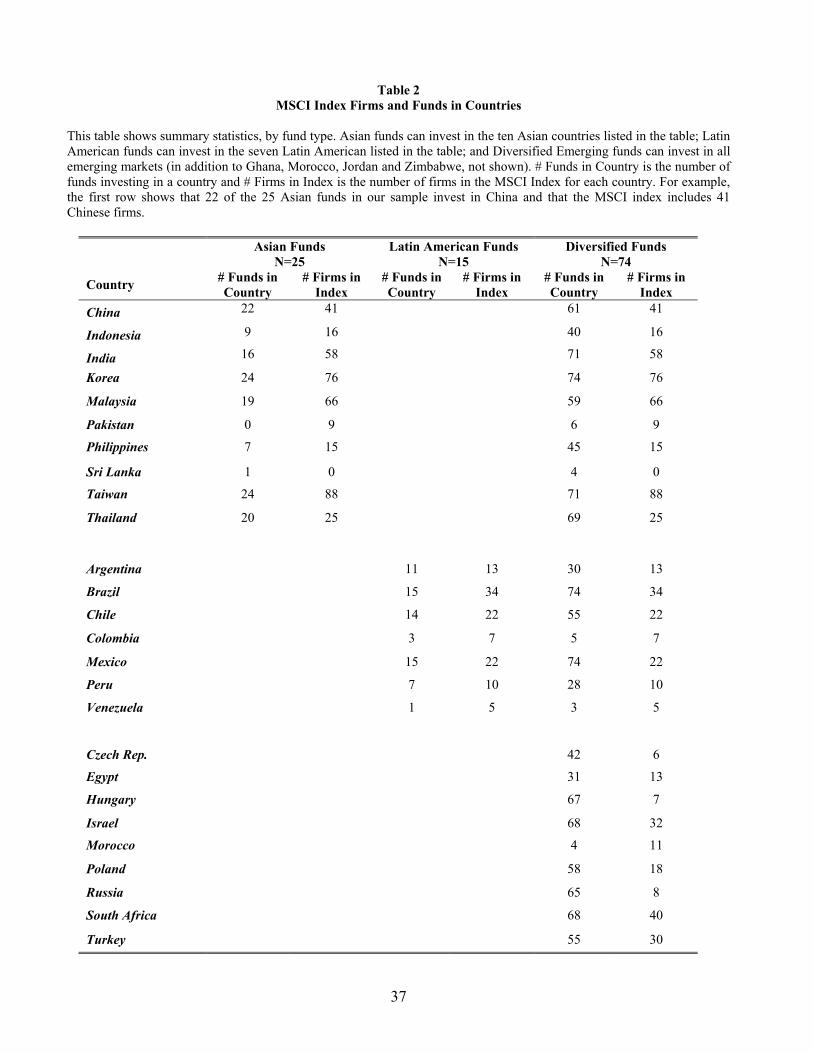
24 have investments in Korea and Taiwan as seen in Table 2. Only one fund invests in Sri Lanka.
The MSCI Index includes firms from all the nine countries except Sri Lanka. The MSCI Index
includes firms in Pakistan, although no fund has an investment in Pakistan. The MSCI index
includes the largest number of firms in Taiwan (88 firms), Korea (76 firms), Malaysia (66 firms)
and India (58 firms).
15 U.S. law prevents mutual funds from owning more than 5% of any company’s total stock. In addition, some countries may restrict ownership of financial institutions and media companies. However, all countries in our sample allow some foreign ownership in all firms. In addition, in our sample the allocation of any fund into any particular stock does not exceed 5% of the firm’s total equity.

20
All 15 Latin American funds invest in Brazil and Mexico. Only one fund invests in
Venezuela. The MSCI Index for Latin America includes 34 firms from Brazil, 22 from Chile and
Mexico, and only 5 firms from Venezuela. All 74 U.S. Diversified Emerging mutual funds invest
in Korea and Mexico. Other countries frequently included in fund portfolios are India (71 funds),
Taiwan (71 funds), Thailand (69 funds), Israel (68 funds) and South Africa (68 funds). The
countries with the smallest number of funds are Jordan (1 fund), Slovenia (2 funds), Zimbabwe
(3 funds), Ghana (3 funds), Venezuela (3 funds) and Morocco (4 funds).16
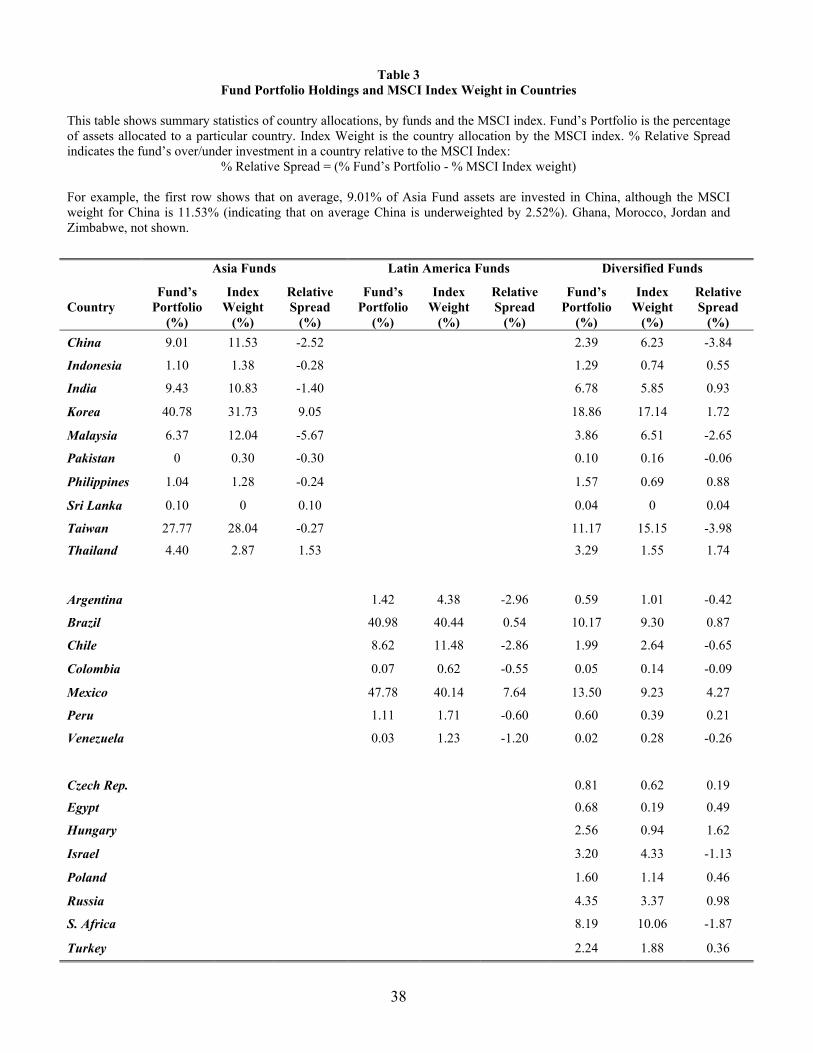
Table 3 reports the average proportion of fund’s assets invested in each country, by fund
type. Also reported are the weights of the countries in the MSCI Index. The countries with the
largest weights in the portfolio of Asian funds are Korea (40.78%) and Taiwan (27.77%). These
two countries also have the largest weights in the MSCI Asia Index with Korea at 31.73% and
Taiwan at 28.04%. Next, we analyze the proportion of a fund’s assets invested in a country
relative to the country’s weight in the MSCI Index. Therefore, relative to the Asian Index the
funds over-invest in Korea by 9.05% and under-invest in Taiwan by 0.27% as measured by %
Relative Spread. Fund portfolios under-weight firms in China, Indonesia, India, Malaysia,
Philippines and Taiwan relative to the MSCI weights.
Latin American funds, on average, invest 47.78% and 40.98% of their assets in Mexico
and Brazil, respectively. Mexican firms constitute 40.14% of the MSCI Latin America Index and
Brazilian firms constitute 40.14%. Therefore, Mexico is over-weighted by 7.64% in fund
portfolios and Brazil is over-weighted by 0.54%. Fund portfolios under-weight firms in
Argentina, Chile, Colombia, Peru and Venezuela relative to the Index.
16 The following countries are not included in Tables 2 and 3 for lack of space: Jordan, Slovenia, Zimbabwe, and Ghana.

21
Diversified Emerging funds invest in a total of 30 countries and, on average, invest a
smaller proportion of their assets in firms from a single country as compared to the regional
Asian and Latin American funds. On average, Korean firms receive the largest proportion of the
funds’ assets (18.86%), followed by Mexico (13.50%), Taiwan (11.17%) and Brazil (10.17%).
These same countries also have the largest weights in the MSCI Index. However, there is
considerable variation in the funds' over/under-investment investments relative to the Index.
B. Fund Allocations and Country-Level Attributes
We next relate the funds’ portfolio holdings to country attributes. The objective is to
examine the country-level factors that may influence a fund’s portfolio holdings in a country.
Fund portfolio holdings are measured in two ways: 1) the percentage of funds’ absolute
allocation to each country; and 2) the “% Relative Spread” that measures the over and under-
investment of funds by calculating the difference between the firms’ allocated weight and the
MSCI Index weight for each country. These two variables are used as our dependant variables.
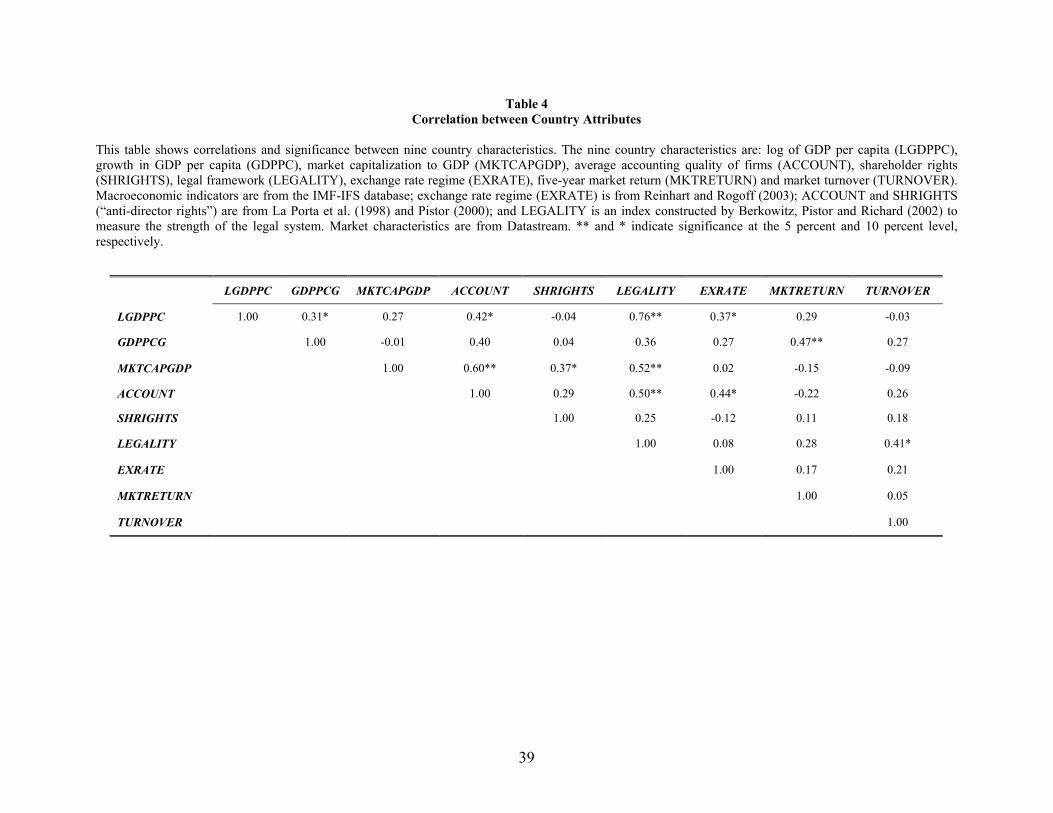
We first report correlations for attributes at the country-level in Table 4. Log of GDP per
capita is included in all regression models to control for size of the country’s economy. This
variable is not significantly correlated with any of the other variables used in the regression
models except EXRATE, LEGALITY and ACCOUNT. LGDPPC is positively related with
market capitalization to GDP with a correlation of 0.27 but is not significant. MKTCAPGDP is
significantly and positively correlated with accounting standards in the country (0.60) and also
with LEGALITY (0.52). Because of the high correlations, separate regression models are
estimated.
Table 5 presents regression results using the % Fund Allocation as the dependant
variable. The models are estimated including all fund categories – Asian, Latin American and
Diversified Emerging – and fund type dummies (DASIA and DDIV, excluding DLATIN). The
22
number of observations is equal to the number of funds in each category times the number of
countries, summed across fund types. The sample is uneven across regressions because our
country-level governance variables are not available for some countries.
The first column in Table 5 shows only the macroeconomic variables and suggests that
funds invest more in countries with more developed economies, as measured by log of GDP per
capita (LGDPPC), floating exchange rate regimes, as captured by EXRATE, and relatively larger
stock markets as measured by the ratio of market capitalization to GDP (MKTCAPGDP). We
find all three variables to be positive and significant in the first specification as shown in
column 1. These results highlight the need for stable macroeconomic policies in order to develop
financial markets. A variable measuring the withholding tax on dividends is also significant in
this restricted model, suggesting the importance of investor-friendly tax regimes (not shown).
Column 2 controls for market characteristics and finds that greater return and liquidity increases
foreign investment. Not surprisingly, investors prefer to invest in more active markets with lower
expected transaction costs.
Columns 3 and 4 control for macroeconomic and market development and include our
proxies for corporate governance, SHRIGHTS and LEGALITY, and country-level average
accounting quality, ACCOUNT.17 We find that SHRIGHTS, LEGALITY and ACCOUNT are
positively and significantly related to foreign investment, after controlling for other county-level
attributes. In addition, the interactions of both sets of variables (SHRIGHTS*ACCOUNT and
LEGALITY*ACCOUNT) are negative and significant. We show this as evidence to the
importance of a strong legal framework and accounting standards to attract foreign investment.
Furthermore, we interpret the interaction term to suggest that good accounting practices
17 For example, DeFond and Hung (2003) find investor protection to be related to law enforcement but not to an extensive set of laws.

23
(ACCOUNT) matter more in countries with weak laws and judicial enforcement (as proxied by
SHRIGHTS and LEGALITY, respectively). In particular, greater transparency and disclosure is
even more important in countries where minority shareholders have ex-ante weaker power and
voice in firm decisions and investors believe the courts are slow and inefficient in the case of ex-
post distress. 18
Next, we examine in Table 6 the relationship between % Relative Spread and country
characteristics. Our indicator of exchange rate regime, EXRATE is robust in three of the four
specifications, confirming the importance of exchange rate policy to foreign investors. Funds
invest more of their assets relative to the MSCI Index weights in countries with less developed
equity markets as measured by market capitalization to GDP, suggesting that firms overinvest in
countries that are less represented in the MSCI index (rather than additional firms in countries
with more developed markets that are already heavily represented). Columns 3 and 4 investigate
further which countries funds choose to overinvest in. Similar to our findings in Table 5, we find
in Column 3 that county-level shareholder rights (SHRIGHTS) and average accounting standards
(ACCOUNT) are significantly important and that better accounting practices matter more in
countries with weak investor protection. However, our results are not robust to the substitution of
LEGALITY as our measure of country-level governance. This suggests that accounting
standards and investor protection are more important to foreign institutional investors. It might
be the case that the strategy of foreign investors is to avoid using local courts – and requiring
local judicial efficiency – by performing comprehensive due diligence (that requires good
accounting disclosure and transparency) and executing their rights prior to distress (i.e. the right
18 It may also be the case that in countries with weak accounting standards, investors value more the ability to ex-ante write stronger contracts and ex-post enforce the contracts in a court of law.

24
to vote by proxy, etc.) These results must be interpreted cautiously because LEGALITY is
significant correlated with many of the other variables included in the specification. We explore
further the importance of firm-level accounting standards in the next section.
IV. Fund Allocations and Firm Analysis
A. Fund Portfolios
We examine the characteristics of emerging market firms included in the portfolio
holdings of U.S. mutual funds and compare them to all firms in the Worldscope database.
Worldscope covers a total of 4,138 firms for the emerging markets in our sample. We assume
this is the population of publicly traded firms in emerging markets available to U.S. mutual funds
to make investment allocations. Table 7 shows the median values for firm characteristics
classified in three groups. Group 1 consists of all 4,138 Worldscope firms; Group 2 consists of
2,831 firms that are in Worldscope but are not included in the mutual fund portfolio holdings;
and Group 3 consists of 1,307 firms that are in Worldscope and in the mutual funds portfolio
holdings.
A comparison of the three columns shows that U.S. mutual funds invest in firms that are
on average (median) larger as measured by market capitalization and have higher leverage as
measured by total debt to total capital. They also invest in firms that have higher profitability as
measured by ROE, ROA and PB, and also have higher dividend yield relative to the average firm
in Worldscope. Fund firms also have a higher float. Float for emerging market firms is low and
has a median value of 45.73%. This implies that more than half the shares are closely held. This
reduces liquidity in secondary market trading for these firms and institutions do not like to invest
in firms with low liquidity. Our findings are similar to those of Dahlquist and Robertson (2001)
for Sweden, Kang and Stulz (1997) for Japan, and Falkenstein (1996) for the United States.

25
Dahlquist et al (2002) conclude that home bias is linked to corporate governance. They report
that in countries where investors are poorly protected it is optimal for firms to be closely held.
Therefore, it is not surprising to find low float for emerging market firms. There is a large
difference in the number of analysts following a firm between the groups. On average, four
analysts follow firms that are in fund portfolios compared to only one for all firms in
Worldscope. The median accounting quality is the same at two for each of the three categories.
Table 8 presents correlation coefficients for firm-level attributes. The correlation between
market value and number of analysts; between market value and accounting standards; and
between number of analysts and accounting standards is positive and significant at the 5%
significance level. The ADR dummy has a positive and significant correlation with firm size,
number of analysts, and accounting quality. Therefore, in our multivariate framework we are
careful not to include all of these attributes as explanatory variables in the same model.
Next, we estimate a logit model to analyze differences between firms from Worldscope
that are included in the portfolio holdings and those firms that are not included in the portfolio.
In our models the dependent variable (DFUND) equals one if a Worldscope firm is included in
the funds’ portfolio holding, and zero otherwise. Country-level macroeconomic variables and
industry dummies indicating 1-digit SIC industrial codes are included in all models. Corporate
governance variables at the country-level are not included here but are the focus of analysis in
the next section. In addition to a baseline model, we also estimate different models that
separately include analyst following, ADR listing or accounting standards as determinants of
U.S. mutual fund investment. These models are estimated separately because of the high
correlation between the three variables. We do not report results that include float and firm-level
turnover because a number of observations are lost due to missing data on these two variables.

26
Three main conclusions can be reached from the logit regression results reported in Table
9. First, size and visibility of the firm as proxied by firm size, number of analysts following the
firm, and ADR dummy are significant and positively associated with U.S. mutual fund
investments. Second, an ADR listing is significant, whether or not the firm lists in the U.S. on an
exchange (ADRLIST) or trades over-the-counter (ADRUNLIST), although the coefficient is
almost twice as large for listed ADRs. This suggests that the greater visibility and lower trading
costs associated with even a non-listed U.S. listing may encourage foreign investment, although
the impact is larger for firms listed on an exchange that also have mandatory disclosure
requirements. Third, firms with better quality accounting quality (ACQUALITY) are associated
with allocations from U.S. mutual funds.19 These results lead us to conclude that size and
visibility of the firm and firm-level accounting quality are important attributes that are associated
with investments by U.S. mutual funds. However, the reduced form model estimated in this
section does not allow us to fully capture the details of the allocation decision. Therefore, the
next section examines firm and country attributes that are related to the level of fund allocations
in a regression framework.
B. Fund Allocation and Firm-Level Attributes
We estimate several regression models to further analyze the relationship between firm
characteristics and funds’ investment allocations in a multivariate framework.20 In Table 10, we
first investigate the determinants of U.S. funds allocations to emerging market firms measured as
the mean proportion of the funds' assets invested in a firm (expressed as a percentage). Each
fund’s allocation adds up to 100 percent. The variables have been winsorized (to correct for
outliers) and robust standard errors are estimated in each case. All regressions include country-
19 We also estimated the regressions with the individual accounting quality variables and the results are similar. 20 The analysis was repeated by weighting allocation by size of the funds as measured by total market value of the fund’s assets. The results are not reported here.

27
specific variables: the log of GDP per capita (LGDPPC), exchange rate regime (EXRATE) and
market capitalization to GDP (MKTCAPGDP). Gillan, Hartzell and Starks (2002) empirically
find that an industry’s investment opportunities, competitive environment, and information
environment plays an important role in its corporate governance structure. Therefore, industry
fixed effects are also included, but not reported. Firm-specific independent variables included in
all models are dividend yield (DYIELD), total debt to total capital (TDTCAP), 12-month stock
return (TRETURN), ROE, price-to-book ratio (PB), and firm size as measured by the logarithm
of total assets in U.S. dollars (LASSETS).21 Consistent with prior research, we find a key
determinant of fund allocation decisions is firm size. For example, a doubling in firm size leads
to approximately a 0.12% increase in the allocation of funds to a firm. The regression
specifications also suggest that analyst coverage is an important determinant of fund allocation
decisions as shown in column 1 of Table 10.
We next analyze the relationship between U.S. funds’ investment allocations and
country-level shareholder rights and firm-level discretionary policies.22 Countries have the
option to select an appropriate shareholder rights regime that is conducive to foreign investment.
Similarly, firms also have the option to issue an ADR and adopt higher disclosure requirements.
They can also create transparency and provide more information by adopting better accounting
policies. Therefore, we estimate two different specifications that include the interactive effects of
shareholder rights, ADR listings and accounting quality. The coefficient on ADR listings
suggests that a one rank improvement in accounting quality leads to an average asset allocation
increase of 0.71% and this impact is statistically significant. The coefficients of the interaction
21 We do not report results that include float and firm-level turnover because the sample size is reduced significantly due to missing data. 22 LEGALITY is not included in the specifications due to concerns about high correlation. The significance of ADR and ACQUALITY increases if some other firm-level variables such as size and analyst coverage are not included in the model. There is high correlation among some of these variables.

28
terms in the two models (ADR and SHRIGHTS, ACQUALITY and SHRIGHTS) are negative
and significant. This leads to the conclusion that the marginal effect of both firm-level policies -
ADR and accounting quality – is significant in countries with below-average outside shareholder
protection laws. In general, we can conclude that funds invest a larger proportion of their assets
in firms with more disclosure and transparency and this effect is most pronounced in countries
with weak shareholder rights.
C. Fund Allocations Relative to MSCI Index
In this section, we analyze U.S. fund managers’ active investment allocations to
emerging market firms that deviate from passive MSCI benchmarks. These tests allow us to
identify firm characteristics and policies that are associated with greater U.S. mutual fund
investment allocations relative to the MSCI benchmark.
Table 11 provides a comparison of three groups of firms. Group 1 consists of 782 firms
that are included in our funds’ portfolio holdings, but are not in the global MSCI Index.23 Group
2 consists of 525 firms that are both in the MSCI Index and in our sample of U.S. mutual funds’
holdings. Group 3 consists of 124 firms that are in MSCI Index, but are not included in any of
the funds’ holdings.24 There is considerable overlap between firms included in MSCI Index and
in portfolio holdings. However, funds invest in a large number of firms that are not part of the
index. This is not surprising because these are “actively managed” funds. This highlights that
funds are not simply mimicking the MSCI portfolio.
The mean and median market capitalization of firms in the MSCI index is US$1.25 billion
and US$366 million, respectively. The minimum and maximum values are US$9 million and
US$40.65 billion, respectively. The index consists of both some very large and very small firms.
23 Funds may be included in any of the three fund categories for the purpose of this analysis. 24 36 firms that are included in the MSCI index are not covered in Worldscope. Frequently these are newer firms that recently had an IPO and therefore coverage in Worldscope has not started.
29
The mean and median weight of the firms in the index is 0.124% and 0.04%, respectively. The
minimum weight can be quite small and almost equal to zero percent and the largest weight in
the index is 4.03%. The three firms with the largest weights in the index are Samsung
Electronics, Taiwan Semiconductor and China Mobile.
We first focus on analyzing the differences between characteristics of firms in Group 1 (in
funds’ portfolios, but not in MSCI Index) and Group 2 (in funds’ portfolios and also in MSCI
Index. Table 11 shows that firms in the funds’ portfolio holdings that overlap with the MSCI
index are larger in size, have higher dividend yield, and lower leverage. These firms perform
better as measured by ROE. The median number of analysts following firms that are included in
both the funds’ holdings and in MSCI (Group 2) is 10, much higher than the median analyst
following of 2 for firms that are not in MSCI (Group 1). 40% of the firms that are included in
both fund portfolios and the MSCI Index have ADRs (listed or unlisted). Almost half of the
ADRs are listed.
Finally, we examine U.S. mutual funds’ firm-level investment allocations relative to
MSCI benchmarks. The relative fund allocation can be positive, negative, or zero. It will be
positive if the fund allocates a larger percentage of its assets to the firm than the market index.
This will certainly be the case for the firms that are part of the fund portfolio holdings, but are
not included in the MSCI index. Relative fund allocation will be negative if the fund allocates a
smaller percentage of its assets to a firm than the index does. Again, this will certainly be the
case for firms that are included in the MSCI index, but are not found in U.S. funds’ portfolios.
The MSCI benchmark regressions for fund investment allocations are presented in Table
12. Consistent with the regression results in Table 10, we find that U.S. funds significantly
overweight their holdings (relative to the MSCI benchmark) to larger firms, firms with higher
leverage, and firms with greater analyst following. It should be noted that firm size also captures
30
other firm characteristics such as visibility and/or liquidity. Again, the impact of the number of
analysts on U.S. mutual fund allocation (relative to the MSCI Index) is consistent with our prior
findings. We then turn to the specifications that include firm-level and country-level policies. In
this case, ADR listings, shareholder rights and the interaction of these two terms are statistically
insignificant. Therefore, funds do not seem to invest larger proportions of their assets in firms
that have ADRs relative to the MSCI Index. The firm also has discretion in selecting its
accounting policies. We do find ACQUALITY and SHRIGHTS to be both positive and
significant and the interaction between them is negative and significant.
These MSCI benchmark regression results suggest that the firm-level accounting quality
is an important determinant of fund allocations, even relative to country-level investor
protection, and that firm-level accounting quality is more important in countries with weaker
shareholder protection. Specifically, the marginal effect of accounting quality is significant in
countries with below average shareholder protection laws.
V. Summary and Conclusions
This paper examines the relationship between country-level and firm-level characteristics
and policies that affect U.S. mutual fund investment allocations in emerging markets. We focus
on emerging markets because foreign capital plays an important role in promoting economic
growth in countries with developing financial systems. Moreover, emerging markets exhibit
wide variation in country-level and firm-level policies that potentially affect foreign investment
flows. Our empirical evidence suggests that (a) country-level policies such as floating exchange
rates and strong shareholder rights and legal institutions, and (b) firm-level policies such as ADR
listing and high quality accounting disclosures are positively associated with U.S. mutual fund

31
investment. Moreover, the impact of firm-level policies is most pronounced in countries with
weak shareholder rights.
Our mutual fund sample allows us to isolate the role of countries’ and firms’ “arms-
length” governance policies on foreign investment decisions. In addition, in contrast to prior
related research, we analyze funds’ investment allocations that deviate from passive investment
strategies that mirror the Morgan Stanley Capital International (MSCI) Emerging Markets Free
Index. While there is considerable overlap between the emerging markets holdings of U.S. funds
and the MSCI Index, we find that funds do not limit their investments to firms included in a
major market index.
At the country-level, our results show that, over and above other measures of
macroeconomic development, exchange rate policies, shareholder rights and legal framework are
important determinants of U.S. mutual fund investment in emerging markets. Our results also
provide insights into the impact of firm-level policies on U.S. funds’ investment allocations. We
examine both ADR issuance and the adoption of high quality accounting and disclosure choices
as possible mechanisms for emerging market firms to attract U.S. mutual fund investment. The
voluntary disclosure choices include internationally-recognized accounting standards, auditor
quality, auditor opinion and the use of consolidated statements. While results verify that U.S.
funds tend to invest in larger growth firms and firms with greater analyst coverage, we also find
that funds allocate a larger proportion of their assets to firms with better accounting policies.
Our results suggest that investment by foreign institutions depends not only on the firm’s
financial attributes but also on transparency and disclosure. We find corporate governance
attributes to be important at both the country- and firm-level. However, the two can serve as
substitutes. Therefore, steps can be taken at both the country and the firm-level to attract foreign
capital and create an environment conducive to foreign institutional investment. Investment by

32
foreign institutional investors should lead to higher demand for a firm’s stock and therefore
lower the firm’s cost of capital. Emerging market firms with lower cost of capital will be able to
compete effectively in the global market. This should help the economic development of the
country.
Our findings on emerging markets extend the growing literature on the determinants of
global investment flows and allocations. Prior research focuses on international portfolio flows
and examines the relationship between portfolio flows and stock returns. We extend this analysis
and undertake a comprehensive analysis of all emerging markets and provide more detailed
analysis of country- and firm-level factors that influence investment allocations by U.S. funds.
These results are relevant for both policy makers and firms in emerging markets seeking foreign
capital to help promote economic and firm growth.

33
References
Allayannis, Yiorgos, Greg Brown, and Leora Klapper, 2003, Capital structure, foreign debt and financial risk: Evidence from East Asia, Journal of Finance, forthcoming. Bailey, Warren, Y. Peter Chung, and Jun-Koo Kang, 1999, Foreign ownership restrictions and equity price premiums: What drives the demand for cross-border investments? Journal of Financial and Quantitative Analysis 34, 489-512. Bailey, Warren and Julapa Jagtiani, 1994, Foreign ownership restrictions and stock prices in the Thai capital market, Journal of Financial Economics 36, 57-87. Berkowitz, Daniel and Katharina Pistor, and Jean-Francois, Richard, 2003, Economic development, legality, and the transplant effect, European Economic Review, 47, 165-195. Black, Bernard, Hasung Jang, and Woochan Kim, 2003, Does corporate governance affect firm value? Evidence from Korea, working paper, Stanford Law School. Bradshaw, Mark, Brain Bushee, and Gregory Miller, 2002, Accounting choices, home bias, and US investment in non-US firms, working paper, Harvard Business School. Borensztein, Eduardo and R. Gaston Gelos, 2001, A panic-prone pack? The behavior of emerging market mutual funds, IMF Staff Papers. Brennan, Michael and H. Henry Cao, 1997, International portfolio investment flows, Journal of Finance 52, 1851-1880. Covrig, Lau and Lilian Ng, 2002, Do domestic and foreign fund managers have similar preferences for stock characteristics? A cross-country analysis, working paper, Nanyang Technological University. Dahlquist, Magnus and Goran Robertsson, 2001, Direct foreign ownership, institutional investors, and firm characteristics, Journal of Financial Economics 59, 413-440. Dahlquist, Magnus, Lee Pinkowitz, Rene Stulz, and Rohan Willimason, 2002, Corporate governance, investor protection, and the home bias, Journal of Financial Quantitative Analysis, 87-110. DeFond, Mark and Mingyo Hung, 2003, Investor protection and corporate governance: Evidence from worldwide CEO turnover, working paper, University of Southern California. Denis, Diane and John McConnell, 2002, International corporate governance: A survey, working paper, Journal of Financial and Quantitative Analysis 38, 1-36. Doidge, C., Andrew Karolyi and Rene Stulz, 2001, Why are foreign firms listed in the US worth more? Working paper, NBER.

34
Donohue, Jessica Tjornhom and Kenneth Froot, 2002, The persistence of emerging market equity flows, working paper, NBER. Drogt, Emily L., 2002, Mutual fund investment decisions: the interaction of accounting quality and legal enforcement, working paper, University of Michigan. Edison, Hali J. and Francis E. Warnock, 2003, U.S. investors’ emerging market equity portfolios: A security-level analysis, working paper, International Monetary Fund. Elton, Edwin and Martin Gruber, 2003, The rationality of asset allocation recommendations, Journal of Financial and Quantitative Analysis 35, 27-41. Esty, Benjamin, 2003, When do foreign banks finance domestic investment? New evidence on the importance of legal and financial systems, working paper, Harvard Business School. Falkenstein, Eric G., 1996, Preferences for stock characteristics as revealed by mutual fund portfolio holdings, Journal of Finance 51, 111-135. Froot, Kenneth, Paul O’Connell and Mark Seasholes, 2001, The portfolio flows of international investors, Journal of Financial Economics, 59, 151-193. Gelos, R. Gaston and Shang-Jin Wei, 2002, Transparency and international investor behavior, working paper, International Monetary Fund. Gillan, Stuart L., Jay C. Hartzell and Laura T. Starks, 2002, Industries, investment opportunities, and corporate governance structures, working paper, Center for Corporate Governance, College of Business and Economics, University of Delaware. Gompers, Paul, Joy Ishi and Andrew Metrick, 2001, Institutional investors and equity prices, Quarterly Journal of Economics, 116, 229-59. Kaminsky, Graciela L., Richard K. Lyons and Sergio Schmukler, 2001, Mutual fund investment in emerging markets: An overview, World Bank Economic Review 15, 315-340. Kang, J. K. and Rene Stulz, 1997, Why is there a home-bias? An analysis of foreign portfolio equity ownership in Japan, Journal of Financial Economics, 46, 3-28. King, Robert and Ross Levine, 1993a, Finance and growth: Schumpeter may be right, Quarterly Journal of Economics, 108, 717-737. King, Robert and Ross Levine, 1993b, Finance, entrepreneurship, and growth: Theory and evidence,” Journal of Monetary Economics, 32, 513-542. Klapper, Leora and Inessa Love, 2002, Corporate governance, investor protection, and performance in emerging markets, working paper, The World Bank. La Porta, Rafael, Lopez-de-Silanes, Florencio and Andrei Shleifer, 1997, Legal determinants of external finance, Journal of Finance, 52, 1131-1150.
35
La Porta, Rafael, Lopez-de-Silanes, Florencio, Shleifer, Andrei and Robert Vishny, 1998, Law and finance, Journal of Political Economy, 106, 1115-1155. La Porta, Rafael, Lopez-de-Silanes, Florencio and Andrei Shleifer, 1997, Corporate ownership around the world, Journal of Finance, 54, 471-518. La Porta, Rafael, Lopez-de-Silanes, Florencio, Shleifer, Andrei and Robert Vishny, 2000, Investor protection and corporate governance, Journal of Financial Economics, 58, 3-27. Lang, Mark, Karl Lins and Darius Miller, 2002a, ADRs, analysts, and accuracy: Does cross-listing in the U.S. improve a firm’s information environment and increase market value? Journal of Accounting Research, forthcoming. Lang, Mark, Karl Lins and Darius Miller, 2002b, Do analysts matter most when investors are protected least? International evidence, working paper, Indiana University. Leuz, Christian, Dhananjay Nanda and Peter D. Wysocki, 2003, Investor protection and earnings management: An international comparison. Journal of Financial Economics, 69, forthcoming. McKinsey Global Investor Opinion Survey on Corporate Governance, 2002, McKinsey & Company. Pistor, Katharina, 2000, Patterns of legal change: Shareholder and creditor rights in transition economies, European Business Organization Law Review, 1, 9-108. Rajan, Raghuram and Luigi Zingales, 1998, Financial dependence and growth, American Economic Review, 88, 559-586. Reinhart, Carmen and Kenneth S. Rogoff, 2003, The modern history of exchange rate arrangements, working paper, International Monetary Fund. S&P Emerging Markets Factbook, 2002, S&P, New York. Shleifer, A. and R. Vishny, 1997, A survey of corporate governance, Journal of Finance, 52, 737-783.

36
Table 1 Mutual Fund Characteristics
This table shows summary statistics for the three types of funds examined in the analysis. These include Diversified Emerging Markets funds, Latin America funds and Asia funds (Pacific/Asia excluding Japan). These are the three categories of funds covered by Morningstar that invest primarily in emerging markets’ equity. There are a total of 114 funds of which 74 are diversified emerging funds, 15 are Latin American funds, and 25 are Asian funds. The mean fund characteristic information is obtained from the Morningstar February 2002 database. Net Assets is the mean assets under management in millions of US dollars; Fund Holdings is the mean number of holdings in the fund’s portfolio; Fund Turnover is the mean percentage of the fund’s portfolio holdings that have changed over the past year; Fund Beta is calculated by Morningstar using the Standard and Poor’s 500 as the proxy for market return; % Assets Invested in Equity is the mean percentage of the fund’s assets invested in equity; and % Invested in Top Ten is the mean percentage of the fund’s assets invested in top-ten holdings.
Fund Type
Number of Funds
Fund Net Assets
($ million)
Fund Holdings
Fund Turnover
(%)
Fund Beta
% Assets Invested in
Equity
% Invested in Top Ten
All Funds 114 109.57 80 99.58 1.24 94.01 34.40
Diversified Emerging 74 139.42 108 103.90 1.21 93.53 28.00
Latin America 15 33.81 38 96.79 1.39 94.37 54.13
Asia 25 66.65 31 89.60 1.25 95.20 41.51
37
Table 2
MSCI Index Firms and Funds in Countries
This table shows summary statistics, by fund type. Asian funds can invest in the ten Asian countries listed in the table; Latin American funds can invest in the seven Latin American listed in the table; and Diversified Emerging funds can invest in all emerging markets (in addition to Ghana, Morocco, Jordan and Zimbabwe, not shown). # Funds in Country is the number of funds investing in a country and # Firms in Index is the number of firms in the MSCI Index for each country. For example, the first row shows that 22 of the 25 Asian funds in our sample invest in China and that the MSCI index includes 41 Chinese firms.
Asian Funds N=25
Latin American Funds N=15
Diversified Funds N=74
Country # Funds in Country
# Firms in Index
# Funds in Country
# Firms in Index
# Funds in Country
# Firms in Index
China 22 41 61 41
Indonesia 9 16 40 16
India 16 58 71 58
Korea 24 76 74 76
Malaysia 19 66 59 66
Pakistan 0 9 6 9
Philippines 7 15 45 15
Sri Lanka 1 0 4 0
Taiwan 24 88 71 88
Thailand 20 25 69 25
Argentina 11 13 30 13
Brazil 15 34 74 34
Chile 14 22 55 22
Colombia 3 7 5 7
Mexico 15 22 74 22
Peru 7 10 28 10
Venezuela 1 5 3 5
Czech Rep. 42 6
Egypt 31 13
Hungary 67 7
Israel 68 32
Morocco 4 11
Poland 58 18
Russia 65 8
South Africa 68 40
Turkey 55 30
38
Table 3 Fund Portfolio Holdings and MSCI Index Weight in Countries
This table shows summary statistics of country allocations, by funds and the MSCI index. Fund’s Portfolio is the percentage of assets allocated to a particular country. Index Weight is the country allocation by the MSCI index. % Relative Spread indicates the fund’s over/under investment in a country relative to the MSCI Index:
% Relative Spread = (% Fund’s Portfolio - % MSCI Index weight)
For example, the first row shows that on average, 9.01% of Asia Fund assets are invested in China, although the MSCI weight for China is 11.53% (indicating that on average China is underweighted by 2.52%). Ghana, Morocco, Jordan and Zimbabwe, not shown.
Asia Funds Latin America Funds Diversified Funds
Country Fund’s
Portfolio (%)
Index Weight
(%)
Relative Spread
(%)
Fund’s Portfolio
(%)
Index Weight
(%)
Relative Spread
(%)
Fund’s Portfolio
(%)
Index Weight
(%)
Relative Spread
(%) China 9.01 11.53 -2.52 2.39 6.23 -3.84
Indonesia 1.10 1.38 -0.28 1.29 0.74 0.55
India 9.43 10.83 -1.40 6.78 5.85 0.93
Korea 40.78 31.73 9.05 18.86 17.14 1.72
Malaysia 6.37 12.04 -5.67 3.86 6.51 -2.65
Pakistan 0 0.30 -0.30 0.10 0.16 -0.06
Philippines 1.04 1.28 -0.24 1.57 0.69 0.88
Sri Lanka 0.10 0 0.10 0.04 0 0.04
Taiwan 27.77 28.04 -0.27 11.17 15.15 -3.98
Thailand 4.40 2.87 1.53 3.29 1.55 1.74
Argentina 1.42 4.38 -2.96 0.59 1.01 -0.42
Brazil 40.98 40.44 0.54 10.17 9.30 0.87
Chile 8.62 11.48 -2.86 1.99 2.64 -0.65
Colombia 0.07 0.62 -0.55 0.05 0.14 -0.09
Mexico 47.78 40.14 7.64 13.50 9.23 4.27
Peru 1.11 1.71 -0.60 0.60 0.39 0.21
Venezuela 0.03 1.23 -1.20 0.02 0.28 -0.26
Czech Rep. 0.81 0.62 0.19
Egypt 0.68 0.19 0.49
Hungary 2.56 0.94 1.62
Israel 3.20 4.33 -1.13
Poland 1.60 1.14 0.46
Russia 4.35 3.37 0.98
S. Africa 8.19 10.06 -1.87
Turkey 2.24 1.88 0.36
39
Table 4 Correlation between Country Attributes
This table shows correlations and significance between nine country characteristics. The nine country characteristics are: log of GDP per capita (LGDPPC), growth in GDP per capita (GDPPC), market capitalization to GDP (MKTCAPGDP), average accounting quality of firms (ACCOUNT), shareholder rights (SHRIGHTS), legal framework (LEGALITY), exchange rate regime (EXRATE), five-year market return (MKTRETURN) and market turnover (TURNOVER). Macroeconomic indicators are from the IMF-IFS database; exchange rate regime (EXRATE) is from Reinhart and Rogoff (2003); ACCOUNT and SHRIGHTS (“anti-director rights”) are from La Porta et al. (1998) and Pistor (2000); and LEGALITY is an index constructed by Berkowitz, Pistor and Richard (2002) to measure the strength of the legal system. Market characteristics are from Datastream. ** and * indicate significance at the 5 percent and 10 percent level, respectively.
LGDPPC GDPPCG MKTCAPGDP ACCOUNT SHRIGHTS LEGALITY EXRATE MKTRETURN TURNOVER
LGDPPC 1.00 0.31* 0.27 0.42* -0.04 0.76** 0.37* 0.29 -0.03
GDPPCG 1.00 -0.01 0.40 0.04 0.36 0.27 0.47** 0.27
MKTCAPGDP 1.00 0.60** 0.37* 0.52** 0.02 -0.15 -0.09
ACCOUNT 1.00 0.29 0.50** 0.44* -0.22 0.26
SHRIGHTS 1.00 0.25 -0.12 0.11 0.18
LEGALITY 1.00 0.08 0.28 0.41*
EXRATE 1.00 0.17 0.21
MKTRETURN 1.00 0.05
TURNOVER 1.00

40
Table 5 Relationship Between Fund Portfolio Holdings and Country Attributes
This table shows results of OLS estimations of the determinants of country-level fund allocations. The dependent variable is the cumulative percentage of a fund’s assets allocated to firms in the country, by fund. For example, in the case of Asia there are 25 funds and they can invest in any of ten Asian emerging market countries. Therefore, the maximum number of observations for Asian Funds is 25 funds * 10 countries equal to 225. Many funds have no investment in a country, which means assets allocated to the country are set equal to zero. We include all fund types and dummies DASIA and DDIV indicate Asian and Diversified funds, respectively. The country attributes examined are log of GDP per capita in US dollars (LGDPPC), exchange rate regime (EXRATE), market capitalization to GDP (MKTCAPGDP), market return (MKTRETURN), market turnover (TURNOVER), legal framework (LEGALITY), shareholder rights (SHRIGHTS), and accounting standards (ACCOUNT). Macroeconomic indicators are from the IMF-IFS database. Exchange rate regime (EXRATE) is from Reinhart and Rogoff (2003). ACCOUNT and SHRIGHTS (“anti-director rights”) are from La Porta et al. (1998) and Pistor (2000). LEGALITY is an index constructed by Berkowitz, Pistor and Richard (2002) to measure the strength of the legal system. Market characteristics are from Datastream. t-statistics are in parenthesis. ** and * indicate significance at the 5 percent and 10 percent level, respectively.
INTERCEPT -23.12** (-7.51)
-20.71** (-6.53)
-18.68** (-5.11)
-37.55** (-5.24)
LGDPPC 3.74** (13.03)
3.48** (11.60)
1.86** (3.65)
2.83** (5.44)
EXRATE 1.55** (13.43)
1.24** (10.22)
0.15 (0.80)
0.11 (0.45)
MKTCAPGDP 0.01** (3.91)
0.02** (6.47)
0.00 (0.10)
-0.04** (-5.91)
MKTRETURN - 0.04** (6.57)
0.04** (2.45)
0.03** (2.39)
TURNOVER - 0.01** (12.52)
0.03** (12.01)
0.03** (9.81)
ACCOUNT - - 0.35** (5.26)
0.46** (4.50)
SHRIGHTS - - 2.61** (2.45) -
ACCOUNT* SHRIGHTS - - -0.07**
(-2.90) -
LEGALITY - - - 1.45** (2.78)
ACCOUNT* LEGALITY - - - -0.02**
(-2.67)
DASIA -3.76** (-1.85)
-5.28** (-2.68)
-5.02** (-2.41)
-4.75** (-2.28)
DDIV -10.94** (-5.95)
-11.91** (-6.56)
-11.73** (-6.85)
-11.53** (-6.61)
R2 0.28 0.32 0.39 0.39
F-stat 109.25 91.93 79.53 76.91
N 2427 2427 1513 1513
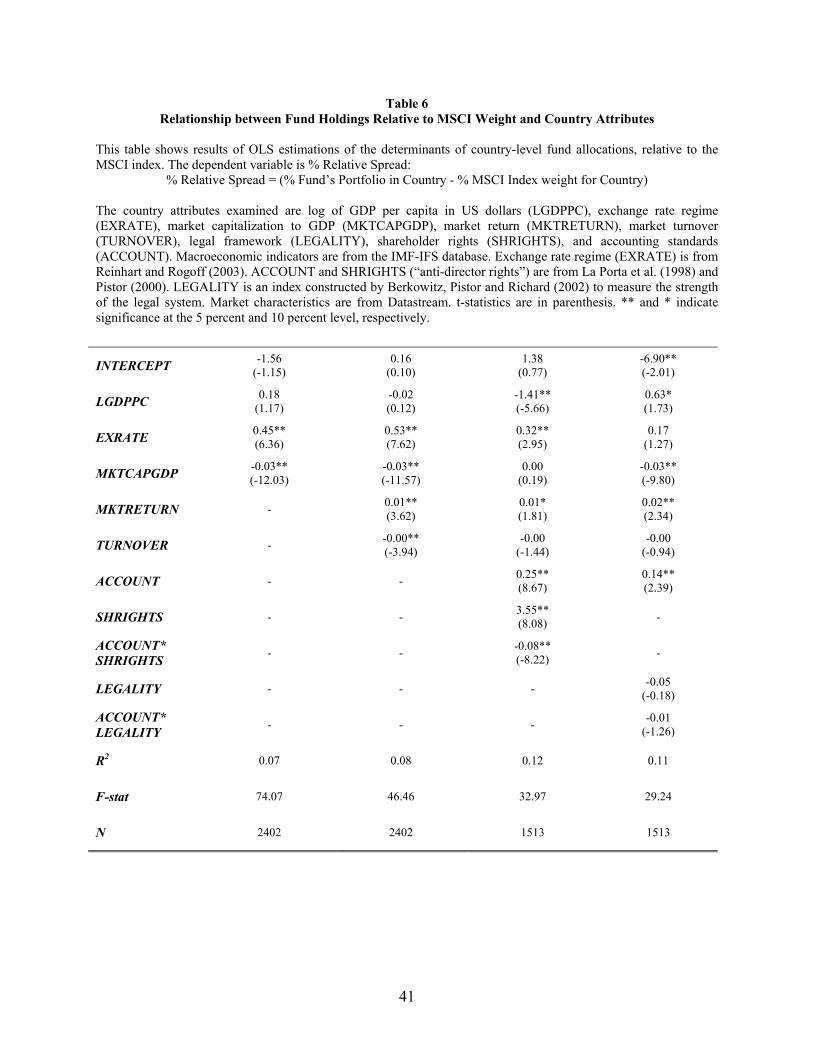
41
Table 6 Relationship between Fund Holdings Relative to MSCI Weight and Country Attributes
This table shows results of OLS estimations of the determinants of country-level fund allocations, relative to the MSCI index. The dependent variable is % Relative Spread:
% Relative Spread = (% Fund’s Portfolio in Country - % MSCI Index weight for Country)
The country attributes examined are log of GDP per capita in US dollars (LGDPPC), exchange rate regime (EXRATE), market capitalization to GDP (MKTCAPGDP), market return (MKTRETURN), market turnover (TURNOVER), legal framework (LEGALITY), shareholder rights (SHRIGHTS), and accounting standards (ACCOUNT). Macroeconomic indicators are from the IMF-IFS database. Exchange rate regime (EXRATE) is from Reinhart and Rogoff (2003). ACCOUNT and SHRIGHTS (“anti-director rights”) are from La Porta et al. (1998) and Pistor (2000). LEGALITY is an index constructed by Berkowitz, Pistor and Richard (2002) to measure the strength of the legal system. Market characteristics are from Datastream. t-statistics are in parenthesis. ** and * indicate significance at the 5 percent and 10 percent level, respectively.
INTERCEPT -1.56 (-1.15)
0.16 (0.10)
1.38 (0.77)
-6.90** (-2.01)
LGDPPC 0.18 (1.17)
-0.02 (0.12)
-1.41** (-5.66)
0.63* (1.73)
EXRATE 0.45** (6.36)
0.53** (7.62)
0.32** (2.95)
0.17 (1.27)
MKTCAPGDP -0.03** (-12.03)
-0.03** (-11.57)
0.00 (0.19)
-0.03** (-9.80)
MKTRETURN - 0.01** (3.62)
0.01* (1.81)
0.02** (2.34)
TURNOVER - -0.00** (-3.94)
-0.00 (-1.44)
-0.00 (-0.94)
ACCOUNT - - 0.25** (8.67)
0.14** (2.39)
SHRIGHTS - - 3.55** (8.08) -
ACCOUNT* SHRIGHTS - - -0.08**
(-8.22) -
LEGALITY - - - -0.05 (-0.18)
ACCOUNT* LEGALITY - - - -0.01
(-1.26)
R2 0.07 0.08 0.12 0.11
F-stat 74.07 46.46 32.97 29.24
N 2402 2402 1513 1513
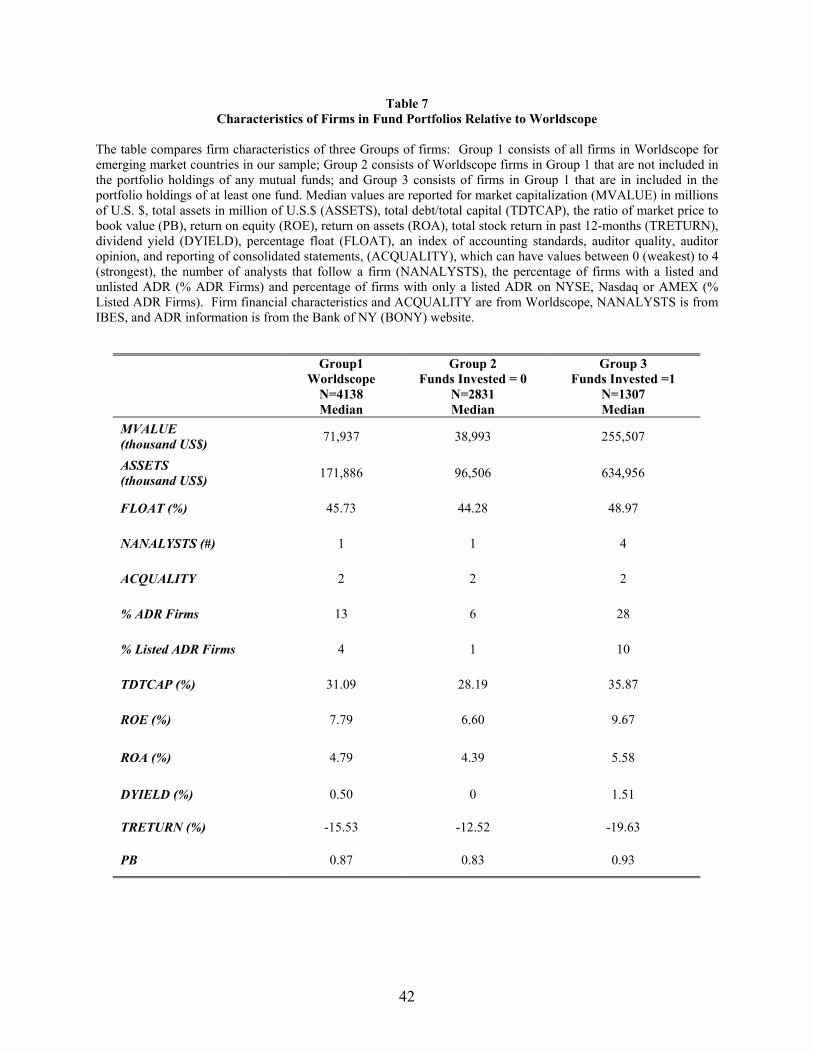
42
Table 7 Characteristics of Firms in Fund Portfolios Relative to Worldscope
The table compares firm characteristics of three Groups of firms: Group 1 consists of all firms in Worldscope for emerging market countries in our sample; Group 2 consists of Worldscope firms in Group 1 that are not included in the portfolio holdings of any mutual funds; and Group 3 consists of firms in Group 1 that are in included in the portfolio holdings of at least one fund. Median values are reported for market capitalization (MVALUE) in millions of U.S. $, total assets in million of U.S.$ (ASSETS), total debt/total capital (TDTCAP), the ratio of market price to book value (PB), return on equity (ROE), return on assets (ROA), total stock return in past 12-months (TRETURN), dividend yield (DYIELD), percentage float (FLOAT), an index of accounting standards, auditor quality, auditor opinion, and reporting of consolidated statements, (ACQUALITY), which can have values between 0 (weakest) to 4 (strongest), the number of analysts that follow a firm (NANALYSTS), the percentage of firms with a listed and unlisted ADR (% ADR Firms) and percentage of firms with only a listed ADR on NYSE, Nasdaq or AMEX (% Listed ADR Firms). Firm financial characteristics and ACQUALITY are from Worldscope, NANALYSTS is from IBES, and ADR information is from the Bank of NY (BONY) website.
Group1 Worldscope
N=4138 Median
Group 2 Funds Invested = 0
N=2831 Median
Group 3 Funds Invested =1
N=1307 Median
MVALUE (thousand US$) 71,937 38,993 255,507
ASSETS (thousand US$) 171,886 96,506 634,956
FLOAT (%) 45.73 44.28 48.97
NANALYSTS (#) 1 1 4
ACQUALITY 2 2 2
% ADR Firms 13 6 28
% Listed ADR Firms 4 1 10
TDTCAP (%) 31.09 28.19 35.87
ROE (%) 7.79 6.60 9.67
ROA (%) 4.79 4.39 5.58
DYIELD (%) 0.50 0 1.51
TRETURN (%) -15.53 -12.52 -19.63
PB 0.87 0.83 0.93
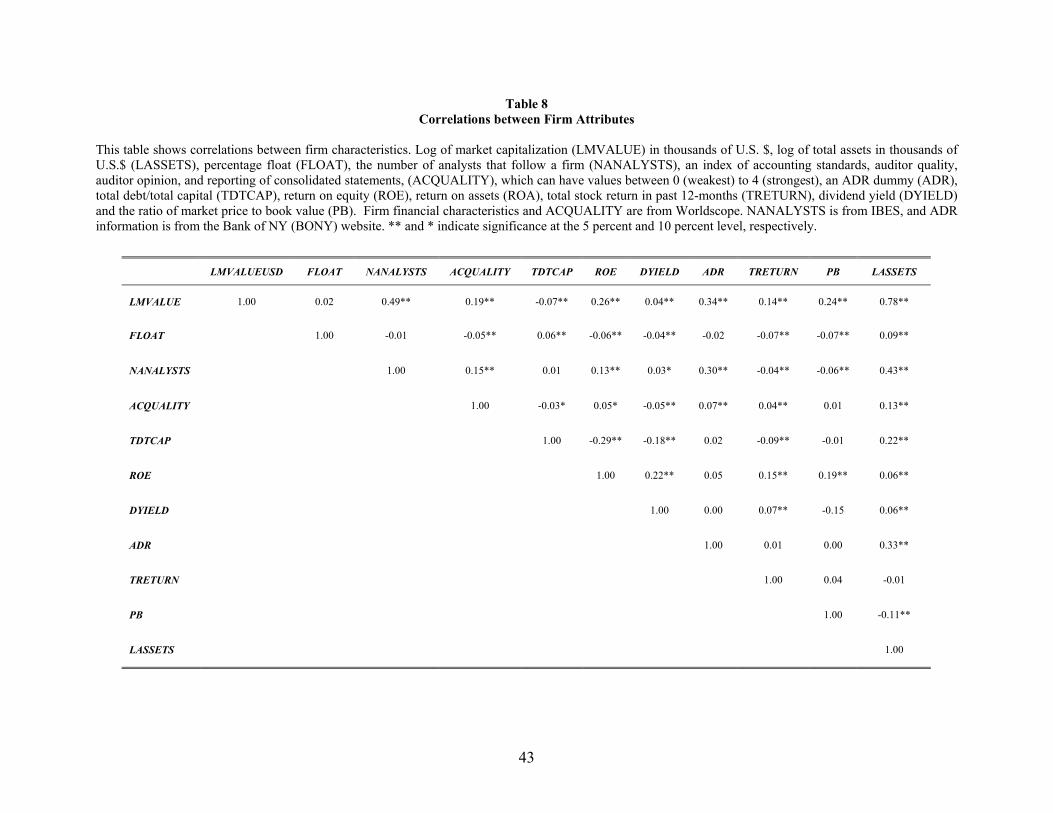
43
Table 8 Correlations between Firm Attributes
This table shows correlations between firm characteristics. Log of market capitalization (LMVALUE) in thousands of U.S. $, log of total assets in thousands of U.S.$ (LASSETS), percentage float (FLOAT), the number of analysts that follow a firm (NANALYSTS), an index of accounting standards, auditor quality, auditor opinion, and reporting of consolidated statements, (ACQUALITY), which can have values between 0 (weakest) to 4 (strongest), an ADR dummy (ADR), total debt/total capital (TDTCAP), return on equity (ROE), return on assets (ROA), total stock return in past 12-months (TRETURN), dividend yield (DYIELD) and the ratio of market price to book value (PB). Firm financial characteristics and ACQUALITY are from Worldscope. NANALYSTS is from IBES, and ADR information is from the Bank of NY (BONY) website. ** and * indicate significance at the 5 percent and 10 percent level, respectively.
LMVALUEUSD FLOAT NANALYSTS ACQUALITY TDTCAP ROE DYIELD ADR TRETURN PB LASSETS
LMVALUE 1.00 0.02 0.49** 0.19** -0.07** 0.26** 0.04** 0.34** 0.14** 0.24** 0.78**
FLOAT 1.00 -0.01 -0.05** 0.06** -0.06** -0.04** -0.02 -0.07** -0.07** 0.09**
NANALYSTS 1.00 0.15** 0.01 0.13** 0.03* 0.30** -0.04** -0.06** 0.43**
ACQUALITY 1.00 -0.03* 0.05* -0.05** 0.07** 0.04** 0.01 0.13**
TDTCAP 1.00 -0.29** -0.18** 0.02 -0.09** -0.01 0.22**
ROE 1.00 0.22** 0.05 0.15** 0.19** 0.06**
DYIELD 1.00 0.00 0.07** -0.15 0.06**
ADR 1.00 0.01 0.00 0.33**
TRETURN 1.00 0.04 -0.01
PB 1.00 -0.11**
LASSETS 1.00
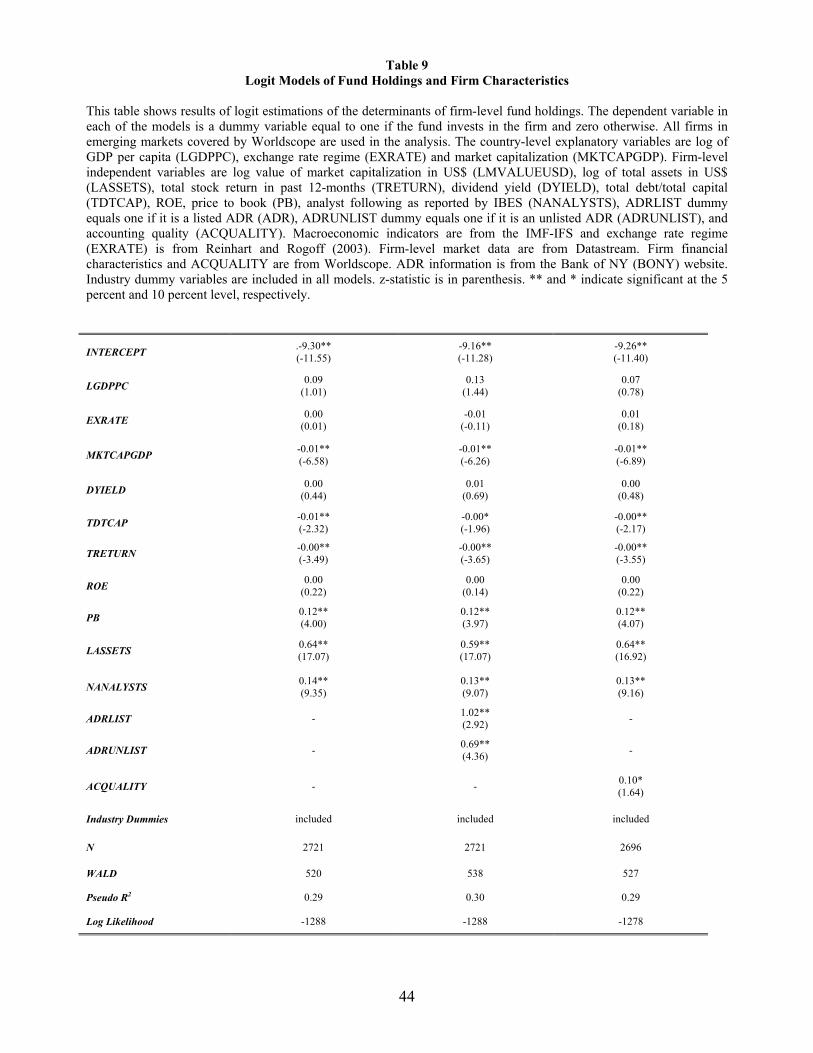
44
Table 9 Logit Models of Fund Holdings and Firm Characteristics
This table shows results of logit estimations of the determinants of firm-level fund holdings. The dependent variable in each of the models is a dummy variable equal to one if the fund invests in the firm and zero otherwise. All firms in emerging markets covered by Worldscope are used in the analysis. The country-level explanatory variables are log of GDP per capita (LGDPPC), exchange rate regime (EXRATE) and market capitalization (MKTCAPGDP). Firm-level independent variables are log value of market capitalization in US$ (LMVALUEUSD), log of total assets in US$ (LASSETS), total stock return in past 12-months (TRETURN), dividend yield (DYIELD), total debt/total capital (TDTCAP), ROE, price to book (PB), analyst following as reported by IBES (NANALYSTS), ADRLIST dummy equals one if it is a listed ADR (ADR), ADRUNLIST dummy equals one if it is an unlisted ADR (ADRUNLIST), and accounting quality (ACQUALITY). Macroeconomic indicators are from the IMF-IFS and exchange rate regime (EXRATE) is from Reinhart and Rogoff (2003). Firm-level market data are from Datastream. Firm financial characteristics and ACQUALITY are from Worldscope. ADR information is from the Bank of NY (BONY) website. Industry dummy variables are included in all models. z-statistic is in parenthesis. ** and * indicate significant at the 5 percent and 10 percent level, respectively.
INTERCEPT .-9.30** (-11.55)
-9.16** (-11.28)
-9.26** (-11.40)
LGDPPC 0.09 (1.01)
0.13 (1.44)
0.07 (0.78)
EXRATE 0.00 (0.01)
-0.01 (-0.11)
0.01 (0.18)
MKTCAPGDP -0.01** (-6.58)
-0.01** (-6.26)
-0.01** (-6.89)
DYIELD 0.00 (0.44)
0.01 (0.69)
0.00 (0.48)
TDTCAP -0.01** (-2.32)
-0.00* (-1.96)
-0.00** (-2.17)
TRETURN -0.00** (-3.49)
-0.00** (-3.65)
-0.00** (-3.55)
ROE 0.00 (0.22)
0.00 (0.14)
0.00 (0.22)
PB 0.12** (4.00)
0.12** (3.97)
0.12** (4.07)
LASSETS 0.64** (17.07)
0.59** (17.07)
0.64** (16.92)
NANALYSTS 0.14** (9.35)
0.13** (9.07)
0.13** (9.16)
ADRLIST - 1.02** (2.92) -
ADRUNLIST - 0.69** (4.36) -
ACQUALITY - - 0.10* (1.64)
Industry Dummies included included included
N 2721 2721 2696
WALD 520 538 527
Pseudo R2 0.29 0.30 0.29
Log Likelihood -1288 -1288 -1278
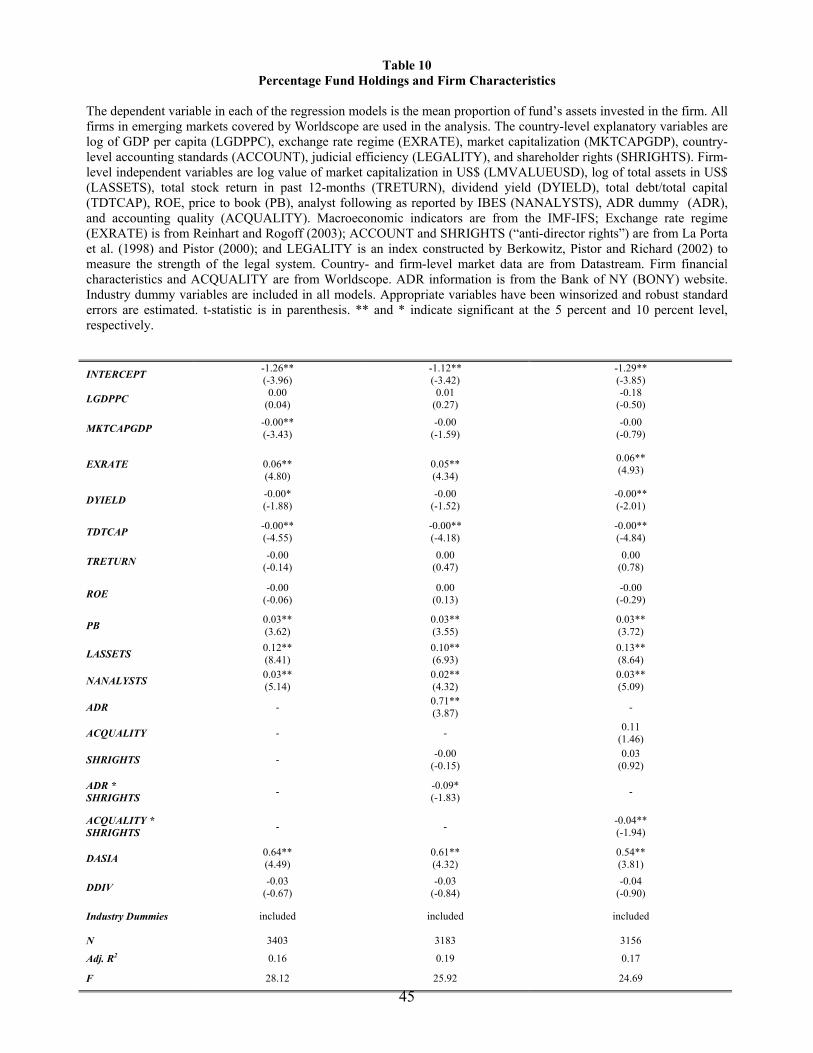
45
Table 10 Percentage Fund Holdings and Firm Characteristics
The dependent variable in each of the regression models is the mean proportion of fund’s assets invested in the firm. All firms in emerging markets covered by Worldscope are used in the analysis. The country-level explanatory variables are log of GDP per capita (LGDPPC), exchange rate regime (EXRATE), market capitalization (MKTCAPGDP), country-level accounting standards (ACCOUNT), judicial efficiency (LEGALITY), and shareholder rights (SHRIGHTS). Firm-level independent variables are log value of market capitalization in US$ (LMVALUEUSD), log of total assets in US$ (LASSETS), total stock return in past 12-months (TRETURN), dividend yield (DYIELD), total debt/total capital (TDTCAP), ROE, price to book (PB), analyst following as reported by IBES (NANALYSTS), ADR dummy (ADR), and accounting quality (ACQUALITY). Macroeconomic indicators are from the IMF-IFS; Exchange rate regime (EXRATE) is from Reinhart and Rogoff (2003); ACCOUNT and SHRIGHTS (“anti-director rights”) are from La Porta et al. (1998) and Pistor (2000); and LEGALITY is an index constructed by Berkowitz, Pistor and Richard (2002) to measure the strength of the legal system. Country- and firm-level market data are from Datastream. Firm financial characteristics and ACQUALITY are from Worldscope. ADR information is from the Bank of NY (BONY) website. Industry dummy variables are included in all models. Appropriate variables have been winsorized and robust standard errors are estimated. t-statistic is in parenthesis. ** and * indicate significant at the 5 percent and 10 percent level, respectively.
INTERCEPT -1.26** (-3.96)
-1.12** (-3.42)
-1.29** (-3.85)
LGDPPC 0.00 (0.04)
0.01 (0.27)
-0.18 (-0.50)
MKTCAPGDP -0.00** (-3.43)
-0.00 (-1.59)
-0.00 (-0.79)
EXRATE
0.06** (4.80)
0.05** (4.34)
0.06** (4.93)
DYIELD -0.00* (-1.88)
-0.00 (-1.52)
-0.00** (-2.01)
TDTCAP -0.00** (-4.55)
-0.00** (-4.18)
-0.00** (-4.84)
TRETURN -0.00 (-0.14)
0.00 (0.47)
0.00 (0.78)
ROE -0.00 (-0.06)
0.00 (0.13)
-0.00 (-0.29)
PB 0.03** (3.62)
0.03** (3.55)
0.03** (3.72)
LASSETS 0.12** (8.41)
0.10** (6.93)
0.13** (8.64)
NANALYSTS 0.03** (5.14)
0.02** (4.32)
0.03** (5.09)
ADR - 0.71** (3.87) -
ACQUALITY - - 0.11 (1.46)
SHRIGHTS - -0.00 (-0.15)
0.03 (0.92)
ADR * SHRIGHTS - -0.09*
(-1.83) -
ACQUALITY * SHRIGHTS - - -0.04**
(-1.94)
DASIA 0.64** (4.49)
0.61** (4.32)
0.54** (3.81)
DDIV -0.03 (-0.67)
-0.03 (-0.84)
-0.04 (-0.90)
Industry Dummies included included included
N 3403 3183 3156
Adj. R2 0.16 0.19 0.17
F 28.12 25.92 24.69
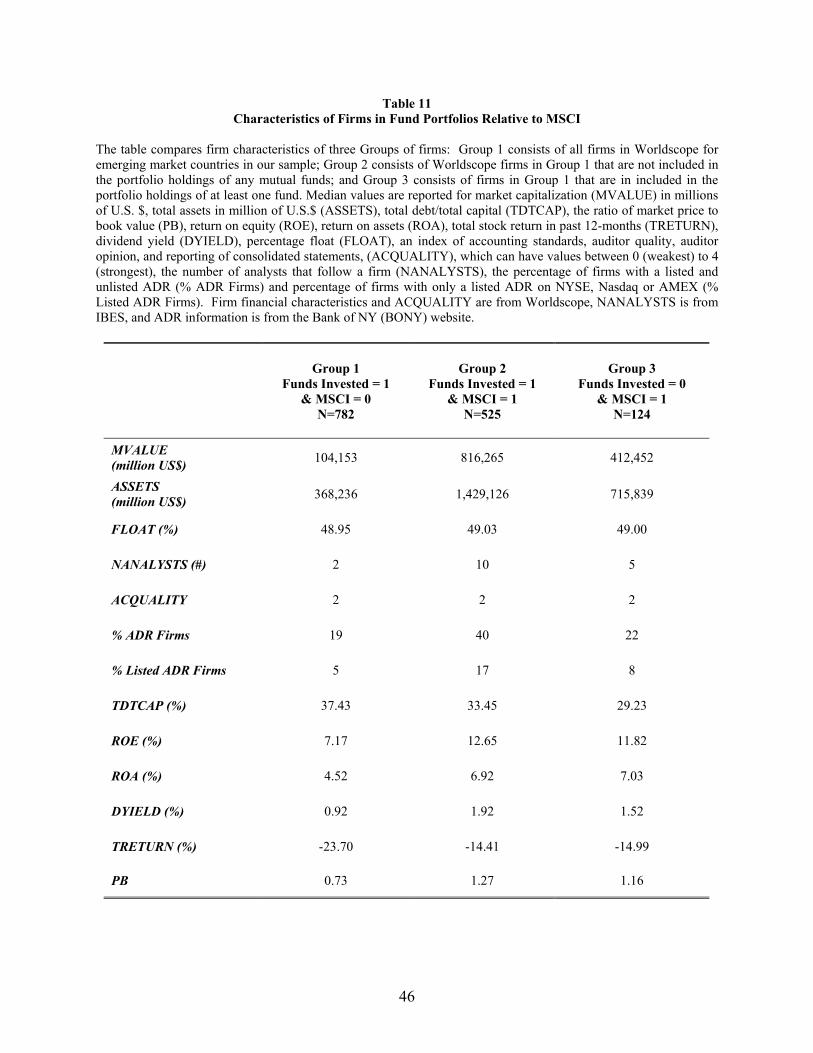
46
Table 11 Characteristics of Firms in Fund Portfolios Relative to MSCI
The table compares firm characteristics of three Groups of firms: Group 1 consists of all firms in Worldscope for emerging market countries in our sample; Group 2 consists of Worldscope firms in Group 1 that are not included in the portfolio holdings of any mutual funds; and Group 3 consists of firms in Group 1 that are in included in the portfolio holdings of at least one fund. Median values are reported for market capitalization (MVALUE) in millions of U.S. $, total assets in million of U.S.$ (ASSETS), total debt/total capital (TDTCAP), the ratio of market price to book value (PB), return on equity (ROE), return on assets (ROA), total stock return in past 12-months (TRETURN), dividend yield (DYIELD), percentage float (FLOAT), an index of accounting standards, auditor quality, auditor opinion, and reporting of consolidated statements, (ACQUALITY), which can have values between 0 (weakest) to 4 (strongest), the number of analysts that follow a firm (NANALYSTS), the percentage of firms with a listed and unlisted ADR (% ADR Firms) and percentage of firms with only a listed ADR on NYSE, Nasdaq or AMEX (% Listed ADR Firms). Firm financial characteristics and ACQUALITY are from Worldscope, NANALYSTS is from IBES, and ADR information is from the Bank of NY (BONY) website.
Group 1 Funds Invested = 1
& MSCI = 0 N=782
Group 2 Funds Invested = 1
& MSCI = 1 N=525
Group 3 Funds Invested = 0
& MSCI = 1 N=124
MVALUE (million US$) 104,153 816,265 412,452
ASSETS (million US$) 368,236 1,429,126 715,839
FLOAT (%) 48.95 49.03 49.00
NANALYSTS (#) 2 10 5
ACQUALITY 2 2 2
% ADR Firms 19 40 22
% Listed ADR Firms 5 17 8
TDTCAP (%) 37.43 33.45 29.23
ROE (%) 7.17 12.65 11.82
ROA (%) 4.52 6.92 7.03
DYIELD (%) 0.92 1.92 1.52
TRETURN (%) -23.70 -14.41 -14.99
PB 0.73 1.27 1.16
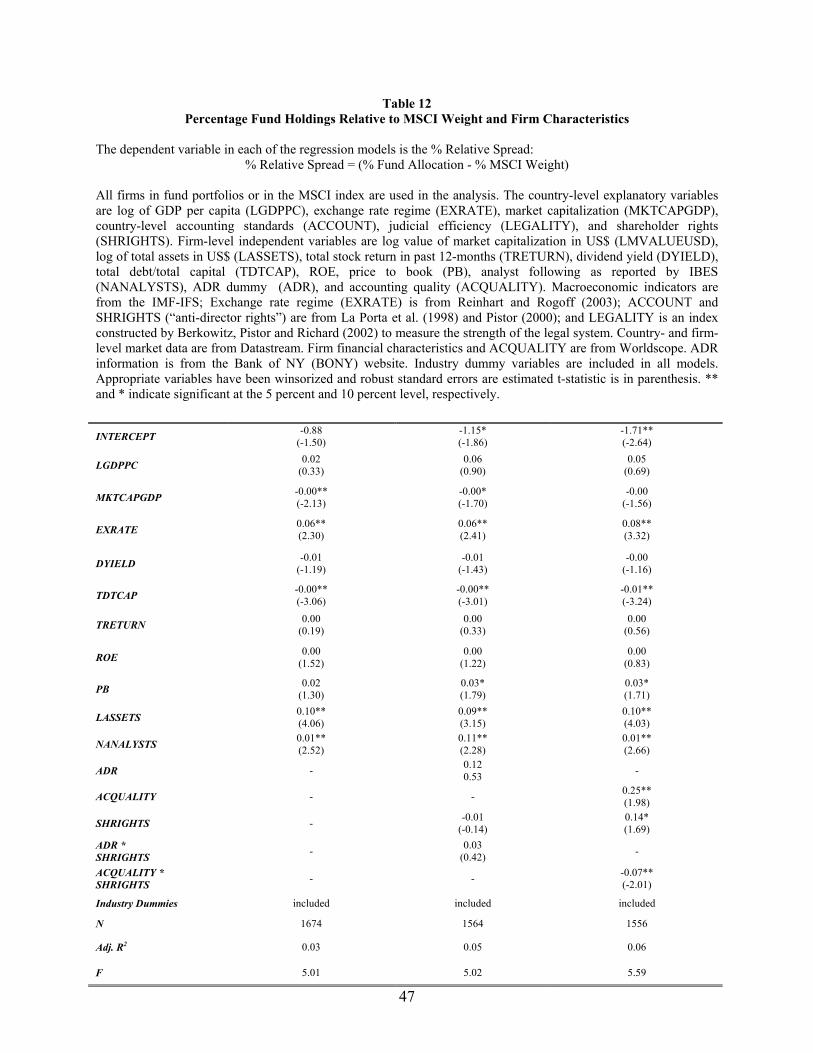
47
Table 12 Percentage Fund Holdings Relative to MSCI Weight and Firm Characteristics
The dependent variable in each of the regression models is the % Relative Spread:
% Relative Spread = (% Fund Allocation - % MSCI Weight)
All firms in fund portfolios or in the MSCI index are used in the analysis. The country-level explanatory variables are log of GDP per capita (LGDPPC), exchange rate regime (EXRATE), market capitalization (MKTCAPGDP), country-level accounting standards (ACCOUNT), judicial efficiency (LEGALITY), and shareholder rights (SHRIGHTS). Firm-level independent variables are log value of market capitalization in US$ (LMVALUEUSD), log of total assets in US$ (LASSETS), total stock return in past 12-months (TRETURN), dividend yield (DYIELD), total debt/total capital (TDTCAP), ROE, price to book (PB), analyst following as reported by IBES (NANALYSTS), ADR dummy (ADR), and accounting quality (ACQUALITY). Macroeconomic indicators are from the IMF-IFS; Exchange rate regime (EXRATE) is from Reinhart and Rogoff (2003); ACCOUNT and SHRIGHTS (“anti-director rights”) are from La Porta et al. (1998) and Pistor (2000); and LEGALITY is an index constructed by Berkowitz, Pistor and Richard (2002) to measure the strength of the legal system. Country- and firm-level market data are from Datastream. Firm financial characteristics and ACQUALITY are from Worldscope. ADR information is from the Bank of NY (BONY) website. Industry dummy variables are included in all models. Appropriate variables have been winsorized and robust standard errors are estimated t-statistic is in parenthesis. ** and * indicate significant at the 5 percent and 10 percent level, respectively. INTERCEPT -0.88
(-1.50) -1.15* (-1.86)
-1.71** (-2.64)
LGDPPC 0.02 (0.33)
0.06 (0.90)
0.05 (0.69)
MKTCAPGDP -0.00** (-2.13)
-0.00* (-1.70)
-0.00 (-1.56)
EXRATE 0.06** (2.30)
0.06** (2.41)
0.08** (3.32)
DYIELD -0.01 (-1.19)
-0.01 (-1.43)
-0.00 (-1.16)
TDTCAP -0.00** (-3.06)
-0.00** (-3.01)
-0.01** (-3.24)
TRETURN 0.00 (0.19)
0.00 (0.33)
0.00 (0.56)
ROE 0.00 (1.52)
0.00 (1.22)
0.00 (0.83)
PB 0.02 (1.30)
0.03* (1.79)
0.03* (1.71)
LASSETS 0.10** (4.06)
0.09** (3.15)
0.10** (4.03)
NANALYSTS 0.01** (2.52)
0.11** (2.28)
0.01** (2.66)
ADR - 0.12 0.53 -
ACQUALITY - - 0.25** (1.98)
SHRIGHTS - -0.01 (-0.14)
0.14* (1.69)
ADR * SHRIGHTS - 0.03
(0.42) -
ACQUALITY * SHRIGHTS - - -0.07**
(-2.01)
Industry Dummies included included included
N 1674 1564 1556
Adj. R2 0.03 0.05 0.06
F 5.01 5.02 5.59