portfolio recover assoc (praa) pitch (oct 2011)
TRANSCRIPT
(PRAA)
October 2011 Update

Key Stats 2008 2009 2010 2011E 2012
Revenue 263m 281m 373m 472m 574m Y/Y %Chg 19% 7% 33% 27% 22%
Amortization Rate 36.8% 41.4% 41.5% 40.9% 40.9%
Oper. Mar. 32.2% 28.7% 34.8% 39.1% 41.4% Net Income 45m 44m 74m 105m 139m
Y/Y %Chg -6% -2% 67% 42% 33% EPS $2.96 $2.87 $4.34 $6.03 $7.96
Debt
Purchases 279m 289m 362m 390m 371m
Current Price: $66.66
Market Cap: $1.16BN
6M Price Target: $85.00
(14x FY2011 EPS)
Upside 27.5%
Figure 1: Stock Price & Volume Figure 2: Market Profile
Current Price $66.66
Shares Outstanding (mm) 17.2
Market Capitalization (mm) $1,162.1
Beta 1.45
52 Week Price Range 56.76 - 90.95
Avg. Volume - 3 mo (mm) 0.14
Float 16.75M
Institutional Holding 108.20%
Insider Holding 2.60%
Short Interest 18.8%
Tangible Book Value/Share $27.15
Return on Equity 17.58%
P/E (diluted) 13.03x
Source: Yahoo Finance Source: Yahoo Finance
0.0mm
0.5mm
1.0mm
1.5mm
2.0mm
2.5mm
$50.00
$55.00
$60.00
$65.00
$70.00
$75.00
$80.00
$85.00
$90.00
$95.00
$100.00
Jan
-10
Feb
-10
Mar
-10
Ap
r-1
0
May
-10
Jun
-10
Jul-
10
Au
g-1
0
Sep
-10
Oct
-10
Oct
-10
No
v-1
0
De
c-1
0
Jan
-11
Feb
-11
Mar
-11
Ap
r-1
1
$2.83/Share through Q2
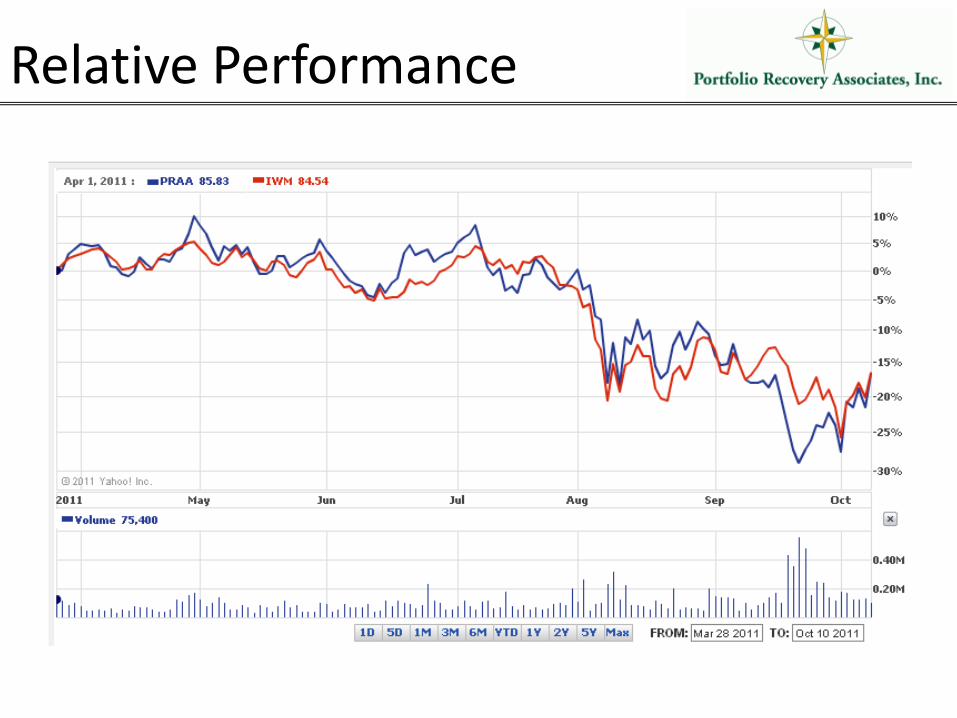
Relative Performance
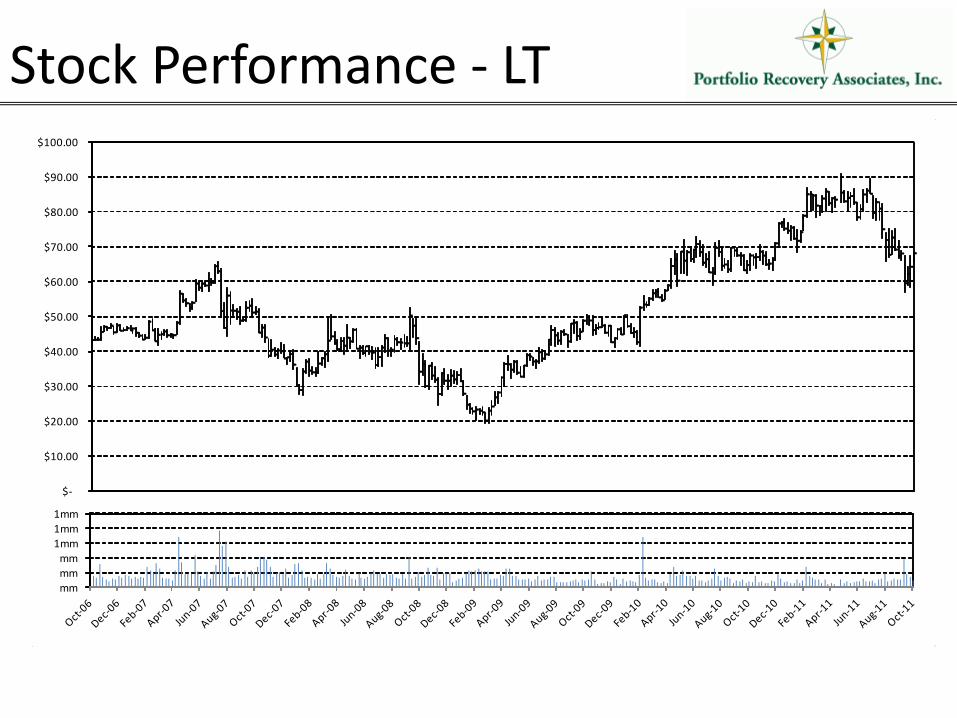
Stock Performance - LT 23.92
24.56
24.37
25.71
26.67
28.88
30.88
29.21
28.78
27.45
24.06
23.82
$-
$10.00
$20.00
$30.00
$40.00
$50.00
$60.00
$70.00
$80.00
$90.00
$100.00
mm
mm
mm
1mm
1mm
1mm

Non-Farm Payrolls (m/m % chg)
(USMMMNCH)

Personal Income (Y/Y)
(PITLYOY) Growing at a healthy clip again

Total Consumer Credit Outstanding
(CCOSTOT) Positive trend for debt buyers

Household Debt Growth
(DEGRHHLD) Good for near term payment, but a
concern for longer term growth. I have thus revised
my growth estimates down over the long-term.

Company Summary

Business Lines • Core Business (87%)
– Non-Bankruptcy
– Bankruptcy
• Non-Core Business (13%) – Collateral Location
– Government Service
– Class Action Claims Recovery
• Collections – Call Center (37%)
– Purchased Bankruptcy (39%)
– Internal Legal (9%)
– External Legal (15%)
0
50,000
100,000
150,000
200,000
250,000 Collections Mix
Call Center Collections Purchased Bankruptcy Collections Internal Legal Collections External Legal Collections

Debt Purchases
$0
$50,000
$100,000
$150,000
$200,000
$250,000
$300,000
$350,000
$400,000
$450,000
Total Debt Purchases
Non Bankruptcy Purchases Bankruptcy Purchases
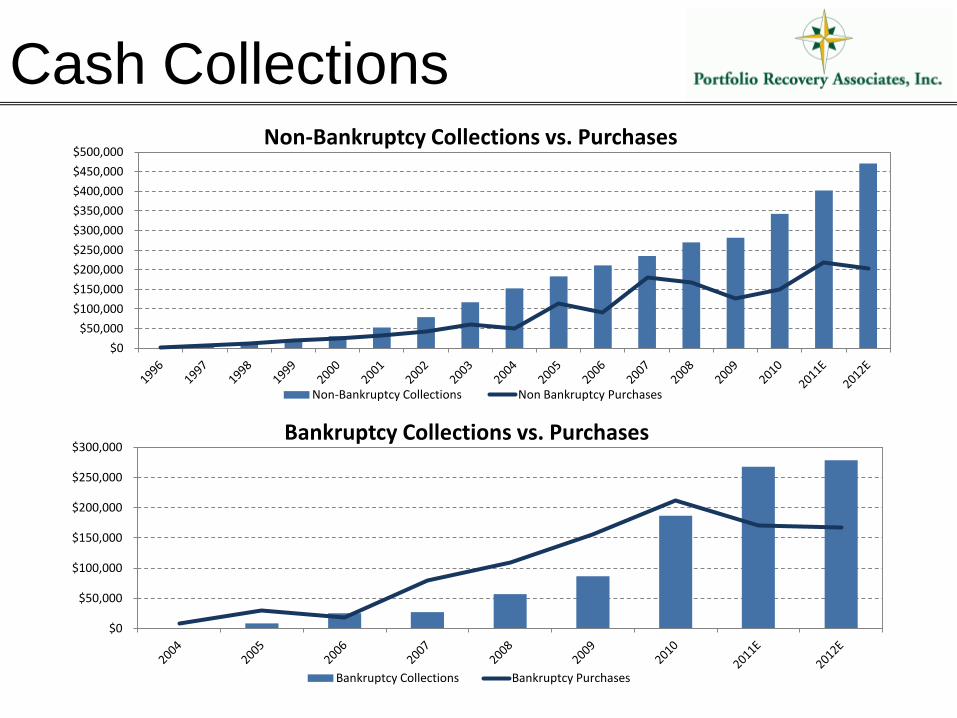
Cash Collections
$0
$50,000
$100,000
$150,000
$200,000
$250,000
$300,000
$350,000
$400,000
$450,000
$500,000 Non-Bankruptcy Collections vs. Purchases
Non-Bankruptcy Collections Non Bankruptcy Purchases
$0
$50,000
$100,000
$150,000
$200,000
$250,000
$300,000 Bankruptcy Collections vs. Purchases
Bankruptcy Collections Bankruptcy Purchases

• Integrated Business – collect own accounts
– Better control over entire process, compliance
– Capture profits that would otherwise go to outsource provider
– Better integration of collection results & underwriting models
– Growing in-house Legal Collections Department
• Low Cost Operations, Conservative Balance Sheet
– Actively seek out low cost labor and real estate markets
– Very disciplined purchase of debt and use of line of credit
– Pricing confidence from 14 tears and over 1,850 pools of data
– Track record of conservative pricing bias
• Accounts are not re-sold
– Many competitors try to quickly squeeze some value out of accounts before re-selling them. PRAA works accounts over a MUCH longer time span.
Differentiated From Competitors

• US Locations
– Hutchinson, Kansas (Premier Location)
– Jackson, Tennessee (91%)
– Norfolk, Virginia (88%)
– Hampton, Virginia (87%)
– Birmingham, Alabama (81%)
• International Locations
– Philippines (47%)
– Panama City (Newly Opened)
• Productivity up at ALL centers
• Continued Investment in Operational Efficiency & Automation
– Made 38% more calls in Q4 2010 vs. 2009
– Able to profitably work accounts with lower balances and lower scores
– Accounts are re-scored EVERY night
Call Centers

Key Stats

Historical P/E

Valuation 2010E 2011E 2012E 2011 Upside 2012 Upside
$4.34 $6.03 $7.96
P/E 15.4 11.1 8.4
20 $ 86.82 $ 120.61 $ 159.17 80.9% 138.8%
19.5 $ 84.65 $ 117.60 $ 155.19 76.4% 132.8%
19 $ 82.48 $ 114.58 $ 151.21 71.9% 126.8%
18.5 $ 80.31 $ 111.57 $ 147.23 67.4% 120.9%
18 $ 78.14 $ 108.55 $ 143.25 62.8% 114.9%
17.5 $ 75.97 $ 105.54 $ 139.28 58.3% 108.9%
17 $ 73.80 $ 102.52 $ 135.30 53.8% 103.0%
16.5 $ 71.63 $ 99.50 $ 131.32 49.3% 97.0%
16 $ 69.46 $ 96.49 $ 127.34 44.7% 91.0%
15.5 $ 67.29 $ 93.47 $ 123.36 40.2% 85.1%
15 $ 65.12 $ 90.46 $ 119.38 35.7% 79.1%
14.5 $ 62.94 $ 87.44 $ 115.40 31.2% 73.1%
14 $ 60.77 $ 84.43 $ 111.42 26.7% 67.1%
13.5 $ 58.60 $ 81.41 $ 107.44 22.1% 61.2%
13 $ 56.43 $ 78.40 $ 103.46 17.6% 55.2%
12.5 $ 54.26 $ 75.38 $ 99.48 13.1% 49.2%
12 $ 52.09 $ 72.37 $ 95.50 8.6% 43.3%
11.5 $ 49.92 $ 69.35 $ 91.52 4.0% 37.3%
11 $ 47.75 $ 66.34 $ 87.54 -0.5% 31.3%

Valuation FY 2011 FY 2012 FY 2013 FY 2014 FY 2015 Terminal Value
EBIT $ 184,569 $ 237,838 $ 273,514 $ 300,865 $ 315,909
Less Taxes (68,798) (88,214) (105,987) (116,585) (122,415)
Plus Depr. 301,707 368,448 375,817 368,300 360,934
Less CapEx (390,179) (370,670) (363,257) (355,992) (348,872)
Less Change in WC
Free Cash Flow 27,299 147,402 180,087 196,589 205,556
NPV $ 24,598 $ 119,678 $ 131,749 $ 129,592 $ 122,098 $ 1,575,948
DCF $ 2,103,663
Terminal Growth Rate 3.00% Less Debt (463,153)
WACC 10.98% Plus Cash 25,481
Risk Free Rate 2.15% Equity Value $ 1,665,991
Risk Premium 9.01% Diluted Shares 17,225
Beta
1.16 Price/Share $ 96.72
Upside to Current 45.09%

• Double Dip Recession
– Looking less likely all the time, but important to monitor
• Massive influx of competitors / Material Rise in Debt Pricing
– Company has shown strong discipline in the past by reducing purchasing when prices rise beyond acceptable levels, but this would impact revenues over the next few years
• Long Term Reduction in Consumer Debt Levels
• My greatest concern over the next 5 years. Should not impact company over the next 2 years, but this will likely hurt long-run profitability.
• Major Changes to US Debt Collection and/or Bankruptcy Law
– Unlikely to occur near term given current political environment. PRAA has also always been a leader within the industry in terms of regulatory compliance
• Major Changes to Credit Facility
– Just expanded credit facility from $365mm to $407.5mm in Q4 @ LIBOR +275, maturing in December 2014. Currently using $300mm.
Risk Factors