portsmouth harbor response initiative coastal response ... · • information...
TRANSCRIPT

1
Welcome Participants!
Portsmouth Harbor Response Initiative
Coastal Response Research Center June 27, 2007

2
Coastal Response Research Center (CRRC) Staff
• Co-Directors:• UNH – Nancy Kinner• NOAA – Amy Merten
• Research Scientist: Kimberly Newman• Program Coordinator: Kathy Mandsager• Program Assistant: Laurie Lalish

3
Packet Contents
• Agenda• Participant List• CRRC 2006 Annual Report• CRRC Information Sheet• Other Center Information Sheets
• Other Materials Available:• CRRC Projects Information Sheets

4
Logistics
• Bathrooms• Fire Exits• “Help Desk”• Parking• Lunch• CRRC Website www.crrc.unh.edu

5
Overall CRRC Mission
• Develop new approaches to spill response and restoration through research/synthesis of information
• Serve as a resource for ORR and NOAA• Serve as a hub for spill research,
development, and technical transfer• Oil spill community (e.g., national, international)
6
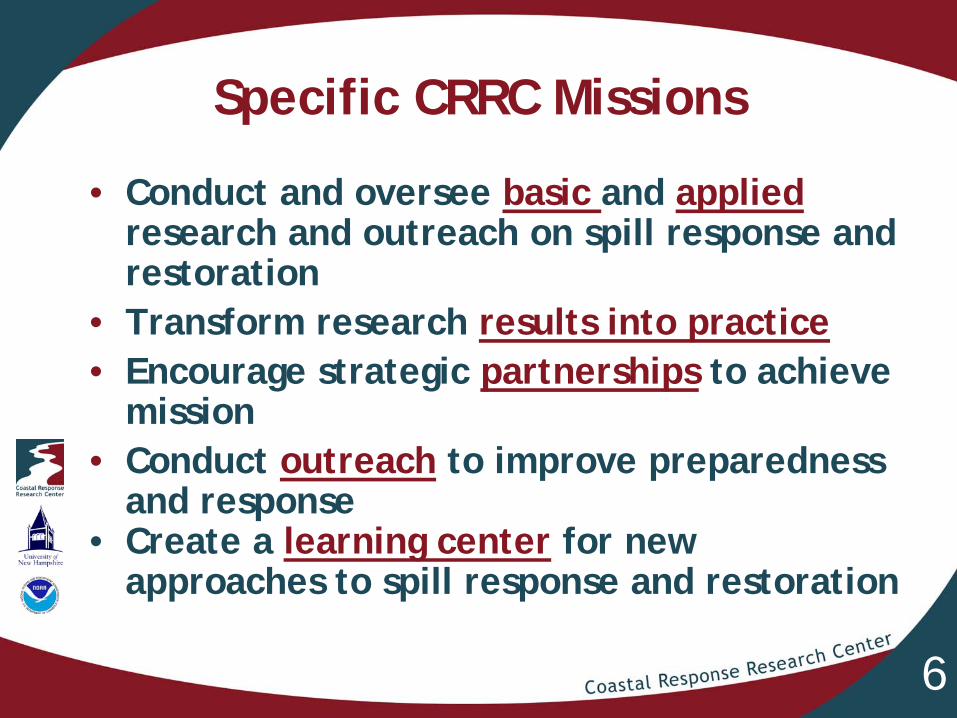
Specific CRRC Missions
• Conduct and oversee basic and applied research and outreach on spill response and restoration
• Transform research results into practice• Encourage strategic partnerships to achieve
mission• Conduct outreach to improve preparedness
and response• Create a learning center for new
approaches to spill response and restoration

7
Specific CRRC Missions: Portsmouth Harbor Response Initiative
• Transform research results into practice
• Encourage strategic partnerships to achieve mission
• Conduct outreach to improve preparedness and response

8
Genesis of Initiative

9
Portsmouth Harbor Response Initiative
• Web-Based GIS platform• “One Stop” Source of Information• Easy to Use, Fast, Flexible• Uses:
• Response• Damage Assessment and Restoration• Tabletop Exercises and Planning
• Example of Integrated Data Management to Solve Coastal Problems

10
Why Portsmouth Harbor?
• Oil/Chemical Activity• National Estuarine Research Reserve Site
and Socioeconomic Interests• UNH Marine Program Long-Term Research
Activity• Two States Involved / Cooperative• Local Cooperation Strong
• Piscataqua River Cooperative• Active / Cooperative Regional Response
Team

11
Today’s Meeting
• Gather Potential Users• Introduce Platform Concept to Users• Show Example of Platform Potential
Content• Gather User Feedback• Form “Working Group” to Decide Platform
Content / Features

12
Portsmouth Harbor Response Initiative - Background
1. Data Collaborative – UNH Complex Systems Research Center
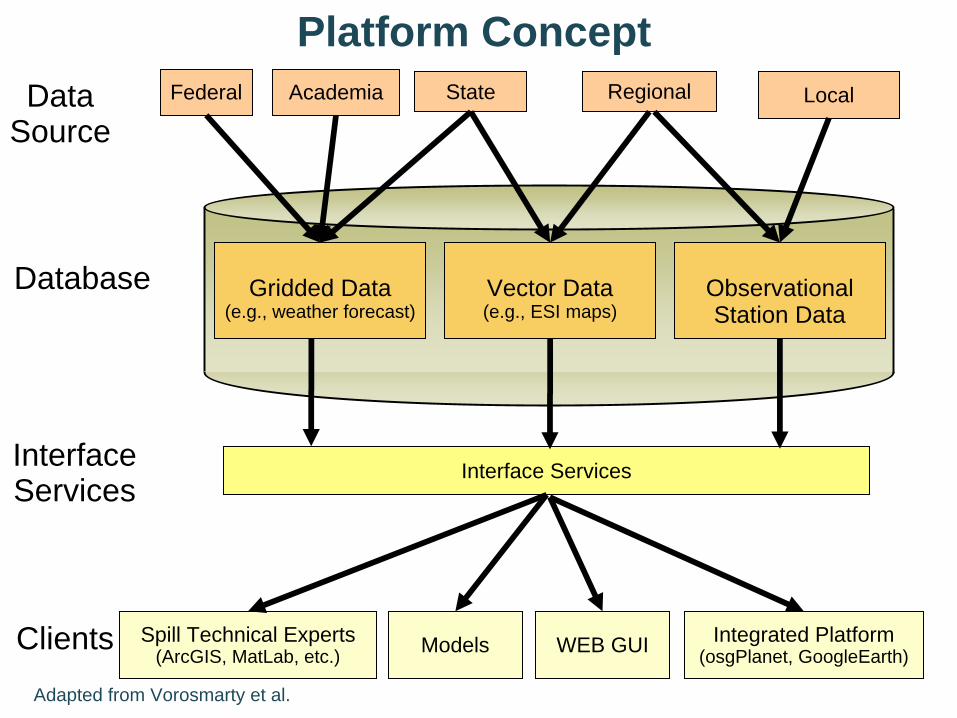
• Regional scale data integration and delivery• Real-time and static data sets• High impact visualization• High resolution• Fast and flexible zoom feature

Database
Interface Services
Interface Services
Vector Data(e.g., ESI maps)
Observational Station Data
Clients Spill Technical Experts (ArcGIS, MatLab, etc.) WEB GUI Integrated Platform
(osgPlanet, GoogleEarth)
DataSource
Federal Academia State LocalRegional
Models
Adapted from Vorosmarty et al.
Gridded Data (e.g., weather forecast)
Platform Concept

14
Portsmouth Harbor Response Initiative - Background
2. Integrated Modeling Workshop – Fall 2006• Response framework• Modeling/assessment framework
• Connect time and length scales• Connect physical, chemical and biological
parameters• Improve decision making across time scales

15
Incident Occurs
Situation Update
Natural Recovery
Incident Command & Stakeholders
Scientific SupportRisk AssessmentOption Tradoffs
Objectives & Environmental
Goals
Response SystemPlanningLogisticsResponse
Monitoring,Injury and Damage
Assessment
Environmental End Point
ManagementOptions
Spill Response Process

16
Continuum of “Response” for Natural and Technological Disasters
• Multiple stakeholders and resources• Information management/information sharing:
visualization and transparency• Complexity of datasets/data needs• Seamless across time scales• Fast and flexible• Ability to build complete picture to improve future
response
Response(24 hours)
Restoration - Recovery(Years to Decades)

17
Continuum of “Response” for Natural and Technological Disasters
• Factors that affect recovery endpoints:• Response times, efficiencies in decision-making,
and response options• Habitat and community resiliencies• Environmental controls, including other stressors
Response(24 hours)
Restoration - Recovery(Years to Decades)

18
Can we use state-of-the-art technologies to speed the time from spill incident to
response decision making?
Database
Interface Services
Interface Services
Vector Data(e.g., ESI maps)
Observational Station Data
Clients Spill Technical Experts (ArcGIS, MatLab, etc.) WEB GUI Integrated Platform
(osgPlanet, GoogleEarth)
DataSource
Federal Academia State LocalRegional
Models
Adapted from Vorosmarty et al.
Gridded Data (e.g., weather forecast)
Platform Concept

20
Portsmouth Harbor Response Initiative - Background
3. UNH – NOAA Centers Working to Collectively Solve Common Management Challenge
• Can we apply the ‘data collaborative’ technology to improve response capabilities?
• Use Portsmouth Harbor as a test case • Data-rich• Critical mass of capabilities UNH – NOAA Centers

• Coastal Ocean Observing Center
• Joint Hydrographic Center
• CICEET• Coastal Response Research Center
• NOAA Marine Modeling and Analysis Programs
• Atlantic Marine Aquaculture Center• Northeast Consortium
• Large Pelagics Center
• UNH Environmental Data Systems Collaborative
• NOAA Regional Coastal Management
• Center for Sponsored Coastal Ocean Research—Coastal Ocean Program
• NOAA Coastal Management Leadership
• Targeted Wind Sensing• Global Wind Demonstration• AIRMAP
EARTH-OCEAN OBSERVING
ECOSYSTEM MANAGEMENT & PROTECTION
• Northeast Center for Atmospheric Science and Policy
Regional(Gulf of Maine)
Global/National
Regional(Gulf of Maine)
Global/National
• Sea Grant
• SWATH
PROGRAM ALIGNMENT WITH NOAA STRATEGIC PLANS
• Joint Center for Ocean Observing Technology

22
Spill Response Process
Incident Occurs
Situation Update
Natural Recovery
Incident Command & Stakeholders
Scientific SupportRisk AssessmentOption Tradoffs
Objectives & Environmental
Goals
Response SystemPlanningLogisticsResponse
Monitoring,Injury and Damage
Assessment
Environmental End Point
ManagementOptions

23

24
Baseline Environmental Info (Georeferenced)
Static & Real-TimePhysicalChemicalBiological
Information Needs: Potential Sources:Electronic nautical charts CCOM/JHC
Bathymetric data CCOM/JHC
Coastal/ocean observations NowCOAST, COOA, CICEET
Environmental Sensitivity Index data
NOAA OR&R
Weather conditions NOAA Weather, NowCOAST
Regionally specific info States agencies, NOAA Weather,GOM Ocean Data Partnership, NERACOOS
Vessel traffic data CCOM/JHC, NowCOAST

25
Spill Incident InfoVolume & Chemistry of SpillHydrodynamic and Shoreline DataResources at Risk
Information Needs: Potential Sources:Incident specifics State agencies, USCG
Environmental Sensitivity Index data
NOAA OR&R
Community vulnerability info NOAA CSC
Coastal/ocean observations NowCOAST, COOA, CICEET, NERACOOS
Scientific support NOAA OR&R, EPA
Coastal infrastructure at risk Municipal officials/planners

26
Information Needs: Potential Sources:Incident specifics State agencies, USCG
Environmental Sensitivity Index data
NOAA OR&R
Coastal/ocean observations NowCOAST, COOA, CICEET, NERACOOS
Data management NOAA OR&R, COOA, EDSC, GOM Ocean Data Partnership
Mapping & visualization tools NOAA CSC, COOA, CCOM/JHC, NOAA OR&R, NowCOAST, RCC, EDSC, CRRC

27
Information Needs: Potential Sources:Incident specifics State agencies, USCG
Environmental Sensitivity Index data
NOAA OR&R
Real-time site-specific data NowCOAST, CCOM/JHC, COOA, CICEET, NOAA CSC
Scientific support CRRC, NOAA OR&R

28
Potential Sources:NOAA OR&R
COOA
EDSC
RCC
NowCOAST
RARGOM

29
Outcomes for Today
• Develop user-designed concept of a response visualization, data sharing, decision-making platform
• Define possible uses• Define data needs and identify datasets• Define/refine next steps:
• Work Group participation• Time commitment:
• 3 conference calls between now and December ’07• Roll out product to this group Winter ’07/’08

30
Today’s Activities
• Demonstration – M. Jacobi & B. Braswell• User-Identified Needs• Discussion

33
Portsmouth Harbor Response Initiative
Discussion and Demonstration
34
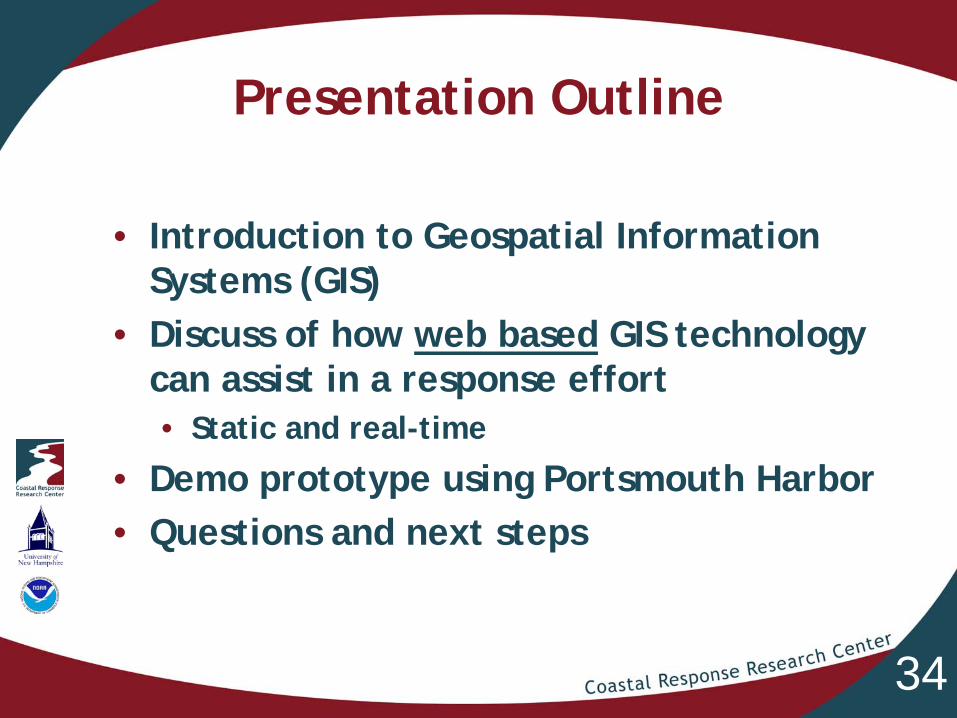
Presentation Outline
• Introduction to Geospatial Information Systems (GIS)
• Discuss of how web based GIS technology can assist in a response effort • Static and real-time
• Demo prototype using Portsmouth Harbor • Questions and next steps
35
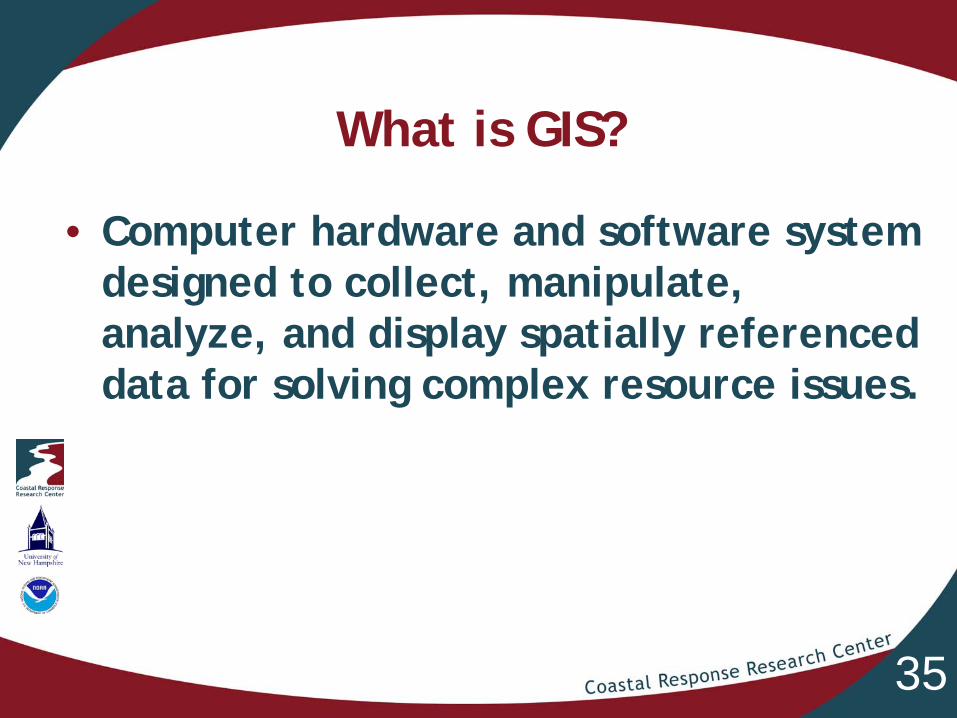
What is GIS?
• Computer hardware and software system designed to collect, manipulate, analyze, and display spatially referenced data for solving complex resource issues.

36
• Diverse datasets can be interlaced on a single map to better visualize a the complex nature of an area
A Picture is Worth a Thousand Words…

37
What Can GIS Do for You?
• By combining data together one can see the full spectrum of an incident and how one piece of data may impact or relate to another.

38
How Has the Technology Advanced?
In the past…• Software and hardware were cost prohibitive• Difficult to obtain accurate data• Advanced training to produce products• Data limited to working desktop computer• Limited product output - hard copy maps

39
How Has the Technology Advanced?
Today…• Increased software options available• Compact and inexpensive data acquisition• Easy to use interfaces• Systems are portable and flexible - network
interface• Products are more complex • Web accessible (ArcIMS, Google Maps, Google Earth)

40
Why Use a Web Based GIS Platform during a Response?
• Integrate and synthesize various types of info• Provide a common operational picture for situation
awareness• Improve communication and coordination among
responders and stakeholders• Visualization of a complex situation
• Provide resource managers with the information they need to make better informed decisions

41
Leveraging Existing Data Resources
• Environmental - contaminant datasets, water quality monitoring sites, protected areas, restoration sites, etc.
• Habitat classifications and species distributions data
• Navigational - electronic navigation charts & scanned paper charts
• Meteorological observations• Models - trajectories/forecasts

42
Functional Web GIS Platform for Response
• Package data in a well-designed management, visualization, and analysis tool:• Easily accessible - field and command • User friendly• Quick to display• Capable of real-time data display• Simple to update/ download from• Secure

43
Spill Incident InfoVolume & Chemistry of SpillHydrodynamic and Shoreline DataResources at Risk

44
Portsmouth Harbor Response Prototype• Designed using readily available software
• Can be programmed to meet a variety of user needs
• Google maps-type interface serves as the base• Familiar and easy to manipulate
• Based on a limited set of easily available data from UNH and NOAA to demonstrate capabilities
To Fully Develop the Prototype,We Need Your Input and Feedback!

45
What Has Been Compiled?
• Library of background data• Base maps - shoreline data, roads, etc.• Imagery• Navigational charts• Bathymetry surveys• Environmental Sensitivity Index (ESI)• Environmental monitoring sites• Weather observation buoys• Restoration sites

46
What Can be Displayed?
• Real-time observations and monitoring data• Observation buoys - What is being collected? • Re-direct to the data source
• Data links to documents and websites • Restoration Project
• Summary PDFs• Websites
• Field data & georeferenced photos• International Coastal Clean-up Surveys
• Specific data marine debris items• Photos collected during survey

47
How Does This Help in Spill Response?
• Hypothetical Spill in Great Bay• Uploaded trajectory - movie display• Where did it hit relative to ESI layer?
-See exact classification or download and print map-View data sources
• Where are the marine protected areas?• Show results of Shoreline Cleanup and
Assessment Team (SCAT) work-Field photo display-Field sheets-SCAT maps and diagrams

48
Environmental Sensitivity Index (ESI) Maps
• Serve as quick references for spill responders and coastal zone managers
• Identify vulnerable coastal locations so protection priorities can be established and cleanup strategies identified• Shorelines color-coded to indicate their sensitivity• Biological resources depicted by shaded polygons and
symbol icons to convey their location and extent• Socio-economic resources are mapped (water intakes,
marinas, and swimming beaches)

49

50
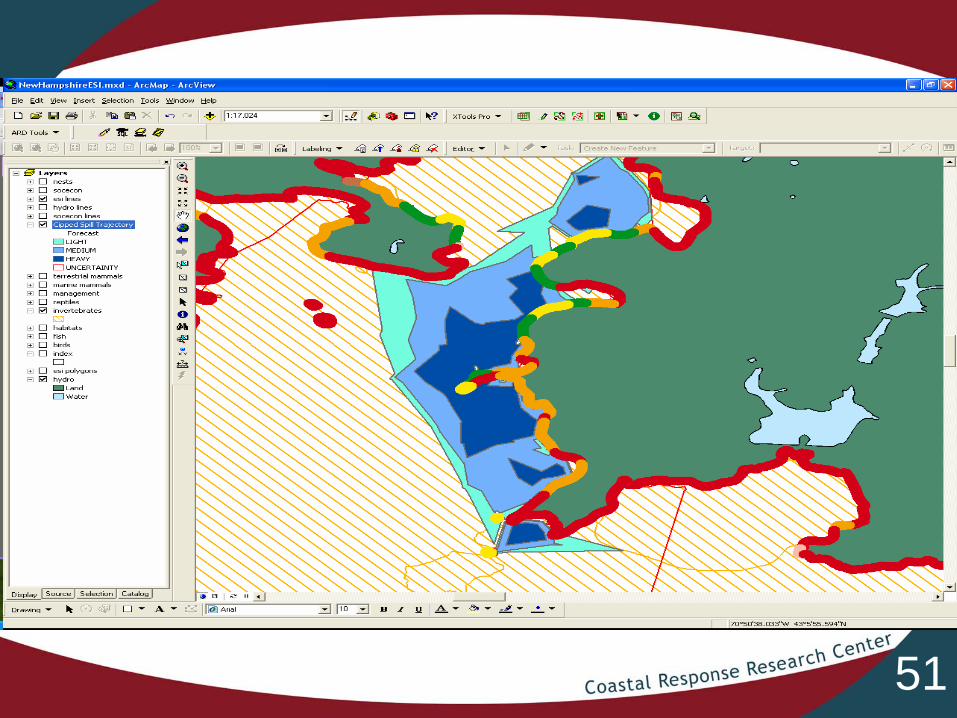
51

52

53

54

55

56

57

58

59

60
How Does This Aid Spill Response?
• Hypothetical Spill in Great Bay• Uploaded trajectory - movie display• Where did it hit relative to ESI layer?
-See exact classification or download and print map• Where are the marine protected areas?• Show results of SCAT
-Field photo display-Field sheets-SCAT maps and diagrams

61
How does this Help in Spill Response?
• Hypothetical spill near Seavey Point• Zoom to point feature• Display or download trajectory map• Open Responder Chart for the area• Visualize spill relative to ship traffic• Gather current weather observations from buoys• Display existing environmental contaminant data

62
• Assist with spill preparedness • Display jurisdictional boundaries, specially
regulated areas, areas of socio-economic importance
• Access points for cleanup• Staging areas and command centers• Regional documentation, points of contact, etc.
Practical Implementation of Portsmouth Harbor Response Prototype

63
• Assist in coordinating response efforts• Visualize magnitude and extent• Triage sites for action• Track progress of clean-up • Access real-time data• Upload data from the field and access forms• Increase communication
Practical Implementation of Portsmouth Harbor Response Prototype

64
• Define the extent of potential impacts• General habitat and land use information• Areas of biological significance - haul outs,
rookeries, nesting grounds, essential or critical habitat
• Species-specific data - biological resources in the region - threatened or endangered?
• Where is there current monitoring data
Practical Implementation of Portsmouth Harbor Response Prototype

65
• Assist in Recovery and Restoration• Access existing environmental monitoring sites• Assist with sampling design• Inventory restoration projects• Locate long-term monitoring sites• Coordinate with regional projects
Practical Implementation of Portsmouth Harbor Response Prototype

66
Discussion
• Develop user-designed concept of a response visualization, data sharing, decision making platform
• Define possible uses• Define data needs and identify datasets

67
www.crrc.unh.edu/workshops/PHRI/index.htm
Access the Prototype Online at: