portugal 2017 oecd economic survey boosting growth and well-being
TRANSCRIPT

OECD ECONOMIC SURVEYOF PORTUGAL 2017
6 February 2017, Lisbon
http://www.oecd.org/eco/surveys/economic-survey-portugal.htm
Boosting growth and well-being

2
The economy is recovering
Source: Calculations based on OECD Economic Outlook: Statistics and Projections (database).
145150155160165170175180185
2000 2002 2004 2006 2008 2010 2012 2014 2016 2018
billion EUR
Real GDP

3
The economy is increasingly more open
0
10
20
30
40
50
60
70
80
90
100
1995 1997 1999 2001 2003 2005 2007 2009 2011 2013 2015 2017
Evolution of exports of goods and services% of GDP
ExportsImportsExports and Imports
Source: OECD (2016), OECD Economic Outlook: Statistics and Projections (database).

4
Competitiveness has improved
Export Performance measures the expansion of a country’s exports relative to the expansion of import demand from its trading partners. Improvements in export performance reflect rising market shares in the imports of trading partners. Source: OECD (2016), OECD Economic Outlook: Statistics and Projections (database).
2000 2001 2002 2003 2004 2005 2006 2007 2008 2009 2010 2011 2012 2013 2014 201560
70
80
90
100
110
120
Export performance Index 2000 = 100
Portugal Germany Italy Spain

5
Unemployment is falling
Unemployment rate, %
Source: OECD (2016), OECD Economic Outlook: Statistics and Projections (database) and Banco de Portugal (2016), “General Statistics”, BPstat (database).
0
5
10
15
20
2010 2011 2012 2013 2014 2015 2016 2017 2018

SOME VULNERABILITIES REMAIN
7
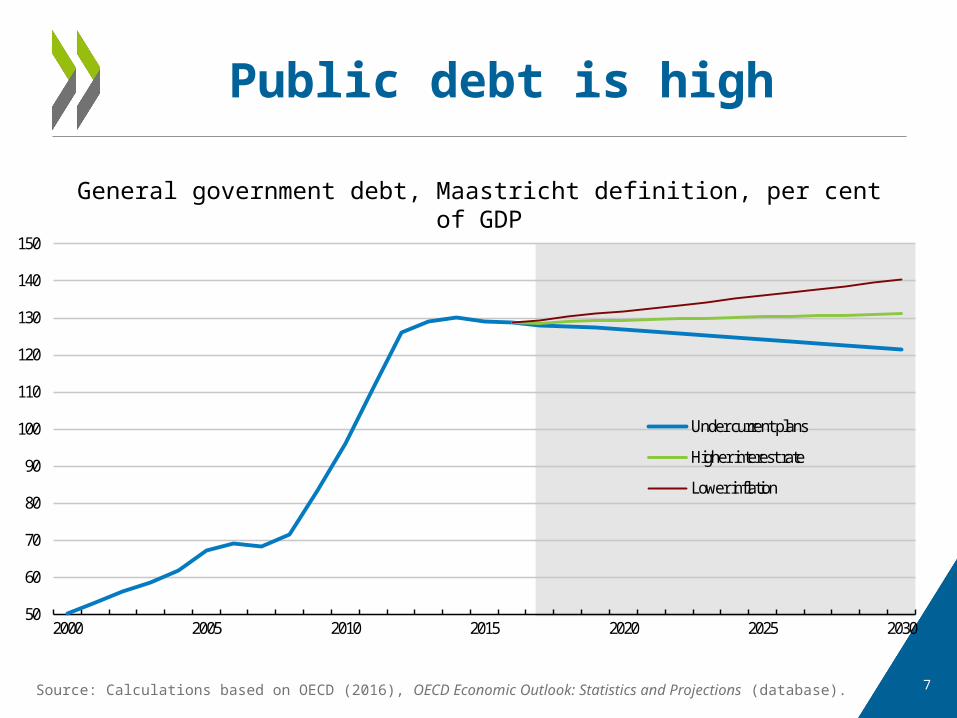
General government debt, Maastricht definition, per cent of GDP
Public debt is high
Source: Calculations based on OECD (2016), OECD Economic Outlook: Statistics and Projections (database).
50
60
70
80
90
100
110
120
130
140
150
2000 2005 2010 2015 2020 2025 2030
Under current plans
Higher interest rate
Lower inflation

8
Corporate debt needs to be brought down
1. The non-financial sector debt presented includes loans, debt securities and trade credits. Household includes non-profit institutions serving households.Source: Banco de Portugal (2016), BPstat Database and ECB (2016), Statistical Data Warehouse, European Central Bank.
70
90
110
130
150
170
190
Private sector debt1% of GDP
Non-financial corporations Households

9
The banking sector remains fragile
KOR
PRT
ITA
ESP
USA
JPN
MEX TU
R
HUN
FRA
GBR PO
L
DEU
CHE
BEL
OEC
D
CZE
SVK
NLD
GRC IR
L
SWE
0
5
10
15
20
25
30
Ratio of capital to risk-weighted assets Per cent, Q2 20161
Regulatory Tier 1 Regulatory
Source: International Monetary Fund, Banco de Portugal and European Central Bank.

10
NPLs as a percentage of total gross loans, Q2 2016
Non-performing loans are high
Source: IMF (2016), Financial Soundness Indicators (FSI Database), International Monetary Fund.
KOR
CHE
GBR
SWE
USA
JPN
DEU
MEX NL
D
TUR
BEL
FRA
POL
SVK
CZE
OEC
D
ESP
HUN
PRT
IRL
ITA
GRC
0
2
4
6
8
10
12
14
16
18
20
22 37

11
Share of non-performing loans, per cent
Corporates represent a high share of NPLs
Source: Banco de Portugal (2016), BPstat Database and ECB (2016), Statistical Data Warehouse, European Central Bank.
0
2
4
6
8
10
12
14
16
18
Non-financial corporations Housing Consumption

12
Investment is weak
Total gross fixed capital formation
40
60
80
100
120
140
160
2000 2002 2004 2006 2008 2010 2012 2014 2016
2000 Q1 = 100
PortugalSpainItalyEuro area¹
1. Euro area countries that are also OECD members (including Latvia).Source: OECD (2016), OECD Economic Outlook: Statistics and Projections (database).
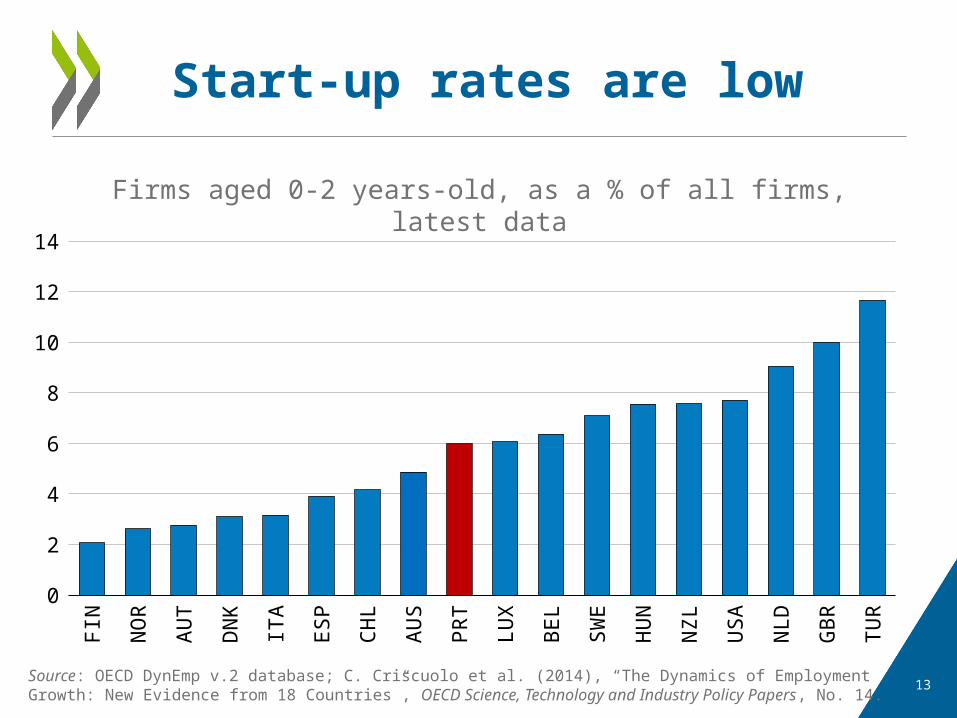
13
Firms aged 0-2 years-old, as a % of all firms, latest data
Start-up rates are low FI
N
NOR
AUT
DNK
ITA
ESP
CHL
AUS
PRT
LUX
BEL
SWE
HUN
NZL
USA
NLD
GBR TU
R
0
2
4
6
8
10
12
14
Source: OECD DynEmp v.2 database; C. Criscuolo et al. (2014), “The Dynamics of Employment Growth: New Evidence from 18 Countries”, OECD Science, Technology and Industry Policy Papers, No. 14.

14
Young firms contribute more to productivity growth
Labour productivity growth Total factor productivity growth -4
-2
0
2
4
6
8
10
12
-4
-2
0
2
4
6
8
10
12
Young Firms Other Firms
Average annual productivity growth, per cent, latest data
Young firms are defined as those aged five years-old or less.Source: OECD calculations based on data from Integrated System of Business Accounts (Sistema Integrado de Contas, SCIE).

15
Access to financing is the biggest obstacle to investment
FIN SVK NLD DEU AUT FRA BEL EA ESP IRL ITA PRT GRC0
1
2
3
4
5
6
7
8Index scale 1-10
Source: ECB (2016), “Survey on the access to finance of enterprises (SAFE)”, Statistical Data Warehouse, European Central Bank.
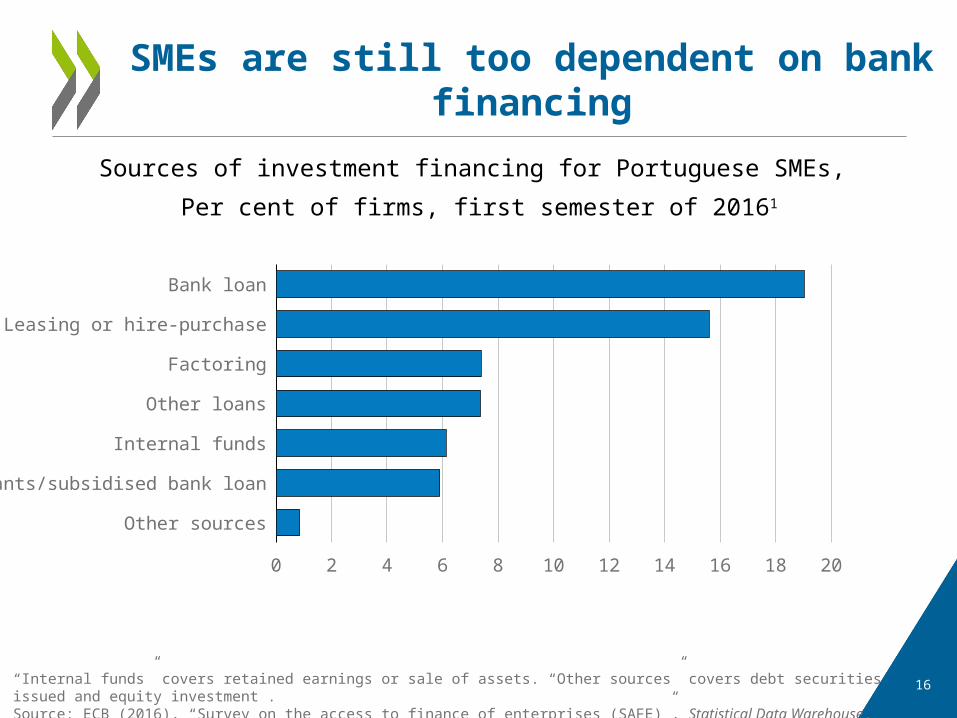
16
Sources of investment financing for Portuguese SMEs, Per cent of firms, first semester of 20161
SMEs are still too dependent on bank financing
“Internal funds” covers retained earnings or sale of assets. “Other sources” covers debt securities issued and equity investment . Source: ECB (2016), “Survey on the access to finance of enterprises (SAFE)”, Statistical Data Warehouse, European Central Bank.
Other sources
Grants/subsidised bank loan
Internal funds
Other loans
Factoring
Leasing or hire-purchase
Bank loan
0 2 4 6 8 10 12 14 16 18 20

17
Additional reforms in the judicial system are crucial
Source: European Commission (2016), The 2016 EU Justice Scoreboard and Direcção-Geral da Política de Justiça.
DN
K
EST
AU
T
POL
HU
N
NLD
SVN
FIN
SWE
CZE
LVA
SVK
ESP
FRA
ITA
PRT
0
200
400
600
800
1000
1200
2010 2014
Days needed to resolve civil, commercial, administrative and other cases First instance (days)

18
Years required to resolve an insolvency case, 2015
The insolvency process is still too lengthy
Source: World Bank (2016), Doing Business 2016: Measuring Regulatory Quality and Efficiency (database) and APAJ (2015), “Processo Especial de Revitalização”, Turn Analysis, No. 7, 2nd quarter, Associação Portuguesa dos Administradores Judiciais.
IRL
JPN
CAN
SVN
BEL
FIN
NOR
AUS
DNK
ISL
GBR
AUT
NLD
DEU
NZL
KOR
ESP
USA
OEC
DIT
AM
EX FRA
PRT
HUN
ISR
LUX
SWE
CZE
EST
POL
CHE
CHL
GRC
SVK
TUR
0.0 0.5 1.0 1.5 2.0 2.5 3.0 3.5 4.0 4.5 5.0
0.0 0.5 1.0 1.5 2.0 2.5 3.0 3.5 4.0 4.5 5.0
A. Years required to resolve an insolvency case 2015

19
Index scale of 0-6 from least to most restrictive, latest data
Barriers to competition in transport sectors are high
Source: OECD (2016), OECD Product Market Regulation Statistics (database).
GBR DE
U
SVK
CHE
HUN
SWE
JPN
NLD
BEL
ESP
OEC
D
CHL
ITA
IRL
CZE
MEX
GRC PO
L
KOR
FRA
PRT
TUR
0.0
0.5
1.0
1.5
2.0
2.5
3.0
3.5
4.0
4.5Air Road Rail

20
EUR per thousand kilowatt hours paid by medium sized industrial consumers, 2015
Electricity prices are high, hampering competitiveness
Source: Eurostat (2016), “Electricity prices by type of user”, Tables by Themes.

RAISING SKILLS

22
Gap with respect to the United States, per cent, 20141
Labour productivity is low
Labour productivity is measured by GDP per hour worked.Source: OECD (2016b), “GDP per capita and productivity levels”, OECD Productivity Statistics (database).
MEX CH
LPO
LKO
RTU
RES
THU
NPR
TCZ
EG
RC ISR
SVK
SVN
JPN
NZL
ISL
OCD
EG
BR UE ESP
ITA
CAN
FIN
AUS
SWE
AUT
CHE
DNK
DEU
FRA
IRL
NLD
BEL
NOR
LUX
-80
-60
-40
-20
0
20
40
-80
-60
-40
-20
0
20
40

23
Percentage of working age population having attained at least upper secondary education, 20151
Improving skills is key
1. Working age population: 25-64 years-olds.Source: OECD (2016), Education at a Glance 2016: OECD Indicators.
CZE
SVK
EST
POL
CAN
USA
CHE
LVA
FIN
DEU
SVN
KOR
ISR
AUT
HUN
NOR
SWE
DNK
IRL
GBRAU
S
FRA
OEC
D
NLD
NZL
ISL
BEL
LUX
GRCCH
L
ITA
ESP
PRT
TUR
MEX
0
10
20
30
40
50
60
70
80
90
100
0
10
20
30
40
50
60
70
80
90
100

24
Learning outcomes are improving
Source: PISA 2015 Results: Excellence and Equity in Education (Vol. I).
Average of PISA scores in mathematics, science and reading
2000 2003 2006 2009 2012 2015465
470
475
480
485
490
495
500
505
465
470
475
480
485
490
495
500
505
Portugal OECD average

25
Percentage of the population aged 18 to 24 having attained at most lower secondary education and not being involved in further education or training,
2015
Early school leaving rate is high
Source: Eurostat (2016), "Youth education and training", Eurostat Database.
ESP
ISL
ITA
PRT
HUN
EST EU
GBR
NOR
BEL
DEU
FRA
LUX
FIN
NLD
GRC DN
K
AUT
SWE
IRL
SVK
CZE
POL
CHE
SVN
0
2
4
6
8
10
12
14
16
18
20
22
0
2
4
6
8
10
12
14
16
18
20
22

26
Grade repetition is too commonly usedES
P
PRT
BEL
NLD
DEU
ITA
USA
OEC
D
AUT
CAN
AUS
ISR
EST
POL
NZL
SWE
DNK
CZE
SVK
FIN
GBR SV
N
ISL
JPN
KOR
NOR
0
5
10
15
20
25
30
35
40
0
5
10
15
20
25
30
35
40
% of 15-year-old students who have repeated at least one year
Source: OECD (2012), Equity and Quality in Education: Supporting Disadvantaged Students and Schools.

27
Inequities in the education system persist
2006 2015 2009 2012Science Reading Mathematics
0
5
10
15
20
25
30
35
Portugal OECD average OECD minimum/maximum
% of PISA score variance explained by students’ socio-economic background
Source: PISA 2015 Results: Excellence and Equity in Education (Vol. I); PISA 2012 Results: What Students Know and Can Do (Vol. I); PISA 2012 Results: Excellence Through Equity (Vol. II); PISA 2009 Results: Overcoming Social Background (Vol. II) and PISA 2006, Vol. 2: Data.

28
Upper-secondary vocational education and training enrolment rates, 2014
The VET system needs a thorough evaluation
Source: OECD (2016), Education at a Glance 2016: OECD Indicators and OECD (2015), Education at a Glance 2015: OECD Indicators.
CZE
FIN
AUT
SVK
NLD
SVN
CHE
LUX
BEL
ITA
NOR
AUS
POL
DEU
TUR
PRT
OCD
ESW
EG
BR FRA
DNK
ISR
LVA
MEX ES
TES
PNZ
LG
RC ISL
CHL
HUN
JPN
KOR
CAN
IRL
0
10
20
30
40
50
60
70
80
0
10
20
30
40
50
60
70
80
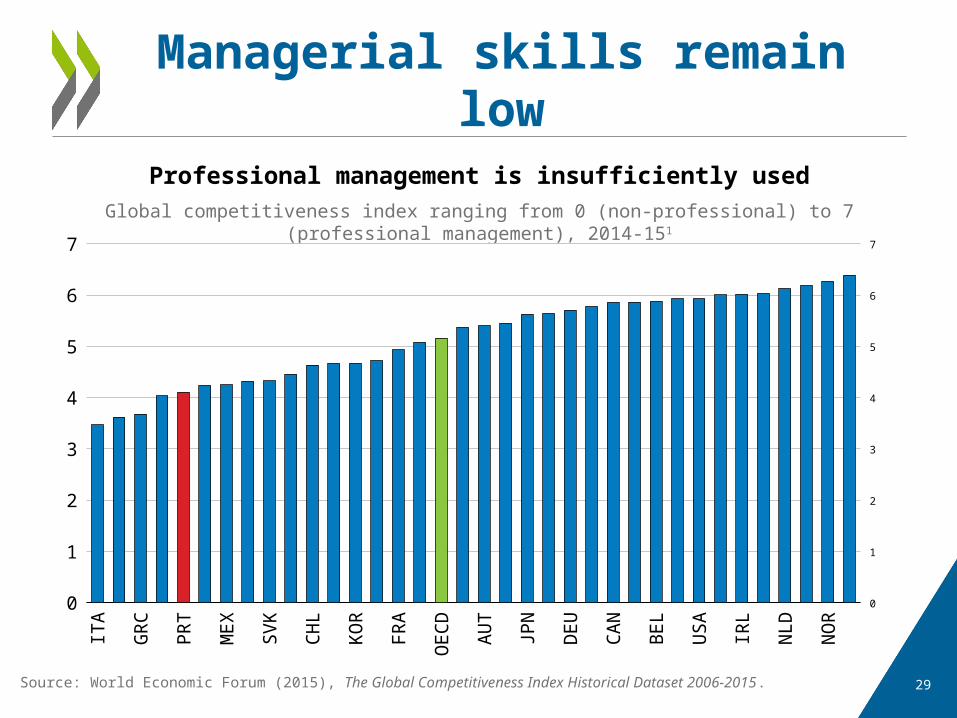
29
Professional management is insufficiently usedGlobal competitiveness index ranging from 0 (non-professional) to 7 (professional
management), 2014-151
Managerial skills remain low
Source: World Economic Forum (2015), The Global Competitiveness Index Historical Dataset 2006‑2015.
ITA
HUN
GRC SV
NPR
TTU
RM
EX POL
SVK
ESP
CHL
LVA
KOR
ISR
FRA
CZE
OEC
DES
TAU
TIS
LJP
NLU
XDE
UAU
SCA
NG
BR BEL
SWE
USA
DNK
IRL
CHE
NLD
FIN
NOR
NZL
0
1
2
3
4
5
6
7
0
1
2
3
4
5
6
7

30
% of GDP, latest data
R&D expenditures are low
Source: OECD, Main Science and Technology Indicators database.
CHL
MEX
GRC
SVK
POL
TUR
NZL
ESP
LUX
PRT
ITA
HUN
EST
IRL
CAN
GBR
NOR
ISL
CZE
NLD
AUS
FRA
OECD SV
NBE
LUS
ADE
UCH
EDN
KAU
TSW
EFI
NJP
NIS
RKO
R
0.0
0.5
1.0
1.5
2.0
2.5
3.0
3.5
4.0
4.5
0.0
0.5
1.0
1.5
2.0
2.5
3.0
3.5
4.0
4.5

31
As a percentage of product and/or process-innovating small and medium sized enterprises (SMEs), 2010‑12
Cooperation between SMEs and research institutions is low
Source: OECD (2015), OECD Science, Technology and Industry Scoreboard 2015: Innovation for growth and society.
CHL ITA TUR LVA PRT ISR POL SVK FRA NLD ESP DNK CZE EST KOR DEU NOR HUNSWEGBR JPN BEL GRC AUT FIN SVN0
5
10
15
20
25
30
0
5
10
15
20
25
30

MAIN RECOMMENDATIONS

33
• Maintain momentum for structural reforms, in conjunction with a continuous ex-ante and ex-post evaluation of reforms.
• Continue gradual fiscal consolidation to ensure the decline of public debt without jeopardising the recovery.
Macroeconomic Policies

34
• Strengthen current regulatory incentives for reducing non-performing loans (NPLs), including through write-offs and sales.
• Support the development of a market for distressed debt, notably through the creation of asset management companies.
• Improve the workings of insolvency rules by: – reconsidering the privileged treatment of public creditors– enlarging the scope for simple-majority decisions among
creditors– shortening out-of-court settlement procedures.
Recommendations to reduce NPLs and the corporate debt overhang

Recommendations to improve the business climate and raise investment
• Revise land use regulations and limit discretionary powers of municipalities in licensing procedures.
• Ease entry requirements in professional services.
• Further reduce trial length and the backlog of pending court cases by expanding court capacity and assigning specialised judges to specialised courts.
• Phase out electricity generation guaranteed prices sooner than currently planned.
• Improve the efficiency of ports.

Recommendations to raise skills• Perform a thorough evaluation of all vocational training programs.
• Unify the different systems of vocational education by establishing a single dual VET system, including work-based learning in companies.
• Provide more and earlier individualised support to students at risk of falling behind to reduce grade repetition.
• Improve teachers’ training and shift more resources towards primary and pre-primary education.
• Strengthen the links between research and the business sector through better incentives for academics to cooperate with industry.
• Raise managerial skills by developing specific training courses for managers.
• Target life-long learning programmes towards the low-skilled.