portview user manual - lysatorkjell-e/embedded/eddy/eddy ver 1.2a/manual... · portview user manual...
TRANSCRIPT
Portview
User Manual
English Version 1.1
June 14, 2006

Portview User Manual
URevision History
Revision Date Document
Version Pages Description
May 25, 2006 1.0 All Initial release by jhkim
June 14, 2006 1.1 3
All
Modified supported hardware
Style / font fix
Copyright 2006 SystemBase Co., Ltd. All rights reserved.
Website HTUhttp://www.sysbas.com/UTH
Tel 82-2-855-0501
Fax 82-2-855-0580 16P
thP Fl. Daerung Post Tower-1, 212-8, Guro-dong, Guro-gu, Seoul, Korea
For any inquiries or comments, contact to [email protected]
2
Portview User Manual
Management with Portview
1. TPortview Introduction
Portview is the program that enables you to monitor the device server communication status
in real time. Portview displays the data input/output through each serial port as well as the
communication status of The device server from remote PCs under the Windows
environment.
1) TSupported Hardware
Portbase Series
WiComm-2
Eddy Series
Weddy Series
2) TSystem Requirements
PC system requirements for running Redirector are as follows.
CPU : Pentium 100 MHz or higher
Memory : 16 Mb or more
Operating System : Windows 95/98/ME/2000/XP/2003
CD-ROM : Faster than 4X
Network : 10M Ethernet or higher
3
Portview User Manual
2. TInstalling Portview
1) TInstallationT
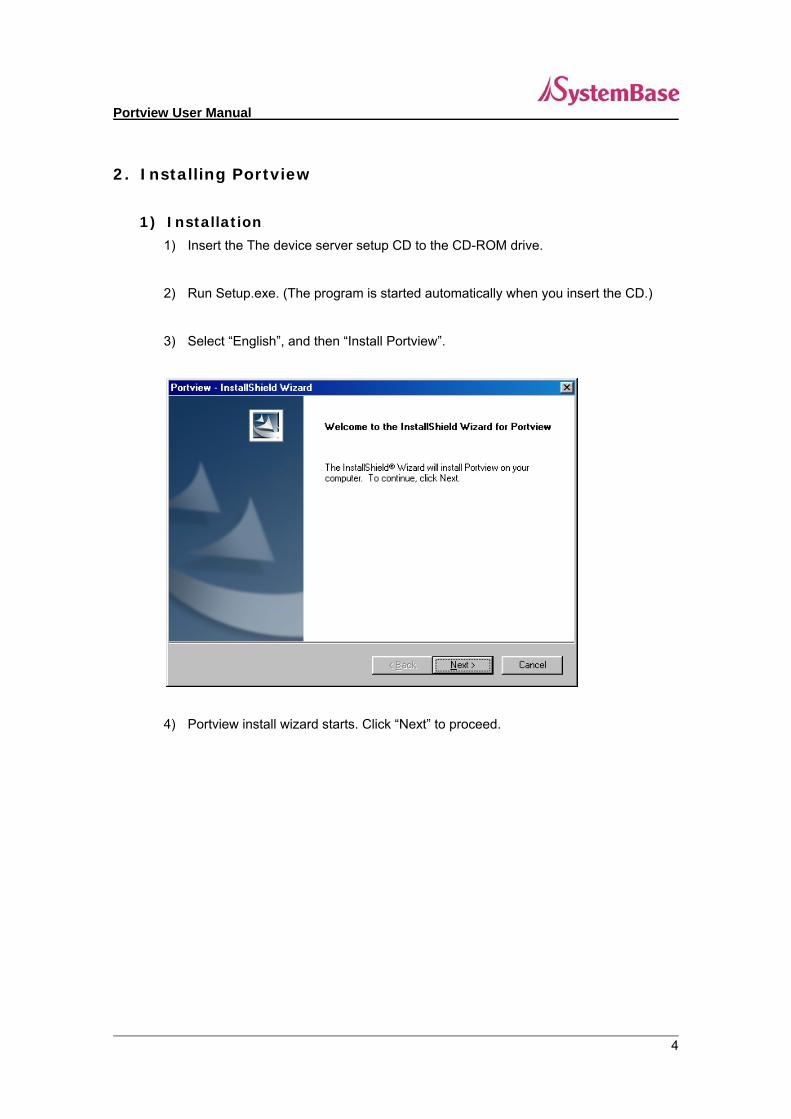
1) Insert the The device server setup CD to the CD-ROM drive.
2) Run Setup.exe. (The program is started automatically when you insert the CD.)
3) Select “English”, and then “Install Portview”.
4) Portview install wizard starts. Click “Next” to proceed.
4

Portview User Manual
5) Choose destination location, and click “Next”. Default path is C:\Program
Files\SystemBase Portbase\Portview
6) Click “Install” to begin installation.
5

Portview User Manual
7) Click “Finish” to complete the installation. To run the program, select ‘Start’ ‘All
Programs’ ‘SystemBase Portbase’ ‘Portview’ ’Launch Portview’.
6
Portview User Manual
3. TUsing Portview
1) TDevice Server Setting
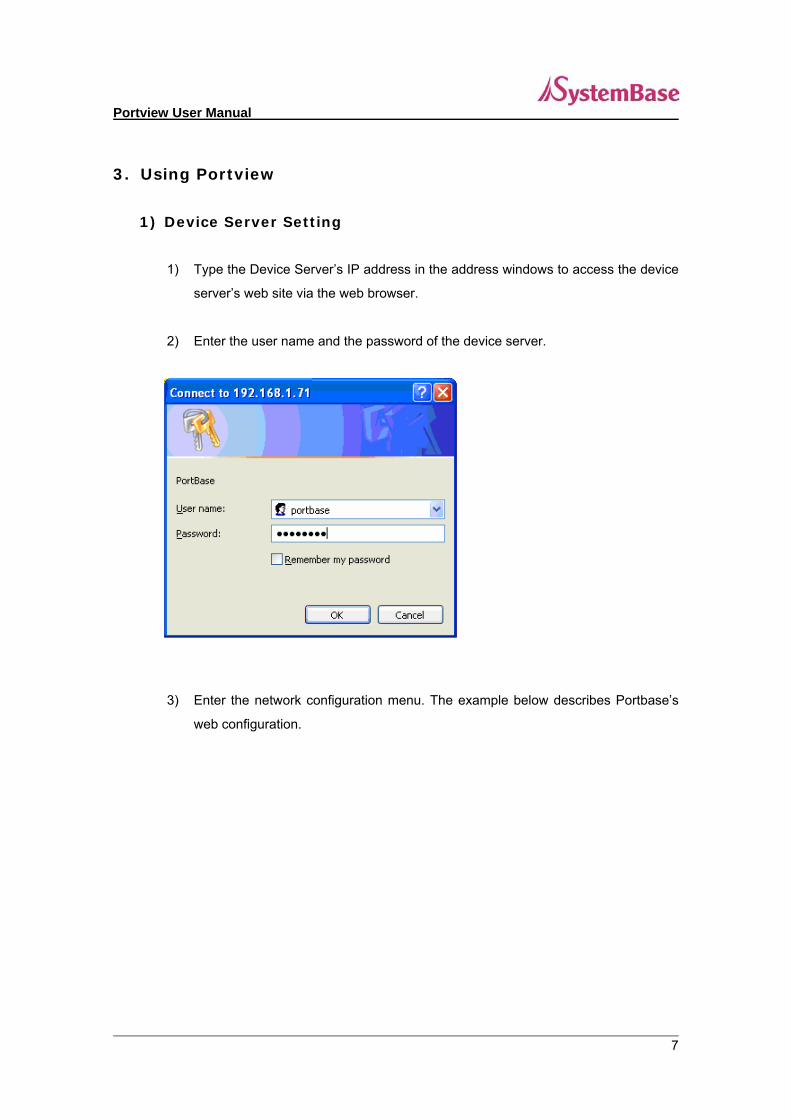
1) Type the Device Server’s IP address in the address windows to access the device
server’s web site via the web browser.
2) Enter the user name and the password of the device server.
3) Enter the network configuration menu. The example below describes Portbase’s
web configuration.
7

Portview User Manual
4) Enter the IP address of the PC to execute Portview on, the name of the device
server, the Location that device server is in, and the Group in which the device
server belongs to.
5) Click on “Save & Restart” to apply the new setting to the device server.
8

Portview User Manual
2) TEnvironment Setting
Password Setting
In order to prevent unauthorized access to Portview, click on ‘Settings’ ‘Password
Setting’ from the menubar.
Mark “Use Password” box and enter the password, and click on “OK”. Afterward, the
password window will appear to execute the the Portview.
Directory Setting
You can set the default directory to save the device server’s log file and the Datascope
capture file.
9

Portview User Manual
Communication Setting
Select whether Portview should keep displaying the device server after it is disconnected,
and set the external connection port.
① If you select ‘Remove nodes automatically, if connections are failed’, the device server
information disappears as the device server is disconnected.
② Select ‘Resume Datascope, if failed connections are restored’ from communication
options menu bar if you want to set Datascope to be automatically executed when the
failed device servers are reconnected. At this time, to automatically display
incoming/outgoing data to/from each device server’s port in real time, select ‘Resume
PortManagement, if failed connections are restored’ as well. (Both options are
available at the same time)
10

Portview User Manual
③ Type the socket number for the device server connection. The default port number is
4000.
Datascope Screen Setting
You can change settings of the data input/output monitoring screen.
11

Portview User Manual
3) TOverall Management
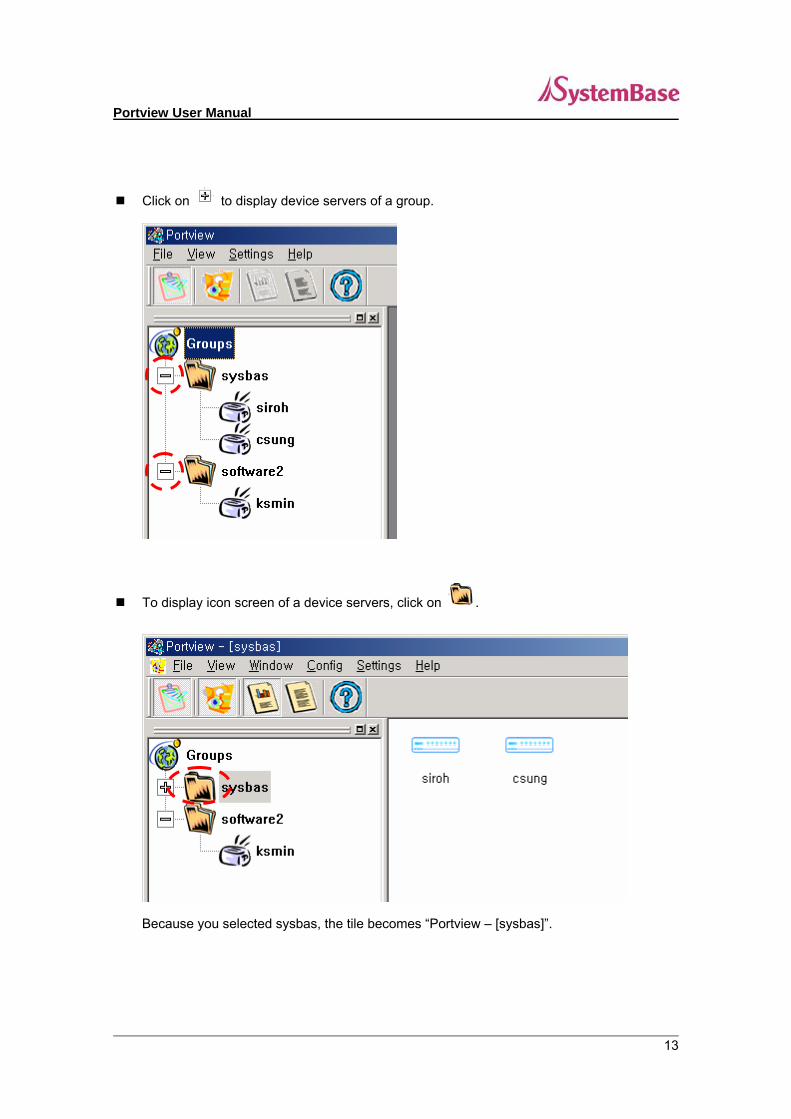
You can manage all the device servers connected to Portview.
The device servers with different group names are displayed as different groups.
To close the group tree screen, click on from the toolbar.
12
Portview User Manual
Click on to display device servers of a group.
To display icon screen of a device servers, click on .
Because you selected sysbas, the tile becomes “Portview – [sysbas]”.
13

Portview User Manual
In order to display detailed information of a device server, click on .
Detailed information of a device server is as below.
Name : Device server’s name
Location : Device server’s location
IP Address : Device server’s IP address
MAC Address : Device server’s MAC address
Starting Time : Device server’s starting time
Model : Device server’s model
Active Ports : The number of active ports
To return to the Device server’s icon screen, click on .
To update the disconnected equipment information, click on ‘View’->’Refresh Group Tree’
from the menu.
Configuration Setting
You can set configuration (name, location, group, IP, mask, gateway and etc.) of the
device server using web and telnet.
To open web or telnet screen of a device server, select the device server on the icon
screen or the list screen, and select ‘Config’ ‘Web Configurator’ or ‘Telnet from the
menu’. (You can select Web or Telnet only after you select a device server.)
(Selecting Telnet)
14

Portview User Manual
4) TDetailed Management
Device Server View
Port View screen:
1) Displays data on each device server’s port..
2) Displays errors on each device server’s port.
3) Displays environment configuration for each device server’s port.
① Starting
To run the device server View, double-click on an equipment on the Group List View or
the device server List View.
<Initial View Screen>
15
Portview User Manual
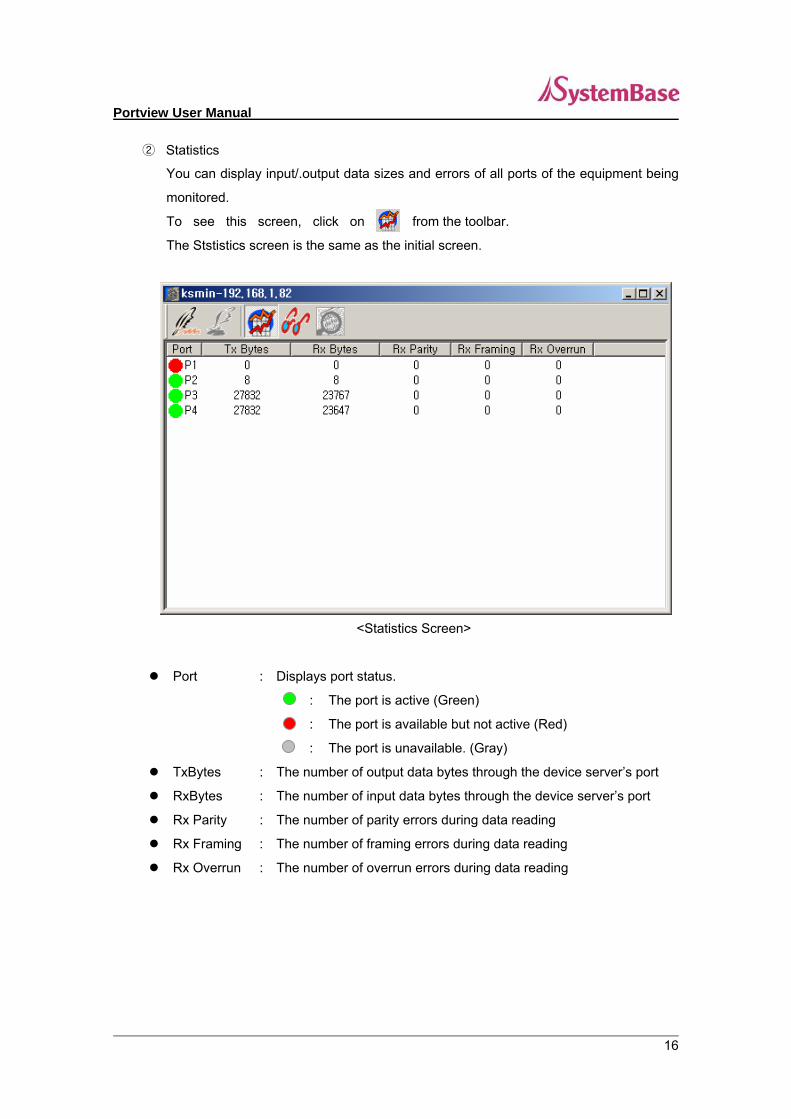
② Statistics
You can display input/.output data sizes and errors of all ports of the equipment being
monitored.
To see this screen, click on from the toolbar.
The Ststistics screen is the same a itial screen. s the in
<Statistics Screen>
Port : Displays port status.
: The port is active (Green)
: The port is available but not active (Red)
: The port is unavailable. (Gray) TxBytes : The number of output data bytes through the device server’s port
RxBytes : The number of input data bytes through the device server’s port
Rx Parity : The number of parity errors during data reading
Rx Framing : The number of framing errors during data reading
Rx Overrun : The number of overrun errors during data reading
16

Portview User Manual
③ Settings
You can display settings of all ports.
Click on from the toolbar.
<Settings Screen>
Port : Port number and status of a device server
: The port is active (Green)
: The port is available but not active (Red)
: The port is unavailable. (Grey) Name : Port name of the device server
Type : Port type of the device server (RS232/422/485)
Protocol : Protocol of the device server
Speed : Baud rate of the device server’s port (150, 300, 600, 1200, 2400,
4800, 9600, 19200, 38400, 57600, 115200, 230400, 460800, 921600)
Length : The number of bits indicating a character (5, 6, 7, 8)
Parity Error detection method of making the number of ‘1’s in a bit string to
be odd or even by adding a test bit to the given data bit string. (None,
Odd, Even)
Stop The bits added to indicate that a character ends (1, 2)
17

Portview User Manual
④ Log file saving
You can make log files for port status and execution of program in the device server.
On the device server‘s View window, click on to display the log start
message. The port operation status is recorded on the log. In order to save the log file,
click on
<Log Start Message>
When saving a log file, enter the file name and click on “Save” .
18

Portview User Manual
<Log Window>
19

Portview User Manual
⑤ Log File
A log file is configured as below.
<Initial System Configuration>
Initial system setting
The red dotted part on the above screen. It contains the default settings.
Port setting
The below “Port Configuration” part.
The port status at the time of log start.
It has the same items of the “Settings” window of device server’s View.
<Demon Log Screen>
Demon record
Records start and end date, time, port and status of the Demon of each port.
Date : Year/Month/Date
20

Portview User Manual
Time : Hour:Min:Sec
Port : The port where the Demon event has occurred
Demon : Type of Demon
Status : Demon starts - Started
Demon ends - Terminated
Connection error and reconnection
<Connection End Message and Reconnection Message>
The red dotted part shows the disconnecton time and indicates that all the
programs are terminated.
The reconnection time and settings are displayed when the connection is restored.
(Status at reconnection is Disable.)
21
Portview User Manual
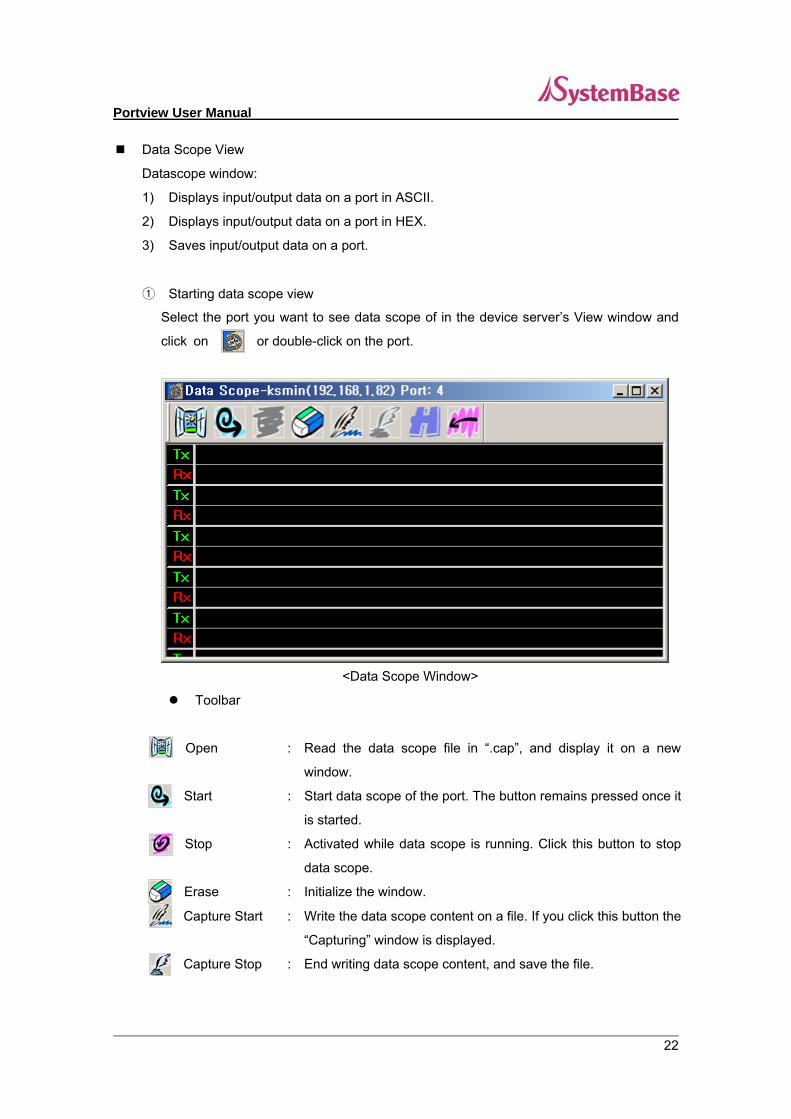
Data Scope View
Datascope window:
1) Displays input/output data on a port in ASCII.
2) Displays input/output data on a port in HEX.
3) Saves input/output data on a port.
① Starting data scope view
Select the port you want to see data scope of in the device server’s View window and
click on or double-click on the port.
<Data Scope Window>
Toolbar
Open : Read the data scope file in “.cap”, and display it on a new
window.
Start : Start data scope of the port. The button remains pressed once it
is started.
Stop : Activated while data scope is running. Click this button to stop
data scope.
Erase : Initialize the window.
Capture Start : Write the data scope content on a file. If you click this button the
“Capturing” window is displayed.
Capture Stop : End writing data scope content, and save the file.
22

Portview User Manual
Hexa Code Display the data scope content in Hexa code. If the button
remains pressed, ASCII data is changed into two-digit Hexa
code.
Back Close the window. (If Capture is active, the file saving window is
displayed.)
Data View
Input/output data on the port is displayed. If the data type is ASCII, the data is
displayed as they are. If you select HEX, they are displayed in hexadecimal. Use
scroll bar to see the rest of the data.
<Data View Window>
23

Portview User Manual
② Operation
Data Scope Starting
If you click on and the remote Tx/Rx data is displayed on the screen.
<Data Scope - Ascii>
Tx data is displayed on the upper line and Rx data is displayed on the lower line.
The function measures buffering status near the data exchange time to arrange
the data. To stop the data scope function, click on
File Saving
If you click on “Capture Start”, the “Capturing” message is displayed and saved.
(The Capture Start button is pressed down while the message is saved on a file.)
Click on “Capture Stop”. The default file name is “pyymmddhhmm.cap”, and each
two digit number indicates year/month/date/hour/minute.
<Saving Data Scope File>
24

Portview User Manual
To open a saved file, click on and select a file. The data is displayed
on a new window.
Data in Hexa code
In order to view data in hexadecimal format on Data View, click on
Use scroll bar to see the rest of the data.
<Data Scope - Hex>
25
Portview User Manual
4. TUninstalling Portview
Select ‘Start’ ‘All Programs’ ‘SystemBase Portbase’ ‘Portview’ ‘Uninstall Portview’.
26