positional release therapy versus therapeutic massage in
TRANSCRIPT
Masthead LogoBrigham Young University
BYU ScholarsArchive
All Theses and Dissertations
2018-04-01
Positional Release Therapy Versus TherapeuticMassage in Reducing Muscle Trigger and TenderPointsAmber Hancock BethersBrigham Young University
Follow this and additional works at: https://scholarsarchive.byu.edu/etd
This Thesis is brought to you for free and open access by BYU ScholarsArchive. It has been accepted for inclusion in All Theses and Dissertations by anauthorized administrator of BYU ScholarsArchive. For more information, please contact [email protected], [email protected].
BYU ScholarsArchive CitationBethers, Amber Hancock, "Positional Release Therapy Versus Therapeutic Massage in Reducing Muscle Trigger and Tender Points"(2018). All Theses and Dissertations. 7350.https://scholarsarchive.byu.edu/etd/7350
Positional Release Therapy Versus Therapeutic Massage
in Reducing Muscle Trigger and Tender Points
Amber Hancock Bethers
A thesis submitted to the faculty of Brigham Young University
in partial fulfillment of the requirements for the degree of
Master of Science
David O. Draper, Chair Wayne Johnson
Brent Feland Dennis Eggett
Department of Exercise Sciences
Brigham Young University
Copyright © 2018 Amber Hancock Bethers
All Rights Reserved
ABSTRACT
Positional Release Therapy Versus Therapeutic Massage in Reducing Muscle Trigger and Tender Points
Amber Hancock Bethers
Department of Exercise Sciences, BYU Master of Science
Objective: To determine the difference in effectiveness of positional release therapy
(PRT) compared with therapeutic massage (TM) in treating trigger and tender points in the upper trapezius muscle.
Background: Trigger points in the upper trapezius muscle are common and can be
painful. Therapeutic massage is a more traditional treatment method for this condition while PRT is relatively new.
Design and Setting: A randomized-group design was used to examine the differences
between the 2 treatments for reducing pain and muscle tension. Subjects: Sixty healthy subjects (males = 24, females = 36; age = 27.1 ± 8.8 years; wt =
75.2 ± 17.9 kg; ht = 172.8 ± 9.7 cm) presenting with upper trapezius pain and a trigger point. Subjects were randomly assigned to the TM group or the PRT group.
Measurements: Presence of upper trapezius trigger points was found via palpation by a
clinician. Level of pain was measured by a visual analog scale (VAS) and pain pressure threshold (PPT) was assessed by a pressure algometer. Muscle thickness was measured by B-mode ultrasound (US) and muscle tension was measured by shear-wave elastography (SWE). Subjects were measured pretreatment and posttreatment and 48 hours later.
Results: All measurements showed significant improvements for both treatments.
Positional release therapy was more effective (p = 0.05) at reducing pain at day 2 and was able to maintain the pain loss. The SWE and US showed no difference between the treatment groups. There was no significant difference in PPT, but PRT PPT increased each visit while TM dropped significantly at day 2 (p = .003).
Conclusion: Both treatments showed a significant ability to reduce pain and acutely
decrease muscle stiffness (as measured by SWE) but there were few differences between the treatments. However, there appeared to be a slight benefit for pain reduction with PRT up to 2 days posttreatment. Keywords: therapeutic massage, positional release therapy, elastography, ultrasound, trigger point

ACKNOWLEDGEMENTS
I thank my wonderful husband, Jared, for his support for me through this program. He
has helped me through every success and drawback with endearing optimism. I thank Dr. David
Draper for his support, patience, and passion that made this project possible and successful. I
also thank Dr. Wayne Johnson and Dr. Brent Feland for their helpful insights, input and overall
support. I thank Dr. Dennis Eggett for helping with the statistical analysis. I am deeply thankful
for all the willing participants for my project and the time they took to help me. I express
gratitude to my family who have always cheered me on and encouraged me to do my best. I
would like to send a special thank you to my parents who have taught me how to work hard and
have sustained me through all my endeavors.
iv
Table of Contents
Title Page ......................................................................................................................................... i
Abstract ........................................................................................................................................... ii
Acknowledgements ........................................................................................................................ iii
Table of Contents ........................................................................................................................... iv
List of Figures ................................................................................................................................ vi
Introduction ..................................................................................................................................... 1
Methods........................................................................................................................................... 3
Participants ................................................................................................................................ 3
Instruments ................................................................................................................................ 3
Procedures ................................................................................................................................. 3
Visual Analog Scale .................................................................................................................. 4
Ultrasound and Elastography .................................................................................................... 4
Pain Pressure Threshold ............................................................................................................ 5
Treatment Groups ..................................................................................................................... 5
Therapeutic Massage .......................................................................................................... 5
Positional Release Therapy ................................................................................................. 5
Posttreatment Measurements .................................................................................................... 6
Statistical Analysis .......................................................................................................................... 6
Results ............................................................................................................................................. 6
Visual Analog Scale .................................................................................................................. 7
Pain Pressure Threshold ............................................................................................................ 7
Elastography ............................................................................................................................. 7
v
Ultrasound ................................................................................................................................. 8
Discussion ....................................................................................................................................... 8
Limitations .............................................................................................................................. 11
Future Research ...................................................................................................................... 11
Conclusion .................................................................................................................................... 11
References ..................................................................................................................................... 13
vi
List of Figures
Figure 1: Visual Analog Scale .................................................................................................... 15
Figure 2: Positional release therapy technique for upper trapezius ............................................ 16
Figure 3: Graphic representation of the significant groups (positional release therapy
and therapeutic massage) by test (pretreatment, posttreatment, and day 2)
interaction for VAS score in rating pain .................................................................... 17
Figure 4: Graphic representation of the significant groups (positional release therapy
and therapeutic massage) by test (pretreatment, posttreatment, and day 2)
interaction for pain pressure threshold. ....................................................................... 18
Figure 5: Graphic representation of the significant groups (positional release therapy
and therapeutic massage) by test (pretreatment, posttreatment, and day 2) ..
interaction for elastography. ....................................................................................... 19
Figure 6: Graphic representation of the significant groups (Positional release therapy
and therapeutic massage) by test (pretreatment, posttreatment, and day 2)
interaction for ultrasound imaging for muscle thickness. ........................................... 20
1
INTRODUCTION
Positional release therapy (PRT) and therapeutic massage (TM) are common methods for
treating trigger or tender points in patients’ muscles.1-3 Separate studies on each have shown
them to be effective in reducing pain4-13 and muscle tightness.3,5-9,14-16 However, research directly
comparing the effectiveness of the 2 treatments is lacking.
Initial research to demonstrate the effectiveness of PRT has used several methods to
quantify the effect of the treatment. These include: a numerical rating scale,4,14 pressure
algometer with pain pressure threshold (PPT),3-5,15 range of motion (ROM),3,6,16
electromyography,7 and visual analog scales (VAS).8 Positional release therapy has been
compared to therapeutic exercises,6,16 passive stretching,6 muscle energy,3,8 medication therapy,4
and sham treatments,6,7,16 all resulting in PRT being more effective overall.
Studies utilizing TM have also shown that it can be an effective way to treat muscle
dysfunction. Therapeutic massage studies have also used a variety of different methods to
quantify its effectiveness, including VAS,10-13,17 pressure algometer,5,10,18 pain scales,5,10,13,17,19
anxiety charts,10,17 PPT,10,18 performance recovery,12,20 ROM,12,17,21,22 and muscle tension.10,12,19
Researchers have reported that TM was shown to be more effective than ultrasound,10 heat
packs,10 a control of no treatment,12,21-23 and relaxation techniques.17,19
Myofascial trigger points (MTrPs) are hyperirritable nodules of knotted muscle and are
found in taut bands of muscular tissue.24 Their existence contributes to the tone, or stiffness, of
the skeletal muscle, causing active and passive tension.24,25 Tender points are sensitive areas of
the body, most often found around MTrPs, and become less tender as MTrPs are treated and
overall tissue stiffness is reduced.24
2
Studies testing the effectiveness of PRT and TM have used two common methods of
measuring tenderness and/or pain. The pressure algometer is used to measure tenderness and find
a PPT. The use of PPT is considered a reliable measurement tool.5,10,18 Visual analog scales are
also used for pain measurements and researchers have found them to be a reliable measure of
chronic and acute pain.26,27 Bijur et al, looked at the reliability of VAS for acute pain and
reported an intraclass correlation to be .97 and a Bland-Altman analysis showed that 50% of the
paired measurements were within 2 mm of one another and 90% were within 9 mm.26
Prior studies have utilized B-mode Ultrasound (US) to locate, define, and trace MTrPs28-
30 after palpation. Shear-wave elastography (SWE) was then used to calculate the elastic modulus
(tissue stiffness).25,28,30 Shear-wave elastography sends waves more parallel than other methods
and has produced reliable measures of muscle stiffness.25,31,32 Although it has not been used in
previous studies to show treatment effect, after our own pilot testing, we decided to also use
muscle thickness, measured by B-mode ultrasound, to help characterize the muscle tissue in the
region of the MTrP.
The purpose of our study was to determine if PRT or TM is more effective at reducing
pain, trigger point tenderness, and muscle stiffness in the upper trapezius muscle. By directly
comparing the 2 therapeutic treatments using diagnostic ultrasound and elastography we were
able to quantify muscle tissue stiffness beyond the more subjective PPT or VAS measures. Since
the 2 treatment methods have been untested in comparison, our study presents new information
for muscle response to PRT and TM. These results may help us determine more effective
methods for the treatment of tender and trigger points.
3
METHODS
Participants
We recruited 60 healthy subjects (males = 24, females = 36; age = 27.1 ± 8.8 years; wt =
75.2 ± 17.9 kg; ht = 172.8 ± 9.7 cm) to participate in the study. Subjects who had suffered an
acute injury to their upper trapezius in the last 6 days, were undergoing current treatment for
their upper trapezius, or unable to lie on their stomach for an extended amount of time were
eliminated from the study. Subjects admitted into the study were required to have upper trapezius
pain of at least 10 mm on the VAS scale and muscle tightness with an accompanying trigger
point in their upper trapezius.
The study was approved by the university’s Institutional Review Board before participant
recruitment. All participants provided written informed consent before individual data collection
began.
Instruments
We used the GE LOGIC S8 ultrasound machine (4MDMedical, Lakewood, NJ) with the
9L soundhead to measure muscle thickness and stiffness. Muscle thickness was measured using
B-mode ultrasound and elastography was used to measure stiffness of the tissue.
For subjective pain data, we used PPT and a VAS for perception of pain. We used the
Jtech Medical Commander Echo pressure algometer (Jtech Medical, Midvale, UT) with a .5 cm2
applicator tip on the subjects’ upper trapezius at the site of the identified trigger point for PPT.
Procedures
During the first visit, the each subject reviewed and signed an institutionally approved
IRB consent form. During the same visit, each subject also underwent screening for presence of
inclusion and exclusion criterion. This included a preparticipation questionnaire about their
4
upper trapezius pain and palpation for a trigger point, following guidelines from Simons, Travell
and Speicher.15,24,33 Each side was examined and pain produced during palpation was recorded
with a VAS.
After the subject had been admitted into the study, the side that the treatment was
administered to was determined by the higher VAS score obtained during the screening process.
The pretreatment measurements were then performed for our variables of interest (VAS,
elastography and ultrasound, and PPT measurements). The same order of measurement was used
for all subjects since we felt that pressure from the PPT could act as a treatment and influence the
VAS or elastography measures. Trigger point location on the subject was marked so that all
measurements were taken in the same location. Measurements were taken at rest before and after
treatment. Subjects were previously randomized to treatment type with 30 subjects in each
treatment group. Each subject was prone with their arms at their sides for all measurement series.
Visual Analog Scale
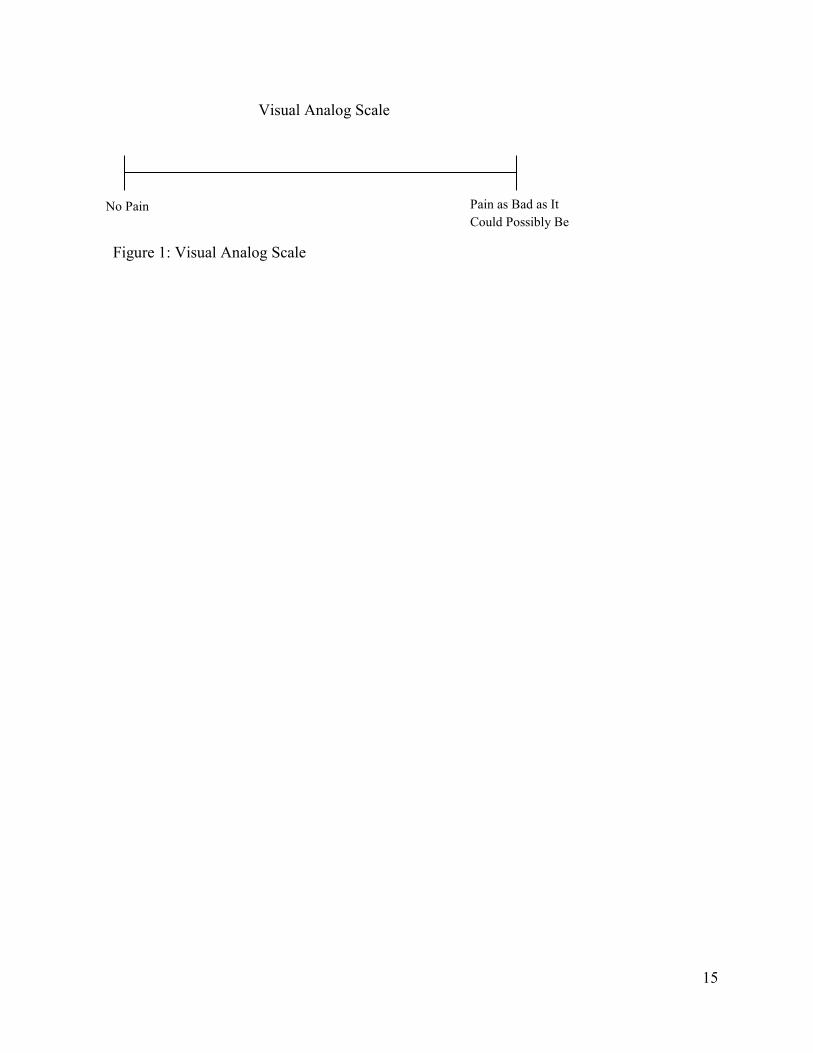
A VAS, as seen below, was presented while the researcher palpated each subject. The
VAS was 10 cm (100 mm) long and was used once before and once after treatment as well as on
the second visit (Figure 1). The subject marked a vertical line on the VAS the distance that they
felt represented their level of tenderness and pain, the left side of the line being the lowest (No
Pain) and the right being the highest (Pain as Bad as It Could Possibly Be), when palpated by the
researcher. The amount marked was recorded in mm.
Ultrasound and Elastography
The ultrasound machine was used to measure two different variables of muscle tension—
muscle thickness and tissue stiffness (via elastography)—over the same spots found and marked
during screening. A 9L sound head was used to for all measurements. In B-mode, 2 images were
5
taken to measure muscle thickness, using features on the machine, with the 2 findings averaged
and recorded in cm. The elastography measure used a 3 cm2 box positioned over the area
containing the trigger point. Nine sample circles of .5 cm diameters were set within the box side
by side in rows in order to cover as much of the box as possible. Each circle registered a strain
modulus reading in kilopascal (kPa). The average of the 9 sample circles were used to represent
the stiffness of the muscle in the data analysis.
Pain Pressure Threshold
Pain pressure threshold was determined by a digital pressure algometer on the same point
identified during screening. The area was measured once by pressing perpendicularly into the
trigger point until the subject declared it to be painful. The peak force measured was then
recorded in kg.
Treatment Groups
Therapeutic Massage. Each subject in the TM treatment group received massage for 5
minutes. The techniques of effleurage and petrissage were used as much as possible over the
marked area of the trigger point, but also in some surrounding areas. These specific techniques
were chosen based on muscle location and ease of treatment application. After the treatment was
completed, the same measurements as before were taken in a similar manner.
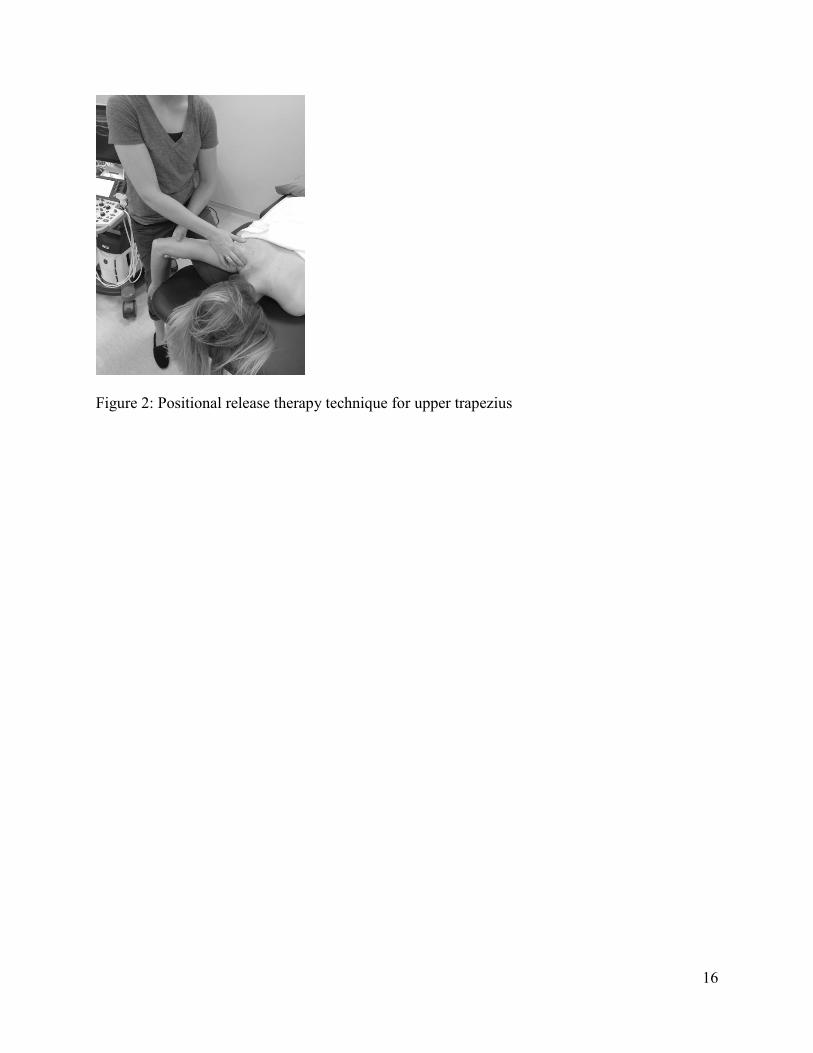
Positional Release Therapy. Each subject in the PRT group received 3 releases in the
marked area. The researcher located the same trigger point as before and, while maintaining
contact with it, moved the subject’s shoulder into passive abduction and scapular upward rotation
and retraction until a position of comfort was achieved, as directed by Speicher in, “Clinical
Guide to Positional Release Therapy”24 (Figure 2). The subject was instructed to remain
completely relaxed during the treatment. After the recommended 90 seconds had passed, or until
6
the researcher felt the muscle fasciculation stop, the subject was returned to the previous prone
position. This was repeated immediately 2 more times. After the treatment was complete, the
same measurements were taken in a similar fashion.
Posttreatment Measurements
Each subject returned 48 hours after treatment for posttreatment measurements. The same
4 measurements taken during the previous visit were taken again. Each subject was also given an
activity survey to record the number of hours they exercised between the last session and the
current session to note any abnormalities or increase in normal exercise.
STATISTICAL ANALYSIS
A mixed models ANCOVA was performed for each of the dependent variables (VAS,
US, elastography, and PPT). A step-wise regression was used to determine significant covariates
for each of the dependent variables. These covariates were then used in the respective mixed-
models analysis for each dependent variable. The covariates considered were the subjects’
gender, side of treatment, height, weight, and age. After selection of significant covariates, the
primary variables of interest, treatment and time of measurement, were added along with their
interaction. Each subject was measured at pretreatment, posttreatment, and 2 days posttreatment.
The correlation in the data was accounted for by doing the mixed models analysis. Post hoc t
tests were used to evaluate differences in the measurements. All analyses were performed using
SAS, version 9.4 (Chapel Hill, NC) and alpha was set at p < 0.05.
RESULTS
The purpose of our study was to determine if PRT or TM is more effective at reducing
pain, trigger point tenderness, and muscle stiffness. We used VAS, PPT, US and elastography to
measure the treatment effects. Results for each of the respective variables are described below.
7
Visual Analog Scale
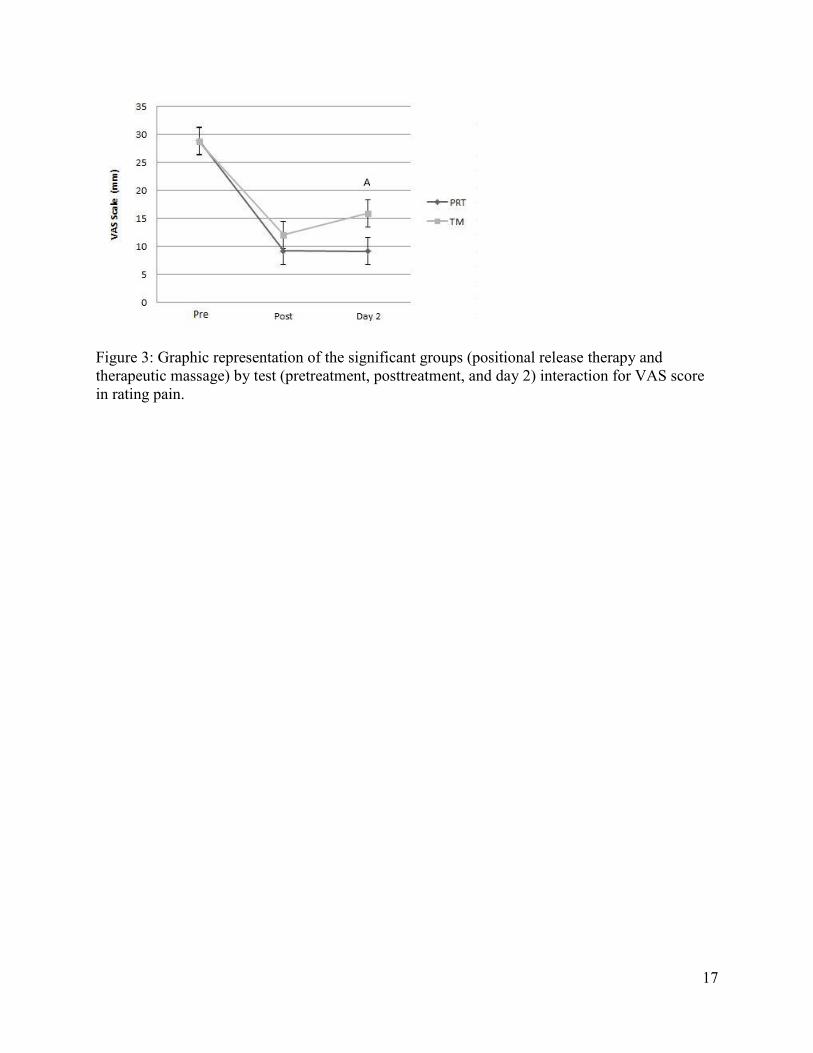
Using gender as a significant covariate, there was a within-group treatment effect with
both groups showing a significant decrease in reported pain at posttreatment and day 2 (p <
.0001). The PRT and TM groups were not significantly different at pretest (p = 0.95), or
posttreatment (p = 0.40), but were significantly different at the day 2 measure (p = 0.05) (Figure
3).
Pain Pressure Threshold
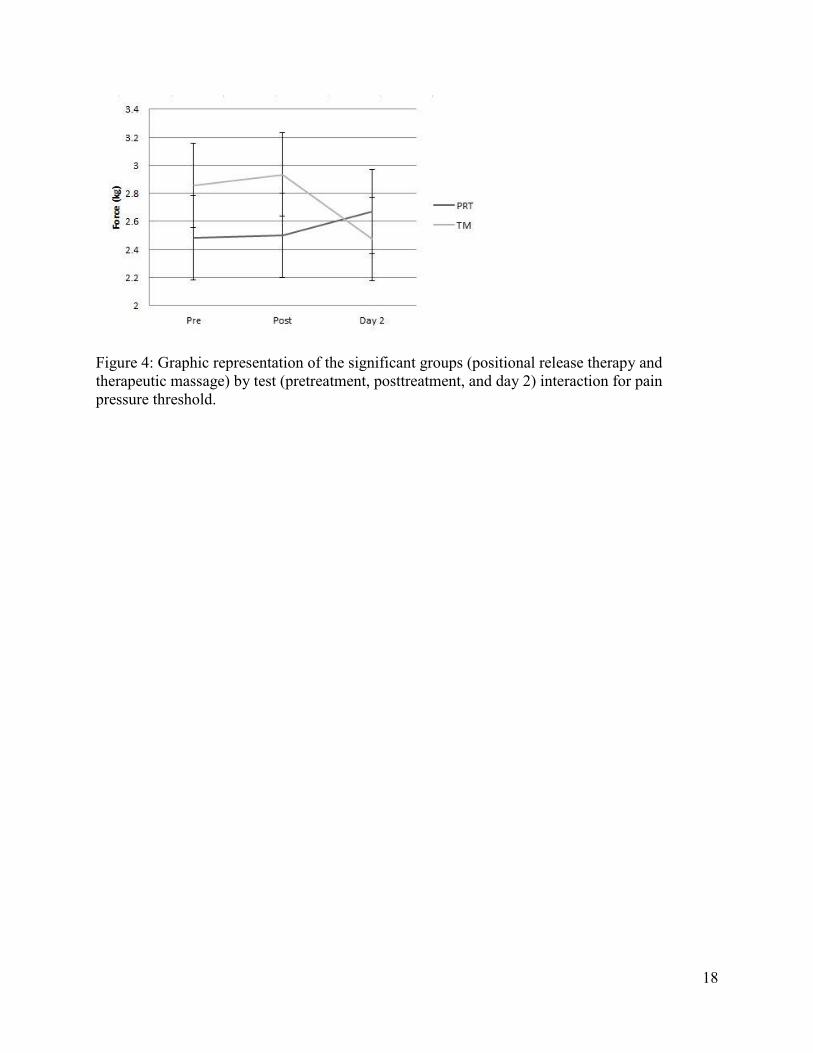
Using gender as a significant covariate, there were no significant within-group
differences for PRT at posttreatment (p = 0.89) or day 2 measurements (p = 0.27). There were no
significant within-group differences for the TM group at posttreatment (p = 0.60), but there was
a significant decrease at day 2 (p = 0.003), as well as between pretreatment and day 2 (p = 0.01).
There were no significant differences between PRT and TM at pretreatment (p = 0.38),
posttreatment (p = 0.31) or day 2 (p = 0.65) (Figure 4).
Elastography
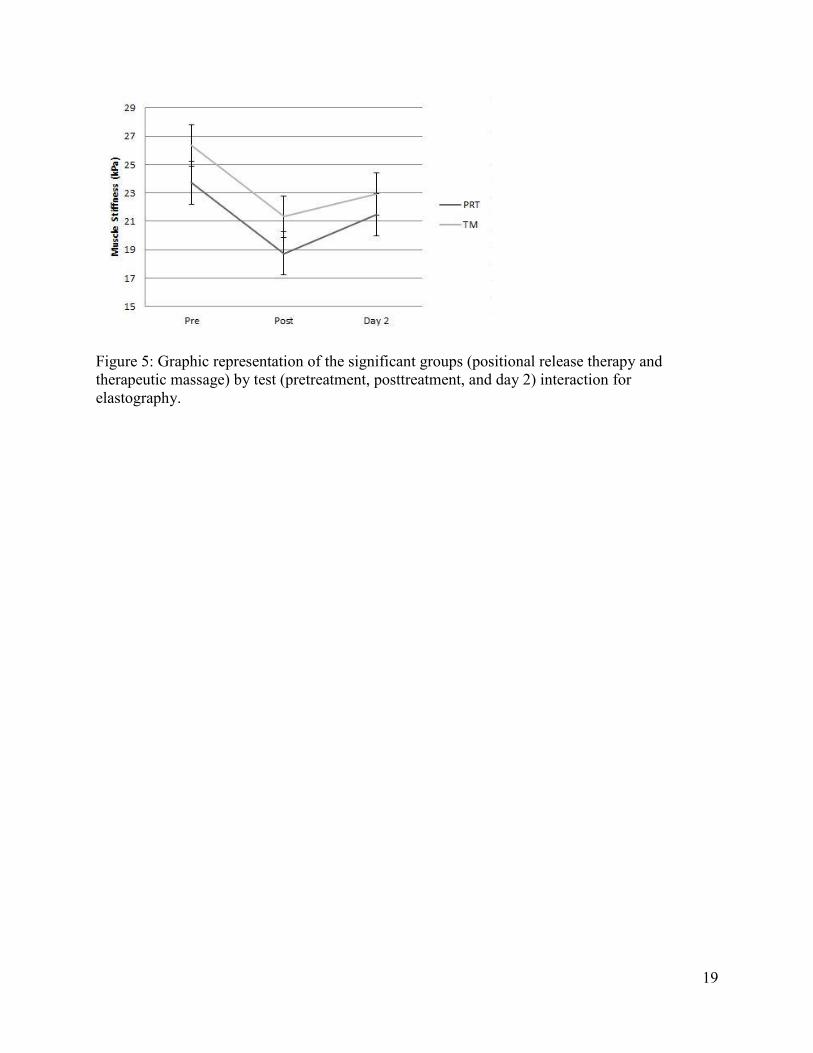
Using weight, age, and gender as significant covariates, there was a within-group
treatment effect with both groups showing a significant decrease in average kPa at posttreatment
(p = 0.002). Positional release therapy had no significant difference on day 2 (p = 0.08), nor did
TM (p = 0.32). Although each treatment’s average kPa increased at day 2 measurements, the
TM group maintained a significant decrease in kPa compared to baseline (p = 0.03). There was
no significant difference between the 2 groups at pretreatment (p = 0.21), posttreatment (p =
0.22) or day 2 (p = 0.47) (Figure 5).
8
Ultrasound
Using gender and weight as significant covariates, there was a within-group treatment
effect with both groups showing a significant increase in muscle thickness at posttreatment (PRT
p = < .0001, TM p = 0.01). Positional release therapy had a significant increase at day 2
compared to baseline (p < .001) while TM did not (p = 0.41). Between posttreatment and day 2
PRT had a significant decrease (p = 0.02) while the TM group had no significant difference (p =
0.4). There was a significant difference between PRT and TM groups posttreatment (p = 0.049).
However, there was no significant difference at pretreatment (0.97) or day 2 (p = 0.21) (Figure
6).
DISCUSSION
The purpose of our study was to determine if PRT or TM is more effective at reducing
pain, trigger point tenderness, and muscle stiffness in the upper trapezius muscle. Both
treatments showed a significant ability to reduce pain and improve structural characteristics as
measured by muscle thickness and elastography. However, there were limited differences
between treatment groups. Generally, there were no differences between treatment groups,
except there was a possible lasting effect from PRT for pain.
In our study, we used 2 measurements for pain: VAS and PPT. Both PRT and TM were
effective in reducing pain reported on a VAS, as seen in previous studies.3-5,8,10,14 On average,
PRT had a greater decrease in VAS (28.9 to 9.1) than TM (28.9 to 12.0). In addition, PRT was
able to maintain the decrease in perceived pain while TM actually increased between visits. This
was somewhat consistent with findings by Ghanbari et al’s research showing that the use of PRT
for tension-type headaches reduced the pain for longer durations than medication provided.4
Another study also reported that pain scores continually dropped between sessions after
9
application of PRT to the upper trapezius,7 while Nagrale et al showed improvement in pain was
seen 2 and 4 weeks after treatment with PRT.8 In our study, therapeutic massage did not have a
lasting effect on pain reduction, which is supported by Buttagat’s findings that over the course of
3 weeks and several treatments, VAS scores remained relatively the same.10
There was no real significance between the 2 groups for increasing the PPT score but
each was successful at increasing PPT after treatment, as seen in previous studies.3-5,15 Our
results for the PPT also support PRT application resulting in lasting pain relief. For the PPT, an
increase indicates a subject can tolerate more force before reporting feeling pain. Although not
statistically significant, at each visit the PRT group increased the average PPT score resulting in
higher pretreatment scores than at day 2, supporting the results of our VAS scores as well as
results of previous studies.3,4,15 The TM group, on the other hand, significantly decreased their
average PPT at day 2, indicating a lower tolerance for pain. While unexpected, this finding is
supported by Aboodarda et al, which reported (after massage application to the calf) an increase
in PPT scores, however, testing after 15 min of rest led to a significant decrease in PPT.5 They
proposed that the reasoning for this might be that pressure from massage stops the pain cycle
through mechanoreceptors and proprioceptors, producing an analgesic effect which wears off
after time.5,11,13 The overall result of pain measurements in this study indicated that subjects
treated with PRT experienced a significant decrease in pain that is maintained longer than
subjects treated with TM.
While there was no significant difference between the 2 treatments, our decreasing
elastography measurements supported previous research stating that PRT7,9 and TM10,12,19 are
effective at reducing chronic muscle stiffness. Both PRT and TM had significant decreases in
tissue stiffness posttreatment. Each treatment’s muscle stiffness measurement increased between
10
posttreatment and day 2. This might be due to the subjects using their trapezius muscles for
activities of daily living or exercise, leading to a return of tissue stiffness. In one study, they
tested elbow flexor stiffness by measuring static torque and elbow range of motion before and
after subjects underwent eccentric exercises. They found that immediately after exercise and 4
days after, tissue stiffness had increased significantly.34 Another explanation for our findings
might be that subjects received only 1 treatment and that a return of muscle stiffness was
inevitable.
Ultrasound imaging was used to measure muscle thickness. Both treatment groups had a
significant increase in muscle thickness posttreatment. The PRT group’s average muscle
thickness decreased at day 2, but it was still thicker than pretreatment. The TM group, on the
other hand, decreased their average muscle thickness back to their pretreatment average. Our
results did not match the findings from the elastography measurements. We expected that as the
muscle relaxed, or became less stiff, the thinner it would become. This is supported by a study
using ultrasound to measure muscle thickness of several muscles (tibialis anterior, biceps brachii,
brachialis, transversus abdominis, obliquus internus abdominis, and obliquus externus
abdominis) that found muscle thickness increased the more the muscle was contracted (not the
more it was relaxed).35 We are not sure why the differences between our elastography and
ultrasound findings existed. However, there are a few possible reasons that our results showed
muscle thickness increasing instead of decreasing. Performing PRT on a MTrP increases blood
flow through decompression of neurovascular structures, which could lead to an increase in
muscle thickness.1,24 Therapeutic massage has similar effects in that it increases blow flow to the
area as well.36,37 The mechanical pressure from massage can also create microdamage to the
muscle, initiating the inflammatory response which could also increase muscle thickness.13
11
Limitations
Our study had limitations. We used healthy individuals with no acute upper trapezius
injury but current pain and a trigger point in order to compare the effectiveness of PRT and TM.
Whether or not our results could be applied to those with chronic trapezius tightness or MTrP
sensitivity is unknown. We only looked at the upper trapezius muscle, however we assume that
treatment of MTrPs would be similar in other muscles. We also assume that a single pressure
algometer measurement did not have a treatmentlike effect on MTrP sensitivity or activity.
Future Research
While this is the first study directly comparing PRT and TM, more research is needed to
fully determine the effects of the treatments in different populations (ie, chronic muscle tension,
after acute injury, those with abnormal holding positions such as ballroom dancers). Studies
researching the effects of PRT and TM over the course of several weeks or repeated treatments
could help support our findings that PRT may be more effective at reducing and maintaining
pain reduction. More information is needed to see if muscle thickness, as measured by US,
relates to elastography measurements of muscle stiffness. As in the study by Hodges et al, using
the US to include measures of muscle fascicle length and angle could help define muscle
tightness characteristics.35 However, due to the structure and size of the upper trapezius, our field
of interest was small enough that such measurements were not possible in our study, but may be
useful when assessing other muscles both during contraction and after treatments of PRT or TM.
CONCLUSION
Both treatments showed a significant ability to reduce pain and acutely decrease muscle
stiffness (as measured by SWE). In general, PRT and TM were both successful at decreasing
MTrP sensitivity and stiffness. However, there appeared to be a slight benefit for pain reduction

12
with PRT up to 2 days posttreatment. More research is needed to supplement these findings and
further compare the treatments.
13
REFERENCES 1. D'Ambrogio KJ, Roth GB. Positional Release Therapy. Mosby; 1997. 2. Knight KL, Draper DO. Therapeutic Modalities: The Art and Science. Baltimore, MD:
Lippincott Williams & Wilkins; 2013. 3. Wong CK. Strain counterstrain: current concepts and clinical evidence. Man Ther.
2012;17:2-8. 4. Ghanbari A, Rahimijaberi A, Mohamadi M, Abbasi L, Sarvestani F. The effect of trigger
point management by positional release therapy on tension type headache. NeuroRehabilitation. 2012;30(4):333-339.
5. Aboodarda S, Spence A, Button D. Pain pressure threshold of a muscle tender spot increases following local and non-local rolling massage. BMC Musculoskeletal Disorders. 2015;16:265.
6. Sweety CC, Vinod BK, Sai KN, Ayyappan VR. Effect of positional release technique in subjects with subacute trapezitis. Int J Physiother. 2014;1:91-99.
7. Kelencz C, Tarini V, Amorim C. Trapezius upper portion trigger points treatment purpose in positional release therapy with electromyographic analysis. NAJMS. 2011;3(10):451-455.
8. Nagrale AV, Glynn P, Joshi A, Ramteke G. The efficacy of an integrated neuromuscular inhibition technique on upper trapezius trigger points in subjects with non-specific neck pain: a randomized controlled trial. J Man Manip Ther. 2010;18:37-43.
9. Jones L. Spontaneous release by positioning. DO. 1964;4(109). 10. Buttagat V, Eungpinichpong W, Chatchawan U, Arayawichanon P. Therapeutic effects of
traditional Thai massage on pain, muscle tension and anxiety in patients with scapulocostal syndrome: a randomized single-blinded pilot study. J Bodyw Mov Ther. 2012;16(1):57-63.
11. Field TM. Massage therapy effects. Am Psychol. 1998;53(12):1270-1281. 12. Hilbert JE, Sforzo GA, Swensen GA. Effects of Massage on DOMS. BR J Sports
Medicine. 2003;37:72-75. 13. Weerapong P, Hume P, Kolt G. The mechanisms of massage and effects of performance,
muscle recovery, and injury prevention. Sports Med. 2005;35(3):235-256 14. Mohamadi M, Ghanbari A, Rahimi Jaberi A. Tension - Type - Headache treated by
Positional Release Therapy: a case report. Man Ther. 2012;17(5):456-458. 15. Simons DG, Travell J. Myofascial trigger points: a possible explanation. Pain.
1981;10(1):106. 16. Wong CK, Moskovitz N, Fabillar R. The effect of strain counterstrain (SCS) on forearm
strength compared to sham positioning. IJOM. 2011;14:86-95. 17. Leivadi S, Hernandez-Reif M, Field T, et al. Massage therapy and relaxation effects on
university dance students. J Dance Med Sci. 1999;3(3). 18. Draper D. The deep muscle stimulator’s effects on tissue stiffness in trigger-point
therapy. Athl Ther Today. 2015;10:52-53. 19. Braun LA, Stanguts C, Casanelia L, et al. Massage therapy for cardiac surgery patients—
a randomized trial. J Thorac Cardiovasc. 2012;144(6):1453-1459, 1459 e1451. 20. Hemmings B, Smith M, Graydon J, Dyson R. Effects of massage on physiological
restoration, perceived recovery, and repeated sports performance. BR J Sports Med. 2003;34:109-115.
14
21. McKechnie GJB, Young WB, Behm DG. Acute effects of two massage techniques on ankle joint flexibility and power of the plantar flexors. J Sports Sci Med. 2007;6(4):498-504.
22. Yang JL, Chen SY, Hsieh CL, Lin JJ. Effects and predictors of shoulder muscle massage for patients with posterior shoulder tightness. BMC Musculoskelet Disord. 2012;13:46.
23. Delaney JP, Leong KS, Watkins A, Brodie D. The short-term effects of myofascial trigger point massage therapy on cardiac autonomic tone in healthy subjects. JAN. 2002;37(4):364-371.
24. Speicher T. Clinical Guide to Positional Release Therapy. Champaign IL: Human Kinetics; 2016.
25. Eby S, Song P, Chen S, et al. Validation of shear wave elastography in skeletal muscle. J Biomech. 2013;46:2381-2387.
26. Bijur P, Silver W, Gallagher J. Reliability of the visual analog scale for measurement of acute pain. Acad Emerg Med. 2001;8:1153-1157.
27. Reeves JL, Jaeger B, Graff-Radford SB. Reliability of the pressure algometer as a measure of myofascial trigger point sensitivity. Pain. 1986;24(3):313-321.
28. Kumbhare DA EA, Noseworthy MD. Assessment of myofascial trigger points using ultrasound. Am J Phys Med Rehabil. 2016;95(1):72-80.
29. Cojocaru MC CI, Voiculescu VM, Cojan-Carlea NA, Dumitru VL, Berteanu M. Trigger points - ultrasound and thermal findings. J Med Life. 2015;8(3):315-318.
30. Muller C, Aranha M, Gaviao M. Two-dimensional ultrasound and ultrasound elastography imaging of trigger points in women with myofascial pain syndrome treated by acupuncture and electroacupuncture: a double-blinded randomized controlled pilot study. Ultrasonic Imaging. 2014;37(2):152-167.
31. Brandenburg J, Eby S, Song P, et al. Ultrasound elastography: The new fronteir in direct measurement of muscle stiffness. ACRM. 2014;95:2207-2219.
32. Gennisson J, Cornu C, Catheline S, Fink M, Portero P. Viscoelastic and anisotropic mechanical properties of in vivo muscle tissue assessed by super-sonic shear imaging. Ultrasound Med Biol. 2010;35:789-801.
33. Travell JG, Rinzler SH. Myofascial Pain and Dysfunction: The Trigger Point Manual. Baltimore MD: Williams & Wilkins; 1983.
34. Howell JN, Cheleboun G, Conaster R. Muscle stiffness, strength loss, swelling and soreness following exercise-induced injury in humans. J Physiol. 1993;464(1).
35. Hodges P, Pengel L, Herbert R, Gandevia S. Measurement of muscle contraction with ultrasound imaging. Muscle Nerve. 2003;27:682-692
36. Hovind H, Nielsen SL. Effect of massage on blood flow in skeletal muscle. Scand J Rehabil Med. 1974;6(2):74-77.
37. Portillo-Soto A, Eberman LE, Demchak TJ, Peebles C. Comparison of blood flow changes with soft tissue mobilization and massage therapy. J Altern Complement Med. 2014;20(12):932-936.
15
Figure 1: Visual Analog Scale
No Pain Pain as Bad as It Could Possibly Be
Visual Analog Scale
16
Figure 2: Positional release therapy technique for upper trapezius
17
Figure 3: Graphic representation of the significant groups (positional release therapy and therapeutic massage) by test (pretreatment, posttreatment, and day 2) interaction for VAS score in rating pain.
18
Figure 4: Graphic representation of the significant groups (positional release therapy and therapeutic massage) by test (pretreatment, posttreatment, and day 2) interaction for pain pressure threshold.
19
Figure 5: Graphic representation of the significant groups (positional release therapy and therapeutic massage) by test (pretreatment, posttreatment, and day 2) interaction for elastography.
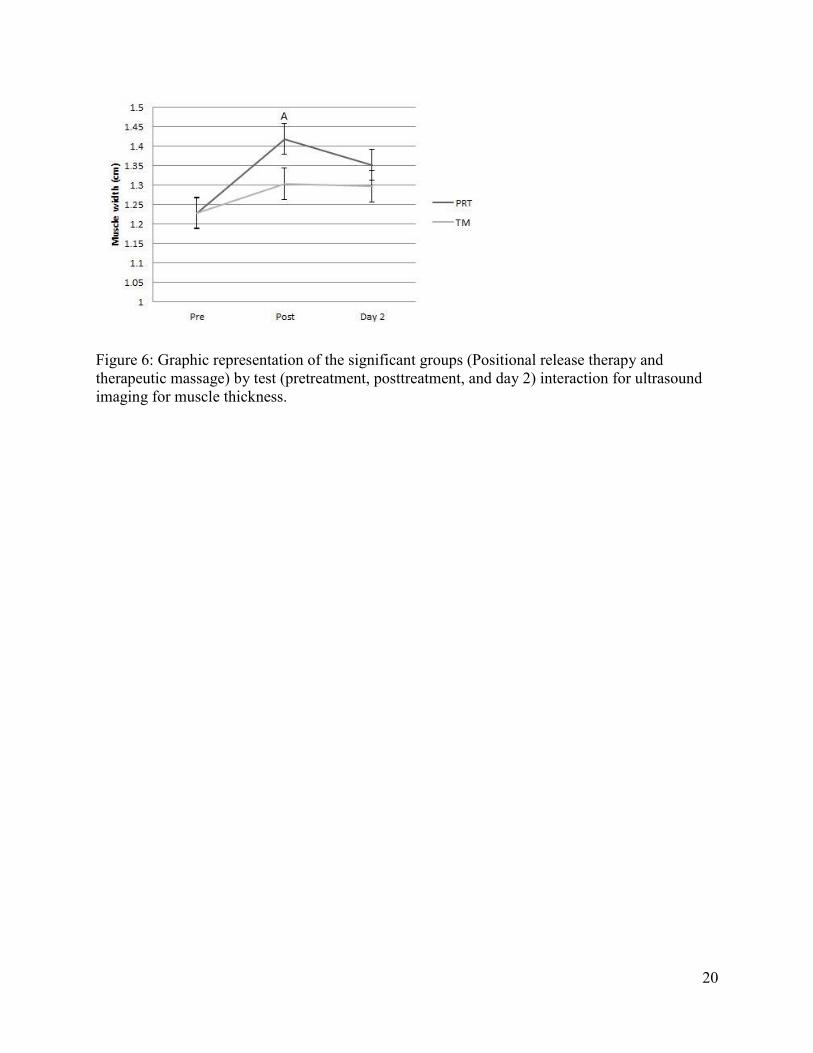
20
Figure 6: Graphic representation of the significant groups (Positional release therapy and therapeutic massage) by test (pretreatment, posttreatment, and day 2) interaction for ultrasound imaging for muscle thickness.