positioned to drive value - st barbara
TRANSCRIPT

Positioned to drive valueANNUAL REPORT 2010

OPERATIONS
The Gwalia mine at Leonora in Western Australia is the Company’s cornerstone asset, with 1.8 million ounces of gold in reserves and an indicative mine life in excess of nine years. Operations at Southern Cross in Western Australia are based around the Marvel Loch Underground mine and treatment plant.
Leonora
Southern Cross
CONTENTS
Chairman and Chief Executive Offi cer’s report 2
Chief Financial Offi cer’s review 8
Operations report 9
Discovery and Growth 14
Environment, safety and socialresponsibility 16
Board of Directors 18
Executives 20
Corporate Governance 21
Ore Reserves and Mineral Resources Statements 25
Leonora Processing Plant
St Barbara Limited ABN 36 009 165 066

The fi rst year of our three year strategy to deliver value has been successful.
Since 2009, St Barbara has focused on rejuvenating its operations, reviewing its organisational and performance capability and strengthening its fi nancial position. With these elements of the strategy almost complete, it is now time to transition to the next phase.
With our established platform and strategy for growth, we are targeting an annual production rate of 500,000 ounces of gold by 2014. Achieving this target is a threshold point for recognition as an international scale gold producer.
www.stbarbara.com.au – Annual Report 2010 :: 1

CHAIRMAN AND CHIEF EXECUTIVE OFFICER’S REPORT
Positioned to drive value
FINANCIAL YEAR 2010 WAS A YEAR
OF GETTING OUR HOUSE IN ORDER
AND ESTABLISHING SOLID
FOUNDATIONS FOR GROWTH.
A year of transformation and performance delivery
The Company has undergone a comprehensive transformation to strengthen its fi nancial and operational capabilities. We have delivered to guidance for the past fi ve consecutive quarters, have a strong balance sheet, have confi rmed a clear growth profi le for Leonora Operations, and now have the capability to actively pursue value accretive growth opportunities.
Operating reliability established
The successful implementation of business improvement programs, strengthening of operational capabilities and improved planning systems delivered reliable performance for each of the Leonora and Southern Cross Operations in Western Australia. Consolidated production for the year ending 30 June 2010 was 231,000 ounces of gold. Cash operating costs for each site were within guidance.
Leonora Operations growing and expanding
The Gwalia mine at Leonora is the Company’s cornerstone asset and continues to provide opportunities for further growth. New mining areas have been identifi ed, Ore Reserves and mine life have increased net of depletion, and there is an expectation of increasing Ore Reserves at depth.
This long life, high margin gold mine will generate signifi cant long term cash fl ows and fund St Barbara’s future growth.
The recently announced 195,000 ounce net increase in Gwalia’s Probable Ore Reserves to 1.83 million ounces will underpin a future mine life of at least nine years, and potentially more.
During the year the Company announced the approval of the King of the Hills gold project at Leonora. This project is expected to commence production in June 2011, produce approximately 55,000 to 60,000 ounces of gold per annum for fi ve to six years, and will provide an ore source to utilise fully available milling capacity in the Gwalia treatment plant. Potential exists to further extend the mine life.
Marvel Loch Mine generating positive cash fl owsThe Marvel Loch Mine at Southern Cross continues to generate positive cash fl ows, and is expected to continue to do so until at least April 2012. We are working to extend the life of mine beyond this date, and establish additional regional production opportunities.
Colin Wise Chairman (L)Tim LehanyManaging Director & CEO (R)
2

Strengthening organisational capability and developing shared values
A major development program involving St Barbara’s employees at every level and location has been undertaken, to address gaps in the Company’s business processes and bolster overall business capability.
Two senior executive appointments were made during the year. David Rose, appointed as Chief Operating Offi cer in September 2009, has extensive mining experience across a diverse range of mineral commodities. Phil Uttley, appointed as Executive General Manager Discovery and Growth in September 2009, has extensive global experience in gold exploration and a successful discovery track record.
A Leadership Development Program covering all aspects of the Company’s operations was conducted during the year to set a very clear expectation of how we will conduct our business to ensure success. This program, together with key appointments to strategic roles, has signifi cantly strengthened St Barbara’s organisational capability.
Strengthening the Balance Sheet
St Barbara is now in a strong fi nancial position. Convertible Notes with a face value $100 million have been repurchased or redeemed. At 30 June 2010, the Company had $102.2 million in available cash, and borrowings of $15.9 million.
Creating a strong and long-lasting competitive positionSt Barbara is now well placed to prosper, as we move into the growth phase of our Strategy, to drive operational excellence and accelerate growth opportunities.
Leonora Operations, with gold production from Gwalia and King of the Hills, is expected to deliver 240,000 to 270,000 ounces of gold per annum commencing in FY12. Our strategic target is to achieve an annual production rate of 500,000 ounces of gold per annum by calendar year 2014.
Southern Cross Operations is expected to cease production in April FY12 unless additional reserves can be identifi ed soon. As a consequence and in order to achieve our strategic target, additional sources of gold production will need to be acquired or developed. We are therefore considering the acquisition of one or more value accretive advanced exploration and/or gold production projects to achieve the 2014 production rate target.
A comprehensive evaluation has been undertaken of gold projects in Australia and in south east Asia; each with the potential to produce at least 100,000 ounces of gold per annum.
Revitalising the exploration strategy
St Barbara’s new Discovery and Growth team is responsible for facilitating growth through successful exploration and evaluation of potential acquisition opportunities. An annual minimum expenditure of $15 million is committed for this work for each of the next three years. Additional funds are available to drill out discoveries.
During the year the Company’s land holdings were assessed for their potential economic exploration value. Non-core areas have now been divested, with the Company retaining approximately 6,000km2 of priority tenements. Conceptual targets have been identifi ed and drilling programs are planned or underway in the 2011 fi scal year on ten prospects Australia-wide.
Focusing on the safety of our workforce
At the core of St Barbara values is our commitment to the safety of everyone in our workplaces. During the year to 30 June 2010, the 12 month rolling Total Recordable Injury Frequency Rate reduced from 14.8 to 11.1.
Although the Company is performing well relative to the safety statistics of the Western Australian minerals industry, we believe we can do better and have set ourselves an ambitious injury reduction target in FY11. A senior and experienced safety professional has been appointed to the Group Health and Safety role. A number of initiatives designed to improve safety awareness are gaining traction with employees and contractors alike. All levels of the Company are committed to striving to further improve the Company’s safety performance.
Engaging with the community
The Company continues to engage with Government at all levels. Local councils are actively consulted on topical community issues as well as new projects. The Company contributes funds and resources for local community events.
The Company is an active member of industry associations, including the Western Australia Chamber of Minerals and Energy, Melbourne Mining Club and Minerals Council of Australia. We are continuing to develop our relationships with indigenous groups with land interests in the areas where we operate.
www.stbarbara.com.au – Annual Report 2010 :: 3

BUILDING VALUE
Valu
e H
oriz
on
3 Year Plan
REVITALISATION – FY10DELIVERY TO PROMISE
GROWTH – FY11 ONWARDSDELIVERY OF VALUE
• Strong cash fl ows from FY12 onwards
• Growth targets being pursued
• Exploration to deliver value
• Review of organisation capability and performance completed
• Revitalised operations
• Strengthened fi nancial position
CHAIRMAN AND CHIEF EXECUTIVE OFFICER’S REPORT continued
International investor concerns about mining taxesAustralia is now viewed internationally as a country with a relatively high cost of discovery and regulatory compliance. St Barbara fully supported mining industry actions to improve public awareness of the consequences of the Federal Government's then proposed Resource Super Profi ts Tax.
While the Minerals Resources Rent Tax proposed before the recent Federal Government election will not apply to gold production, the Company is aware that the international investment community remains concerned about excessive taxing by governments in Australia.
Although international institutional investors in the Australian gold sector have many other global gold investment opportunities available to consider, St Barbara has managed to retain strong institutional support. As at 20 July 2010, more than 79% of the Company’s shares were held by institutional investors, including 46% held by institutions outside of Australia.
Acknowledging efforts and achievements
All at St Barbara have worked hard to steer the Company through the transformation processes of the past year to deliver positive operational results.
Much has been achieved in the past twelve months. There is more work to do to execute our growth strategy and to drive value for our shareholders, and we are dedicating our efforts to these ends.
COLIN WISE TIM LEHANY CHAIRMAN MANAGING DIRECTOR & CEO
30 September 2010
St Barbara – Market capitalisation ($ Million)
*$120 million capital raising completed in December 2009
30 June 201030 June 20090
200
400
600
800
A$m
UP 97%*
4

STRATEGY 1
Positioned for growthFOR THE PAST YEAR, WE HAVE SUCCESSFULLY PURSUED A THREE-PRONGED GROWTH STRATEGY FOCUSED ON PRODUCING MORE GOLD AND EXPLORING FOR NEW MINE OPPORTUNITIES. HERE IS A SUMMARY OF HOW OUR STRATEGY IS PROGRESSING.
PROGRESS IN FY10
(i) Gwalia mine
• Increase in ore haulage from 600,000 tonnes per annum to 660,000–700,000 tonnes per annum rate.
• New areas for mining identifi ed. Upper South West Branch extensions identifi ed and development access underway through the Adam and Beech declines.
• Increase in Gwalia Probable Ore Reserves of 195,000 ounces of gold, net of production in FY10.
(ii) Leonora Operations generally
• King of the Hills development approved. This new project is expected to deliver 55-60Koz of gold per annum for 5 to 6 years, commencing in June 2011.
• Third party ore has been accessed to utilise available mill capacity at the Gwalia processing plant.
PRIORITIES IN FY11
• Haulage optimisation study based on the current Gwalia Life of Mine plan to be completed – to identify potential haulage cost savings and/or production effi ciencies.
• Bring King of the Hills into production on budget and on time.
• Continue to access third party ore until June 2011 when King of the Hills ore production commences.
• Explore cost effective opportunities to increase Gwalia processing plant capacity.
LEVERAGING THE VALUE OF GWALIA – CORNERSTONE ASSET
www.stbarbara.com.au – Annual Report 2010 :: 5

Positioned for growthDISCOVERY AND GROWTH HAS BEEN REFRESHED WITH A NEW STRUCTURE AND A NEW APPROACH. EXPLORATION EXPENDITURE FOR FY11 IS FORECAST AT $15M. FURTHER FUNDS WILL BE MADE AVAILABLE FOR DISCOVERIES, AND / OR GROWTH OPPORTUNITIES.
DRIVING GROWTH THROUGH EXPLORATION
STRATEGY 2
PROGRESS IN FY10
• Economic value assessment of Company land bank, undertaken divestment of low priority holdings and retention of priority land positions.
• Development of targets for drilling on high priority retained land positions.
• Identifi cation of new land areas prospective for discovery and strategies developed to acquire these areas should they become available.
• Revitalisation of the Discovery and Growth team, including expansion of capabilities.
• Expansion of exploration budget to a minimum of $15m p.a. for three years, with additional funds available to drill discoveries.
PRIORITIES IN FY11
• Conduct drilling programs to test targets at:– Thunderbox Shear, Jasper Flats, Sunset Well,
Malcom and Yerilla at Leonora.
– Copperhead, Corinthian and Fraser’s South at Southern Cross.
– East Lachlan NSW and potentially Gawler Craton SA.
• Gwalia, at depth to extend Mineral Resources and potentially Ore Reserves.
• Conduct follow up drilling programs on targets of interest.
• Evaluate the geological potential of potential projects for acquisition.
6

STR
ATE
GY
3
LOWER CASH OPERATING COSTS
100Koz+ PROSPECTIVE TO 200Koz PER ANNUM
MINIMUM IRR OF 15%
CONFIDENCE OF DEVELOPMENT CONSENT
RESERVE OF 5+ YEARS; RESOURCE >1Moz POTENTIAL
HIGH PROSPECTS FOR EXPLORATION SUCCESS
AUSTRALASIA AND OVERSEAS
2010 2014
TARGET500Koz
PER ANNUM
STRATEGY 3
We have set ourselves the strategic target of producing at the rate of 500,000 ounces of gold per annum by 2014. To achieve this we will need to acquire additional production sources for approximately 200,000 to 250,000 ounces of gold per annum. A key focus for the executive team in FY11 is evaluating and executing value growth opportunities.
PROGRESS IN FY10
• Foundations for value growth established
– Executive team refreshed
– Operational capability strengthened
– Financial position now strong
• Criteria for growth agreed
– 15% IRR for new projects (less if in proximity to existing infrastructure)
– Minimum actual or potential gold production of 100,000+ ozs p.a.
– Minimum fi ve year life– Identifi able potential for growth
• Technical evaluation completed for Australian gold projects.
PRIORITIES IN FY11
• Complete technical evaluation of gold projects in stable regions of South East Asia.
• Assess highly ranked technical projects for capability to add value for St Barbara shareholders.
• Execute value growth strategy.
DRIVING VALUE GROWTH THROUGH ACQUISITION
CRITERIA FOR VALUE GROWTH
www.stbarbara.com.au – Annual Report 2010 :: 7

St Barbara completed the 2010 fi nancial year in a strong fi nancial position, with available cash of $102.2 million as at 30 June 2010 and borrowings of only $15.9 million. In the past 12 months the Company has worked hard to improve operational performance and restructure its balance sheet to provide greater fl exibility to pursue growth options.
In the 2010 fi nancial year, the Company improved its liquidity position and substantially reduced debt. An equity offer, strongly supported by St Barbara shareholders, raised a net $119 million to provide funds for the buy back and redemption of remaining Convertible Notes.
The major fi nancial achievements in FY10 were:
• Restructuring the balance sheet, with the repayment of Convertible Notes with face value of $75.9 million, funded from the proceeds of the equity offer completed in December 2009;
• Funding procured to develop the King of the Hills mine at Leonora and provide working capital fl exibility;
• Divesting the Company’s 9.7 per cent holding in Bendigo Mining Limited for proceeds of $9.9 million;
• Establishing new banking facilities with National Australia Bank Limited (NAB) and Barclays Bank PLC (Barclays). NAB provided a $25 million performance bond facility secured by assets, replacing a previous cash-backed facility. Barclays and NAB provided a 250,000 ounce hedge facility to underpin a minimum gold price for King of the Hills production; and
• Executing a bought put option and sold call zero cost option collar structure to provide price protection for future King of the Hills production. The collar structure comprises bought put options at a strike price of A$1,425 per ounce and sold call options at a strike price of A$1,615 per ounce for 250,000 ounces over a fi ve year term. At 30 June 2010 the collar structure had a negative mark to market value of $38.7 million, which is not realised and fully reverses over the maturity of the option contracts. The collar structure ensures that King of the Hills production will receive a minimum gold price of $1,425 per ounce and benefi t from higher spot gold prices up to $1,615 per ounce.
GARTH CAMPBELL-COWANCHIEF FINANCIAL OFFICER
CHIEF FINANCIAL OFFICER’S REVIEW
Positioned to deliver resultsWE ARE NOW IN A STRONG FINANCIAL POSITION
Financial Highlights
Year Ended 30 June 2010 Year Ended 30 June 2009
$M $M
Sales revenue 296,760 281,129
EBITDA (including signifi cant items) 33,793 39,701
EBIT (including signifi cant items) (38,081) (70,403)
Reported net loss after tax for the year (40,188) (76,344)
Total net signifi cant items (54,735) (76,553)
EBITDA – excluding signifi cant items 73,163 52,445
EBIT – excluding signifi cant items 16,654 6,150
Underlying net profi t after tax 14,547 209
GARTH CAMPBELL
8

The Company’s two gold operations, based in Western Australia, performed well for the year.
Production of 231,000 ounces of gold for the year was at the upper end of guidance published in July 2009 of 205,000 to 240,000 ounces of gold and cash operating costs of $790 per ounce were comfortably within the July 2009 guidance of $745 to $820 per ounce.
During the year a number of productivity improvement measures were successfully introduced at both sites. Operating capabilities as well as planning and processing systems have been strengthened.
The King of the Hills project at Leonora has been approved for development with fi rst gold production expected in June 2011.
A summary of gold production for the year follows:
St Barbara
Production Summary FY10
Leonora oz 109,148
Southern Cross oz 121,870
Consolidated oz 231,018
Total Cash Operating Costs
Leonora A$/oz 686
Southern Cross A$/oz 883
Consolidated A$/oz 790
OperationsWE PRODUCED 231,000 OUNCES OF GOLD AND MET GUIDANCE FOR THE YEAR
www.stbarbara.com.au – Annual Report 2010 :: 9
Pit inspection Southern Cross Operations. Barry Arber – Health, Safety & Environmental Advisor (left). Stuart Jenner – Manager Health, Safety & Environment (right).

LEONORA OPERATIONS CONTINUE TO GROWThe Gwalia mine is one of Australia’s most richly endowed high grade gold projects with more than 6 million ounces of gold in historic production plus current ore reserves. It is on track to increase gold production to 190,000 to 210,000 ounces of gold in FY12.
Leonora
Production Summary FY10 total
Underground ore mined t 621,930
Grade g/t 5.7
Ore milled t 632,573
Grade g/t 5.6
Recovery % 95
Gold production oz 109,148
Development of the mine accelerated to plan with the Hoover Decline reaching 1311 metres below surface as at 30 June 2010 enabling the South West Branch to be accessed at the 1260 level in June 2010.
Ore production for the year was 621,930 tonnes @ 5.7 grams per tonne of gold (g/t Au), for 109,148 recovered ounces of gold.
The primary source of ore for the year was South Gwalia Series lode, which was mined between the 1030 and 1240 levels. Production has reconciled well to Ore Reserves.
The South West Branch, which will increase as a proportion of plant feed in the next 12 months, accounts for approximately 87% of the Ore Reserve over the estimated mine life.
A number of signifi cant productivity improvements have been made during the year. Ore production effi ciency increased as a result of establishing an in-pit Run of Mine (ROM) stockpile, and improving trucking effi ciencies, and establishing an additional independent working area in the upper extensions to South West Branch. Signifi cantly, these upper extensions were targeted, drilled, brought into plan and mining commenced, during the fi nancial year.
During the June 2010 Quarter, ore production was achieved at an annualised rate of 780,000 tonnes per annum; a signifi cant increase on Feasibility Study estimates of 600,000 tonnes per annum. Forecast haulage for the next three fi scal years is based on haulage of 660,000 to 700,000 tonnes of ore per annum. There is scope for further improvement.
A new mine decline, the Adam Decline, connected to the Barden Decline, commenced during the year to access the recently identifi ed upper extensions to South West Branch. A second additional decline, the Beech Decline, will be commenced early in FY11 to access higher grade (but lower width) stopes in Main Lode, as well as high grade ore in the South West Branch. Both these declines will continue to be developed throughout FY11 to access new independent working areas and increase mining fl exibility for the future. The ventilation system was also extended during the year to enable refrigerated air to be delivered to the 1190 level, signifi cantly closer to the working areas of the mine.
OperationsLEONORA
10

Excavation for an underground workshop was completed and is expected to be commissioned in the fi rst half of FY11. Further infrastructure works underground are also planned for the coming year.
The processing plant, with production capacity of 1.2 million tonnes of hard rock per annum, continued to perform reliably, achieving gold recoveries of 95% and plant availability of 98%. The plant operated on a campaign basis for the fi rst half of the 2010 fi nancial year.
Following an agreement to treat a trial batch of ore from a third party and to meet the increased output from Gwalia Mine, the plant has returned to full time milling.
The Company plans to continue treatment of third party ore sources through most of FY11, until King of the Hills gold production commences in June 2011.
www.stbarbara.com.au – Annual Report 2010 :: 11
Pump maintenance.Phil Macpherson – Maintenance Fitter.

OperationsLEONORA continued
KING OF THE HILLS, LEONORA – A NEW FIVE-YEAR PLUS GOLD PROJECTIn March 2010, the Company announced the decision to develop the King of the Hills underground gold project, located approximately 40kms by road from the Gwalia mill, where the ore will be processed.
Pre-development works to date included dewatering the Tarmoola open pit where the portal for the underground decline will be located, expansion of the Leonora accommodation village and re-establishment of site offi ces.
The Defi nitive Mine Plan was completed in September 2010.
Drilling during the June 2010 Quarter resulted in an increase in Mineral Resources of approximately 40,000 ounces of gold to a total Mineral Resource of 2.46 million tonnes at 5.3 g/t Au for 418,000 ounces of gold. Ore Reserves as at 30 June 2010 totalled 1.7 million tonnes at 4.3 g/t Au for 230,000 ounces and will underpin an expected mine life of 5.5 years or more.
12
Inspecting core samples at Leonora Operations. John Spring – Mine Geologist.
Underground loader at Gwalia.

SOUTHERN CROSS OPERATIONS – CONTINUING TO MINE EFFICIENTLY, BUT LIMITED MINE LIFE FOR MARVEL LOCH UNDERGROUNDMarvel Loch Underground was the primary source of ore for the 2010 fi nancial year.
A total of 969,519 tonnes @ 4.0 g/t Au for 125,000 ounces of contained gold was produced representing a record for the Marvel Loch Underground mine.
Supplementary ore sources included high grade refractory ore from the Mercury open pit, and existing low grade stockpiles.
Southern Cross
Production Summary June FY10
Underground ore mined t 969,519
Grade g/t 4.0
Open pit ore mined t 23,413
Grade g/t 5.7
Ore milled t 1,279,751
Grade g/t 3.4
Recovery % 86
Gold production oz 121,870
The refractory nature of the Mercury ore reduced milling recoveries during the year. However, by the June 2010 Quarter, Mercury stockpiles were depleted and the commissioning of an Acacia Reactor in the gravity circuit in April 2010 helped to increase recoveries from 84% to 93%.
A $3.6 million diamond drilling program was undertaken during the year with the objective of converting further Marvel Loch Underground Mineral Resources to Ore Reserves.
The drilling program successfully delineated the O’Brien lode in proximity to existing mine development. Whilst O’Brien is not high grade (2.3 g/t Au), it will be an important source of ore production in FY11.
The drilling program intersected pegmatites below the southern and middle lodes in the Marvel Loch Underground system. These pegmatite intrusions displace the ore bodies, rendering them in our opinion, uneconomic to mine below the pegmatites. The outcome is an expected mine life for Marvel Loch Underground of 22 months from 1 July 2010.
A range of options to potentially extend the mine life remain under consideration.
OperationsSOUTHERN CROSS
www.stbarbara.com.au – Annual Report 2010 :: 13
Underground drilling.
Location map Southern Cross Operations.

DISCOVERY AND GROWTH During the year the Company’s exploration and business development was revitalised. Internal and external growth options in the 2011 fi scal year will now be pursued. The exploration division was rebranded ‘Discovery and Growth’, to align with the Company’s strategic aim of producing at the annual rate of 500,000 ounces of gold by 2014.
Expenditure on exploration for the year was $5.8 million, reduced from that of previous years, but focused on a strategic review of all Company land holdings to determine which projects are potentially of most value. The economic value of the Company’s portfolio was therefore optimised by a detailed technical review with the most valuable and highly ranked projects prioritised for targeting or drill testing. As a result, the portfolio was rationalised and a number of lowly ranked or non-prospective prospects were either sold or relinquished. The budget for FY11 has increased to over $15 million and will be directed to effi cient and effective turn-over of prospects by drill testing the highest ranked targets.
Overall, during the year, the focus has been to target additional potential ore sources for the Company’s Gwalia and Marvel Loch Underground mines. A major initiative during the year was the recognition of the higher grade underground potential beneath the former Tarmoola open pit gold mine to provide additional material to the Gwalia processing plant. The underground mine is now known as the King of the Hills deposit, to refl ect the name of the fi rst historic underground workings at this site in 1898.
Discovery and Growth
14
Tim Canam – Geology Manager at Leonora Operations.
Engineers at Southern Cross Operations. Nicholas Reed (left) and Joseph Hoang (right).

DISCOVERY In the Leonora, province exploration activities were focused on the following projects:
• King of the Hills – was investigated by extensional and infi ll drilling on the Eastern and Western Flanks of the deposit. 53 holes and 9282 metres of drilling were completed and the Mineral Resource estimate was completed. A Defi nitive Mining Study confi rmed the project’s viability.
• Tower Hill – the previous mineral resource estimates and ore reserve studies were re-examined to provide an economic comparison to the King of the Hills deposit to determine the preferred project. Detailed structural studies on the geological controls on high grade mineralisation were investigated as the basis for a revised mining plan. These investigations to optimise the economic viability of the deposit are continuing.
• Thunderbox Shear Zone – located 80km north of Leonora. Several sections of this prospective major regional shear zone were tested by geochemical air-core drilling, totalling 4543m. This fi rst phase program has generated at least two highly anomalous gold geochemical targets which will require follow-up geochemical drilling. These targets will be tested with deeper drilling in FY11.
In the Southern Cross, province exploration activities were focused on the following projects:
• Nevoria – located 10km from the Marvel Loch Underground mine. Investigations were focused on the potential of Nevoria as a higher grade underground mine that could potentially supply ore to the Marvel Loch treatment plant. Preliminary feasibility studies are continuing.
• Others – an economic re-evaluation of the land holding portfolio identifi ed signifi cant potential and priority target areas at the higher grade underground historic mines of Copperhead, Frasers South and Corinthian located north of Marvel Loch. Compilation of historic data is underway to assess such opportunities and associated risks, with special focus on the largely unmined ‘Western Series’ lode at Copperhead. Drill testing of these targets is expected during the 2011 fi scal year.
Elsewhere in the Eastern Goldfi elds of WA, geochemical air-core drilling was completed on the Rocky Dam and Malcolm projects, with no signifi cant results to date. Geochemical drilling is planned to continue during the fi rst half of the current year on the newly acquired Yerilla prospect, located 80km south east of Leonora on the prospective Keith-Kilkenny structure.
In the East Lachlan mineral province of NSW, the Company holds 10 tenements, covering 1635km2 located near Nyngan. This area is being investigated for porphyry copper-gold style deposits under the cover of younger sedimentary rocks. A regional structural and targeting study has been completed using available geophysical and geological data. This interpretation has potentially indicated
the presence of a major volcano-intrusive complex. More detailed geophysical surveys will be completed during FY11 and will possibly be followed by drill testing of targets.
Similarly in the Gawler Block located in South Australia, regional structural studies are underway using integrated data sets to identify prospective targets for drill testing and further acquisition.
GROWTHTo complement the Discovery program, the Company is also reviewing external growth opportunities. Detailed evaluation of a number of potential acquisition opportunities is underway, focusing on:
• Production opportunities that meet the Company’s corporate criteria, including upside geological potential.
• Advanced exploration projects held by other parties in mineral provinces considered highly prospective by the Company whereby, through joint-ventures or acquisition, the Company can provide and accelerate drill-out programs.
www.stbarbara.com.au – Annual Report 2010 :: 15
Inspection of rig at Leonora Operations. Linc Downward – Manager Health, Safety & Environment.

Environment, safety and social responsibility
“At the core of St Barbara values, is our commitment to the safety of our workforce. Our business has a simple message – Start Safe Stay Safe.”TIM LEHANY, MD & CEO
A number of initiatives designed to improve safety awareness are gaining traction with employees and contractors alike. A comprehensive Health and Safety Environmental Management System (HSEMS) has been developed – a system underpinned by 14 key standards and focused on setting targets and reviewing performance to ensure continuous improvement of health and safety performance within the workplace.
The HSEMS system roll-out was commenced with the foundational Leadership Development Program, in which St Barbara managers and supervisors from every area of our business participated. Other focus areas throughout the year have included reporting and investigation, critical risk controls standards, training competency and behaviour, and health and hygiene. Crisis and emergency Management plans were also rejuvenated and training undertaken for key participants.
The Company has also implemented the Positive Attitude Safety System (PASS™) across the business with a view to strengthening safety awareness. Training of all site employees and contractors was also completed during the year.
The Company also acknowledges the contribution made by the many contractors whose services we use. We hold our contractors to the same high standards we demand for ourselves and actively exchange workplace safety issues and safety performance data with them.
The strengthening of the Company’s safety culture is refl ected in our reducing injury frequency rates. Year on year, the Total Recordable Injury Frequency Rate has fallen from 14.8 to 11.11; an improvement of 25%. Not withstanding our improved safety performance, the Company still has a long way to go to achieve our ultimate goal of zero injuries.
St Barbara is passionate in its commitment to health and safety and believes that a safe workplace, free from harm and supported by a culture which ensures safety, is fundamental to the success of the Company and the well being of our workforce.
16
Testing the water at Leonora Operations. Karrina Howard – Environmental Offi cer at both Southern Cross and Leonora Operations.

Environment and Sustainability
The Company continues to focus on achieving a high level of environmental excellence in all of its work activities. Sustainability principles are factored into project planning and design. Current mining activities incorporate rehabilitation work where practicable. Examples of this included recycling Grant’s Patch tailings at Gwalia for paste-fi ll, and establishing in-pit mining waste dumps in place of reshaping natural land forms.
This strong focus has been refl ected in a signifi cant reduction in the number of reportable environmental incidents compared to the previous year.
Continuing progress was made on the development of the Environmental Management System, with the system expected to be fully implemented and audited against ISO 14001 by the end of the 2011 calendar year.
Developing mine closure plans, as required by legislation, has also been a high priority during the year. Costed closure plans for all operations are scheduled for completion by the end of the 2010 calendar year.
Rehabilitation
Much of the environmental effort for the past twelve months has been on achieving sustainable rehabilitation sites, focusing almost exclusively on legacy sites. Work undertaken during the year included 16 hectares of primary earthworks undertaken at Tarmoola. Also topsoiling, ripping, seeding and fertilising was undertaken on a further 85 hectares, to complete the rehabilitation of three Tarmoola tailings storage facilities. Local Indigenous people were engaged to undertake this rehabilitation work. Other minor rehabilitation works were undertaken at Jasper Flat (ripping, fertilising and seeding) and Ulysses, at Leonora.
Rehabilitation priorities during the 2011 fi scal year will include legacy sites at Southern Cross Operations as well as waste dumps at Kailis and Tarmoola; both at Leonora Operations.
Unconditional Environmental Performance Bonds to the value of $850,000 for tenements at Southern Cross Operations were released during the year which, together with the bonds relinquished in early 2009 from Leonora, resulted in an overall reduction in environmental performance bonds of $2.4 million.
No new land disturbance is anticipated in the foreseeable future. A new tailings storage facility at Gwalia will be constructed in an area that has been impacted by historic and current operations.
Community and Social Responsibility
The Company continues to conduct regular community briefi ngs to keep the Leonora and Southern Cross communities informed about our activities and plans, and to obtain feedback.
With the recent arrival of asylum seekers and their school age children in Leonora, the local school had diffi culty in obtaining accommodation for the additional staff brought into the town to meet the increased demand for teachers. The Company was able to contribute support to the community by offering three vacant houses to accommodate the additional teachers until Departmental accommodation becomes available.
We continue to recognise the traditional ownership of the lands on which we operate, and to this end have maintained constructive relationships with the various Native Title Claimant Groups associated with these areas. The two Indigenous Liaison Committees – one at Leonora and one at Southern Cross Operations, meet regularly to discuss St Barbara’s activities and plans and any areas of concern the Indigenous groups may have. We also engage with Indigenous groups to undertake Aboriginal Heritage Surveys on land on which the Company plans to carry out exploration and/or mining operations.
www.stbarbara.com.au – Annual Report 2010 :: 17
Working with core. James Crow – Mine Geologist at Leonora Operations.
Leonora Operations group safety meeting.

Board of Directors
Standing from left
Phillip C Lockyer M.Sc, AWASM, DipMETALL Non-Executive Director
Barbara J Gibson B.Sc, FTSE, MAICD Non-Executive Director
Douglas W Bailey BBus (Acc), CPA, ACIS Non-Executive Director
Seated from left
Robert K Rae B.Com (Hons), FAICDNon-Executive Director
Timothy J Lehany B.E., MBA, MAusIMMManaging Director & CEO
S J Colin Wise LL.B, FAICD, FAusIMM Chairman – Non-Executive
18

S J Colin Wise LL.B, FAICD, FAusIMM
Chairman – Non Executive
Mr Wise is an experienced corporate lawyer, consultant and Company Director with signifi cant expertise in the mining and exploration industry and resources, energy and corporate sectors. He spent 24 years with WMC Limited, 10 of which as General Counsel and subsequently, 4 years as Counsel to a New York law fi rm. He has extensive practical experience in Australia and internationally with a wide range of corporate, operational and legal matters.
He has been Chairman of St Barbara since mid 2004, and is a Fellow of both the Australian Institute of Company Directors and the Australasian Institute of Mining and Metallurgy. He is a member of the Advisory Board to the Dean of Medicine, Nursing and Health Sciences at Monash University and was a non-executive Director for 5 years of Southern Health, the largest health care service in Victoria, Chair of its Quality Committee, and a member of the Audit Committee.
Timothy J Lehany B.E., MBA, MAusIMM
Managing Director and Chief Executive Offi cer
Mr Lehany is a mining engineer with extensive operating experience over the past twenty years with a number of mining companies, including Newcrest Mining Limited and WMC Ltd. His roles covered gold, base metal and nickel mines.
Douglas W Bailey BBus (Acc), CPA, ACIS
Non Executive Director
Mr Bailey was the Chief Financial Offi cer of Woodside Petroleum Ltd between 2002 and 2004 and previously, was an Executive Director of Ashton Mining Limited from 1990 to 2000, including the last 3 years as Chief Executive Offi cer. He was also a non-executive Director of Aurora Gold Ltd for the period 1993-2000.
Barbara J Gibson B.Sc, FTSE, MAICD
Non Executive Director
Ms Gibson possesses a broad range of business Management experience. Ms Gibson was formerly the General Manager Chemicals Group of Orica Limited, a member of the Orica Group Executive and a Director of Incitec Pivot Limited. She is a Fellow of the Australian Academy of Technical Sciences and Engineering, and is a recipient of the Australian Centenary Medal in 2001 for service to Australian society in medical technology.
Phillip C Lockyer M.Sc, AWASM, DipMETALL
Non Executive Director
Mr Lockyer is an experienced mining engineer and metallurgist with over 40 years experience in the mineral industry with an emphasis on gold and nickel, in both underground and open pit operations. He was employed by WMC Resources for 20 years, and as General Manager for WA was responsible for that Company’s nickel division and gold operations. He also held the position of Director Operations for Dominion Mining Limited and Resolute Limited.
Robert K Rae B.Com (Hons), FAICD
Non Executive Director
Mr Rae is a Director and Partner of McClintock Associates, a private investment bank and advisory fi rm and has extensive industry and corporate experience. He has held previous directorships within the mining industry, including Plutonic Resources Limited, Ashton Mining Limited, WA Diamond Trust and Centralian Minerals Limited, and is currently a member of the Salvation Army Advisory Board.
www.stbarbara.com.au – Annual Report 2010 :: 19

Executives
COMPANY OFFICERS
Tim LehanyB.E., MBA, MAusIMMManaging Director and Chief Executive Offi cer
Tim was appointed on 2 March 2009. He is a Mining Executive with extensive operating experience over the past 22 years with a number of mining companies, including Newcrest Mining Limited and WMC Ltd.
He is a mining engineer, having held operating, Management and executive roles in gold, base metal and nickel mining. Tim held the position of Executive General Manager Operations with Newcrest Mining Limited prior to joining St Barbara.
David RoseB.E. (Mining Eng), BAChief Operating Offi cer
David is an experienced Mining Executive with 25 years of industry experience having held senior positions at WMC, CRA, Pasminco and Rio Tinto. He is a Mining Engineer with a First Class Honours degree from the University of Queensland, and has extensive operational and project experience in open pit and underground mines, including gold, base metals, nickel, coal, diamonds and iron ore. He also holds a Bachelor of Arts Degree from the University of Oxford where he studied as a Rhodes Scholar. David Rose commenced on 7 September 2009.
Garth Campbell-CowanB.Com, Dip-Applied Finance & Investments, FCAChief Financial Offi cer
Garth is a Chartered Accountant with 25 years of experience in fi nance and Management positions across a number of different industries. He was appointed to the position of Chief Financial Offi cer in September 2006 and
is responsible for the Company’s Finance function, covering fi nancial reporting and accounting, treasury, taxation, business analysis, capital Management, procurement and information technology. He also co-ordinates St Barbara’s strategy and planning activities. Prior to joining St Barbara, he was Director of Corporate Accounting at Telstra and has held senior fi nance leadership roles with WMC, Newcrest Mining and ANZ.
Ross KennedyB.Com, Grad. Dip-Company Secretarial Practice,ACA, FTIA, FAICD, M AusIMM, ACISExecutive General Manager Corporate Servicesand Company Secretary
Ross is a Chartered Secretary and has been with St Barbara since 2004. He has 24 years of experience in corporate administration, including 12 years in the minerals and resources sector, and 10 years of experience as a Management consultant.
Ross leads the Corporate Services team. Key responsibilities include designing and executing plans for investor relations, land Management, legal and compliance, risk Management and ensuring that Company Secretariat functions continue to develop in line with the Company’s growth.
Phil UttleyB.Sc. Hons. (Geol. & Mineral.), FAusIMMExecutive General Manager Discovery and Growth
Phil is an experienced Exploration Executive with 35 years of industry experience having held senior positions in Sino Gold, SRK Consulting and Renison Goldfi elds Consolidated (formerly Gold Fields). He has a B.Sc Hons. (Geol. & Mineral) from University of Queensland and is an experienced exploration geologist, with a demonstrated track record in gold discoveries and establishment of resources for gold production. Phil Uttley commenced on 28 September 2009.
From left: Ross Kennedy; David Rose; Tim Lehany; Garth Campbell-Cowan; Phil Uttley
20

Corporate Governance
Corporate Governance is part of the framework through which a Company is directed and managed. Strong corporate governance aids effective Management and decision making. St Barbara is committed to maintaining and, where possible, improving its corporate governance systems.
During the 2010 fi scal year the Company assessed its practices against the ASX Corporate Governance Principles and Recommendations and where necessary made appropriate modifi cations to ensure that it is in conformance with them. St Barbara’s position with respect to each of the relevant ASX Recommendations is described below and where the Company was not in conformance with them this is explained.
St Barbara’s website contains a range of information on governance practices and policies including Charters for the Board and all Board Committees. The website address is www.stbarbara.com.au.
Principle 1: Lay solid foundations for Management and oversight
The role of the Board is to act in the best interests of shareholders, consider and approve the Company’s strategic direction, provide guidance to, and oversight of, Management and foster a culture of good governance. In performing its role, the Board at all times will endeavour to act:
I. in a manner designed to create and continue to build value for shareholders;
II. in recognition of its overriding responsibility to act honestly, fairly and ethically in serving the interests of the Company, its shareholders, employees, and other stakeholders;
III. in accordance with the duties and obligations imposed upon Directors by the Company’s Constitution and applicable law.
The specifi c responsibilities of the Board are described in the Board Charter.
Executive manager evaluation
The Board has established a Remuneration Committee, which provides recommendations and direction for the Company’s remuneration practices. The Committee ensures that a signifi cant proportion of each executive’s remuneration is linked to his or her performance through short and long-term incentives and the Company’s performance relative to its peers. Performance reviews are conducted at least annually and were undertaken during
the 2010 fi nancial year. The performance of the Managing Director and CEO and his direct reports is assessed against agreed key performance indicators with results for him and other senior executives to be approved by the Board.
Principle 2: Structure the Board to add value
Independence
It is Board policy that a majority of non-executive Directors, including the Chairman, should be independent and free of any relationship that may confl ict with the interests of the Company.
The Board defi nes ‘independence’ in accordance with the ASX Recommendations. Each of the current non-executive Directors is independent. The Chairman is an independent non-executive Director. The Managing Director and Chief Executive Offi cer is the only executive on the Board.
In order to ensure that any personal, professional or other confl ict of ‘interest’ of a Director in a matter is made known, each Director has contracted with the Company to disclose any relationship, duty or interest held that may give rise to such a confl ict. Directors who have declared a potential or real confl ict of interest on a particular issue may be excluded from all relevant Board deliberations and are excluded from voting on that issue.
Composition and Nomination to Board
Having regard to the importance and relative infrequency of Board changes as well as the small number of Board positions there is no nomination committee but rather the Board retains the nomination responsibility for itself. The consideration of Board composition and appointments is periodically dealt with in the Board’s annual programme of work.
Although there is no specifi c process of Director selection detailed in the Board Charter, when a need to appoint a Director to the Board arises, the Board evaluates its skill sets and needs and engages an independent search fi rm to assist and advise the Board on identifying and selecting the best candidates for the given vacancy. The assessment process includes interviews by at least a majority of, if not all, Board members. The Board assesses the nominees against a range of specifi c criteria, including their experience, professional skills, potential confl icts of interest, the requirement for independence and the existing collective skill sets of the Board.
www.stbarbara.com.au – Annual Report 2010 :: 21

Corporate Governance continued
Details of each current Director’s skills, qualifi cations, experience, relevant expertise and date of appointment are set out in pages 36 and 37.
As previously foreshadowed the Board undertook a formal review of its own performance during the year. This was facilitated by the Chairman and included a review of each individual Director’s performance. The outcomes of the review including opportunities to improve Board, and individual Director performance were formally reported to and considered by the Board.
Board structure
The Board has established a number of Board Committees to facilitate the execution of its responsibilities. The Committees provide a forum for more detailed analysesof key issues and interaction with Management. Each Committee reports its deliberations to the next Board meeting. The current Committees are:
Remuneration Committee
Members: Robert Rae (Chair since August 2010), Doug Bailey, Barbara Gibson (Chair for FY10), Colin Wise
Function: The Committee assists and advises the Board in relation to the remuneration of the Managing Director and CEO, his senior executive direct reports, employees of the Company, consultants or contractors who are engaged to perform executive responsibilities, and non-executive Directors.
Audit Committee
Members: Doug Bailey (Chair), Phil Lockyer, Robert Rae, Colin Wise.
Function: The Committee assists and advises the Board in discharging its responsibilities in relation to fi nancial reporting, fi nancial risk Management, evaluating the effectiveness of the fi nancial control environment, oversight of the external audit function and review of Ore Reserve estimation processes. Matters relating to the assessment and supervision of non-fi nancial business risks and compliance are covered directly by the Board.
Health and Safety Committee
Members: Phil Lockyer (Chair), Barbara Gibson, Colin Wise.
Function: The Committee assists and advises the Board in relation to safety and health issues, including:
• in conjunction with Management, promoting a safety conscious culture throughout the Company;
• overseeing the function and effectiveness of the Health and Safety Management Committee; and
• recommending to the Board outcomes on Health and Safety policy, plans, compliance and issues.
Details of the number of meetings of the Board and each Committee during the year, and each Director’s attendance at those meetings, are set out on page 38 of the Financial Report. Every Director has a standing invitation to attend any Committee meeting and to receive committee papers.
Director participation
Directors visit St Barbara’s operations at least once per annum and meet with Management from time to time to gain a better understanding of the Company’s business.
Independent professional advice and access to Company information.
As specifi ed in the Board Charter and individual letters of appointment, Directors have a right of access to all relevant Company information as well as to the Company’s executives and senior Management and, if necessary and subject to prior consultation with the Chairman, may seek independent advice on any issue of particular concern from a suitably qualifi ed adviser at St Barbara’s expense.
Principle 3: Promote ethical and responsible decision making
The Board and the Company’s employees are expected to uphold the highest levels of integrity and professional behaviour in their relationships with all of the Company’s stakeholders. As part of a re-statement of its overall vision, the Company previously adopted a formal set of behavioural values which encompasses the Board, Management, employees and other members of the workforce. The vision and those values underpinning it are available on the Company website. Employees are also made aware of acceptable behaviour through on-going training and development and contact with senior staff who are encouraged to lead by example.
22

In addition to upholding those values, the Company has specifi c policies and procedures that cover trading in St Barbara’s securities and confl icts of interest for Directors. These include maintaining a register of Director interests. Employees are accountable for their conduct under a range of Company policies and procedures, including an Occupational Health and Safety Policy, an Equal Opportunity Policy, an Environment Policy, a policy on the Use of Computer Facilities and others. The Company Secretary is responsible for investigating any reports of unethical practices and reporting outcomes to the Managing Director and CEO or the Board, as appropriate.
The Company has not enshrined its values into a formal code of ethics at this time as it considers that all matters describing, prescribing and underpinning ethical behaviour are contained in the values and attendant policies outlined above.
Trading in St Barbara shares
To safeguard against insider trading, St Barbara’s Dealing in Securities Policy prohibits Directors and employees from trading in St Barbara securities if they are aware of any information not in the public domain that would be expected to have a material effect on the price of Company securities. Dealing in Company shares by Directors, Offi cers and Employees is governed by a ‘Dealings in Securities’ Policy. This policy allows for a 30-day trading window commencing twenty four hours following signifi cant public announcements, provided the Company is not at any time during the 30 days in possession of undisclosed potentially price sensitive information. St Barbara discloses to the ASX any transaction conducted by any Directors in St Barbara securities in accordance with ASX Listing Rules.
Principle 4: Safeguard integrity in fi nancial reporting
The Board has established an Audit Committee and its Charter is available on the Company’s website. The Audit Charter covers the role of the Committee, including the principles governing the Company’s relationship with its external auditor. The Committee considers that KPMG’s process of partner rotation is suffi cient to maintain independence of the external auditor.
Principle 5: Make timely and balanced disclosure
St Barbara seeks to provide relevant up-to-date information to its shareholders and the broader investment community in accordance with the continuous disclosure requirements under the ASX Listing Rules. The Board has implemented a Continuous Disclosure Policy to ensure that information considered material to the share price or its value is lodged with the ASX as soon as practicable. Other relevant information, including Company presentations, updates by senior Management and commentary on fi nancial results, are also subject to a process of internal review and disclosed to the ASX and through the Company website.
Principle 6: Respect the rights of shareholders
The Company has a formal Shareholder Communications Policy which is available on St Barbara’s website. Communication to shareholders is facilitated by the production of the Annual Report, Quarterly Reports, public announcements and the posting of ASX releases on the website immediately after their disclosure on the ASX. Shareholders can register on the website to receive notice of announcements. The Company believes considering the size of the shareholder base, the current announcement procedures and distribution methods, shareholders have the opportunity to be fully informed of Company activities.
In addition, all shareholders are encouraged to attend the Annual General Meeting of Shareholders and use the opportunity to ask questions and vote on the resolutions. The Company makes every endeavour to respond to questions from shareholders. The external auditor attends the Annual General Meeting and is available to answer questions in relation to the audit.
Principle 7: Recognise and manage risk
Risk Management and compliance are fundamental to sound Management, and oversight of such matters is an important responsibility of the Board.
The fi nancial reporting and control mechanisms are assessed during the year by Management, the Audit Committee and the external auditor. The Board has received the declaration from the Managing Director and the Chief Financial Offi cer, provided in accordance with section 295A of the Corporations Act 2001, that the Company’s fi nancial statements are founded on a sound system of risk Management and internal control and that the system is operating effectively in all material respects in relation to fi nancial reporting risks.
www.stbarbara.com.au – Annual Report 2010 :: 23

Corporate Governance continued
The Company also has policies in place dealing with risks in the areas of Health and Safety, Environment and Employee Relations. Management has regularly informed the Board about risks within the business and the effectiveness of the Company’s Management of those risks during the 2010 fi nancial year.
Utilising external consultants the Company continued an enterprise wide risk and opportunity assessment which it had commenced during the previous fi nancial year. The two year project is expected to deliver enhanced risk and opportunity reporting and control mechanisms, which are designed to ensure that strategic, operational, legal, reputational and fi nancial risks and opportunities are identifi ed, assessed and managed. All material business risks are being identifi ed and evaluated as part of the Enterprise Wide Risk and Opportunity Assessment program. A Risk Management Policy, framework and risk evaluation matrix have been established.
Principle 8: Remunerate fairly and responsibly
The Remuneration Committee Charter was reviewed and updated during the year.
Board Remuneration
The remuneration of the non-executive Directors is fi xed rather than variable. There are no retirement benefi ts paid to non-executive Directors. Independent expert remuneration advice is considered from time to time in determining remuneration for the Chairman, Managing Director and CEO and non-executive Directors. The fee scale for non-executive Directors for the 2010 fi scal year was unchanged from the scale which applied during the previous fi scal year.
Executive Remuneration
The Remuneration Committee provides recommendations to the Board which directs the Company’s remuneration policies. It utilises independent expert advice and surveys as appropriate, to benchmark overall Company and executive remuneration, packaging, and remuneration practices. The Committee ensures that a signifi cant proportion of each executive’s remuneration is linked to his or her performance and the Company’s performance.
This remuneration has both short and long-term components. Short Term Incentives are aligned to achievement of specifi c annual corporate and individual targets and goals directed at creating near term value and/or mitigating business risks. Long Term Incentives are aligned to a long term increase in shareholder wealth. The Company has in place a formal policy prohibiting executives from entering into transactions, which hedge or protect the unvested portion of any of their equity-based remuneration entitlements.
Key components of senior manager contracts, including details of potential termination payments are set out in on pages 47. Further details in relation to Director and Executive remuneration are set out in the Remuneration Report on pages 38 to 47 of the Financial Report.
Diversity
The Company actively pursues diversity in its approach to recruitment, selection, training and promotion of staff. It is currently detailing and developing those practices into a formal policy which will be supplemented with enhanced education and training. It will report on the outcomes of this development in greater detail in 2011.
24

Ore Reserves highlights – signifi cant increase in Gwalia ore reserves
1. Overall thirteen percent increase in total Company Ore Reserves net of production for FY10.
Total Company Ore Reserves as at 30 June 2010 increased signifi cantly year on year by 332,000 ounces of contained gold net of production, to 15 million tonnes at 5.8 grams per tonne of gold (g/t Au) for 2.9 million ounces of contained gold.
2. Increase in Gwalia Probable Ore Reserves of 195,000 ounces.
Gwalia Mine’s Probable Ore Reserves increased by 195,000 ounces of contained gold, (net of production), down to 1600 metres below surface, as a consequence of improvements in mining extraction factors, a reduction in cut-off grade from 4.5 grams per tonne of gold (g/t Au) to 4.2 g/t Au and improved mining stope designs.
3. Eighteen percent increase in King of the Hills ore reserves.
King of the Hills Probable Ore Reserves increased by 35,000 ounces to 230,000 ounces of contained gold, as a consequence of refi nements to geotechnical design and increases in Indicated Mineral Resources.
4. Details of total Ore Reserves as at 30 June 2010, together with a summary of changes from 30 June 2009, follow on pages 26 and 27.
Mineral Resources highlights – reduction in quantum, increase in quality.
1. Overall Mineral Resources grade of 5.0 g/t Au.
Total Company Mineral Resources as at 30 June 2010, including Measured, Indicated and Inferred categories, totalled 47 million tonnes of gold at 5.0 g/t Au for 7.7 million ounces of contained gold.
2. Gwalia Mine Mineral Resources increased.
Successful drilling at Gwalia during the year has increased Gwalia Mineral Resources by 99,000 ounces of contained gold, net of production.
3. Tarmoola previous open pit Mineral Resources removed.
The main change to Mineral Resources during the year was the recognition of the higher grade underground Mineral Resource at the King of the Hills deposit at Leonora in Western Australia. The deposit is partly contained within, and extends from, the former Tarmoola open pit mineral resources.
As a consequence, at current gold prices, the remaining low grade Tarmoola open pit mineral resource of 1.1 million ounces of contained gold was written off during the year.
Details of Mineral Resources as at 30 June 2010, follow on pages 28 and 29.
Ore Reserves and Mineral Resources StatementsJUNE 2010
www.stbarbara.com.au – Annual Report 2010 :: 25

Ore Reserves Statement as at 30 June 2010
St Barbara Limited’s total Ore Reserves as at 30 June 2010 totalled 15 million tonnes at 5.8 grams per tonne of gold (g/t Au) for 2.9 million contained ounces of gold (2009: 13 million tonnes @ 5.8 g/t Au for 2.6 million contained ounces of gold).
The gold price assumed in 2010 Ore Reserve calculations was A$1,000 per ounce (2009: A$1,075 per ounce FY09 production and A$850 per ounce thereafter).
The 2010 Ore Reserve estimates are based on:
• the Life of Mine design and schedules for Gwalia and Marvel Loch Underground mines,
• the Feasibility Study for King of the Hills Underground deposit, and
• no changes to the project design work completed in 2009 for Tower Hill Underground at Leonora and the Nevoria district at Southern Cross. The Nevoria district includes Nevoria Underground and Nevoria West Open Pit. Studies are continuing on all these deposits.
The increase of 332,000 contained ounces from the total 2009 Ore Reserve estimates is attributable to:
• 230,000 contained ounces from the inclusion of the King of the Hills Probable Ore Reserve estimate. This increased from the previously announced Ore Reserve estimate containing 195,000 ounces in March 2010;
• 309,000 contained ounces increase at Gwalia resulting from changes in the mining extraction factors, cut-off grade and stope designs;
• ( -5,000) contained ounces reduction at Marvel Loch Underground resulting from changes in geology and mine design; and
• (-202,000) contained ounces reduction from mining production depletion, (-114,000 contained ounces at Gwalia, -74,000 contained ounces at Marvel Loch Underground and -12,000 contained ounces in stockpile movements).
Table 1 Summary of Proved and Probable Ore Reserves as at 30 June 2010
RegionCategory Proved Probable Total
Project TonneskT
Gold grade Au g/t
Gold k oz
Tonnes kT
Gold grade Au g/t
Gold k oz
Tonnes kT
Gold grade Au g/t
Gold k oz
Southern Cross Marvel Loch 328 2.7 29 1,463 3.6 169 1,790 3.4 198
Nevoria West 0 0.0 0 500 3.0 48 500 3.0 48
Nevoria Underground 0 0.0 0 1,790 3.7 210 1,790 3.6 210
Other 1,376 1.0 44 0 0.0 0 1,376 1.0 44
Total Southern Cross 1,703 1.3 73 3,753 3.5 427 5,456 2.8 500
Leonora Gwalia Deeps 0 0.0 0 6,326 9.0 1,838 6,326 9.0 1,838
Tower Hill 0 0.0 0 2,240 4.7 338 2,240 4.7 338
King of the Hills 0 0.0 0 1,670 4.3 230 1,670 4.3 230
Total Leonora 0 0.0 0 10,236 7.3 2,406 10,236 7.3 2,406
Total All Regions 1,703 1.3 73 13,988 6.3 2,833 15,692 5.8 2,906
Notes1. The Ore Reserve estimates used a gold price of A$1,000/oz.2. All data is rounded to two signifi cant fi gures. Differences in summations will occur due to rounding.
3. The ore reserves estimates have been estimated and compiled under the direction of Mr Peter Fairfi eld and Mr Kous Kirsten.
4. Mr Fairfi eld and Mr Kirsten who are Members of The Australasian Institute of Mining and Metallurgy are full time employees of St Barbara Limited.
5. Mr Fairfi eld and Mr Kirsten have suffi cient experience relevant to the style of mineralisation, type of deposits under consideration and for the activity being undertaken to qualify as Competent Persons as defi ned by the 2004 edition of the ‘Australasian Code for Reporting of Mineral Resources and Ore Reserves’.
6. Mr Fairfi eld and Mr Kirsten consent to the inclusion in the report of the matters based on their information in the form and context in which it appears.
7. “Other” relates to surface stockpiles valued at $1,075/oz.
8. Gwalia and Marvel Loch are operating underground mines.
9. Gwalia cut-off grade applied of 4.2 g/t Au.
10. A variable cut-off grade has been applied to each lode to deliver an average (annualised) grade greater than 3.1 g/t to achieve the optimal business case.
Ore Reserves and Mineral Resources Statements continued
26

Table 2: Ore Reserve Changes in contained gold ounces from June 2009 to June 2010
2009
Au (Koz)DepletionAu (Koz)
AdditionAu (Koz)
2010Au (Koz)
VarianceAu (Koz)
Comment
Southern Cross
Marvel Loch 277 -125 46 198 -79 Mining depletion was partially offset by 51Koz added to Ore Reserve and mined during the year. There was also a 5Koz reduction in ounces contained within the designed Ore Reserve. A variable cut-off grade has been applied to each lode to deliver an average (annualised) grade greater than 3.1 g/t to achieve the optimal business case.
Nevoria West -51 51 0 51 Koz added to Ore Reserve and mined during the year.
Nevoria Underground 48 0 0 48 0 No change – 2009 estimate carried forward.
Design cut-off grade of 0.8 g/t was used for the Ore Reserve calculations.
Other 210 0 0 210 0 No change – 2009 estimate carried forward.
Design cut-off grade of 3.0 g/t was used for the ore reserve calculations.
Total Southern Cross 56 -12 0 44 -12
Leonora
Gwalia Deeps 1,643 -114 309
Of which:
14
10
285
1,838 195 Mining depletion was offset by ounces added to the Ore Reserve during the year and modifi ed stope designs to allow for a 42 degree footwall to accommodate drilling.
Reduction in planned dilution percentage.
Increase in planned dilution grade.
Increase in mining extraction factors and resource increases in upper SWB
Design cut-off grade of 4.2 g/t was used for the Ore Reserve calculations.
Tower Hill 338 0 0 338 0 No change – 2009 estimate carried forward; studies are continuing.
Design cut-off grade of 3.0 g/t was used for the Ore Reserve calculations.
King of the Hills 0 0 230 230 230 Increase of 35 Koz from the March Pre-feasibility Study published Ore Reserve estimate of 195 Koz.
Ounces have been included as a result of refi nement of the geotechnical design guidelines and improvements to the Mineral Resource model.
Design cut-off grade of 2.8 g/t for Open Stoping and 3.0 g/t for Cut and Fill were used for the Ore Reserve calculations.
Other 2 -2 0 0 -2 Gwalia surface stockpile depletion.
Total Leonora 1,980 -116 539 2,406 423
Total All Regions 2,574 -253 585 2,906 332
www.stbarbara.com.au – Annual Report 2010 :: 27

Mineral Resource Statement as at 30 June 2010
As at 30 June 2010, total Mineral Resources including Measured, Indicated and Inferred categories, comprised 47,580,000 tonnes at 5.0 grams per tonne of gold (g/t Au) for 7,651,000 ounces of contained gold.
Gwalia Mineral Resources increased by 99,000 ounces of contained gold, net of depletion, primarily as a result of the successful drilling for upper extensions to South West Branch lode.
The identifi cation of the higher grade underground Mineral Resources at the King of The Hills gold deposit at Leonora has had a signifi cant impact on the previously published (2009) Tarmoola Mineral Resource, which had been estimated as a potential open pit resource. The King of the Hills underground resource is partly contained within and extends from, the former Tarmoola open pit resource.
The delineation of the higher grade King of the Hills underground resource separately has consequently resulted in the remaining Tarmoola open pit resource not being viable at current gold prices. Consequently, the Company has made the decision to remove the remaining low grade Tarmoola Mineral Resource from the Company’s Mineral Resource Inventory, resulting in a reduction in Mineral Resources of 1.7 million ounces of contained gold.
A review of the Kailis gold deposit was also completed over the course of the year. The fi ndings of the review have resulted in the removal of Kailis from the Mineral Resource Inventory, resulting in a reduction of 450,000 tonnes at 3.6g/t Au for 52,000 ounces of contained gold.
As a consequence of these changes, the total Mineral Resources Inventory has reduced to 7.7 million ounces of contained gold (2009: 9.5 million ounces of contained gold), but at a signifi cantly higher grade of 5.0 g/t Au (2009: 2.9 g/t Au).
Refer to Table 3 below.
Table 3 Mineral Resources Summary June 2010
RegionCategory Measured Indicated Inferred Total
Project TonneskT
Gold grade
g/t
Gold k oz
Tonnes kT
Gold grade
g/t
Gold k oz
Tonnes kT
Gold grade
g/t
Gold k oz
Tonnes (kt)
Gold grade
g/t
Contained Gold
(k oz)
Southern Cross
Marvel Loch 360 3.9 45 4,420 3.2 456 270 5.2 45 5,050 3.4 546
Nevoria 0 0.0 0 3,520 3.8 426 560 4.1 74 4,080 3.8 500
Transvaal 0 0.0 0 1,630 4.8 249 1,800 4.9 286 3,430 4.9 535
Jaccoletti 0 0.0 0 0 0.0 0 720 5.4 126 720 5.4 126
Axehandle 0 0.0 0 0 0.0 0 2,080 2.0 131 2,080 2.0 131
Cornishman 0 0.0 0 120 4.4 17 0 0.0 0 120 4.4 17
Edwards Find, EFN & Tamarin
0 0.0 0 20 1.6 1 420 3.8 51 440 3.7 52
Yilgarn Star 0 0.0 0 390 6.5 82 0 0.0 0 390 6.5 82
Other (7) 40 8.6 11 2,940 1.8 173 630 4.1 84 3,610 2.3 268
Total Southern Cross 400 4.4 56 13,040 3.3 1,404 6,480 3.8 797 19,920 3.5 2,257
Ore Reserves and Mineral Resources Statements continued
28

Table 3 Mineral Resources Summary June 2010 continued
RegionCategory Measured Indicated Inferred Total
Project TonneskT
Gold grade
g/t
Gold k oz
Tonnes kT
Gold grade
g/t
Gold k oz
Tonnes kT
Gold grade
g/t
Gold k oz
Tonnes (kt)
Gold grade
g/t
Contained Gold
(k oz)
Leonora Gwalia Deeps
0 0.0 0 10,830 8.2 2,844 2,120 11.0 747 12,950 8.6 3,591
Gwalia Int & West Lode
0 0.0 0 10 6.2 2 1,260 6.0 244 1,270 6.0 246
King of The Hills
0 0.0 0 1,990 5.4 347 470 4.7 71 2,460 5.3 418
Tower Hill 0 0.0 0 4,750 4.7 716 330 4.3 46 5,080 4.7 762
Harbour Lights
0 0.0 0 0 0.0 0 2,580 3.3 274 2,580 3.3 274
Other (6) 990 1.0 33 2,280 0.9 69 50 0.6 1 3,320 1.0 103
Total Leonora 990 1.0 33 19,860 6.2 3,978 6,810 6.3 1,383 27,660 6.1 5,394
Total All Regions 1,390 2.0 89 32,900 5.1 5,382 13,290 5.1 2,180 47,580 5.0 7,651
Notes1. Identifi ed Mineral Resources have been estimated under the direction of Mr Ben Bartlett (MAusIMM, 990986, MAIG) who qualifi es as the Competent Person.
2. Mr Bartlett has suffi cient experience relevant to the style of mineralisation and type of deposits under consideration and to the activities which were undertaken to qualify as Competent Persons as defi ned in the “Australasian Code for Reporting of Mineral Resources and Ore Reserves”. Ben has consented to the inclusion in the report of the matters based on their information in the form and context in which they appear.
3. Mineral Resources updated during the ‘09/’10 Financial Year have been estimated using economic cut-off grades and mining optimisations based on an AU$1,500/oz gold price.
4. The King of the Hills resource estimate is calculated using a 3.0g/t cut-off below the Tarmoola Open Pit and constrained within mineralisation domains.
5. Identifi cation of King of the Hills Mineral Resource (418 Koz contained gold) within the formerly quoted Tarmoola open pit Mineral Resource has resulted in the remaining low grade open pit resource being unviable at forecast gold prices. The Company has decided to remove the remaining Tarmoola open pit resource from the Company’s Mineral Resource Inventory, (-2.1 Moz contained gold).
6. The Tower Hill resource estimate is calculated using a 0.8g/t cut-off within an optimised $1,200 pit shell, and a 3.2g/t cut-off below the optimised pit shell.
7. The Transvaal mineral resource estimate is calculated using a graduated cut off grade of 0.5 to 0.9g/t in oxide and 0.7 to 1.0g/t in fresh rock within an optimised $1,200 pit shell and a 2.6g/t cut-off below the optimised pit shell.
8. Mineral Resource variances compared to the June ’09 Mineral Resource Statement are primarily attributed to mining depletion, cut-off grade changes, write down of low grade open pit resources and some re-interpretation of the resources. Notable variances to the 2009 Mineral Resource Estimate are Southern Cross: Marvel Loch (-125,000 oz) and at Leonora: Tarmoola (-2.1 Moz); Kailis; (-52,000oz), King of The Hills (+418,000oz) and Gwalia (99,000oz).
9. Mineral Resources carried over unchanged from June’09 include Southern Cross District: Nevoria (500,000oz); Axehandle (130,000 oz); Jaccoletti (130,000oz); Edwards Find, Edwards Find North and Tamarin (52,000oz); Transvaal (530,000oz); Ruapehu (55,000oz); New Zealand Gully (24,000oz); Cornishman (17,000oz); GVG – South Burbidge (13,000oz); GVG Lode 1 (98,000oz); Red wing (34,000oz) and Yilgarn Star (82,000 oz). Leonora District: Gwalia Intermediates (238,000 oz); Rainbow (37,000oz); Royal Arthur Bore (12,000oz); Tarmoola Stockpile (30,000oz); McGraths (21,000); Tower Hill (760,000oz) and Harbour Lights (270,000 oz). Resource reviews for all of these resources along with Nevoria, Transvaal and Edwards Find are planned during the current 2010 fi nancial year. Combined these resources total 3.1 Moz or 40% of the Company’s Mineral Resource Inventory.
10. All numbers have been rounded to tonnes (10,000) and ounces (1,000) and this may result in some normal rounding discrepancies.
11. Southern Cross Other comprises 7 resources including: Fraser’s South, GVG Lode 1, New Zealand Gully, Ruapehu, GVG South Bronco, Various Stockpiles (Measured), and Redwing.
12. Leonora Other comprises 6 resources including: McGraths, Tarmoola s/pile, Royal Arthur Bore, Rainbow (Measured), Gwalia and Tower Hill ROM s/piles
13. Mineral Resource updates completed by St Barbara Ltd during the 09/10 fi nancial year include: Gwalia Deeps (Above 1320 mbs), King of The Hills and Marvel Loch Underground, All the remaining Mineral Resources remain unchanged to the June 2009 estimates.
Competent Persons StatementReferences to Mineral Resources contained in this report have been compiled under the supervision of Mr Ben Bartlett. Mr Bartlett is a Member of The Australasian Institute of Mining and Metallurgy and is a full time employee of the Company. Mr Bartlett has suffi cient experience relevant to the style of mineralisation, type of deposit under consideration and to the activity being undertaken to qualify as Competent Person as defi ned in the 2004 edition of the ‘Australasian Code for Reporting of Mineral Resources and Ore Reserves’ (JORC Code). Mr Bartlett consents to the inclusion in the report of the matters based on their information in the form and context in which they appear. Members of the Company’s team, including external consultants, preparing Mineral Resource estimates under Mr Bartlett’s supervision all qualify as Competent Persons.
References to Ore Reserves presented in this document have been produced in accordance with the Australasian Code for Reporting of Mineral Resources and Ore Reserves, 2004 edition (JORC Code) under the direction of Mr. Peter Fairfi eld and Mr. Kous Kirsten. Mr. Fairfi eld and Mr. Kous Kirsten are Members of The Australasian Institute of Mining and Metallurgy and are full time employees of St Barbara. Mr. Fairfi eld and Mr. Kirsten have suffi cient experience relevant to the style of mineralisation, type of deposit under consideration and to the activity being undertaken to qualify as a Competent Persons as defi ned in the JORC Code. Mr. Fairfi eld and Mr. Kirsten consent to the inclusion in this document of the matters based on their information in the form and context in which it appears. Members of the Company’s team preparing Ore Reserves estimates under Mr. Fairfi eld’s and Mr. Kirsten’s supervision all qualify as Competent Persons.
www.stbarbara.com.au – Annual Report 2010 :: 29

30
Financial Statements
30 Financial Statements
31 Directors’ Report
49 Auditor’s Independence Declaration
50 Financial Report
51 Consolidated Income Statement
52 Consolidated Statement of Financial Position
53 Consolidated Statement of Comprehensive Income
54 Consolidated Statement of Changes in Equity
55 Consolidated Cash Flow Statement
56 Notes to the Consolidated Financial Statements
102 Directors’ Declaration
103 Independent Audit Report
105 Shareholder Information
108 Corporate Directory

www.stbarbara.com.au – Annual Report : : 31
Directors’ Report
The Directors present their report on the Group “St Barbara Group”, consisting of St Barbara Limited and the entities it controlled at the end of, or during, the fi nancial year ended 30 June 2010.
Directors
The following persons were Directors of St Barbara Limited at any time during the year and up to the date of this report:
• S J C Wise Chairman• T J Lehany Managing Director & CEO• D W Bailey Non-executive director• B J Gibson Non-executive director• P C Lockyer Non-executive director• R K Rae Non-executive director
The qualifi cations, experience and special responsibilities of the directors is presented on pages 36 to 37.
Principal activities
During the year the principal activities of the Group were mining and the sale of gold, mineral exploration and development. There were no signifi cant changes in the nature of activities of the Group during the year.
Dividends
There were no dividends paid or declared during the fi nancial year.
Overview of Results
St Barbara completed the 2010 fi nancial year in a strong fi nancial position, reporting an underlying net profi t after tax of $14,547,000 (2009: $209,000), cash on hand at 30 June 2010 of $102,157,000 (2009: $53,692,000) and debt of $15,909,000 (2009: $97,541,000). In the past twelve months the Company achieved signifi cant improvement in operational performance and restructured its statement of fi nancial position by repaying a substantial amount of its debt.
The result reported by the Group for the year ended 30 June 2010 was a net loss after tax of $40,188,000 (2009: net loss of $76,344,000), which included signifi cant items amounting to a net loss of $54,735,000 (2009: net loss of $76,553,000). The consolidated result for the year is summarised as follows:
30 June 10 30 June 09 $’000 $’000
Sales revenue 296,760 281,129
EBITDA (including signifi cant items) 33,793 39,701
EBIT (including signifi cant items) (38,081) (70,403)
Reported net loss after tax for the year (40,188) (76,344)
Total net signifi cant items (54,735) (76,553)
EBITDA – excluding signifi cant items 73,163 52,445
EBIT – excluding signifi cant items 16,654 6,150
Underlying net profi t after tax 14,547 209

32
Directors’ Report continued
The signifi cant items are detailed in the following table.
30 June 10 30 June 09Signifi cant Items $’000 $’000
Net realised/unrealised (loss)/gain on gold options (1) (19,513) 1,515
Write down of listed investments to fair value – (6,192)
Gain on sale of available for sale assets (2) 2,724 –
Included within corporate and support costs
• Restructuring provision – (1,957)
• Redundancy payments – (3,877)
Asset impairment write-downs
• Open pit mine development – (16,904)
• Marvel Loch underground operating development (3) (22,581) –
• Southern Cross plant and equipment (3) (11,583) (40,488)
• Marvel Loch capitalised exploration (3) (3,782) (8,650)
(54,735) (76,553)
(1) The gold bought put and sold call options (collar structure) were put in place during the year to manage the Australian dollar gold price risk associated with 250,000 ounces of future King of the Hills production. At 30 June 2010 the unrealised mark-to-market value of the collar structure was negative $38,674,000. In accordance with accounting standards, the unrealised loss related to time value of the options of $19,513,000 was recognised immediately in the income statement. The unrealised loss related to the intrinsic value of the options of $19,161,000 was recognised in the hedging reserve in equity. Over time this unrealised mark-to-market loss will reverse either through a change to the mark-to-market value of the options or maturity of the contracts.
(2) At 31 December 2008 an impairment loss of $6,192,000 in relation to the investment in Bendigo Mining Limited was recognised in the income statement. A mark-to-market gain as at 30 June 2009 in relation to this investment of $6,687,000, which would ordinarily have reversed the impairment loss recognised in the income statement in the period ended 31 December 2008, was recorded in the investment fair value reserve in accordance with Australian Interpretation 10. In August 2009 the investment in Bendigo Mining Limited was sold for $9,909,000, resulting in the transfer of the amount in the investment fair value reserve to the income statement, giving a net gain on sale of $2,724,000 and recognised as “Other Income”.
(3) Based on an assessment of the Southern Cross operations cash-generating unit at 30 June 2010, an impairment write down was taken against assets of the unit. The impairment write down was caused by lower than expected future net cash fl ows from the Southern Cross operations as a result of a reduction in the estimated mine life, based on drilling during the year that encountered pegmatite intrusions which closed off the resources potential. The revised cash fl ow estimates from the base case mine plan no longer supported full recovery of the carrying value of the Southern Cross cash-generating unit assets, including capitalised mine operating development, plant and equipment and capitalised exploration.
The major achievements in the year included:
• Restructured the balance sheet, with the repayment of convertible notes worth $75.9 million, funded from proceeds from an equity raising completed in November and December 2009;
• Funds in place from the equity raising to develop the King of the Hills mine at Leonora and give working capital fl exibility;
• Divested the Company’s 9.7 per cent holding in Bendigo Mining Limited for proceeds of $9.9 million;
• Established new banking facilities with National Australia Bank Limited (NAB) and Barclays Bank PLC (Barclays) secured by assets of the Group. NAB provides a $25 million performance bond facility, replacing a cash-backed facility. Barclays and NAB provided a 250,000 ounce hedge facility to underpin the return from the King of the Hills operation; and
• Executed a gold bought put option and sold call option (zero cost collar structure) to provide price protection for King of the Hills production. The collar structure comprises gold bought put options at a strike price of $1,425 per ounce and gold sold call options at a strike price of $1,615 per ounce over 250,000 ounces. The collar structure means that King of the Hills production will receive a minimum gold price of $1,425 per ounce and benefi t from higher spot gold prices up to $1,615 per ounce.

www.stbarbara.com.au – Annual Report : : 33
Directors’ Report continued
Development of the Gwalia mine at Leonora continued during the year, with the primary access, the Hoover Decline, reaching 1310 metres below surface. The majority of the production in the year was sourced from the lower grade South Gwalia Series stopes between 1050 and 1220 levels. The grades will improve as the proportion of South West Branch stopes increases in fi nancial year 2011. The Gwalia mine produced 621,930 tonnes in its fi rst full year of operation, having commenced production in October 2008, for 109,148 ounces. In March 2010 the mill resumed full time operation due to the higher tonnage from the Gwalia underground and in preparation for the introduction of third party ore on a trial basis during the June 2010 quarter. The trial treatment of 36,000 tonnes of open pit ore from Navigator Resources Limited’s Mertondale operations was processed in the June 2010 quarter on a batch basis. The process plant performed reliably throughout the year, consistently returning 95% recovery from Gwalia ore.
During the year Southern Cross operations successfully transitioned to campaign milling and ceased all open pit mining. Treatment of open pit stockpiles continued throughout the year, and by June 2010 Marvel Loch underground mine became the exclusive ore source for Southern Cross operations. The Marvel Loch underground mine continued to perform well during the year producing 969,519 tonnes, which was marginally down on the previous year. Production for the year was 121,870 ounces (2009: 156,105 ounces). Treatment of lower grade ore stockpiles, mined in the previous year, reduced the average grade of ore processed in the year. Treatment of high-grade Mercury open pit stockpiles during the year reduced overall recoveries from the plant, but by year end with depletion of Mercury stockpiles and commissioning of an Acacia Reactor in the gravity circuit, recoveries stabilised at 93%.
Other revenue of $6,765,000 (2009: $5,411,000) comprised mainly interest earned during the year of $5,210,000 (2009: $3,044,000). During the second half of the year the Company had substantial cash held on deposit ahead of the repayment and redemption of convertible notes. During the year the Company earned interest at an average rate of 4.69% compared to the average cash rate of 3.74%.
The Leonora cash cost for the year was $686 per ounce (2009: $719 per ounce), refl ecting the benefi t of a full year of production from Gwalia and of the cessation of high cost open pit mining in the previous year. The Southern Cross cash cost for the year was $883 per ounce, which was in line with the previous year. Total cash operating costs at Leonora operations of $74,470,000 were higher in the year compared with the prior year (2009: $52,438,000), due mainly to increased mining activity for a full twelve months at the
Discussion and Analysis of Operating Results and the Income Statement
For the year ended 30 June 2010 St Barbara reported an underlying profi t after income tax of $14,547,000 (2009: underlying profi t of $209,000), representing a substantial improvement on the previous year. The higher underlying profi t for the year was attributable to increased production at the Gwalia mine and a strong Australia dollar gold price in the second half of the year.
The reported result for the year was a net loss after income tax of $40,188,000 (2009: net loss of $76,344,000), which included signifi cant items amounting to a loss of $54,735,000 (2009: loss of $76,553,000). The signifi cant items in the year comprised the unrealised loss on gold put and call options of $19,513,000, asset impairment write offs in relation to the Southern Cross operations of $37,946,000 and a gain on the disposal of Bendigo Mining Limited shares and other available-for-sale assets of $2,724,000.
Total sales revenue of $296,760,000 (2009: $281,129,000) was generated from gold sales of 237,264 ounces (2009: 231,318 ounces) at an average achieved gold price of A$1,244 per ounce (2009: A$1,210 per ounce). Production at Leonora was 109,148 ounces (2009: 82,795 ounces) for the year. Production at Southern Cross was 121,870 ounces (2009: 156,105 ounces) for the year. A summary of the production performance for the year ended 30 June 2010 is provided in the table below.
Details of 2010 Production Performance
Southern Cross Leonora
2009/10 2008/09 2009/10 2008/09
Open PitOre Mined t 23,413 1,119,997 – 372,206
Grade g/t 5.7 1.9 – 1.3
UndergroundOre Mined t 969,519 1,003,202 621,930 304,544
Grade g/t 4.0 3.8 5.7 6.9
Ore Milled t 1,279,751 2,233,367 632,573 835,843
Grade g/t 3.4 2.5 5.6 3.3
Recovery % 86 88 95 94
GoldProduction oz 121,870 156,105 109,148 82,795
Cash Cost (1) A$/oz 883 888 686 719
Total Cost (1) A$/oz 1,070 1,040 945 948
(1) Before signifi cant items
34
Directors’ Report continued
The realised gain on available for sale assets of $2,724,000 (2009: unrealised loss of $6,332,000) comprises mainly the gain on the sale of Bendigo Mining Limited shares.
Discussion and Analysis of the Cash Flow Statement
Operating activitiesCash fl ow from operating activities for the year was $81,805,000 (2009: $24,324,000), representing a signifi cant increase compared to the prior year. Increased operating cash fl ows were attributable to higher receipts from customers, refl ecting the benefi t of higher gold production and a strong average achieved gold price, and lower payments to suppliers and employees. Payments to suppliers and employees were signifi cantly lower than the prior year at $209,774,000 (2009: $251,928,000) due mainly to the cessation of open pit mining at both Leonora and Southern Cross. Interest received of $4,575,000 (2009: $2,940,000) was higher than in the prior year due to increased level of cash on hand during the second half of the year. Interest paid in the year of $4,829,000 (2009: $7,653,000) was lower than the prior year as a result of the buy-back of convertible notes during the year.
Investing activitiesNet cash fl ows used in investing activities amounted to $93,621,000 (2009: $128,328,000) for the year. The prior year included substantial expenditure to complete construction of the Gwalia project, which was commissioned in October 2008. Investing expenditure incurred during the year was in the following major areas:
• Underground mine development and infrastructure at Gwalia – $57,739,000;
• Underground mine development and infrastructure at Marvel Loch – $27,223,000;
• Pre-commissioning expenditure at King of the Hills – $2,125,000;
• Purchase of property, plant and equipment at both operations – $10,210,000; and
• Exploration expenditure – $5,821,000.
During the year a decision was taken to develop the King of the Hills project as a supplemental ore source for the Leonora process plant. Pre-development expenditure incurred in the June 2010 quarter included refurbishment of offi ces at the King of the Hills site, dewatering at the Tarmoola open pit and expansion at the Leonora accommodation village.
Investing activities included proceeds from the sale of the Bendigo Mining shares amounting to $9,907,000.
Gwalia underground mine. At Southern Cross operations total cash operating costs, before signifi cant items, were $110,637,000 (2009: $131,122,000). The lower Southern Cross operating costs was due to the cessation of open pit mining in the fi rst quarter of the year.
Exploration expensed in the income statement in the year was $5,184,000 (2009: $13,442,000), with total exploration expenditure amounting to $7,946,000 (2009: $15,990,000). The Company policy in relation to accounting for exploration permits capitalisation of expenditure where it results in an increase in reserves and is likely to be recouped from successful development and exploitation of the area of interest, or alternatively, by its sale. The Company reduced the exploration budget for the year to allow consolidation of the exploration efforts and to focus on proof of concept work to better delineate drilling targets.
Corporate & support costs for the year amounted to $21,382,000 (2009: $27,089,000), which included expenses related to the corporate offi ce, rates and taxes associated with the Company’s landholdings, compliance costs and operations support and technical services. In the previous year corporate & support costs included redundancy and restructuring costs and provisions totalling $5,834,000.
The royalties expense for the year of $11,790,000 (2009: $11,042,000) comprised the state royalty in Western Australia and payments for a corporate royalty on gold revenue.
Depreciation and amortisation of fi xed assets and capitalised mine development totalled $71,874,000 (2009: $110,104,000) for the year, which included $15,365,000 (2009: $49,138,000) in signifi cant items. The higher underlying depreciation and amortisation charge in the year was attributable to increased mine development at Gwalia and the production for a full twelve months. The depreciation and amortisation reported in signifi cant items represents the impairment write off of plant and equipment and capitalised exploration at Southern Cross.
Finance costs were lower than the previous year at $7,317,000 (2009: $8,996,000) due mainly to the buy-back of convertible notes during the year.
The net loss on derivatives reported in the income statement of $19,513,000 represents the unrealised loss related to time value of gold put and call options as at 30 June 2010. The gold put and call options provide price protection over 250,000 ounces of King of the Hills production. The mark-to-market value of the gold put and call options is calculated at each reporting date and will fl uctuate over time to maturity of the contracts.

www.stbarbara.com.au – Annual Report : : 35
Directors’ Report continued
Signifi cant changes in the state of affairs
The signifi cant changes in the state of affairs of the Company during the fi nancial year are as follows:
a) Net loss for the yearThe Group reported a net loss for the year of $40,188,000, which included signifi cant items amounting to a loss of $54,735,000. The net loss for the year increased the accumulated losses of the Group to $248,852,000 at 30 June 2010.
b) Impairment write-offAt 30 June 2010 the Company recognised an impairment write-off in relation to plant and equipment, mine development expenditure and capitalised exploration at Southern Cross operations amounting to $37,946,000.
c) Derivative fi nancial liabilitiesDuring the year the Company bought gold put options at a strike price of A$1,425 per ounce and sold gold call options at a strike price of A$1,615 per ounce (zero cost collar structure) to provide price protection over 250,000 ounces of King of the Hills production. The mark-to-market value of the collar structure at 30 June 2010 was negative $38,674,000, which is refl ected in current and non-current liabilities.
d) Repayment and redemption of convertible notesDuring the year the Company applied the proceeds from an equity raising to repay and redeem convertible notes amounting to $75,588,000. At 30 June 2010 the outstanding balance in convertible notes was $1,200,000, and this outstanding balance was compulsorily redeemed subsequent to the balance date in July 2010.
e) Changes in issued capitalIn November 2009 the Company received net proceeds from the issue of new shares to institutional shareholders of $70,792,000. A total of 274,094,788 new shares were issued at an issue price of $0.27 per share.
In December 2009 the Company received net proceeds from the issue of new shares to retail shareholders of $48,029,000. A total of 184,640,669 new shares were issued at an issue price of $0.27 per share.
Likely developments and expected results of operations
The Company will continue to focus on achieving profi table production with an emphasis on lower cost, higher margin gold production in Australia. The Company will complete the development of the King of the Hills mine at Leonora in fi nancial year 2011 and commence production in the June 2011 quarter. The future of the Southern Cross operations is under review with the base case remaining mine life having reduced to twenty two months from 1 July 2010.
Financing activitiesNet cash fl ows from fi nancing activities were $60,281,000 (2009: $122,179,000), with major movements in cash fl ows including:
• Net proceeds from equity raisings during the year of $118,821,000 in November and December 2009;
• Release of cash previously held as security for a bank guarantee facility of $23,951,000;
• Payments for the buy-back and redemption of convertible notes during the year of $75,588,000; and
• Scheduled repayments of fi nance leasing and equipment fi nancing facilities amounting to $7,437,000.
Discussion and Analysis of the Statement of Financial Position
Net Assets and Total EquitySt Barbara’s net assets and total equity increased during the year by $52,996,000 to $349,468,000, due mainly to proceeds from the equity raising completed in November and December 2009.
The available cash balance at 30 June 2010 was $102,157,000 (2009: $53,692,000) refl ecting the benefi t of the proceeds from the equity raising and release of cash previously held as security for a bank guarantee facility.
Property, plant and equipment, mine properties and capitalised exploration had a combined value at 30 June 2010 of $334,361,000 (2009: $317,660,000), which was after the impairment write off of $15,365,000 taken against Southern Cross plant and equipment and capitalised exploration. The impairment write off at Southern Cross also included deferred operating mine development of $22,581,000.
Net debtNet debt, comprising total borrowings less cash on hand, was net cash of $86,248,000 at 30 June 2010 (2009: net debt of $43,849,000). During the year proceeds from the equity raising was used to repay and redeem convertible notes amounting to $75,588,000. The remaining debt reported at 30 June 2010 comprised the remaining convertible notes and the outstanding balance on fi nance leases and an equipment fi nance facility, used to fund the acquisition of assets within the mining operations.

36
Directors’ Report continued
Special responsibilities
Chairman of the BoardMember of the Remuneration, Audit and Health & Safety Committees
Interest in shares and options
Mr Wise has a relevant interest in 6,836,330 fully paid ordinary shares of the Company.
Timothy J Lehany B.E., MBA, MAusIMMManaging Director and Chief Executive Offi cerMr Lehany is a mining engineer with extensive operating experience over the past twenty years with a number of mining companies, including Newcrest Mining and WMC Ltd. His roles covered gold, base metal and nickel mines.
Other current public company directorships
Nil
Former public company directorships in last 3 years
Nil
Special responsibilities
Nil
Interest in shares and options
Mr Lehany has a relevant interest in 1,006,923 fully paid ordinary shares and holds 7,366,419 unlisted options to acquire fully paid ordinary shares, subject to performance hurdles, as detailed later in this Report.
Douglas W Bailey, BBus (Acc), CPA, ACIS Non-Executive DirectorMr Bailey was the Chief Financial Offi cer of Woodside Petroleum Ltd between 2002 and 2004 and previously, was an Executive Director of Ashton Mining Limited from 1990 to 2000, including the last 3 years as Chief Executive Offi cer. He was also a Non-Executive Director of Aurora Gold Ltd for the period 1993-2000.
Other current public company directorships
Tap Oil Limited
Former public company directorships in last 3 years
Nil
Special responsibilities
Chairman of the Audit CommitteeMember of the Remuneration Committee
Interest in shares and options
Mr Bailey has a relevant interest in 181,478 fully paid ordinary shares.
Further information about anticipated developments in the operations of the Company and the anticipated results of those operations in future fi nancial years have not been included in this report because there is insuffi cient certainty to warrant disclosure.
Regulatory environment
The Company’s mining activities are all in Western Australia and are governed by Western Australian legislation, including the Mining Act 1978, the Mines Safety and Inspection Act 1994, Dangerous Goods Safety Act 2004 and other mining related and subsidiary legislation. The Group is subject to signifi cant environmental regulation, including, inter alia, the Western Australian Environmental Protection Act 1986, Contaminated Sites Act 2003, Wildlife Conservation Act 1950, Aboriginal Heritage Act 1972 and the Commonwealth Environmental Protection and Biodiversity Conservation Act 1999, as well as safety compliance in respect of its mining and exploration activities.
The Company is registered under the National Greenhouse and Energy Reporting Act under which it is required to report energy consumption and greenhouse gas emissions for its operations for the twelve months ending 30 June. The Company has established data collection systems and processes to meet these reporting obligations.
Information on Directors
S J Colin Wise LL.B, FAICD, FAusIMMChairman – Non-ExecutiveMr Wise is an experienced corporate lawyer, consultant and company director with signifi cant expertise in the mining and exploration industry and resources, energy and corporate sectors. He spent 24 years with WMC Limited, 10 of which as General Counsel and subsequently, 4 years as Counsel to a New York law fi rm. He has extensive practical experience in Australia and internationally with a wide range of corporate, operational and legal matters.
He has been Chairman of St Barbara since mid 2004, and is a Fellow of both the Australian Institute of Company Directors and the Australasian Institute of Mining and Metallurgy. He is a member of the Advisory Board to the Dean of Medicine, Nursing and Health Sciences at Monash University and was a Non-Executive Director for 5 years of Southern Health, the largest health care service in Victoria, Chair of its Quality Committee, and a member of the Audit Committee.
Other current public company directorships
Nil
Former public company directorships in last 3 years
Nil

www.stbarbara.com.au – Annual Report : : 37
Directors’ Report continued
Robert K Rae B.Com (Hons), FAICD Non-Executive DirectorMr Rae is a Director and Partner of McClintock Associates, a private investment bank and advisory fi rm and has extensive industry and corporate experience. Mr Rae has held previous directorships within the mining industry, including Plutonic Resources Limited, Ashton Mining Limited, WA Diamond Trust and Centralian Minerals Limited. Mr Rae is also a member of the Salvation Army Advisory Board.
Other current public company directorships
McClintock Associates Securities LimitedSCEGGS Darlinghurst LimitedSHEM Limited
Former public company directorships in last 3 years
Nil
Special responsibilities
Member of the Remuneration CommitteeMember of the Audit Committee
Interest in shares and options
Mr Rae has a relevant interest in 253,855 fully paid ordinary shares of the Company.
Qualifi cations and experience of the company secretary
Ross J Kennedy BComm, Grad.Dip – Company Secretarial Practice, ACA, FTIA, MAusIMM, FAICD, ACIS Company SecretaryMr Kennedy has more than 23 years experience as a public company secretary and has held a number of public company directorships in resources and technology companies. He has extensive experience in corporate management, including risk management, corporate governance, fi nance, accounting, commercial negotiations, takeovers, legal contracts, land management, human resources, statutory compliance and public reporting.
Barbara J Gibson B.Sc, FTSE, MAICD Non-Executive DirectorMs Gibson possesses a broad range of business management experience. Ms Gibson was formerly the General Manager Chemicals Group of Orica Limited, a member of the Orica Group Executive and a Director of Incitec Pivot Limited. She is a Fellow of the Australian Academy of Technical Sciences and Engineering, and is a recipient of the Australian Centenary Medal in 2001 for service to Australian society in medical technology.
Other current public company directorships
Nuplex Industries LimitedPenrice Soda Holdings Limited
Former public company directorships in last 3 years
Biota Holdings Limited
Special responsibilities
Chair of the Remuneration CommitteeMember of the Health & Safety Committee
Interest in shares and options
Ms Gibson has a relevant interest in 256,288 fully paid ordinary shares of the Company.
Phillip C Lockyer M.Sc, AWASM, DipMETALL Non-Executive DirectorMr Lockyer is an experienced mining engineer and metallurgist with over 40 years experience in the mineral industry with an emphasis on gold and nickel, in both underground and open pit operations. Mr Lockyer was employed by WMC Resources for 20 years, and as General Manager for WA was responsible for that Company’s nickel division and gold operations. Mr Lockyer also held the position of Director Operations for Dominion Mining Limited and Resolute Limited.
Other current public company directorships
Focus Minerals LimitedWestern Desert Resources LtdSwick Mining Services LimitedCGA Mining Limited
Former public company directorships in last 3 years
Ammtec LtdPerilya LimitedJubilee Mines Limited
Special responsibilities
Chairman of the Health & Safety CommitteeMember of the Audit Committee
Interest in shares and options
Mr Lockyer has a relevant interest in 63,785 fully paid ordinary shares of the Company.

38
Directors’ Report continued
Meetings of Directors
The number of meetings of the Company’s Board of Directors and of each Board committee held during the year ended 30 June 2010, and the numbers of meetings attended by each Director were:
Health Committees Remuneration & Safety Board of the Board Audit Committee Committee Committee
A B A B A B A B A B
S J C Wise 16 16 4 4 4 4 5 5 4 4
T J Lehany 16 16 4 4 – – – – – –
D W Bailey 16 16 – – 4 4 5 5 – –
B J Gibson 14 16 – – – – 5 5 4 4
P C Lockyer 15 16 2 2 4 4 – – 4 4
R K Rae 16 16 – – 4 4 5 5 – –
A = Number of meetings attended B = Number of meetings held during the time the Director held offi ce or was a member of the committee during the year
Remuneration report (Audited)
The remuneration report is part of the Directors’ Report set out under the following main headings:
A Principles used to determine the nature and amount of remuneration
B Details of remuneration
C Share based compensation
D Service agreements
This report for the year ended 30 June 2010 was prepared by the Directors in accordance with the Corporations Act 2001 for the Company and the Group. Information regarding the compensation of individual directors and key management personnel is required by Corporations Regulations 2M3.03. This information has been audited as required by section 308(3C) of the Act. Key Management Personnel have the authority and responsibility for planning, directing and controlling the activities of the Company and the Group. The Key Management Personnel, excluding Non-Executive Directors, will be collectively referred to as senior executives of the Company and the Group for the purposes of this report.
The remuneration committee is responsible for making recommendations to the Board on the remuneration arrangements for non executive directors and senior executives.
The members of the Remuneration Committee as at the date of this report are:
B J Gibson – Chair, Non-Executive DirectorD W Bailey – Non-Executive DirectorR K Rae – Non-Executive DirectorS J C Wise – Non-Executive Director
The responsibilities of the Remuneration Committee are to review and make recommendations to the Board as appropriate with respect to:
• The remuneration of Non-Executive Directors, including the Chair of the Board;
• Every aspect of remuneration for the Managing Director & CEO, including total remuneration, its fi xed and variable components, short-term and long-term incentives and the determination of Key Performance Indicators (KPIs);
• The Managing Director & CEO’s recommendation in relation to the annual salary review, in per cent and total amount, for the Company as a whole;
• The recommendations of the Managing Director & CEO on the remuneration of the senior executives reporting to him, the fi xed and variable components of that remuneration, the participation of these executives in short and long term incentive schemes and in the determination of their Key Performance Indicators (KPIs);
• Managing Director & CEO’s recommendations on the appointment or termination of senior executives reporting directly to him;
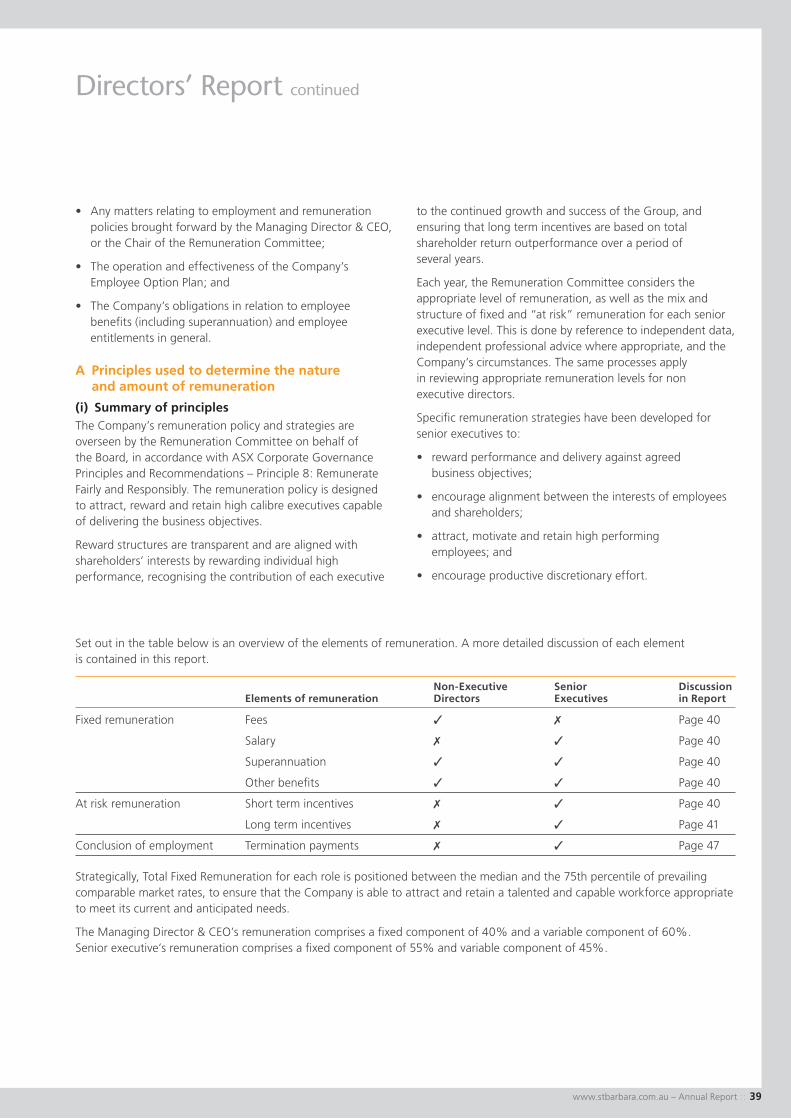
www.stbarbara.com.au – Annual Report : : 39
Directors’ Report continued
to the continued growth and success of the Group, and ensuring that long term incentives are based on total shareholder return outperformance over a period of several years.
Each year, the Remuneration Committee considers the appropriate level of remuneration, as well as the mix and structure of fi xed and “at risk” remuneration for each senior executive level. This is done by reference to independent data, independent professional advice where appropriate, and the Company’s circumstances. The same processes apply in reviewing appropriate remuneration levels for non executive directors.
Specifi c remuneration strategies have been developed for senior executives to:
• reward performance and delivery against agreed business objectives;
• encourage alignment between the interests of employees and shareholders;
• attract, motivate and retain high performing employees; and
• encourage productive discretionary effort.
• Any matters relating to employment and remuneration policies brought forward by the Managing Director & CEO, or the Chair of the Remuneration Committee;
• The operation and effectiveness of the Company’s Employee Option Plan; and
• The Company’s obligations in relation to employee benefi ts (including superannuation) and employee entitlements in general.
A Principles used to determine the nature and amount of remuneration
(i) Summary of principlesThe Company’s remuneration policy and strategies are overseen by the Remuneration Committee on behalf of the Board, in accordance with ASX Corporate Governance Principles and Recommendations – Principle 8: Remunerate Fairly and Responsibly. The remuneration policy is designed to attract, reward and retain high calibre executives capable of delivering the business objectives.
Reward structures are transparent and are aligned with shareholders’ interests by rewarding individual high performance, recognising the contribution of each executive
Set out in the table below is an overview of the elements of remuneration. A more detailed discussion of each element is contained in this report.
Non-Executive Senior Discussion Elements of remuneration Directors Executives in Report
Fixed remuneration Fees ✓ ✗ Page 40
Salary ✗ ✓ Page 40
Superannuation ✓ ✓ Page 40
Other benefi ts ✓ ✓ Page 40
At risk remuneration Short term incentives ✗ ✓ Page 40
Long term incentives ✗ ✓ Page 41
Conclusion of employment Termination payments ✗ ✓ Page 47
Strategically, Total Fixed Remuneration for each role is positioned between the median and the 75th percentile of prevailing comparable market rates, to ensure that the Company is able to attract and retain a talented and capable workforce appropriate to meet its current and anticipated needs.
The Managing Director & CEO’s remuneration comprises a fi xed component of 40% and a variable component of 60%. Senior executive’s remuneration comprises a fi xed component of 55% and variable component of 45%.

40
Directors’ Report continued
• fi xed remuneration, comprising base salary (which is calculated on a total cost basis and includes any fringe benefi ts tax charges related to employee benefi ts), employer statutory contributions to superannuation and other defi ned benefi ts;
• short term incentives; and
• long term incentives.
The aggregate of the three components comprises a senior executive’s total remuneration.
(a) Fixed remuneration – Key Management Personnel
(i) Base salary
The base salary is infl uenced by the scope of the role and the knowledge, skills and experience required for the position. External remuneration consultants provide periodic analysis and advice to ensure the base salary is competitive for a comparable role.
Base salary for senior executives is reviewed annually as part of the Company’s overall remuneration review process and is assessed against the Company’s and the individual’s performance. A senior executive’s salary is also reviewedon promotion.
(ii) Superannuation
In addition to statutory superannuation contributions, senior executives may elect to contribute additional amounts, subject to legislative requirements.
(iii) Benefi ts
Senior executives may receive benefi ts, including car parking, living away from home allowances, and payment for certain professional memberships.
(b) Short term incentives (STI)
The STI is an annual “at risk” component of remuneration for the senior executives and the net amount after allowing for applicable taxation is payable in cash. The objective of the STI is to remunerate senior executives for achieving annual Company targets and their own individual performance targets. Company and individual performance targets each account for 50 percent of the maximum STI. The STI payment to senior executives is based on achievements measured against key performance indicators (KPIs) set at the beginning of the fi nancial year. The maximum STI opportunity varies according to the role. KPIs require performance in improving operational effectiveness and the achievement of strategic fi nancial and non-fi nancial measures, linked to the drivers of performance in current and future reporting periods.
(ii) Non-Executive Directors’ feesNon-Executive Directors’ fees are determined within an aggregate Directors’ fee pool limit, which is set and varied only by approval of a resolution of shareholders at the annual general meeting. The fee pool limit from which Non-Executive Directors’ fees can be drawn is currently $750,000 per annum in aggregate (approved by shareholders in November 2005).
Fees paid to Non-Executive Directors are set at levels which refl ect both the responsibilities of, and the time commitments required from, each Non-Executive Director to discharge his or her duties. Non-Executive Directors’ fees are reviewed annually by the Board, guided periodically by the advice of independent remuneration consultants to ensure fees are appropriate for the duties performed and in line with the market. In order to maintain their independence and impartiality, the fees paid to Non-Executive Directors are not linked to the performance of the Company.
Superannuation contributions, in accordance with legislation, are included as part of each director’s total remuneration. Directors may elect to increase the proportion of their remuneration taken as superannuation subject to legislative requirements.
For the 2010 fi nancial year, with the exception of the Chairman, Non-Executive Director fees comprised fees of $80,000 plus an allowance for chairing a Board Committee of $15,000, plus a fee for serving as a (non-Chair) member of a Board Committee of $7,500. The Chairman received a fi xed fee of $190,000 as well as benefi ts in the form of a car park, mobile telephone allowance and other administrative benefi ts.
The Chairman’s fee is determined independently based on comparative roles and responsibilities in the external market for companies comparable with St Barbara Limited. The Chairman is not present at any discussions relating to the determination of his own remuneration.
Non-Executive Directors, including the Chairman, resolved not to increase Non-Executive Director fees for the 2010 fi scal year.
(iii) Retirement allowances for DirectorsNon-Executive Directors are not entitled to retirement benefi ts.
(iv) Senior executive remunerationSenior executive remuneration comprises both a fi xed component and an at risk component, which is intended to remunerate senior executives for increasing shareholder value, achieving fi nancial targets and effective execution of business strategies. It is also designed to attract and retain high calibre executives. The remuneration of senior executives has three components:

www.stbarbara.com.au – Annual Report : : 41
Directors’ Report continued
B Details of remuneration
(i) Remuneration paidDetails of the remuneration of Directors and the senior executives of the Company and the Group are set out in the following tables.
The Directors of the Company and the Group during the year ended 30 June 2010 were:
• S J C Wise Chairman• T J Lehany Managing Director & CEO• D W Bailey Non-executive director• B J Gibson Non-executive director• P C Lockyer Non-executive director• R K Rae Non-executive director
The senior executives with the authority and responsibility for planning, directing and controlling the activities of the Company and the Group during the year ended 30 June 2010, were:
• Tim Lehany Managing Director & CEO• David Rose Chief Operating Offi cer
Appointed 7 September 2009• Martin Reed Chief Operating Offi cer
Resigned 11 September 2009• Garth Campbell-Cowan Chief Financial Offi cer• Ross Kennedy Executive General Manager
Corporate Services/Company Secretary
• Phil Uttley Executive General ManagerDiscovery & GrowthAppointed 28 September 2009
• Adrian McArthur Acting General Manager ExplorationCeased acting in position 30 September 2009
The Remuneration Committee is responsible for assessing the extent to which the KPIs of the Managing Director & CEO and senior executives have been achieved. To assist in making this assessment, the Committee receives detailed reports and presentations on the performance of the business from the Managing Director & CEO and independent remuneration consultants as required.
The Remuneration Committee recommends for Board approval the STI to be paid to the Managing Director & CEO and senior executives.
(c) Long term incentives (LTI)
LTI’s are structured to reward senior executives for the long term performance of the Company and are granted in the form of employee options.
All employee options have been issued pursuant to the St Barbara Limited Employee Share Option Plan. Vesting of options granted during the year is conditional on the Company achieving a Total Shareholder Return relative to a peer group of companies over a three year period, as a minimum at the 50th percentile.
Refer page 45 for further information.

42
Directors’ Report continued
B Details of remuneration cont.
(i) Remuneration paid cont.
Post- employment2010 Short-term benefi ts benefi ts Long-term benefi ts
Share- Proportion Cash Non- Long based of total Value salary STI monetary Super- Service payments: Termination perfor- of optionsName & fees payment benefi ts Other annuation Leave (6) options (5) payments (7) Total mance as % $ $ $ $ $ $ $ $ $ related of total
Non-ExecutiveDirectorsS J C Wise(Chairman) 175,539 – 14,945 (8) – 14,461 – – – 204,945 – –
D W Bailey 94,037 – – – 8,463 – – – 102,500 – –
B J Gibson 94,037 – – – 8,463 – – – 102,500 – –
P C Lockyer 94,037 – – – 8,463 – – – 102,500 – –
R K Rae 87,156 – – – 7,844 – – – 95,000 – –
TotalNon-ExecutiveDirectors 544,806 – 14,945 – 47,694 – – – 607,445
ExecutiveDirectorT J Lehany 786,255 566,500 5,363 – 14,461 10,652 447,551 – 1,830,782 30.9% 24.4%
Other keymanagementpersonnelG Campbell-Cowan 382,539 228,990 2,681 – 14,461 23,797 177,384 – 829,852 27.6% 21.4%
M Reed (1) 97,579 – 1,197 – 3,613 – – 133,639 236,028 – –
D Rose (2) 357,124 175,744 1,513 50,000 (9) 11,810 5,582 113,700 715,473 24.6% 15.9%
R Kennedy 335,539 168,354 2,681 – 14,461 27,037 148,360 – 696,432 24.2% 21.3%
P Uttley (3) 255,526 140,595 – – 10,966 4,301 88,425 – 499,813 28.1% 17.7%
A McArthur (4) 94,664 – – – 5,921 – – – 100,585 – –
Total seniorexecutives 2,309,226 1,280,183 13,435 50,000 75,693 71,369 975,420 133,639 4,908,965
(1) Mr Reed resigned as Chief Operating Offi cer on 11 September 2009.(2) Mr Rose was appointed as Chief Operating Offi cer on 7 September 2009. The STI payment represents the pro-rata amount from
commencement to 30 June 2010.(3) Mr Uttley was appointed Executive General Manager Discovery & Growth on 28 September 2009. The STI represents the pro-rata amount
from commencement to 30 June 2010.(4) Mr McArthur ceased acting as General Manager Exploration on 30 September 2009.(5) The value of options disclosed as remuneration is the portion of the fair value of the options recognised in the reporting period.(6) For current employees, the amount represents the long service leave expense accrued for the period.(7) Termination payments include amounts for accrued annual leave owing at the date of the employee’s resignation, payments in lieu
of service and other contracted payments.(8) Represents carpark, mobile phone, and other administrative benefi ts.(9) Represents a sign-on payment.

www.stbarbara.com.au – Annual Report : : 43
Directors’ Report continued
B Details of remuneration cont.
(i) Remuneration paid cont.
Post- employment2009 Short-term benefi ts benefi ts Long-term benefi ts
Share- Proportion Cash Non- Long based of total Value salary STI monetary Super- Service payments: Termination perfor- of optionsName & fees payment benefi ts Other annuation Leave (8) options (7) payments (9) Total mance as % $ $ $ $ $ $ $ $ $ related of total
Non-ExecutiveDirectorsS J C Wise(Chairman) 176,255 – 17,068 (12) – 13,745 – – – 207,068 – –D W Bailey 94,037 – – – 8,463 – – – 102,500 – –B J Gibson 94,037 – – – 8,463 – – – 102,500 – –P C Lockyer 96,153 – – – 6,348 – – – 102,501 – –R K Rae 87,156 – – – 7,844 – – – 95,000 – –
TotalNon-ExecutiveDirectors 547,638 – 17,068 – 44,863 – – – 609,569
ExecutiveDirectorT J Lehany (1) 262,085 120,000 763 – 4,582 19,715 14,383 – 421,528 28.5% 3.4%E Eshuys (2) 514,740 480,000 8,819 – 13,745 89,550 11,901 1,578,244 2,696,999 5.6% 0.4%
Otherkey managementpersonnelM Reed (3) 186,527 42,780 574 – 6,969 9,685 – – 246,535 17.4% –I Bird (4) 5,952 – 1,250 – 3,282 – – 385,962 396,446 – –G Campbell-Cowan 371,255 154,000 4,804 – 13,745 20,609 50,578 – 614,991 25.0% 8.2%G Viska (5) 180,940 – 2,360 23,903 (10) 8,018 32,485 – 471,103 718,809 – –R Kennedy 286,255 120,000 4,804 – 13,745 23,111 9,031 – 456,946 26.3% 2.0%P Thompson (4) 3,644 – 1,250 – 2,188 20,617 – 271,592 299,291 – –A McArthur (6) 236,255 85,000 – 39,447 (11) 13,745 25,178 7,265 – 406,890 20.9% 1.8%
Total seniorexecutives 2,047,653 1,001,780 24,624 63,350 80,019 240,950 93,158 2,706,901 6,258,435
(1) Mr Lehany was appointed as Chief Executive Offi cer on 2 March 2009.(2) Mr Eshuys resigned on 2 March 2009.(3) Mr Reed was appointed as Chief Operating Offi cer on 12 January 2009.(4) Mr Bird and Mr Thompson resigned on 4 July 2008.(5) Mr Viska was made redundant on 30 January 2009.(6) Mr McArthur commenced as Acting General Manager Exploration on 4 July 2008.(7) The value of options disclosed as remuneration is the portion of the fair value of the options recognised in the reporting period.(8) For current employees, the amount represents the long service leave expense accrued for the period. For employees who resigned
during the year, the amount represents the payment made to them on termination relating to pro-rated long service leave owing.(9) Termination payments include amounts for accrued annual leave owing at the date of the employee’s resignation, payments in lieu
of service and other contracted payments.(10) Living away from home allowance.(11) Stamp duty paid on house purchase upon relocation.(12) Represents carpark, mobile phone, and other administrative benefi ts.

44
Directors’ Report continued
(ii) Cash incentives included in remuneration (short term incentive)The table below provides the percentage of fi xed remuneration earned by senior executives under the short term incentive (STI), based on relevant performance measures having been met.
% of % of % of maximum maximum Actual STI maximum potential potential Maximum included in ‘Target’ STI total STI total STI2010 potential STI remuneration earned earned foregone
Target Stretch(2) $
T J Lehany 400,000 400,000 566,500 100% 71% 29%
D Rose 150,000 (1) 150,000 (1) 175,744 100% 59% 41%
G Campbell-Cowan 158,800 158,800 228,990 100% 72% 28%
P Uttley 105,000 (1) 105,000 (1) 140,595 100% 67% 33%
R Kennedy 140,000 140,000 168,354 100% 60% 40%(1) Applied pro-rata for period of employment.(2) Stretch STI’s are in addition to Target STI’s.
Target performance represents challenging but achievable levels of performance. The performance measures are split 50/50 between Company and individual executive performance measures, and comprise fi nancial and non fi nancial measures. The individual performance measures vary depending on the individual executive’s position.
Stretch performance requires signifi cant performance above and beyond normal expectations and if achieved is anticipated to result in a substantial improvement in key operational areas, fi nancial results, and/or the fi nancial position of the Company. The stretch performance measures are also split 50/50 between Company and individual executive performance measures.
Amounts included in remuneration as actual cash STI for the fi nancial year represent the amounts accrued in relation to the 2010 fi nancial year, based on achievement of the specifi ed performance criteria. No additional amounts vest in future years in respect of the bonus scheme for the 2010 fi nancial year.
Short term incentives paid in respect of the 2010 fi nancial year refl ected achievement of Company and some individual performance measures. Achieved Company measures comprised improved safety performance and the achievement of signifi cant improvement in underlying profi tability and cash position.
Individual performance measures achieved refl ected value accretive and/or risk mitigation achievements for the benefi t of the Company and Shareholders.
(iii) Performance of St Barbara LimitedIn assessing the Group’s performance and improvement in shareholder wealth, consideration is given to the following measures in respect of the current fi nancial year and the previous four fi nancial years:
2010 2009 2008 2007 2006Earnings $ $ $ $ $
Sales revenue 296,760,000 281,129,000 143,129,000 130,911,000 115,263,000
EBITDA 33,793,000 39,701,000 12,340,000 28,364,000 13,577,000
Reported net profi t/(loss) after tax (40,188,000) (76,344,000) (17,333,000) (2,894,000) 6,019,000
Underlying net profi t/(loss) after tax 14,547,000 209,000 (29,291,000) (20,653,000) (12,435,000)
The table below provides the share price performance of the Company’s shares in the 2010 fi nancial year and the previous four fi nancial years.
Share price history 2010 2009 2008 2007 2006
Period end share price (cents per share) 35 23 37 49 57
Average share price for the year (cents per share) 28 29 64 54 40
During the 2010 fi nancial year, the Company’s daily closing share price traded in a range of 18 to 45 cents per share (2009: 19 to 52 cents per share).

www.stbarbara.com.au – Annual Report : : 45
Directors’ Report continued
C Share based compensation
(i) OptionsEmployee options issued to Mr Lehany, Managing Director & CEO, were approved by shareholders at the Extraordinary General Meeting held on 5 May 2009. All options were granted under the St Barbara Limited Employee Option Plan, which was approved by shareholders at the 2001 Annual General Meeting of shareholders. All full time employees are eligible to participate in the plan.
Details on options over ordinary shares in the Company that were granted as compensation to each senior executive during the fi nancial year and details of options that vested in the fi nancial year are as follows:
Number of Exercise Fair value Number options price per option of options granted per option at grant date vested2010 during 2010 (Cents per share) Grant date Expiry date (Cents per share) during 2010
T J Lehany 5,857,320 0.287 23 Sept 2009 23 Sept 2014 0.35 (1) –
D Rose 1,976,846 0.287 23 Sept 2009 23 Sept 2014 0.34 –
G Campbell-Cowan 1,744,017 0.287 23 Sept 2009 23 Sept 2014 0.34 –
P Uttley 1,537,547 0.287 23 Sept 2009 23 Sept 2014 0.34 –
R Kennedy 1,537,547 0.287 23 Sept 2009 23 Sept 2014 0.34 –
(1) Mr Lehany’s options were issued prior to the equity raising in November 2009 and December 2009. The remaining options were issued in June 2010, and the fair value of these options refl ected the effect of this equity raising.
The options were provided to the senior executives as part of their total remuneration package. The vesting of options granted in 2010 is subject to a continuing service condition as at each vesting date, and achieving a relative Total Shareholder Return for the period from the option pricing date to 30 June 2012. No options have been granted since the end of the fi nancial year.
The Total Shareholder Return is measured against a defi ned peer group of companies and the percentage of options that vest is in accordance with the following rules:
Relative TSR Performance Over Measurement Period % of Right to Vest
< 50th percentile 0%
50th percentile 50%
> 50th & < 75th percentiles Pro-rata between 50% & 75%
75th percentile and above 100%
The peer group against which Total Shareholder Return is measured comprises:
Company
Newcrest Mining Limited Independence Group NL
Lihir Gold Limited Dominion Mining Limited
Saracen Mineral Holdings Limited (1) Catalpa Resources Limited (1)
Kingsgate Consolidated Limited Apex Minerals NL
Avoca Resources Limited OceanaGold Corporation
(1) During 2010, Saracen Mineral Holdings Limited and Catalpa Resources Limited replaced Sino Gold Mining Limited and Lion Selection Limited as these companies ceased to be listed on the Australian Stock Exchange.
The Board reserves the right to make changes to the peer group to allow for changing circumstances (e.g. takeover) for peer group companies.
All options expire on the earlier of their expiry date, thirty days after resignation of the relevant executive or twelve months after retirement or retrenchment.
Options granted under the plan carry no dividend or voting rights. When exercisable, each option is convertible into one ordinary share.

46
Directors’ Report continued
The assessed fair value at grant date of options granted to the individuals is allocated equally over the period from grant date to vesting date, and the amount is included in the remuneration tables in section B. Fair values at grant date are independently determined using a Black Scholes option pricing model that takes into account the exercise price (ordinarily linked to the average closing market price for the 5 business days immediately preceding the grant date), the term of the option, the performance hurdle (relative Total Shareholder Return) the share price at grant date and expected price volatility of the underlying share, no expected dividend yield and the risk free interest rate for the term of the option.
Further information on the options is set out in Note 37 to the Financial Statements.
(ii) Exercise of options granted as compensationDuring the reporting period, there were no options exercised.
(iii) Analysis of movements in the value of options granted and exercised
2010 A B C
Granted Exercised Lapsed in year in year in year $ $ $
T J Lehany 1,466,000 – –
G Campbell-Cowan 401,300 – –
D Rose 454,800 – –
P Uttley 353,700 – –
R Kennedy 353,700 – –
A The value of options granted in the year is the fair value of the options calculated at grant date using a Black-Scholes option-pricing model. The total value of the options granted is included in the table above. This amount is allocated to remuneration over the vesting period.
B The value of options exercised during the year is calculated as the market price of shares of the Company on the Australian Securities Exchange as at close of trading on the day the options were exercised after deducting the price paid to exercise the option.
C The value of the options that lapsed during the year represents the benefi t forgone and is calculated at the date the option lapsed using a Black-Scholes option-pricing model.
(iv) Analysis of options granted as compensation
Options granted Value yet to vest
% % Minimum Maximum vested forfeited Financial year (A) (B)2010 Number Date in year in year options vest $ $
T J Lehany 1,508,099 6 May 2009 – – 30 June 2012 Nil 191,165 5,857,320 19 Nov 2009 – – 30 June 2013 Nil 1,113,900
G Campbell-Cowan 1,744,017 23 Sep 2009 – – 30 June 2013 Nil 154,329 1,207,160 6 May 2009 – – 30 June 2012 Nil 300,975
D Rose 1,976,846 23 Sep 2009 – – 30 June 2013 Nil 341,000
Phil Uttley 1,537,547 23 Sep 2009 – – 30 June 2013 Nil 265,275
R Kennedy 1,537,547 23 Sep 2009 – – 30 June 2013 Nil 120,033 940,644 6 May 2009 – – 30 June 2012 Nil 265,275
A The minimum value of options yet to vest is $nil as the vesting service conditions, which are continuing service conditions and relative Total Shareholder Returns over a three year period, are still to be satisfi ed.
B The maximum value of the options yet to vest represents the amount of the grant date fair value of the options that is still to be expensed in the income statement.

www.stbarbara.com.au – Annual Report : : 47
Directors’ Report continued
D Service agreements
Remuneration and other terms of employment for the Managing Director and CEO and the senior executives are formalised in service agreements. These agreements provide, where applicable, for the provision of performance related cash bonuses, other benefi ts including allowances, and participation in the St Barbara Limited Executive Option and Employee Option Plans. Other major provisions of the agreements relating to remuneration are set out below.
All contracts with senior executives may be terminated early by either party giving the required notice and subject to termination payments as detailed below.
T J Lehany – Managing Director & CEO
• Term of agreement – permanent employee commencement 2 March 2009
• Payment of a termination benefi t or early termination by the Company, other than for serious misconduct or serious breach of duty:
a) Where 6 months notice of termination is given; an additional 6 months base salary and superannuation payment, and any entitlement to a ‘stretch performance’ payment plus an amount equivalent to six months of notional ‘target performance’ payment (at the discretion of the Board), or
b) Where notice of immediate termination is given, 12 months base salary and superannuation, plus an amount equivalent to 12 months of a notional ‘target performance’ payment (at the discretion of the Board).
D Rose – Chief Operating Offi cer
• Term of agreement – permanent employee commencement 11 September 2009.
• Payment of a termination benefi t on early termination by the Company, other than for gross misconduct, equal to 8 months base salary and superannuation.
G Campbell-Cowan – Chief Financial Offi cer
• Term of agreement – permanent employee commencement 11 September 2006.
• Payment of a termination benefi t on early termination by the Company, other than for gross misconduct, equal to 8 months base salary and superannuation.
R Kennedy – Executive General Manager Corporate Services/Company Secretary
• Term of agreement – permanent employee commencement 29 September 2004.
• Payment of a termination benefi t on early termination by the Company, other than for gross misconduct, equal to 6 months base salary and superannuation.
P Uttley – Executive General Manager Discovery & Growth
• Term of agreement – permanent employee commencement 28 September 2009.
• Payment of a termination benefi t on early termination by the Company, other than for gross misconduct, equal to 6 months base salary and superannuation
Loans to Directors and executives
There were no loans to Directors or executives during the year (2009: Nil).
Auditor independence
A copy of the Auditor’s Independence Declaration required under section 307C of the Corporations Act 2001 is set out on page 49. The Directors are satisfi ed that the provision of these services did not impair the auditor’s independence.
Indemnifi cation and insurance of offi cers
The Company indemnifi es all Directors of the Company named in this report, and a number of former Directors (including Mr Richard Knight, Mr Hank Tuten, Mr Mark Wheatley and Mr Eduard Eshuys) and current and former executive offi cers of the Company and its controlled entities against all liabilities to persons (other than the Company or a related body corporate) which arise out of the performance of their normal duties as Director or executive offi cer, unless the liability relates to conduct involving bad faith. The Company also has a policy to indemnify the Directors and executive offi cers against all costs and expenses incurred in defending an action that falls within the scope of the indemnity and any resulting payments.
During the year the Company paid an insurance premium for Directors and Offi cers Liability and Statutory Liability policies. The contract of insurance prohibits disclosure of the amount of the premium and the nature of the liabilities insured under the policy.
During the year the Company also paid the premium on a Personal Accident insurance policy on behalf of directors, to insure them for travel while on Company business.

48
Directors’ Report continued
• None of the services undermine the general principles relating to auditor independence as set out in APES 110 Code of Ethics for Professional Accountants; and
• The Audit Committee annually informs the Board of the detail, nature and amount of any non-audit services rendered by KPMG during the most recent fi nancial year and an explanation of why the provision of these services is compatible with auditor independence. If applicable, the Audit Committee recommends that the Board take appropriate action in response to the Audit Committee’s report to satisfy itself of the independence of KPMG.
Events occurring after the end of the fi nancial year
The Directors are not aware of any matter or circumstance that has arisen since the end of the fi nancial year that, in their opinion, has signifi cantly affected or may signifi cantly affect in future years the Company’s operations, the results of those operations or the state of affairs, except for the following items:
• On 4 July 2010 the Company redeemed convertible notes with a face value of $1,200,000. There are no more convertible notes outstanding.
• On 13 August 2010 the Company signed an asset sale agreement for the sale of its Tarmoola process plant, which is on care and maintenance and surplus to the Company’s requirements, for a cash consideration of $3,000,000.
Rounding of amounts
St Barbara Limited is a Company of the kind referred to in Class Order 98/100 approved by the Australian Securities and Investments Commission and issued pursuant to section 341(1) of the Corporations Act 2001. As a result, amounts in this Directors’ Report and the accompanying Financial Report have been rounded to the nearest thousand dollars, except where otherwise indicated.
This report is made in accordance with a resolution of Directors.
For and on behalf of the BoardDated at Melbourne this 24th day of August 2010
Timothy J LehanyManaging Director & CEO
Proceedings on behalf of the company
No person has applied to the Court under section 237 of the Corporations Act 2001 for leave to bring proceedings on behalf of the Company, or to intervene in any proceedings to which the Company is a party, for the purpose of taking responsibility on behalf of the Company for all or part of those proceedings.
No proceedings have been brought or intervened in on behalf of the Company with leave of the Court under section 237 of the Corporations Act 2001.
Environmental management
The Company regards compliance with environmental regulations as the minimum performance standard for its operations. The Company’s operations in Western Australia are subject to environmental regulation under both Commonwealth and State legislation.
There were two non-compliances registered and externally reported for the Southern Cross operations during the 2010 fi nancial year. At Leonora, there were four non-compliances registered and externally reported. This was a signifi cant decrease in the number of incidents reported from Leonora the previous year and refl ects the increased level of environmental awareness by mining and process personnel. None of the reported incidents were material in that there was minimal, if any, adverse impact on the environment. The formal reporting of two of the Leonora incidents did however generate requests from regulators for additional investigation and reporting on measures to be taken to prevent recurrence.
Non-audit services
During the year the Company did employ the auditor on assignments additional to their statutory audit duties. Details of the amounts paid or payable to the auditor, KPMG, for audit and non-audit services provided during the year are set out in Note 27 to the fi nancial statements.
The Board of Directors has considered the position and, in accordance with the advice received from the Audit Committee, is satisfi ed that the provision of non-audit services during the year is compatible with the general standard of independence for auditors imposed by the Corporations Act 2001. The Directors are satisfi ed that the provision of non-audit services by the auditor, as set out in Note 27 to the fi nancial statements, did not compromise the auditor independence requirements of the Corporations Act 2001 for the following reasons:
• All non-audit services have been reviewed by the Audit Committee to ensure they do not impact the impartiality and objectivity of the auditor;

www.stbarbara.com.au – Annual Report : : 49
Auditor’s Independence Declaration
Lead Auditor’s Independence Declaration under Section 307C of the Corporations Act 2001
To: the directors of St Barbara Limited.
I declare that, to the best of my knowledge and belief, in relation to the audit for the fi nancial year ended 30 June 2010, there have been:
i. no contraventions of the auditor independence requirement as set out in the Corporations Act 2001 in relation to the audit; and
ii. no contraventions of any applicable code of professional conduct in relation to the audit
KPMG
Michael BrayPartner
Melbourne 24 August 2010

50
Financial Report
This fi nancial report covers both St Barbara Limited as an individual entity and the Group consisting of St Barbara Limited and its subsidiaries. The fi nancial report is presented in the Australian currency.
St Barbara Limited is a company limited by shares, incorporated and domiciled in Australia. Its registered offi ce is:
St Barbara LimitedLevel 14, 90 Collins StMelbourne VIC 3000
A description of the nature of the Group’s operations and its principal activities is included in the review of operations and activities in the directors’ report, which is not part of this fi nancial report.
The fi nancial report was authorised for issue by the Directors on 24 August 2010. The Company has the power to amend and reissue the fi nancial report.

www.stbarbara.com.au – Annual Report : : 51
Consolidated Income StatementFor the year ended 30 June 2010
Consolidated
2010 2009 Notes $’000 $’000
Revenue from continuing operations 6 296,760 281,129
Mine operating costs 9 (207,688) (185,794)
Gross profi t 89,072 95,335
Other revenue 6 6,765 5,411
Other income 7 939 223
Exploration expensed (5,184) (13,442)
Corporate and support costs (21,382) (27,089)
Royalties (11,790) (11,042)
Depreciation and amortisation 8,9 (71,874) (110,104)
Other expenditure (2,628) (1,759)
Operating loss (16,082) (62,467)
Finance costs 8 (7,317) (8,996)
Net realised/unrealised (loss)/gain on derivatives 9 (19,513) 1,451
Net realised/unrealised gain/(loss) on available for sale assets 9 2,724 (6,332)
Loss before income tax (40,188) (76,344)
Income tax expense 10 – –
Loss after income tax for the year (40,188) (76,344)
Earnings per share for loss attributable to theordinary equity holders of the Company:
Basic loss per share (cents per share) 36 (2.27) (5.63)
Diluted loss per share (cents per share) 36 (2.27) (5.63)
The above Consolidated Income Statement should be read in conjunction with the accompanying notes.

52
Consolidated Statement of Financial PositionAs at 30 June 2010
Consolidated
2010 2009 Notes $’000 $’000
Assets
Current assets
Cash and cash equivalents 11 102,157 53,692
Trade and other receivables 12 15,480 34,936
Inventories 13 18,055 31,058
Available for sale fi nancial assets 15 – 13,869
Deferred mining costs 14 9,114 16,196
Total current assets 144,806 149,751
Non-current assets
Property, plant and equipment 17 112,096 117,628
Deferred mining costs 14 – 6,472
Mine properties 18 216,530 185,341
Exploration and evaluation 19 5,735 8,219
Total non-current assets 334,361 317,660
Total assets 479,167 467,411
Liabilities
Current liabilities
Trade and other payables 20 37,558 38,376
Interest bearing borrowings 21 7,116 83,567
Derivative fi nancial liabilities 22 338 –
Provisions 23 6,913 5,792
Total current liabilities 51,925 127,735
Non-current liabilities
Interest bearing borrowings 21 8,793 13,974
Derivative fi nancial liabilities 22 38,336 –
Provisions 23 30,645 29,230
Total non-current liabilities 77,774 43,204
Total liabilities 129,699 170,939
Net Assets 349,468 296,472
Equity
Contributed equity 24 614,997 496,176
Reserves 25(a) (16,677) 8,960
Accumulated losses 25(b) (248,852) (208,664)
Total equity 349,468 296,472
The above Consolidated Statement of Financial Position should be read in conjunction with the accompanying notes.

www.stbarbara.com.au – Annual Report : : 53
Consolidated Statement of Comprehensive IncomeFor the year ended 30 June 2010
Consolidated
2010 2009 Notes $’000 $’000
Loss for the year (40,188) (76,344)
Other comprehensive income
Changes in fair value of available for sale fi nancial assets 25(a) (6,687) 6,687
Changes in fair value of cash fl ow hedges taken to reserves 25(a) (19,161) –
Other comprehensive income net of tax (25,848) 6,687
Total comprehensive income attributable to equity holders of the company (66,036) (69,657)
The above Consolidated Statement of Comprehensive Income should be read in conjunction with the accompanying notes.

54
Consolidated Statement of Changes in EquityFor the year ended 30 June 2010
Attributable to equity holders of the Company
Contributed Retained Equity Reserves Earnings Total Note $’000 $’000 $’000 $’000
Balance at 1 July 2009 496,176 8,960 (208,664) 296,472
Equity issues (net of transaction costs) 24 118,821 – – 118,821
Share-based payments expense 25(a) – 1,175 – 1,175
Unlisted options expired 25(a) – (532) – (532)
Convertible note reserve transferred to income statement 25(a) – (432) – (432)
Comprehensive income for the year – (25,848) (40,188) (66,036)
Balance at 30 June 2010 614,997 (16,677) (248,852) 349,468
Attributable to equity holders of the Company
Contributed Retained Equity Reserves Earnings Total Note $’000 $’000 $’000 $’000
Balance at 1 June 2008 366,466 2,518 (132,320) 236,664
Equity issues (net of transaction costs) 24 128,507 – – 128,507
Convertible notes converted to shares 24 400 – – 400
Exercise of options 24 803 (213) – 590
Share-based payments expense 25(a) – 181 – 181
Unlisted options expired 25(a) – (213) – (213)
Comprehensive income for the year – 6,687 (76,344) (69,657)
Balance at 30 June 2009 496,176 8,960 (208,664) 296,472
The above Consolidated Statement of Changes in Equity should be read in conjunction with the accompanying notes.

www.stbarbara.com.au – Annual Report : : 55
Consolidated
2010 2009 Notes $’000 $’000
Cash Flows From Operating Activities:
Receipts from customers (inclusive of GST) 293,619 282,380
Payments to suppliers and employees (inclusive of GST) (209,774) (251,928)
Interest received 4,575 2,940
Interest paid (4,829) (7,653)
Finance charges – fi nance leases (1,232) (1,223)
Borrowing costs (554) (192)
Net cash infl ow from operating activities 34 81,805 24,324
Cash Flows From Investing Activities:
Proceeds from sale of property, plant and equipment 276 73
Proceeds on sale of available for sale fi nancial assets 9,907 428
Payments for property, plant and equipment (10,210) (48,567)
Payments for development of mining properties (84,962) (71,502)
Payments in respect of mines under construction – (28,682)
Payments for tenements and land (686) (388)
Proceeds on close out of put options – 36,300
Exploration and evaluation expenditure (7,946) (15,990)
Net cash outfl ow from investing activities (93,621) (128,328)
Cash Flows From Financing Activities:
Proceeds from issue of shares on conversion of options – 590
Proceeds from borrowings: – fi nance leases 559 1,696
– insurance premium funding – 2,632
Proceeds from equipment fi nancing facility – 20,000
Equipment fi nancing facility transaction costs – (365)
Buy back and redemption of convertible notes (75,588) (20,565)
Convertible notes buy back transaction costs (25) (791)
Proceeds from equity raising 123,859 133,861
Equity raising transaction costs (5,038) (5,354)
Movement in unclaimed monies – (4)
Movement in restricted cash 23,951 (3,742)
Principal repayments – fi nance leases (989) (669)
– equipment fi nancing facility (4,542) (2,621)
– insurance premium funding (1,906) (2,489)
Net cash infl ow from fi nancing activities 60,281 122,179
Net increase in cash and cash equivalents 48,465 18,175
Cash and cash equivalents at the beginning of the year 53,692 35,517
Cash and cash equivalents at the end of the year 11 102,157 53,692
The above Consolidated Cash Flow Statement should be read in conjunction with the accompanying notes.
Consolidated Cash Flow StatementFor the year ended 30 June 2010

56
Notes to the Consolidated Financial StatementsFor the year ended 30 June 2010
(b) Principles of consolidation(i) Subsidiaries
The consolidated fi nancial statements incorporate the assets and liabilities of all subsidiaries of St Barbara Limited (‘‘Company’’ or ‘‘parent entity’’) as at 30 June 2010 and the results of all subsidiaries for the year then ended. St Barbara Limited and its subsidiaries together are referred to in this fi nancial report as the Group.
Subsidiaries are all those entities (including special purpose entities) over which the Group has the power to govern the fi nancial and operating policies so as to obtain benefi ts from its activities, generally accompanying a shareholding of more than one-half of the voting rights. The existence and effect of potential voting rights that are currently exercisable or convertible are considered when assessing whether the Group controls another entity.
Subsidiaries are consolidated from the date on which control commences until the date control ceases.
Intercompany transactions, balances and unrealised gains on transactions between Group companies are eliminated. Unrealised losses are also eliminated unless the transaction provides evidence of the impairment of the asset transferred. Accounting policies of subsidiaries have been changed where necessary to ensure consistency with the policies adopted by the Group.
Investments in subsidiaries are accounted for at cost within the Parent Entity disclosures at Note 26.
(ii) Associates and jointly controlled entities
Associates are all entities over which the Group has signifi cant infl uence but not control, generally accompanying a shareholding of between 20% and 50% of voting rights. An interest in an associate and a jointly controlled entity is accounted for in the consolidated fi nancial statements using the equity method and is carried at cost by the parent entity. Under the equity method, the share of the profi ts or losses of the partnership is recognised in the income statement, and the share of movements in reserves is recognised in reserves in the balance sheet.
Profi ts or losses on transactions establishing the joint venture entity and transactions with the joint venture are eliminated to the extent of the Group’s ownership interest, until such time as they are realised by the joint venture entity on consumption or sale, unless they relate to an unrealised loss that provides evidence of the impairment of an asset transferred.
Note 1 Summary of signifi cant accounting policies
St Barbara Limited (the “Company”) is a company domiciled in Australia. The consolidated fi nancial statements of the Company as at and for the year ended 30 June 2010 comprise the Company and its subsidiaries (together referred to as the “Group”), and the Group’s interest in associates and jointly controlled entities. The Group is primarily involved in the exploration for, and mining of, gold.
The principal accounting policies adopted in the preparation of the fi nancial report are set out below. These policies have been consistently applied to all the years presented, unless otherwise stated.
(a) Basis of preparationStatement of compliance
The fi nancial report is a general purpose fi nancial report, which has been prepared in accordance with Australian Accounting Standards (AASBs) (including Australian Interpretations) adopted by the Australian Accounting Standards Board (AASB) and the Corporations Act 2001. Where required by accounting standards comparative fi gures have been adjusted to conform to changes in presentation in the current year. The consolidated fi nancial report of the Group complies with International Financial Reporting Standards (IFRSs) and interpretations issued by the International Accounting Standards Board.
The fi nancial statements were approved by the Board of Directors on 24 August 2010.
Basis of measurement
The consolidated fi nancial statements have been prepared on the historical cost basis, except for the following material items:
• Derivative fi nancial instruments are measured at fair value
• Available-for-sale fi nancial assets are measured at fair value
• Share based payment arrangements are measured at fair value
• Rehabilitation provision is measured at net present value
Critical accounting estimates
The preparation of fi nancial statements requires management to make judgements, estimates and assumptions that affect the application of accounting policies and the reported amount of assets, liabilities, income and expenses. Actual results may differ from these estimates. The estimates and underlying assumptions are reviewed on an ongoing basis. Revisions to accounting estimates are recognised in the period in which the estimate is revised and in any future periods affected. The areas involving a higher degree of judgement or complexity, or areas where assumptions and estimates are signifi cant to the fi nancial statements, are disclosed in Note 4.

www.stbarbara.com.au – Annual Report : : 57
Notes to the Consolidated Financial Statements continuedFor the year ended 30 June 2010
Translation differences on non monetary fi nancial assets and liabilities are reported as part of the fair value gain or loss. Translation differences on non monetary fi nancial assets and liabilities, such as equities held at fair value through profi t or loss, are recognised in the income statement as part of the fair value gain or loss. Translation differences on non-monetary fi nancial assets, such as equities classifi ed as available for sale fi nancial assets, are included in the fair value reserve in equity.
(e) Revenue recognitionRevenue is measured at the fair value of the consideration received or receivable. Amounts disclosed as revenue are net of amounts collected on behalf of third parties. The Group recognises revenue when the signifi cant risks and rewards of ownership have been transferred to the buyer, the amount of revenue can be reliably measured, and the associated costs and possible return of goods can be estimated reliably, and it is probable that future economic benefi ts will fl ow to the Group.
Revenue is recognised for the major business activitiesas follows:
(i) Product sales
Amounts are recognised as sales revenue when there has been a transfer of risk to a customer, and:
• the product is in a form suitable for delivery and no further processing is required by, or on behalf of, the Group;
• the quantity, quality and selling price of the product can be determined with reasonable accuracy; and
• the product has been despatched to the metals refi nery and is no longer under the physical control of the Group, or the metals refi nery has formally acknowledged legal ownership of the product, including all inherent risks.
Gains and losses, including premiums paid or received, in respect of forward sales, options and other deferred delivery arrangements, which hedge anticipated revenues from future production, are deferred and included in sales revenue when the hedged proceeds are received.
(ii) Interest income
Interest income is recognised on a time proportion basis using the effective interest method.
(iii) Dividends
Dividends are recognised as revenue when the right to receive payment is established.
(iii) Jointly controlled operations and assets
Details of unincorporated joint ventures and jointly controlled assets are set out in Note 32.
Where material, the proportionate interests in the assets, liabilities and expenses of a joint venture activity are incorporated in the fi nancial statements under the appropriate headings.
(c) Segment reportingAs of 1 July 2009, the Group determines and presents reportable segments based on the information that internally is provided to the CEO, who is the Group’s chief operating decision maker. Refer to Note 2 for further information on new standards adopted for the 30 June 2010 fi nancial year. Comparative segment information has been re-presented in conformity with the transitional requirements of such standard. Since the change only impacts presentation and disclosure aspects, there is no impact on earnings per share.
A reportable segment is a component of the Group that engages in business activities from which it may earn revenues or incur expenses, including revenues and expenses that relate to transactions with any of the Group’s other components. The operating results of all reportable segments are regularly reviewed by the Group’s CEO to make decisions about resources to be allocated to the segment and assess its performance, and for which fi nancial information is available.
Segment results that are reported to the CEO include items directly attributable to a segment as well as those that can be allocated on a reasonable basis. Unallocated items comprise mainly corporate assets and depreciation, and corporate expenses.
Segment capital expenditure represent the total cost incurred during the period for mine developments and acquisitions of property, plant and equipment.
(d) Foreign currency translation(i) Functional and presentation currency
The consolidated fi nancial statements are presented in Australian dollars, which is St Barbara Limited’s functional and presentation currency.
(ii) Transactions and balances
Foreign currency transactions are translated into the functional currency using the exchange rates prevailing at the dates of the transactions. Foreign exchange gains and losses resulting from the settlement of such transactions, and from the translation at year end exchange rates of monetary assets and liabilities denominated in foreign currencies, are recognised in the income statement, except when deferred in equity as qualifying cash fl ow hedges and qualifying net investment hedges.

58
Notes to the Consolidated Financial Statements continuedFor the year ended 30 June 2010
(ii) Mines under construction
Mine development expenditure is accumulated separately for each area of interest in which economically recoverable reserves have been identifi ed. This expenditure includes direct costs of construction, an appropriate allocation of overheads and borrowing costs capitalised during construction. Once a development decision has been taken, all past and future capitalised exploration, evaluation and feasibility expenditure in respect of the area of interest is aggregated with the costs of construction and classifi ed under non-current assets as mine development.
(iii) Mine development
Mine development expenditure represents the acquisition cost and/or accumulated exploration, evaluation and development expenditure in respect of areas of interest in which mining has commenced.
When further development expenditure is incurred in respect of a mine development, after the commencement of production, such expenditure is carried forward as part of the mine development only when substantial future economic benefi ts are thereby established, otherwise such expenditure is classifi ed as part of production and expensed as incurred.
Mine development costs are deferred until commercial production commences, at which time they are amortised on a unit-of-production basis over mineable reserves. The calculation of amortisation takes into account future costs which will be incurred to develop all the mineable reserves. Changes to mineable reserves are applied from the beginning of the reporting period and the amortisation charge is adjusted prospectively from the beginning of the period.
(g) Deferred mining expenditureCertain mining costs, principally those that relate to the stripping of waste and operating development in underground operations, which provide access so that future economically recoverable ore can be mined, are deferred in the statement of fi nancial position as deferred mining costs.
The amount of mining costs deferred is based on the ratio obtained by dividing the waste tonnes mined by the quantity of gold ounces contained in the ore. Mining costs incurred in the period are deferred to the extent that the current period waste to contained gold ounce ratio exceeds the life of mine waste to ore ratio.
Deferred mining costs are then charged against reported earnings to the extent that, in subsequent periods, the ratio falls below the life of mine ratio. The life of mine ratio is based on economically recoverable reserves of the operation.
Note 1 Summary of signifi cant accounting policies cont.
(e) Revenue recognition cont.
(iv) Gains on disposal of available-for-sale fi nancial assets and property, plant and equipment
Revenue is recognised when the risks and rewards of ownership have been transferred, which is usually considered to occur on settlement.
(v) Toll treatment revenue
Toll treatment revenue represents revenue earned for processing third party ore through the Group’s processing facilities. Revenue is recognised when the third party’s product is in a form suitable for delivery, and no further processing is required by the Group, and there has been a transfer of risk to the third party.
(f) Exploration and evaluation/mine properties(i) Exploration, evaluation and feasibility expenditure
All exploration and evaluation expenditure incurred up to establishment of reserves is expensed as incurred. From the point in time when reserves are established, exploration and evaluation expenditure is capitalised and carried forward in the fi nancial statements, in respect of areas of interest for which the rights of tenure are current and where such costs are expected to be recouped through successful development and exploitation of the area of interest, or alternatively, by its sale.
Exploration and evaluation expenditure consists of an accumulation of acquisition costs and direct exploration and evaluation costs incurred, together with an allocation of directly related overhead expenditure.
Feasibility expenditure represents costs related to the preparation and completion of a feasibility study to enable a development decision to be made in relation to that area of interest. Feasibility expenditures are expensed as incurred until a decision has been made to develop the area of interest.
Exploration and evaluation assets are assessed for impairment if (i) suffi cient data exists to determine technical feasibility and commercial viability, and (ii) facts and circumstances suggest that the carrying amount exceeds the recoverable amount (see impairment policy, Note 1(k)). For the purpose of impairment testing, exploration and evaluation assets are allocated to cash-generating units to which the exploration activity relates.
When an area of interest is abandoned, or the Directors determine it is not commercial, accumulated costs in respect of that area are written off in the period the decision is made.

www.stbarbara.com.au – Annual Report : : 59
Notes to the Consolidated Financial Statements continuedFor the year ended 30 June 2010
Receivables and payables are stated inclusive of the amount of GST receivable or payable. The net amount of GST recoverable from, or payable to, the taxation authority is included with other receivables or payables in the balance sheet.
Cash fl ows are included in the statement of cash fl ows on a gross basis. The GST component of cash fl ows arising from investing or fi nancing activities, which are recoverable from, or payable to, the taxation authority are classifi ed as part of operating cash fl ows.
(i) LeasesLeases of property, plant and equipment, where the Group has substantially all the risks and rewards of ownership, are classifi ed as fi nance leases. Finance leases are capitalised at inception of the lease at the lower of the fair value of the leased property and the present value of the minimum future lease payments. The corresponding rental obligations, net of fi nance charges, are included in other long term payables. Each lease payment is allocated between the liability and fi nance charges so as to achieve a constant rate on the fi nance balance outstanding. The interest element of the fi nance cost is charged to the income statement over the lease period so as to produce a constant periodic rate of interest on the remaining balance of the liability for each period. The property, plant and equipment acquired under fi nance leases are depreciated over the shorter of the asset’s useful life and the lease term.
Leases in which a signifi cant portion of the risks and rewards of ownership are retained by the lessor are classifi ed as operating leases. Payments made under operating leases (net of any incentives received from the lessor) are charged to the income statement on a straight-line basis over the period of the lease.
(j) Business combinationsThe acquisition method of accounting is used to account for all business combinations. For every business combination, the Group identifi es the acquirer, which is the combining entity that obtains control of the other combining entities or businesses. Control is the power to govern the fi nancial and operating policies of an entity so as to obtain benefi ts from its activities. In assessing control, the Group takes into consideration potential voting rights that currently are exercisable. The acquisition date is the date on which control is transferred to the acquirer. Judgement is applied in determining the acquisition date and determining whether control is transferred from one party to another.
The group measures goodwill as the fair value of the consideration transferred including the recognised amount of any non-controlling interest in the acquire, less the net recognised amount (generally fair value) of the identifi able assets acquired and liabilities assumed, all measured as of the acquisition date.
The life of mine ratio is a function of an individual mine’s design and therefore changes to that design will generally result in changes to the ratio. Changes in other technical or economic parameters may impact reserves, which will then impact the life of mine ratio. Changes to the life of mine ratio are accounted for prospectively.
In the production stage of some operations further development of the mine requires a phase of unusually high overburden removal activity that is similar in nature to pre-production mine development. The costs of such unusually high overburden removal are deferred and charged against earnings in subsequent periods on a unit-of-production basis.
In underground operations mining occurs progressively on a level-by-level basis. In these operations an estimate is made of the life of level average underground mining cost per tonne of ore mined to expense underground costs in the income statement. Underground mining costs in the period are deferred to the extent that the actual cost per tonne of ore mined on a level in the period exceeds the life of level average. Previously deferred underground mining costs are released to the income statement to the extent that the actual cost per tonne of ore mined in the period is less than the life of level average.
(h) Taxes(i) Income tax
The income tax expense for the year is the tax payable on the current period’s taxable income using the income tax rate applicable at the reporting date, adjusted by changes in deferred tax assets and liabilities attributable to temporary differences between the tax bases of assets and liabilities and their carrying amounts in the fi nancial statements, and by changes to unused tax losses.
Deferred tax assets are recognised for deductible temporary differences and carry forward unused tax losses only if it is probable that future taxable amounts will be available to utilise those temporary differences and losses.
Current and deferred tax balances attributable to amounts recognised directly in equity are also recognised directly in equity.
The Company and its wholly owned Australian entities have not yet elected to implement the tax consolidation legislation.
(ii) Goods and Services Tax (GST)
Revenues, expenses and assets are recognised net of the amount of associated GST, unless the GST incurred is not recoverable from the taxation authority. In this case it is recognised as part of the cost of acquisition of the asset or as part of the expense.

60
Notes to the Consolidated Financial Statements continuedFor the year ended 30 June 2010
(m) Trade receivablesTrade receivables are recognised initially at fair value and subsequently measured at amortised cost, less provision for doubtful debts. Trade receivables are usually due for settlement no more than 30 days from the date of recognition.
Collectability of trade receivables is reviewed on an ongoing basis. Debts which are known to be uncollectible are written off. A provision for doubtful receivables is established when there is objective evidence that the Group will not be able to collect all amounts due according to the original terms of receivables. The amount of the provision is the difference between the asset’s carrying amount and the present value of estimated future cash fl ows, discounted at the effective interest rate. The amount of the provision is recognised in the income statement.
(n) InventoriesRaw materials and stores, ore stockpiles, work-in-progress and fi nished gold stocks are valued at the lower of cost and net realisable value.
Cost comprises direct materials, direct labour and an appropriate proportion of variable and fi xed overhead expenditure relating to mining activities, the latter being allocated on the basis of normal operating capacity. Costs are assigned to individual items of inventory on the basis of weighted average costs. Net realisable value is the estimated selling price in the ordinary course of business, less the estimated costs of completion and the estimated costs necessary to make the sale.
(o) Non-current assets held for saleNon-current assets that are classifi ed as held for sale are stated at the lower of their carrying amount and fair value, less costs to sell, if their carrying amount is to be recovered principally through a sale transaction rather than through continued use.
An impairment loss is recognised for any initial or subsequent write down of the asset to fair value less costs to sell. A gain is recognised for any subsequent increases in fair value less costs to sell an asset, but not in excess of any cumulative impairment loss previously recognised. A gain or loss not previously recognised by the date of the sale of the non-current asset is recognised at the date of de-recognition.
Non-current assets are not depreciated or amortised while they are classifi ed as held for sale.
Non-current assets classifi ed as held for sale are presented separately from the other assets in the balance sheet.
Note 1 Summary of signifi cant accounting policies cont.
(j) Business combinations cont.
Consideration transferred includes the fair values of the assets transferred, liabilities incurred by the Group to the previous owners of the acquiree, and equity interests issued by the Group. Consideration transferred also includes the fair value of any contingent consideration (where its fair value can be measured reliably) and share-based payment awards of the acquiree that are replaced mandatorily in the business combination. If a business combination results in the termination of pre-existing relationships between the Group and the acquire, then the lower of the termination amount, as contained in the agreement, and the value of the off-market element is deducted from the consideration transferred and recognised in other expenses.
Transaction costs that the Group incurs in connection with a business combination, such as fi nder’s fees, legal fees, due diligence fees, and other professional and consulting fees, are expensed as incurred.
(k) Impairment of assetsAll assets values are reviewed at each half year to determine whether there have been any events or changes in circumstances that indicate that the carrying value may not be recoverable. Where an indicator of impairment exists, a formal estimate of the recoverable amount is made. An impairment loss is recognised for the amount by which the asset’s carrying amount exceeds its recoverable amount. The recoverable amount is the higher of an asset’s fair value less costs to sell and value in use. In assessing value in use, the estimated future cash fl ows are discounted to their present value using a pre-tax discount rate which refl ects current market assessments of the time value of money and the risks specifi c to the asset. For the purposes of assessing impairment, assets are grouped at the lowest levels for which there are separately identifi able cash infl ows, largely independent of the cash infl ows from other assets or groups of assets (cash-generating units).
An impairment loss is recognised if the carrying amount of an asset or its cash generating unit exceeds the recoverable amount. Impairment losses are recognised in the income statement.
(l) Cash and cash equivalentsFor cash fl ow statement presentation purposes, cash and cash equivalents include cash on hand, deposits held at call with fi nancial institutions, other short term, highly liquid investments with original maturities of three months or less that are readily convertible to known amounts of cash and which are subject to an insignifi cant risk of changes in value, and bank overdrafts. Bank overdrafts are shown within borrowings in current liabilities on the balance sheet.
www.stbarbara.com.au – Annual Report : : 61
Notes to the Consolidated Financial Statements continuedFor the year ended 30 June 2010
component of equity net of attributable tax. When an asset is derecognised the cumulative gain or loss in equity is transferred to the income statement.
(q) Derivative fi nancial instrumentsDerivative fi nancial instruments may be held to protect against the Group’s Australian dollar gold price risk exposures. Derivatives are initially recognised at fair value on the date a derivative contract is entered into and are subsequently remeasured to fair value at each reporting date. The accounting for subsequent changes in fair value depends on whether the derivative is designated as a hedging instrument, and if so, the nature of the item being hedged. The Group designates certain derivatives as either (1) hedges of the fair value of recognised assets or liabilities or a fi rm commitment (fair value hedge); or (2) hedges of the cash fl ows of recognised assets and liabilities and highly probable forecast transactions (cash fl ow hedges).
The Group documents at the inception of the hedging transaction the relationship between hedging instruments and hedged items, as well as its risk management objective and strategy for undertaking various hedge transactions. The Group also documents its assessment, both at hedge inception and on an ongoing basis, of whether the derivatives that are used in hedging transactions have been, and will continue to be, highly effective in offsetting changes in fair values or cash fl ows of hedged items.
The fair values of various derivative fi nancial instruments used for hedging purposes are disclosed in Note 22. Movements in the hedging reserve in shareholders’ equity are shown in Note 25.
(i) Cash fl ow hedge
The fair value of option contracts comprises intrinsic value, that is, the extent to which the components of an option collar are in the money due to spot prices falling below or rising above the option strike prices, and time value.
The effective portion of changes in the intrinsic value of derivatives that are designated and qualify as cash fl ow hedges is recognised in equity in the hedging reserve. The gain or loss relating to the ineffective portion and time value is recognised immediately in the income statement.
Amounts accumulated in equity are recycled in the income statement in the periods when the hedged item will affect profi t or loss (for instance, when the forecast sale that is hedged takes place). The gain or loss relating to the effective portion of the fi nancial instrument hedging Australian dollar gold sales is recognised in the income statement within ‘gold sales revenue’.
(p) Investments and other fi nancial assetsThe Group classifi es its investments and other fi nancial assets in the following categories: fi nancial assets at fair value through profi t or loss, loans and receivables, and available-for-sale fi nancial assets. The classifi cation depends on the purpose for which the investments were acquired. Management determines the classifi cation of its investments at initial recognition and re-evaluates this designation at each reporting date.
Investments and other fi nancial assets are recognised initially at fair value plus, for assets not at fair value through profi t and loss, any directly attributable transaction costs, except as described below. Subsequent to initial recognition, investments and other fi nancial assets are measured as described below.
(i) Financial assets at fair value through profi t or loss
Financial assets at fair value through profi t or loss are fi nancial assets held for trading, which were acquired principally for the purpose of selling in the short term with the intention of making a profi t. Derivatives are also categorised as held for trading, unless they are designated as hedges. Financial assets at fair value through profi t or loss are measured at fair value and changes therein are recognised in the income statement. Attributable transaction costs are recognised in the income statement when incurred.
(ii) Loans and receivables
Loans and receivables are non derivative fi nancial assets with fi xed or determinable payments that are not quoted in an active market. They arise when the Group provides money, goods or services directly to a debtor with no intention of selling the receivable. They are included in current assets, except for those with maturities greater than 12 months after the balance sheet date, which are classifi ed as non-current assets. Loans and receivables are included in receivables in the balance sheet and are shown in Note 12.
Loans and receivables are measured at amortised cost using the effective interest method, less any impairment losses.
(iii) Available-for-sale fi nancial assets
Available for sale fi nancial assets, comprising principally marketable equity securities, are non derivative fi nancial assets that are either designated in this category or not classifi ed in any of the other categories. They are included in non current assets, unless management intends to and can dispose of the investment within 12 months of the balance sheet date.
Subsequent to initial recognition, available-for-sale fi nancial assets are measured at fair value and changes therein, other than impairment losses, are recognised as a separate

62
Notes to the Consolidated Financial Statements continuedFor the year ended 30 June 2010
The fair value of fi nancial instruments that are not traded in an active market (for example, over the counter derivatives) is determined using generally accepted valuation techniques. The Group uses a variety of methods and makes assumptions that are based on market conditions existing at each balance date.
The nominal value less estimated credit adjustments of trade receivables and payables are assumed to approximate their fair values. The fair value of fi nancial liabilities for disclosure purposes is estimated by discounting the future contractual cash fl ows at the current market interest rate that is available to the Group for similar fi nancial instruments.
(t) Property, plant and equipmentBuildings, plant and equipment are stated at historical cost less accumulated depreciation. Historical cost includes expenditure that is directly attributable to the acquisition of the items. Cost may also include transfers from equity of any gains/losses on qualifying cash fl ow hedges of foreign currency purchases of property, plant and equipment.
Subsequent costs are included in the asset’s carrying amount or recognised as a separate asset, as appropriate, only when it is probable that future economic benefi ts associated with the item will fl ow to the Group and the cost of the item can be measured reliably. All other repairs and maintenance are charged to the income statement during the fi nancial period in which they are incurred.
Depreciation of assets is calculated using the straight line method to allocate the cost or revalued amounts, net of residual values, over their estimated useful lives, as follows:
– Buildings 10 – 15 years– Plant and equipment 3 – 10 years– Fixtures and fi ttings 10 – 15 years
Where the carrying value of an asset is less than its estimated residual value, no depreciation is charged. The assets’ residual values and useful lives are reviewed, and adjusted if appropriate,at each balance sheet date.
An asset’s carrying amount is written down immediately to its recoverable amount, if the asset’s carrying amount is greater than its estimated recoverable amount (Note 1(k)).
Gains and losses on disposal are determined by comparing proceeds with carrying amount. These gains and losses are included in the income statement when realised.
(u) Trade and other payablesThese amounts represent liabilities for goods and services provided to the Group prior to the end of the fi nancial year, which remains unpaid as at reporting date. The amounts are unsecured and are usually paid within 30 days from the end of the month of recognition.
Note 1 Summary of signifi cant accounting policies cont.
(q) Derivative fi nancial instruments cont.
When a hedging instrument expires or is sold or terminated, or when a hedge no longer meets the criteria for hedge accounting, any cumulative gain or loss existing in equity at that time remains in equity and is recognised when the forecast transaction is ultimately recognised in the income statement. When a forecast transaction is no longer expected to occur, the cumulative gain or loss that was reported in equity is immediately transferred to the income statement.
(ii) Derivatives that do not qualify for hedge accounting
Certain derivative instruments do not qualify for hedge accounting. Changes in the fair value of any derivative instrument that does not qualify for hedge accounting are recognised immediately in the income statement.
(r) Compound fi nancial instrumentsCompound fi nancial instruments issued by the Group comprise convertible notes that can be converted to share capital at the option of the holder, and the number of shares to be issued does not vary with changes in the fair value of the notes.
The liability component of a compound fi nancial instrument is recognised initially at the fair value of a similar liability that does not have an equity conversion option. The equity component is recognised initially at the difference between the fair value of the compound fi nancial instrument as a whole and the fair value of the liability component. Any directly attributable transaction costs are allocated to the liability and equity components in proportion to their initial carrying amounts.
Subsequent to initial recognition, the liability component of a compound fi nancial instrument is measured at amortised cost using the effective interest method, unless it is designated at fair value through profi t and loss. The equity component of a compound fi nancial instrument is not remeasured subsequent to initial recognition.
(s) Fair value estimationThe fair value of fi nancial assets and fi nancial liabilities must be estimated for recognition and measurement, or for disclosure purposes.
The fair value of fi nancial instruments traded in active markets (such as publicly traded derivatives, and trading and available for sale securities) is based on quoted market prices at the balance sheet date. The quoted market price used for fi nancial assets held by the Group is the current bid price; the appropriate quoted market price for fi nancial liabilities is the current ask price.

www.stbarbara.com.au – Annual Report : : 63
Notes to the Consolidated Financial Statements continuedFor the year ended 30 June 2010
assessments of the time value of money and the risks specifi c to the liability. The increase in the provision due to the passage of time is recognised as interest expense.
(y) Employee benefi ts(i) Wages and salaries, and annual leave
Liabilities for wages and salaries, including non-monetary benefi ts and annual leave expected to be paid within 12 months of the reporting date are recognised in other payables in respect of employees’ services up to the reporting date and are measured at the amounts expected to be paid, including expected on-costs, when the liabilities are settled.
(ii) Long service leave
The liability for long service leave is recognised in the provision for employee benefi ts and measured as the present value of expected future payments to be made, plus expected on-costs, in respect of services provided by employees up to the reporting date. Consideration is given to the expected future wage and salary levels, experience of employee departures and periods of service. Expected future payments are discounted using market yields at the reporting date on national government bonds with terms to maturity and currency that match, as closely as possible, the estimated future cash outfl ows.
(iii) Share-based payments
Share-based compensation benefi ts are provided to employeesvia the St Barbara Limited Employees’ Option Plan and shareholder approved executive options. Information relating to these schemes is set out in Note 37.
The fair value of Executive Options and options granted under the St Barbara Limited Employees’ Option Plan is recognised as an employee benefi t expense with a corresponding increase in equity. The fair value is measured at grant date and recognised over the period during which the employees become unconditionally entitled to the options. The amount recognised is adjusted at each reporting date to refl ect the actual number of share options not expected to vest.
The fair value at grant date is independently determined using a Black-Scholes option pricing model that takes into account the exercise price, the term of the option, the vesting and performance criteria, the impact of dilution, the non-tradeable nature of the option, the share price at grant date and expected price volatility of the underlying share, the expected dividend yield and the risk-free interest rate for the term of the option.
Upon the exercise of options, the balance of the share-based payments reserve relating to those options is transferred to share capital.
(v) BorrowingsBorrowings are initially recognised at fair value, net of transaction costs incurred. Borrowings are subsequently measured at amortised cost. Any difference between the proceeds (net of transaction costs) and the redemption amount is recognised in the income statement over the period of the borrowings using the effective interest method. Fees paid on the establishment of loan facilities, which are not incremental costs relating to the actual draw down of the facility, are recognised as prepayments and amortised on a straight line basis over the term of the facility.
The fair value of the liability portion of convertible debt is determined using a market interest rate for an equivalent nonconvertible debt. This amount is recorded as a liability on an amortised cost basis until extinguished on conversion or maturity of the debt. The remainder of the proceeds is allocated to the conversion option. This is recognised and included in shareholders’ equity, net of income tax effects.
Borrowings are classifi ed as current liabilities unless the Group has an unconditional right to defer settlement of the liability for at least 12 months after the reporting date.
(w) Borrowing costsBorrowing costs incurred for the construction of any qualifying asset are capitalised during the period of time it is required to complete and prepare the asset for its intended use or sale. Other borrowing costs are recognised as expenses in the period in which they are incurred.
(x) ProvisionsProvisions, including those for legal claims and rehabilitation and restoration costs, are recognised when the Group has a present legal or constructive obligation as a result of past events, it is more likely than not that an outfl ow of resources will be required to settle the obligation, and the amount has been reliably estimated. Provisions are not recognised for future operating losses.
Where there are a number of similar obligations, the likelihood that an outfl ow will be required in settlement is determined by considering the class of obligations as a whole. A provision is recognised even if the likelihood of an outfl ow with respect to any one item included in the same class of obligations may be small.
A provision for restructuring is recognised when the Group has approved a detailed and formal restructuring plan, and the restructuring has commenced or has been announced publicly. Future operating costs are not provided for.
Provisions are measured at the present value of management’s best estimate of the expenditure required to settle the present obligation at the balance sheet date. The discount rate used to determine the present value refl ects current market

64
Notes to the Consolidated Financial Statements continuedFor the year ended 30 June 2010
the weighted average number of shares assumed to have been issued for no consideration in relation to dilutive potential ordinary shares.
(ab) Restricted cashFunds placed on deposit with fi nancial institutions to secure bank guarantees are classifi ed as current receivables.
(ac) Rehabilitation and mine closureThe Group has obligations to dismantle, remove, restore and rehabilitate certain items of property, plant and equipment and areas of disturbance during mining operations.
Under AASB 116 Property, Plant and Equipment, the cost of an asset must include any estimated costs of dismantling and removing the asset and restoring the site on which it is located. The capitalised rehabilitation and mine closure costs are depreciated (along with the other costs included in the asset) over the asset’s useful life.
AASB 137 Provisions, Contingent Liabilities and Contingent Assets requires a provision to be made for the estimated cost of rehabilitation and restoration of areas disturbed during mining operations up to reporting date but not yet rehabilitated. Provision has been made in full for all the disturbed areas at the reporting date based on current estimates of costs to rehabilitate such areas, discounted to their present value based on expected future cash fl ows. The estimated cost of rehabilitation includes the current cost of contouring, topsoiling and revegetation to meet legislative requirements. Changes in estimates are dealt with on a prospective basis as they arise.
There is some uncertainty as to the amount of rehabilitation obligations that will be incurred due to the impact of changes in environmental legislation and many other factors, including future developments, changes in technology and price increases.
At each reporting date the rehabilitation liability is remeasured in line with changes in the timing and /or amounts of the costs to be incurred and discount rates. The liability is adjusted for changes in estimates. Adjustments to the estimated amount and timing of future rehabilitation and restoration cash fl ows are a normal occurrence in light of the signifi cant judgments and estimates involved.
As the value of the provision represents the discounted value of the present obligation to restore, dismantle and rehabilitate,the increase in the provision due to the passage of time is recognised as a borrowing cost.
(ad) Rounding of amountsThe company is of a kind referred to in Class Order 98/100, issued by the Australian Securities and Investments Commission,relating to the “rounding off” of amounts in the fi nancial
Note 1 Summary of signifi cant accounting policies cont.
(y) Employee benefi ts cont.
(iv) Retirement benefi t obligations
Contributions to defi ned contribution funds are recognised as an expense as they are due and become payable. Prepaid contributions are recognised as an asset to the extent that a cash refund or a reduction in future payments is available.
The Group has no obligations in respect of defi ned benefi t funds.
(v) Executive incentives
Senior executives may be eligible for Short Term Incentive payments (“STI”) subject to achievement of Key Performance Indicators, as recommended by the Remuneration Committee and approved by the Board of Directors. The Group recognises a liability and an expense for STIs in the reporting period during which the service was provided by the employee.
(vi) Termination benefi ts
Termination benefi ts are recognised as an expense when the Group is demonstrably committed, without realistic possibility of withdrawal, to a formal detailed plan to terminate employment before normal retirement date.
(z) Contributed equityOrdinary shares are classifi ed as equity. Incremental costs directly attributable to the issue of ordinary shares and share options are recognised as a deduction from equity, net of any tax effects.
If the entity reacquires its own equity instruments, e.g. as the result of a share buy-back, those instruments are deducted from equity and the associated shares are cancelled. No gain or loss is recognised in the income statement and the consideration paid including any directly attributable incremental costs is recognised directly in equity.
(aa) Earnings per share(i) Basic earnings per share
Basic earnings per share is calculated by dividing the profi t attributable to equity holders of the Company, excluding any costs of servicing equity other than ordinary shares, by the weighted average number of ordinary shares outstanding during the reporting period, adjusted for bonus elements in ordinary shares issued during the reporting period.
(ii) Diluted earnings per share
Diluted earnings per share adjusts the fi gures used in the determination of basic earnings per share to take into account the after income tax effect of interest and other fi nancing costs associated with dilutive potential ordinary shares and
www.stbarbara.com.au – Annual Report : : 65
Notes to the Consolidated Financial Statements continuedFor the year ended 30 June 2010
instruments for a fi xed amount in any currency are equity instruments if the entity offers the rights, options or warrants pro-rata to all existing owners of the same class of its own non-derivative equity instruments. The amendments, which will become mandatory for the Group’s 30 June 2011 fi nancial statements, are not expected to have any impact on the fi nancial statements.
(vi) IFRIC 19 Extinguishing Financial Liabilities with Equity Instruments addresses the accounting by an entity when the terms of a fi nancial liability are renegotiated and result in the entity issuing equity instruments to a creditor of the entity to extinguish all or part of the fi nancial liability. IFRIC 19 will become mandatory for the Group’s 30 June 2011 fi nancial statements, with retrospective application required. It is not expected to have any impact on the fi nancial statements.
Note 2 New Standards adopted
(i) Determination and presentation of operating segmentsThe Company has applied the requirements of AASB 8 Operating Segments for the fi rst time, which became effective for the current reporting date. The Company had previously reported segments based on the commodity and region it had operated in – being ‘gold’ and ‘Australia’. AASB 8 requires segments to be identifi ed based on internal reports that are reviewed and used by the chief operating decision maker in assessing performance and in determining the allocation of resources.
The Company has determined that two reportable segments exist: Leonora Operations and Southern Cross Operations. Discrete information for each of these operating business units are reported to the Chief Executive Offi cer and his management team on at least a monthly basis.
Segment information on the reportable segments is disclosed in Note 5 to the fi nancial statements. Comparative informationhas been re-presented so it is in conformity with the new standard.
(ii) Presentation of fi nancial statementsThe Company has applied revised AASB 101 ‘Presentation of Financial Statements’ for the fi rst time, which became effective for the current reporting period. As a result the Company has presented in the consolidated statement of changes of equity all owner related changes in equity, whereas all non-owner changes in equity are presented in the statement of comprehensive income. Comparative information has been re-presented so it is in conformity with the revised standard.
report. Amounts in the fi nancial report have been rounded off in accordance with that Class Order to the nearest thousand dollars, or in certain cases, the nearest dollar.
(ad) New accounting standards and interpretationsThe following standards, amendments to standards and interpretations have been identifi ed as those which may impact the Group in the period of initial application. They are available for early adoption at 30 June 2010, but have not been applied in preparing this fi nancial report.
(i) AASB 9 Financial Instruments includes requirements for the classifi cation and measurement of fi nancial assets resulting from the fi rst part of Phase 1 of the project to replace AASB 139 Financial Instruments: Recognition and Measurement. AASB 9 will become mandatory for the Group’s 30 June 2014 fi nancial statements. Retrospective application is generally required, although there are exceptions, particularly if the entity adopts the standard for the year ended 30 June 2012 or earlier. The Group has not yet determined the potential effect of the standard.
(ii) AASB 124 Related Party Disclosures (revised December 2009) simplifi es and clarifi es the intended meaning of the defi nition of a related party and provides a partial exemption from the disclosure requirements for government-related entities. The amendments, which will become mandatory for Group’s 30 June 2012 fi nancial statements, are not expected to have any impact on the fi nancial statements.
(iii) AASB 2009-5 Further amendments to Australian Accounting Standards arising from the Annual Improvements Process impact various AASBs resulting in minor changes for presentation, disclosure, recognition and measurement purposes. The amendments, which become mandatory for the Group’s 30 June 2011 fi nancial statements, are not expected to have a signifi cant impact on the fi nancial statements.
(iv) AASB 2009-8 Amendments to Australian Accounting Standards – Group Cash-settled Share-based Payment Transactions resolves diversity in practice regarding the attribution of cash-settled share-based payments between different entities within a group. As a result of the amendments AI 8 Scope of AASB 2 and AI 11 AASB 2 – Group and Treasury Share Transactions will be withdrawn from the application date. The amendments, which become mandatory for the Group’s 30 June 2011 fi nancial statements, are not expected to have a signifi cant impact on the fi nancial statements.
(v) AASB 2009-10 Amendments to Australian Accounting Standards – Classifi cation of Rights Issue [AASB 132] (October 2010) clarifi es that rights, options or warrants to acquire a fi xed number of an entity’s own equity

66
Notes to the Consolidated Financial Statements continuedFor the year ended 30 June 2010
Note 2 New Standards adopted cont.
(iii) Disclosure of parent entity statementsAmendments to the Corporations Act 2001 contained in the Corporations Amendment Bill 2010 received royal assent during the year. One of the key amendments was to remove the requirement to include full parent entity fi nancial statements when preparing consolidated fi nancial statements. The Company has applied these changes to these fi nancial statements. Parent entity disclosures now required by the Corporations Amendment Regulations 2010 are included in Note 26.
Note 3 Financial risk management
This note presents information about each of the fi nancial risks that the Group is exposed to, the policies and processes for measuring and managing fi nancial risk, and the management of capital. Further quantitative disclosures are included throughout this fi nancial report.
The Group’s activities expose it to a variety of fi nancial risk, being: market risk (especially gold price and exchange rate risk), credit risk, liquidity risk and cash fl ow interest rate risk. The Group’s overall risk management program focuses on the unpredictability of commodity markets and seeks to minimise potential adverse effects on the fi nancial performance of the Group. The Group may use derivative instruments as appropriate to manage certain risk exposures.
Risk management is carried out by a centralised treasury function in accordance with policies approved by the Board of Directors.
(a) Market riskMarket risk is the risk that changes in market prices, such as commodity prices, foreign exchange rates, interest rates and equity prices will affect the Group’s income or the value of its holdings of fi nancial instruments, cash fl ows and fi nancial position. The Group may enter into derivatives, and also incur fi nancial liabilities, in order to manage market risks. All such transactions are carried out within guidelines set by the Board.
(i) Commodity price risk
The Group is exposed to Australian dollar gold price risk. This risk arises through the sale of gold.
The table below shows the effect of the 5 year average annual Australian dollar gold price movement on the trade receivables balance at year end:
5 year average annual price Change in movement trade receivables
2010 2009 $’000 $’000
Commodity: gold (AUD) 21% 1,759 889
The Group is managing commodity price risk in relation to a specifi c future mining operation, still to be developed and commissioned, by using a combination of gold put options and gold call options to create a zero-cost option collar structure as described in (b) below.
(ii) Currency risk
The Group is exposed to currency risk on gold sales where the Australian dollar spot gold price is quoted as a function of US dollars and the prevailing exchange rate. The Group may from time to time use Australian dollar derivatives to manage the commodity and currency rates.
(iii) Interest rate risk
The Group’s main interest rate risk arises from long-term borrowings. Borrowings issued at variable rates expose the Group to cash fl ow interest rate risk. Borrowings issued at fi xed rates expose the Group to fair value interest rate risk. The Group’s interest rate policy does not require a fi xed and pre-determined proportion of its interest rate exposure to be hedged. Any decision to hedge interest rate risk will be assessed at the inception of each fl oating rate debt facility in relation to the overall Group exposure, the prevailing interest rate market, and any funding counterparty requirements.
(b) Cash fl ow hedgesThe Group may from time to time be party to derivative fi nancial instruments in the normal course of business to protect future revenue from gold operations from a signifi cant fall in the Australian dollar price of gold, in accordance with the Group’s fi nancial risk management policies.
During June 2010, the Company entered into a hedging facility for 250,000 ounces of gold over a fi ve year period to manage Australian dollar gold price risk associated with the estimated production from the King of the Hills mine. The facility was fully drawn down by purchasing put options and selling call options over 250,000 ounces of gold (collar structure) with the following strikes:
• Bought put options at A$1,425/oz• Sold call options at A$1,615/oz

www.stbarbara.com.au – Annual Report : : 67
Notes to the Consolidated Financial Statements continuedFor the year ended 30 June 2010
Note 3 Financial risk management cont.
The maturity profi le of the put and call option contracts as at 30 June 2010 is provided in the table below.
6 months 6 – 12 1 – 2 2 – 5 More than Total or less months years years 5 yearsStrike Price ounces ounces ounces ounces ounces ounces
Put: A$1,425/oz 250,000 – 12,000 63,000 175,000 –
Call: A$1,615/oz 250,000 – 12,000 63,000 175,000 –
At the date of entering into the collar structure, the net fair value of the put and call options was zero dollars. At 30 June 2010, the fair value of all remaining put and call option contracts was negative $38,674,000. $19,513,000 of this negative fair value represented an unrealised loss related to time value of the put options, and was recognised immediately in the income statement (refer to note 1(q)). The remaining $19,161,000 of the negative fair value represented an unrealised loss related to the intrinsic value of the options, and was recognised in the hedging reserve in equity.
The relationship between currencies, spot gold price and volatilities is complex and changes in the spot gold price can infl uence volatility, and vice versa.
The following table summarises the impact of a A$50 change in the Australian dollar gold price (all other variables held constant) on the valuation of the gold option fair values.
Impact on Impact on equityGold Price Sensitivity post-tax result net of tax
2010 2009 2010 2009 $’000 $’000 $’000 $’000
+A$50 change in AUD spot price (2,460) – (8,752) –
–A$50 change in AUD spot price 2,460 – 8,752 –
(c) Credit riskCredit risk is the risk that a counterparty will not meet its obligations under a fi nancial instrument or customer contract. The Group is exposed to credit risk from its operating activities (primarily customer receivables) and from its fi nancing activities, including deposits with banks and fi nancial institutions and derivatives.
The maximum exposure to credit risk at the reporting date is the carrying amount of the fi nancial assets, other than available-for-sale assets.
Credit risks related to receivables
The Group’s most signifi cant customer accounts for $8,294,000 of the trade receivables carrying amount at 30 June 2010 (2009: $4,192,000), representing receivables owing from gold sales. Settlement of the receivables relating to gold sales occurred on 2 July 2010. Based on historic rates of default, the Group believes that no impairment has occurred with respect to trade receivables, and none of the trade receivables at 30 June 2010 were past due.
Credit risks related to cash deposits and derivatives
Credit risk from balances with banks and fi nancial institutions derivative counterparties is managed by the centralised Treasury function in accordance with Board approved policy. Investments of surplus funds are only made with approved counterparties (minimum Standard & Poor’s credit rating of “AA–”) and there is a fi nancial limit on funds placed with any single counterparty.
Derivative transactions are only made with approved counterparties (minimum Standard & Poor’s credit rating of “AA–“), and more than one counterparty is used when tranches of derivatives are entered into. Derivatives transactions cover only a small proportion of total Group production with maturities occurring over a period of time (refer Note 3(b)).

68
Notes to the Consolidated Financial Statements continuedFor the year ended 30 June 2010
Note 3 Financial risk management cont.
(d) Capital managementThe Group’s total capital is defi ned as total shareholders’ funds plus net debt.
Consolidated Capital
2010 2009 $’000 $’000
Total shareholders’ funds 349,468 296,472
Borrowings 15,909 97,541
Cash and cash equivalents (1) (15,909) (53,692)
Total capital 349,468 340,321
(1) Cash and cash equivalents are included to the extent that the net debt position is nil.
The Group does not have a target debt/equity ratio. There were no changes in the Group’s approach to capital management during the year.
The Group is not subject to externally imposed capital requirements other than normal banking requirements.
Cash and cash equivalents does not include cash held on deposit with a fi nancial institution as security for a bank guarantee facility totalling $388,000 (2009: $24,339,000) at the reporting date.
Borrowings include $1,200,000 of convertible notes on issue (2009: $77,100,000). During the 2010 fi nancial year, the company repaid $75,900,000 of convertibles notes. The remaining $1,200,000 was repaid by the Company in July 2010 (refer Note 33) under the terms of the notes, which allowed the Company to compulsorily repay the convertible notes if the outstanding balance was less than 10% of the face value of the notes when issued ($100,000,000).
On 13 May 2010, the Company refi nanced its performance bond facility. A $25,000,000 performance bond facility was entered into with the National Australia Bank Limited (NAB) to provide security for performance obligations incurred in the ordinary course of business. The NAB facility replaced a cash backed facility previously provided by another counterparty. The NAB facility does not require cash backing. Security is provided in the form of a fi xed and fl oating charge over the Company’s assets (except those held as security for the GE facility and other fi nance leases), and mining tenements held by the Company. Under the terms of the NAB facility, there are a number of undertakings related to the performance of the Company, and non-compliance with these undertakings could constitute an event of default. Under the terms of the facility the Company has up to 90 days to remedy or rectify a non-compliance event in relation to the undertakings.
In November 2009 the Company received net proceeds from the issue of new shares to institutional shareholders of $70,792,000. In December 2009 the Company received net proceeds from the issue of new shares to retail shareholders of $48,029,000.
On 21 August 2009, the Company entered into a A$50,000,000 Equity Line standby facility from US-based investment fund YA Global. Under the terms of the facility St Barbara may, at its discretion, issue ordinary shares to YA Global at any time over a 60 month period up to a total of A$50,000,000. There has been no draw down under this facility.
Shares issued to YA Global will be priced at the lowest of the daily volume weighted average prices of the Company’s shares traded on each of the 10 trading days following an advance draw down notice by St Barbara. A commission of 4% will be payable to YA Global on the proceeds of each issue of shares at the time of the issue. The Company nominates in advance the amount in relation to each draw down under the facility. The advance amount for the fi rst and second draw down is limited to $750,000 and $1,500,000 respectively, and thereafter the advance amount shall not exceed $3,000,000 in any 10-day trading period.
During 2008 the Company signed a $20,000,000 loan facility agreement with GE Commercial Finance to fund the construction and purchase of certain infrastructure assets at Gwalia. The facility is secured against the equipment fi nanced and is repayable over 48 months. The interest rate is the 90 day bank bill rate plus an interest margin of 2.8%. Under the terms of the GE facility, there are a number of undertakings related to the performance of the Company, and non-compliance with these undertakings could constitute an event of default. Under the terms of facility the Company has up to 90 days to remedy or rectify a non-compliance event in relation to the operational undertakings.

www.stbarbara.com.au – Annual Report : : 69
Notes to the Consolidated Financial Statements continuedFor the year ended 30 June 2010
Note 3 Financial risk management cont.
(e) Liquidity riskPrudent liquidity risk management requires maintaining suffi cient cash and marketable securities, the availability of funding through an adequate amount of committed credit facilities and the ability to close out market positions.
The Group manages liquidity risk by continuously monitoring forecast and actual cash fl ows and matching maturity profi les of fi nancial assets and liabilities.
Surplus funds are invested in instruments that are tradeable in highly liquid markets.
Maturities of fi nancial liabilities
The table below analyses the Group’s fi nancial liabilities. The amounts disclosed in the table are the contractual undiscounted cash fl ows.
Maturity of fi nancial liabilities – 2010
Between Total Less than 6 – 12 1 and 5 Over contractual Carrying$’000 6 months months years 5 years cash fl ows amount
Convertible notes 1,208 – – – 1,208 1,200
Finance lease liabilities 534 369 1,281 – 2,184 1,994
Equipment fi nance facility 2,957 2,977 8,090 – 14,024 12,921
Trade and other payables 37,558 – – – 37,558 37,558
Derivative fi nancial liabilities (1) – 338 38,336 – 38,674 38,674
42,257 3,684 47,707 – 93,648 92,347
(1) Represents the mark-to-market valuation of the option collar structure, and does not represent a contractual cash fl ow. The mark-to-market valuations at 30 June 2010 will change over time as contracts mature, or with changes in the spot gold price and other option pricing variables.
Maturity of fi nancial liabilities – 2009
Between Total Less than 6 – 12 1 and 5 Over contractual Carrying$’000 6 months months years 5 years cash fl ows amount
Convertible notes 3,084 80,184 – – 83,268 77,100
Finance lease liabilities 564 466 1,671 – 2,701 2,484
Equipment fi nance facility 2,833 2,866 13,520 – 19,219 17,464
Insurance premium funding liability 1,345 620 – – 1,965 1,906
Trade and other payables 38,376 – – – 38,376 38,376
46,202 84,136 15,191 – 145,529 137,330
(f) Fair value estimationOn-Balance Sheet
The net fair value of cash and cash equivalents and non-interest bearing monetary fi nancial assets and fi nancial liabilities of the Group approximates their carrying value. The net fair value of other monetary fi nancial assets and fi nancial liabilities is based upon market prices.
The fair value of the gold put and call options is as disclosed in Note 4(vii).

70
Notes to the Consolidated Financial Statements continuedFor the year ended 30 June 2010
Note 3 Financial risk management cont.
(f) Fair value estimation cont.
Off-Balance Sheet
The Group has potential fi nancial liabilities that may arise from the contingency disclosed in Note 28. As explained in that note, no material losses are anticipated in respect of any of that contingency, subject to the outcome of the judgement and any subsequent appeal in the Kingstream matter. Fair values for off-balance sheet assets or liabilities are the Directors’ estimate of amounts which would be payable by the Group as consideration for the assumption of those contingencies by another party.
Fair values
The carrying amounts and the net fair values of fi nancial assets and liabilities of the Group at balance date are:
2010 2009
Carrying Net Fair Carrying Net Fair Amount Value Amount Value $’000 $’000 $’000 $’000
Financial assets
– Cash and cash equivalents 102,157 101,861 53,692 53,692
– Restricted cash 388 388 24,339 24,339
– Receivables 12,238 12,238 8,120 8,120
– Prepayments 2,854 2,854 2,477 2,477
– Available for sale fi nancial assets – – 13,869 13,869
117,637 117,341 102,497 102,497
Financial liabilities
– Payables 37,558 37,558 38,376 38,376
– Convertible notes 1,200 1,200 77,100 74,683
– Equipment fi nancing facility 12,921 12,902 17,464 16,401
– Gold put and call options (zero cost collar) 38,674 38,674 – –
– Other loans 1,994 1,994 4,390 4,154
92,347 92,328 137,330 133,614

www.stbarbara.com.au – Annual Report : : 71
Notes to the Consolidated Financial Statements continuedFor the year ended 30 June 2010
Note 4 Critical Accounting Estimates and Judgements
The preparation of fi nancial statements requires management to make judgements, estimates and assumptions that affect the application of accounting policies and the reported amounts of assets, liabilities, income and expenses. Actual results may differ from these estimates under different assumptions and conditions. Estimates and judgements are continually evaluated and are based on historical experience and on various other factors, including expectations of future events that are believed to be reasonable under the circumstances. Revisions to accounting estimates are recognised in the period in which the estimate is changed and in any future periods affected.
The Group has identifi ed the following critical accounting policies under which signifi cant judgements, estimates and assumptions are made, and where actual results may differ from these estimates under different assumptions and conditions that could materially affect fi nancial results or fi nancial position reported in future periods.
(i) Ore reserve estimatesReserves are estimates of the amount of gold product that can be economically extracted from the Group’s properties. In order to calculate reserves, estimates and assumptions are required about a range of geological, technical and economic factors, including quantities, grades, production techniques, recovery rates, production costs, future capital requirements, short and long term commodity prices and exchange rates.
Estimating the quantity and/or grade of reserves requires the size, shape and depth of ore bodies to be determined by analysing geological data. This process may require complex and diffi cult geological judgements and calculations to interpret the data.
The Group determines and reports ore reserves under the Australian Code for Reporting of Mineral Resources and Ore Reserves December 2004, known as the JORC Code. The JORC Code requires the use of reasonable investment assumptions to calculate reserves. Due to the fact that economic assumptions used to estimate reserves change from period to period, and geological data is generated during the course of operations, estimates of reserves may change from period to period.
Changes in reported reserves may affect the Group’s fi nancial results and fi nancial position in a number of ways, including:
• Asset carrying values may be impacted due to changes in estimated future cash fl ows.
• Depreciation and amortisation charged in the income statement may change where such charges are calculated using the units of production basis.
• Underground capital development and waste stripping costs deferred in the balance sheet or charged in the income statement may change due to a revision in stripping ratios.
• Decommissioning, site restoration and environmental provisions may change where changes in estimated reserves affect expectations about the timing or cost of these activities.
(ii) Units of production method of amortisationThe Group applies the units of production method for amortisation of its life of mine specifi c assets, which results in an amortisation charge proportional to the depletion of the anticipated remaining life of mine production. These calculations require the use of estimates and assumptions in relation to reserves and resources, metallurgy and the complexity of future capital development requirements; changes to these estimates and assumptions will impact the amortisation charge in the income statement and asset carrying values.
(iii) Impairment of assetsThe Group assesses impairment of all assets at each reporting date by evaluating conditions specifi c to the Group and to the particular assets that may lead to impairment. The recoverable amount of each Cash Generating Unit (CGU) is determined as the higher of value-in-use and fair value less costs to sell, in accordance with accounting policy 1(k). These calculations require the use of estimates, which have been outlined in accounting policy 1(k). Value-in-use is generally determined as the present value of the estimated future cash fl ows. Present values are determined using a risk adjusted discount rate appropriate to the risks inherent in the asset.
Given the nature of the Group’s mining activities, future changes in assumptions upon which these estimates are based may give rise to a material adjustment to the carrying value of the CGU. This could lead to the recognition of impairment losses in the future. The inter-relationships of the signifi cant assumptions upon which estimated future cash fl ows are based, however, are such that it is impracticable to disclose the extent of the possible effects of a change in a key assumption in isolation.
Future cash fl ow estimates are based on expected production volumes, the short and long term forecasts of the Australian dollar gold price, ore reserves, operating costs, future capital expenditure and restoration and rehabilitation costs. Management is required to make these estimates and assumptions, which are subject to risk and uncertainty. As a result there is a possibility that changes in circumstances will alter these projections, which could impact on the recoverable amount of the assets. In such circumstances some or all of the carrying value of the assets may be impaired, giving rise to an impairment charge in the income statement.

72
Notes to the Consolidated Financial Statements continuedFor the year ended 30 June 2010
Note 4 Critical Accounting Estimates and Judgements cont.
Value in use in relation to the Group’s Leonora and Southern Cross cash generating units at 30 June 2010 was determined by discounting the future cash fl ows generated from the continuing use of each operation and was based on the following key assumptions:
• Cash fl ows were projected based on the life of mine plan of each operation, which is predominantly based on ore reserves.
• Revenue was projected at an average gold price of A$1,300 per ounce for the fi rst year of the operation, and a long term gold price of A$1,250 per ounce.
• Cash operating costs take into consideration an estimate of infl ation.
• A pre-tax nominal discount rate of 11.4% based on the weighted average cost of capital.
The above estimates are particularly sensitive to a change in the gold price.
(iv) Exploration and evaluation expenditureAs set out in Note 1(f) exploration and evaluation expenditure is capitalised where reserves have been established for an area of interest and it is considered likely to be recoverable from future exploitation or sale. The accounting policy requires management to make certain estimates and assumptions as to future events and circumstances, in particular whether an economically viable extraction operation can be established. These estimates and assumptions may change as new information becomes available. If, after having capitalised the expenditure under the accounting policy, a judgement is made that recovery of the expenditure is unlikely, the relevant capitalised amount will be written off to the income statement.
(v) Rehabilitation and mine closure provisionsAs set out in Note 1(x), the value of these provisions represents the discounted value of the present obligation to restore, dismantle and rehabilitate each site. Signifi cant judgement is required in determining the provisions for mine rehabilitation and closure as there are many transactions and other factors that will affect the ultimate costs necessary to rehabilitate the mine sites. The discounted value refl ects a combination of management’s best estimate of the cost of performing the work required, the timing of the cash fl ows and the discount rate.
A change in any, or a combination of, the key assumptions used to determine the provisions could have a material impact on the carrying value of the provisions (refer to Note 23). The provision recognised for each site is reviewed at each reporting date and updated based on the facts and circumstances available at the
time. Changes to the estimated future costs for operating sites are recognised in the balance sheet by adjusting both the restoration and rehabilitation asset and provision.
In estimating the rehabilitation provision at 30 June 2010, the following assumptions were made:
• Timing of rehabilitation outfl ows were based on the life of mine plan of each operation, with the rehabilitation of legacy areas of disturbance scheduled accordingly.
• Mine demolition costs are estimated on the basis of the expected mine life of each operation. Costs are adjusted for potential receipts through the sale of scrap metal.
• Infl ation is not applied to cost estimates.
• A pre-tax real discount rate of 8% based on the weighted average cost of capital.
(vi) Deferred taxThe Group has not recognised a net deferred tax asset of $71,626,000 as at 30 June 2010 (2009: $53,247,000) on the basis that the ability to utilise the temporary differences and tax losses is not probable as at the reporting date.
(vii) Derivative fi nancial instrumentsThe Group assesses the fair value of its gold bought put and sold call options (the “collar structure”) at each reporting date.
At 30 June 2010, the fair value of the collar structure was negative $38,674,000. An amount of $19,513,000 represented an unrealised loss related to time value of the options, and was recognised immediately in the income statement (refer to note 1(q)). An unrealised loss related to the intrinsic value of the options of $19,161,000 was recognised in the gold cash fl ow hedge reserve in equity.
Fair values have been determined using a ‘Level 2’ valuation method involving the use of a generally accepted option valuation model: inputs are based on market observable data for the asset or liability, either directly (i.e. prices) or indirectly (i.e. derived from prices), at the reporting date and compared with valuations provided by the counterparties to the collar structure. These calculations require the use of estimates and assumptions. Any changes in assumptions in relation to gold prices and volatilities could have a material impact on the fair valuation attributable to the gold collar structure at the reporting date. When these assumptions change in the future the differences will impact the gold cash fl ow hedge reserve and/or income statement in the period in which the change occurs.

www.stbarbara.com.au – Annual Report : : 73
Notes to the Consolidated Financial Statements continuedFor the year ended 30 June 2010
Note 5 Segment Information
The Company has two reportable segments, Leonora and Southern Cross Operations, which are also the Company’s operating segments. The operational business units are managed separately due to their separate geographic regions.
Information regarding the operations of each reportable segment is included below. Performance is measured based on segment profi t before income tax, as this is deemed to be the most relevant in assessing performance after taking into account factors such as cost per ounce of production.
Leonora Southern Cross Total
2010 2009 2010 2009 2010 2009 $’000 $’000 $’000 $’000 $’000 $’000
Revenue 138,439 96,824 158,321 184,305 296,760 281,129
Mine operating costs (74,470) (52,438) (110,637) (131,122) (185,107) (183,560)
Gross profi t 63,969 44,386 47,684 53,183 111,653 97,569
Royalties (5,492) (3,812) (6,298) (7,179) (11,790) (10,991)
Depreciation and amortisation (31,279) (26,736) (24,515) (18,962) (55,794) (45,698)
Reportable segment profi tbefore income tax 27,198 13,838 16,871 27,042 44,069 40,880
Other material non-cash items – (15,277) (37,946) (50,765) (37,946) (66,042)
Capital expenditure (53,837) (102,420) (31,487) (32,385) (85,324) (134,805)
30 June 30 June 30 June 30 June 30 June 30 June 2010 2009 2010 2009 2010 2009 $’000 $’000 $’000 $’000 $’000 $’000
Reportable segment assets 317,928 281,773 32,743 69,175 350,671 352,990
Reconciliation of reportable segment revenues, profi t or loss, assets and liabilities, and other material items:
Consolidated
2010 2009 $’000 $’000
Revenues
Total revenue for reportable segments 296,760 281,129
Other revenue 6,765 5,411
Consolidated revenue 303,525 286,540

74
Notes to the Consolidated Financial Statements continuedFor the year ended 30 June 2010
Note 5 Segment Information cont.
Consolidated
2010 2009 $’000 $’000
Profi t or loss
Total profi t for reportable segments 44,069 40,880
Other income and revenue 7,704 5,634
Exploration expensed (5,184) (13,442)
Unallocated depreciation and amortisation (715) (598)
Other royalties – (51)
Asset write-downs (37,946) (66,042)
Finance costs (7,317) (8,996)
Net realised/unrealised loss on derivatives (19,513) (4,741)
Net realised/unrealised gain/(loss) on available for sale assets 2,724 (140)
Other corporate expenses (24,010) (28,848)
Consolidated loss before income tax (40,188) (76,344)
Consolidated
30 June 30 June 2010 2009 $’000 $’000
Assets
Total assets for reportable segments 350,671 352,990
Cash and cash equivalents 102,157 53,692
Trade and other receivables 15,480 34,936
Available for sale fi nancial assets – 13,869
Capitalised borrowing costs 8,522 9,122
Other assets 2,337 2,802
Consolidated total assets 479,167 467,411
Year ended 30 June 2010
Reportable Consolidated segment totals Impairments Unallocated totals
Other material items
Mine operating costs (185,107) (22,581) – (207,688)
Depreciation and amortisation (55,794) (15,365) (715) (71,874)
Year ended 30 June 2009
Reportable Consolidated segment totals Impairments Unallocated totals
Other material items
Mine operating costs (183,560) (2,234) – (185,794)
Depreciation and amortisation (45,698) (63,808) (598) (110,104)

www.stbarbara.com.au – Annual Report : : 75
Notes to the Consolidated Financial Statements continuedFor the year ended 30 June 2010
Note 6 Revenue
Consolidated
2010 2009 $’000 $’000
Sales revenue – continuing operations
Sale of gold 295,238 279,824
Sale of silver 1,522 1,305
296,760 281,129
Other revenue
Interest revenue 5,210 3,044
Sub-lease rental 347 288
Discount on convertible notes buy back 312 1,935
Third party revenue 896 –
Royalties – 144
6,765 5,411
Total revenue 303,525 286,540
Note 7 Other income
Consolidated
2010 2009 $’000 $’000
Profi t on sale of assets 247 110
Release of convertible note liability reserve 432 –
Other 260 113
939 223

76
Notes to the Consolidated Financial Statements continuedFor the year ended 30 June 2010
Note 8 Expenses
Consolidated
2010 2009 $’000 $’000
Profi t/(loss) before income tax includes the following specifi c expenses:
Depreciation
Buildings 752 315
Plant and equipment 8,018 5,654
Impairment write-offs 6,501 –
15,271 5,969
Amortisation
Mine development costs 45,001 34,203
Deferred waste stripping 471 4,736
Capitalised borrowing costs 1,807 971
Plant/equipment fi nance leases 460 416
Impairment write-offs 8,864 63,809
56,603 104,135
Total depreciation & amortisation 71,874 110,104
Finance Costs
Interest paid/payable 60 89
Interest on convertible notes 4,359 7,518
Borrowing costs 553 219
Convertible notes buy back costs 25 791
Finance lease 1,172 1,219
Provisions: unwinding of discount 1,148 1,180
Interest capitalised – (2,020)
7,317 8,996
Employee related expenses
Contributions to defi ned contribution superannuation funds 2,262 2,637
Termination payments 312 3,877
Equity settled share-based payments 1,175 (32)
3,749 6,482
Rental expense relating to operating leases
Lease payments 838 856

www.stbarbara.com.au – Annual Report : : 77
Notes to the Consolidated Financial Statements continuedFor the year ended 30 June 2010
Note 9 Signifi cant items
Signifi cant items are those items where their nature or amount is considered material to the fi nancial report. Such items included within the consolidated results for the period are detailed below.
Consolidated
2010 2009 $’000 $’000
Included within net realised/unrealised gains on derivatives
Net realised/unrealised (loss)/gain on gold cash fl ow hedges (1) (19,513) 1,515
Included within corporate costs
Redundancy payments – (3,877)
Restructuring provisions – (1,957)
– (5,834)
Impairment write downs included within mine operating costs
Underground deferred operating mine development at Marvel Loch (2) (22,581) –
Open pit mine development – (16,904)
(22,581) (16,904)
Impairment write downs included within depreciation and amortisation
Southern Cross assets (2) (11,583) (40,488)
Marvel Loch capitalised exploration (2) (3,782) (8,650)
(15,365) (49,138)
Included within realised/unrealised (gain)/loss on available for sale assets
Write down of listed investments to fair value – (6,192)
Gain on sale of Bendigo Mining Limited (3) 2,724 –
2,724 (6,192)
Total signifi cant items (54,735) (76,553)
(1) Net realised/unrealised (loss)/gain on gold cash fl ow hedges The gold bought put and sold call options (collar structure) were put in place during the year to manage the Australian dollar gold price risk
associated with 250,000 ounces of future King of the Hills production. At 30 June 2010 the unrealised mark-to-market value of the collar structure was negative $38,674,000. In accordance with accounting standards, the unrealised loss related to time value of the options of $19,513,000 was recognised immediately in the income statement. The unrealised loss related to the intrinsic value of the options of $19,161,000 was recognised in the hedging reserve in equity (refer note 25(a)). Over time this unrealised mark-to-market loss will reverse either through a change to the mark-to-market value of the options or maturity of the contracts.
(2) Impairment write down of Southern Cross assets Based on an assessment of the Southern Cross operations cash-generating unit at 30 June 2010, an impairment write down was taken
against assets of the unit. The impairment write down was caused by lower than expected future net cash fl ows from the Southern Cross operations as a result of a reduction in the estimated mine life, based on drilling during the year that encountered pegmatite intrusions which closed off the resources potential. The revised cash fl ow estimates from the base case mine plan no longer supported full recovery of the carrying value of the Southern Cross cash-generating unit assets, including capitalised mine operating development, plant and equipment and capitalised exploration.
(3) Gain on sale of Bendigo Mining Limited At 31 December 2008 an impairment loss of $6,192,000 in relation to the investment in Bendigo Mining Limited was recognised in the
income statement. A mark-to-market gain as at 30 June 2009 in relation to this investment of $6,687,000, which would ordinarily have reversed the impairment loss recognised in the income statement in the period ended 31 December 2008, was recorded in the investment fair value reserve in accordance with Australian Interpretation 10. In August 2009 the investment in Bendigo Mining Limited was sold for $9,909,000, which gave rise to the transfer of the amount in the investment fair value reserve to the income statement resulting in a net gain on sale of $2,724,000 recognised as “Other Income”.

78
Notes to the Consolidated Financial Statements continuedFor the year ended 30 June 2010
Note 10 Income tax expense
(a) Income tax expense
Consolidated
2010 2009 $’000 $’000
Deferred income tax (benefi t)/expense – –
(b) Numerical reconciliation of income tax expense/(benefi t) to prima facie tax payable
Consolidated
2010 2009 $’000 $’000
Loss before income tax expense/(benefi t) (40,188) (76,344)
Tax at the Australian tax rate of 30% (12,056) (22,903)
Tax effect of amounts not deductible/(taxable) in calculating taxable income:
Legal and other capital expenditure 159 538
Equity settled share based payments 193 2
Investment allowance – (40)
Sundry items 8 11
Tax losses not recognised 11,696 22,392
Income tax expense/(benefi t) – –
Refer to Note 10(c) for details of the deferred tax benefi t.
(c) Unrecognised deferred tax balance
Consolidated
2010 2009 $’000 $’000
Deferred tax liabilities
Accrued income 365 446
Mining properties – exploration 13,007 16,251
Mining properties – development 117,342 77,667
Consumables 8,956 7,690
Capitalised convertible notes costs 8,522 10,232
Total 148,192 112,286
Tax effect @ 30% 44,458 33,686
Deferred tax assets
Tax losses 332,795 239,195
Provisions and accruals 38,206 36,270
Investment fair value reserve 53 3,401
Tax assets without a carrying amount 10,711 9,474
Property, plant and equipment 5,181 1,438
Total 386,946 289,778
Tax effect @ 30% 116,084 86,933
Net deferred tax asset (unbooked) (1) 71,626 53,247
(1) The net deferred tax asset has not been recognised because it is not yet probable that future taxable profi t will be available against which the Group can utilise the benefi ts there from.

www.stbarbara.com.au – Annual Report : : 79
Notes to the Consolidated Financial Statements continuedFor the year ended 30 June 2010
Note 11 Cash and cash equivalents
Consolidated
2010 2009 $’000 $’000
Cash at bank and on hand 50,157 18,692
Term deposits 52,000 35,000
102,157 53,692
Cash placed on deposit to secure a bank guarantee facility (classifi ed as ‘Restricted Cash’) is reported as current ‘Other Receivables’ in Note 12.
(a) Cash at bank and on handCash at bank at 30 June 2010 invested “at call” was earning interest at an average rate of 6.00% per annum (2009: 2.59% per annum).
(b) DepositsThe deposits at 30 June 2010 were earning interest rates of between 5.45% and 6.25% per annum (2009: between 2.95% and 3.80% per annum).
Note 12 Trade and other receivables
Consolidated
2010 2009 $’000 $’000
Current assets
Trade receivables 8,328 4,192
Other receivables 3,910 3,928
Restricted cash (1) 388 24,339
Prepayments 2,854 2,477
15,480 34,936
(1) Restricted cash at 30 June 2010 is cash placed on deposit to secure 23 bank guarantees in respect of obligations entered into for environmental performance bonds issued in favour of the Western Australian Department of Industry and Resources. These deposits earned interest at an average interest rate of 4.45%.
(a) Effective interest rates and credit riskInformation concerning the effective interest rate and credit risk of receivables is set out in Note 16.

80
Notes to the Consolidated Financial Statements continuedFor the year ended 30 June 2010
Note 13 Inventories
Consolidated
2010 2009 $’000 $’000
Consumables 8,954 7,875
Ore stockpiles 3,043 9,681
Gold in circuit 4,570 9,217
Bullion on hand 1,488 4,285
18,055 31,058
(a) Lower of cost and net realisable valueAt 30 June 2010, there were no ore stockpiles valued at net realisable value (2009: $nil).
Note 14 Deferred mining costs
Consolidated
2010 2009 $’000 $’000
Current
Deferred waste stripping 8,867 28,702
Amortisation of deferred waste (8,867) (28,702)
– –
Deferred operating development 9,114 16,196
9,114 16,196
Non-current
Deferred operating development – 6,472
Note 15 Available-for-sale fi nancial assets
Consolidated
2010 2009 $’000 $’000
Current
At beginning of year 13,869 –
Transferred from non-current – 7,182
Additions – –
Disposals (13,869) –
Revaluation gain recognised in the income statement – –
Revaluation gain taken to equity – 6,687
– 13,869
Non-current
At beginning of year – 13,941
Additions – –
Disposals – (567)
Revaluation loss recognised in the income statement – (6,192)
Transferred to current – (7,182)
– –

www.stbarbara.com.au – Annual Report : : 81
Notes to the Consolidated Financial Statements continuedFor the year ended 30 June 2010
Note 15 Available-for-sale fi nancial assets cont.
(a) Listed securitiesDuring the year, the Group sold its investments in listed securities.
Note 16 Financial instruments
(a) Credit Risk ExposuresRefer Note 3 for the Group’s exposure to credit risk.
(b) Interest Rate Risk ExposuresThe Group’s exposure to interest rate risk and the effective weighted average interest rate by maturity periods is set out in the following tables. Exposures arise predominantly from assets and liabilities bearing variable interest rates as the Group intends to hold fi xed rate assets and liabilities to maturity.
2010 Fixed Interest Maturing in
Floating Over Non- Interest 1 year 1 to 5 interest rate or less years bearing Total $’000 $’000 $’000 $’000 $’000
Financial assets
Cash and cash equivalents 50,157 52,000 – – 102,157
Restricted cash and cash equivalents 388 – – – 388
Receivables – – – 12,238 12,238
Prepayments – – – 2,854 2,854
50,545 52,000 – 15,092 117,637
Weighted average interest rate 6.00% 5.84% – – –
Financial liabilities
Trade and other creditors – – – 37,558 37,558
Finance lease liabilities – 779 1,185 30 1,994
Equipment fi nancing facility 12,921 – – – 12,921
Convertible notes – 1,200 – – 1,200
Gold put and call options – – – 38,674 38,674
12,921 1,979 1,185 76,262 92,347
Weighted average interest rate 7.29% 8.00% 7.97% – –
Net fi nancial assets/(liabilities) 37,624 50,021 (1,185) (61,170) 25,290

82
Notes to the Consolidated Financial Statements continuedFor the year ended 30 June 2010
Note 16 Financial Instruments cont.
2009 Fixed Interest Maturing in
Floating Over Non- Interest 1 year 1 to 5 interest rate or less years bearing Total $’000 $’000 $’000 $’000 $’000
Financial assets
Cash and cash equivalents 13,693 39,999 – – 53,692
Restricted cash and cash equivalents 4,339 20,000 – – 24,339
Receivables – – – 8,120 8,120
Prepayments – – – 2,477 2,477
Available for sale fi nancial assets – – – 13,869 13,869
18,032 59,999 – 24,466 102,497
Weighted average interest rate 2.59% 3.45% – –
Financial liabilities
Trade and other creditors – – – 38,376 38,376
Finance lease liabilities – 877 1,517 90 2,484
Equipment fi nancing facility 17,464 – – – 17,464
Convertible notes – 77,100 – – 77,100
Other loans – 1,906 – – 1,906
17,464 79,883 1,517 38,466 137,330
Weighted average interest rate 5.94% 7.99% 7.76% –
Net fi nancial assets/(liabilities) 568 (19,884) (1,517) (14,000) (34,833)

www.stbarbara.com.au – Annual Report : : 83
Notes to the Consolidated Financial Statements continuedFor the year ended 30 June 2010
Note 17 Property, plant and equipment
Consolidated
2010 2009 $’000 $’000
Non-current
Land 1,093 507
Housing and site buildings 17,870 11,082
Plant and equipment 119,268 115,622
Accumulated depreciation/impairment (26,135) (9,583)
112,096 117,628
Reconciliation of the carrying amounts for each class of property, plant and equipment is set out below:
Land
At the beginning of the year 507 507
Additions 586 –
Disposals – –
At the end of the year 1,093 507
Housing and site buildings
At the beginning of the year 11,082 1,869
Additions – 9,528
Transfers from Plant and Equipment 5,900 –
Depreciation (752) (315)
At the end of the year 16,230 11,082
Plant and equipment
At the beginning of the year 106,039 70,412
Additions 9,636 41,747
Disposals (24) (51)
Transfer to Housing and Site Buildings (5,900) –
Assets written off (6,500) –
Depreciation (8,478) (6,069)
At the end of the year 94,773 106,039
Total 112,096 117,628
(a) SecurityAs at 30 June 2010, plant and equipment with a carrying value of $30,302,553 (2009: $31,854,000) is pledged as security for an equipment fi nance facility and fi nance leases (Note 21).
In accordance with the security arrangements in relation to commercial banking facilities, all remaining assets of the Group have been pledged as security to the National Australia Bank Limited and Barclays Bank PLC for a performance bond and hedging facilities. During the year, and as at 30 June 2010, there were no events of default or breaches in relation to these facilities.

84
Notes to the Consolidated Financial Statements continuedFor the year ended 30 June 2010
Note 18 Mine properties
Consolidated
2010 2009 $’000 $’000
Non-current
Mine Properties – development
At beginning of the year 185,341 41,370
Direct expenditure 75,437 62,426
Transferred from exploration and evaluation 1,454 12,079
Transferred from mines under construction – 150,822
Mine development written off (5,082) (46,508)
Adjustment to rehabilitation provision 4,381 (645)
Amortisation for the year (45,001) (34,203)
At end of the year 216,530 185,341
Mines Under Construction
At beginning of the year – 119,817
Direct expenditure – 28,682
Capitalised amortisation of convertible notes transaction costs – 303
Net borrowing costs capitalised – 2,020
Transferred to mine properties – (150,822)
At end of the year – –
Total Mine Properties 216,530 185,341
Note 19 Exploration and evaluation
Consolidated
2010 2009 $’000 $’000
Non-current
Exploration and evaluation
At beginning of the year 8,219 25,778
Acquired tenements 100 388
Tenements written off (109) –
Expenditure capitalised for the year 2,761 2,549
Transferred to mine properties (1,454) (12,079)
Exploration written off (3,782) (8,417)
At end of the year 5,735 8,219
Note 20 Trade and other payables
Consolidated
2010 2009 $’000 $’000
Current
Trade payables 36,180 36,372
Other payables 1,378 2,004
37,558 38,376

www.stbarbara.com.au – Annual Report : : 85
Notes to the Consolidated Financial Statements continuedFor the year ended 30 June 2010
Note 21 Interest bearing borrowings
Consolidated
2010 2009 $’000 $’000
Current
Secured
Lease liabilities (Note 29) 779 937
Equipment fi nance facility (Note 29) 5,197 4,818
Transaction costs (60) (84)
5,916 5,671
Unsecured
Convertible notes 1,200 77,100
Transaction costs – (1,110)
Insurance premium funding – 1,906
1,200 77,896
Total current 7,116 83,567
Non-current
Secured
Lease liabilities (Note 29) 1,215 1,547
Equipment fi nance facility (Note 29) 7,724 12,646
Transaction costs (146) (219)
Total non-current 8,793 13,974
(a) Interest rate risk exposuresDetails of the Group’s exposure to interest rate changes on borrowings are set out in Note 16.
(b) Convertible notesOn 4 December 2009, the Company accepted offers from holders of $15,350,000 of notes to buy back the notes at a discount of 2% to the original issue price. The repayment was made in two tranches, with convertible notes with a face value of $13,000,000 repaid on 4 December 2009, and convertible notes with a face value of $2,350,000 repaid on 18 January 2010.
On 1 March 2010, $1,750,000 of convertible notes was bought back for 99.7% of face value.
On 12 March 2010, $38,050,000 of convertible notes was bought back at face value.
On 4 June 2010, convertible notes with a total face value of $20,750,000 were redeemed as a consequence of note holders exercising their put options on this date.
As an event occurring after balance sheet date, on 4 July 2010, the remaining convertible notes were redeemed for the face value of $1,200,000.
(c) Equipment fi nance facilityDuring 2008 the Company signed a $20,000,000 loan facility agreement with GE Commercial Finance to fund the construction and purchase of certain infrastructure assets at Gwalia. The facility is secured against the equipment fi nanced and is repayable over 48 months. The interest rate is the 90 day bank bill rate plus an interest margin of 2.8%. Under the terms of the GE facility there are a number of undertakings related to the performance of the Company, and non-compliance with these undertakings could constitute an event of default. Under the terms of facility the Company has up to 90 days to remedy or rectify a non-compliance event in relation to the undertakings. During the year there were no events of default or breaches under this facility.

86
Notes to the Consolidated Financial Statements continuedFor the year ended 30 June 2010
(d) Set-off of assets and liabilitiesThe parent entity has established a legal right of set-off with a fi nancial institution over cash on deposit to secure the issue of bank guarantees for the purpose of environmental performance bonds. At 30 June 2010 restricted cash for this purpose amounted to $388,000 (2009: $24,339,000).
Note 22 Derivative fi nancial liabilities
Consolidated
2010 2009 $’000 $’000
Current liabilities
Fair value of gold option collar 388 –
Non-current liabilities
Fair value of gold option collar 38,336 –
(a) Instruments used by the GroupRefer to Note 3 ‘Financial Risk Management’ for details on instruments used by the Group.
Note 23 Provisions
Consolidated
2010 2009 $’000 $’000
Current
Employee benefi ts – annual leave 1,715 1,778
Employee benefi ts – long service leave 792 544
Employee benefi ts – other 1,559 513
Redundancy and restructuring provision – 1,957
Provision for rehabilitation 2,847 –
Other provisions – 1,000
6,913 5,792
Non-current
Provision for rehabilitation 29,627 28,284
Employee benefi ts – long service leave 1,018 946
30,645 29,230
Movements in Provisions
Consolidated
2010 2009 $’000 $’000
Non-current
Rehabilitation
Balance at start of year 28,284 28,812
Unwinding of discount 1,148 1,180
Expenditure incurred (1,339) (1,063)
Adjustment on re-estimation 4,381 (645)
Balance at end of year 32,474 28,284

www.stbarbara.com.au – Annual Report : : 87
Notes to the Consolidated Financial Statements continuedFor the year ended 30 June 2010
Note 24 Contributed equity
(a) Share capital
Parent entity Parent entity
2010 2009 2010 2009 Shares Shares $’000 $’000
Ordinary shares – fully paid 1,952,668,407 1,493,932,950 614,997 496,176
(b) Movements in ordinary share capital:
Number Issue priceDate Details Notes of shares (cents/ share) $’000
1 July 2008 1,158,423,891 366,466
Plus Entitlement offer (i) 140,312,045 40 56,125
Transaction costs on entitlement offer (2,587)
Plus Convertible notes converted to shares (ii) 597,014 67 400
Plus Institutional placement (iii) 189,600,000 41 77,736
Transaction costs on institutional placement (2,767)
Plus Shares issued on exercise of options (iv) 5,000,000 12 590
Transfer of Option Reserve on conversion of options 213
30 June 2009 1,493,932,950 496,176
Plus Institutional rights issue (v) 274,094,788 27 74,006
Transaction costs on institutional rights issue (3,214)
Retail rights issue (vi) 184,640,669 27 49,853
Transaction costs on retails rights issue (1,824)
1,952,668,407 614,997
(i) Retail component of a renounceable accelerated pro-rata entitlement offer on 17 July 2008(ii) Convertible notes converted to shares on 24 November 2008(iii) Institutional placement on 27 February 2009(iv) Shares issued on exercise of unlisted options held by executives and employees(v) Institutional rights issue completed on 13 November 2009(vi) Retail rights issue completed on 10 December 2009
(c) Ordinary sharesOrdinary shares entitle the holder to participate in dividends and the proceeds on winding up of the Company in proportion to the number of and amounts paid on the shares held.
On a show of hands every holder of ordinary shares present at a meeting in person or by proxy, is entitled to one vote, and upon a poll each share is entitled to one vote.
(d) OptionsInformation relating to the St Barbara Employee Option Plan and Executive Options, including details of options issued, exercised and lapsed during the fi nancial year and options outstanding at the end of the fi nancial year, is set out in Note 37.

88
Notes to the Consolidated Financial Statements continuedFor the year ended 30 June 2010
Note 25 Reserves and accumulated losses
(a) Reserves
Consolidated
2010 2009 $’000 $’000
Reserves
Share based payment reserve 2,484 1,841
Investment fair value reserve – 6,687
Gold cash fl ow hedge reserve (19,161) –
Convertible note liability reserve – 432
(16,677) 8,960
Share based payment reserve
Balance at start of year 1,841 2,086
Option expense 1,175 181
Options exercised – (213)
Options cancelled on termination (532) (213)
Balance at end of year 2,484 1,841
Investments fair value reserve
Balance at start of year 6,687 –
Transfer to income statement on disposal (6,687) –
Fair value adjustments – 6,687
Tax effect of fair value adjustment @ 30% – –
Balance at end of year – 6,687
Gold cash fl ow hedge reserve
Balance at start of year – –
Fair value adjustments (19,161) –
Tax effect of fair value adjustment @ 30% – –
Balance at end of year (19,161) –
Convertible note liability reserve
Balance at start of year 432 432
Transfer to income statement (432) –
Balance at end of year – 432
(b) Accumulated lossesMovements in accumulated losses were as follows:
Consolidated
2010 2009 $’000 $’000
Balance at start of year (208,664) (132,320)
Loss attributable to members of the Company (40,188) (76,344)
Balance at end of year (248,852) (208,664)

www.stbarbara.com.au – Annual Report : : 89
Notes to the Consolidated Financial Statements continuedFor the year ended 30 June 2010
Note 25 Reserves and accumulated losses cont.
(c) Investment fair value reserveChanges in the fair value arising on translation of investments, such as equities, classifi ed as available-for-sale fi nancial assets, are taken to the available-for-sale investments revaluation reserve, as described in Note 1(p). Amounts are recognised in the income statement when the associated assets are sold or impaired. During the year the cumulative gain recognised in the reserve in prior years, together with the movements in fair value for the year, was recognised in the income statement.
(d) Share based payments reserveThe share based payments reserve is used to recognise the fair value of options issued to executives and employees but not exercised.
(e) Gold cash fl ow hedge reserveAt each balance sheet date, a mark-to-market valuation of the Company’s gold bought put options and sold call options (the “collar structure”) is performed. Where the hedge is effective, changes in fair value relating to the intrinsic portion of the valuation are recognised in the gold cash fl ow hedge reserve. If the underlying options expire, the reserve relating to the expired options reverses against the derivatives liability.
Note 26 Parent Entity disclosures
As at, and throughout, the fi nancial year ended 30 June 2010, the parent company of the Group was St Barbara Limited.
(a) Financial statements
Company
2010 2009 $’000 $’000
Results of the parent entity
Profi t for the period (40,188) (76,344)
Other comprehensive income (1) (25,848) 6,687
Total comprehensive income for the period (66,036) (69,657)
(1) Other comprehensive income is set out in the Consolidated Statement of Comprehensive Income.
Financial position of the parent entity at year end
Current assets 144,808 149,753
Total assets 479,347 467,591
Current liabilities 63,326 139,136
Total liabilities 141,100 182,340
Total equity of the parent entity comprising of:
Share capital 614,997 496,176
Share based payment reserve 2,484 1,841
Investment fair value reserve – 6,687
Convertible note reserve – 432
Gold cash fl ow hedge reserve (19,161) –
Accumulated losses (260,073) (219,885)
Total equity 338,247 285,251

90
Notes to the Consolidated Financial Statements continuedFor the year ended 30 June 2010
Note 26 Parent Entity disclosures cont.
(b) Parent entity contingenciesRefer Note 28 for details of matters for which the parent entity has contingent liabilities.
(c) Parent entity guaranteesRefer Note 28 for details of bank guarantees issued by the parent.
(d) Parent entity capital commitments for acquisition of property, plant and equipment
Company
2010 2009 $’000 $’000
Contracted but not yet provided for and payable
Within one year – –
Note 27 Remuneration of auditors
During the year the following fees were paid or payable for services provided by the auditor of the parent entity, its related practices and non-related audit fi rms:
Consolidated
2010 2009 $’000 $’000
(a) Assurance servicesAudit services
KPMG Australian fi rm
Audit and review of fi nancial reports 240 220
Total remuneration for audit services 240 220
(b) Non-audit servicesKPMG Australian fi rm
Due diligence on rights issue 95 –
Other services 4 –
Total remuneration for non-audit services 99 –
Note 28 Contingencies
(a) Contingent liabilities and assetsThe Company and consolidated entity have a contingent liability at 30 June 2010 in respect of the following legal claim:
Kingstream
On 2 July 2002, Kingstream Steel Limited (now Midwest Corporation Limited) (“Kingstream”) commenced proceedings in the Supreme Court of Western Australia against the Company and its 100% owned subsidiary, Zygot Ltd (“Zygot”) (together, “St Barbara”). In early 2005, Kingstream obtained the leave of the Court to substitute the trustees of Kingstream Steel’s Creditors Trust as plaintiffs in these proceedings, namely Bryan Kevin Hughes and Vincent Anthony Smith. Mr Smith resigned as a trustee and Mr Hughes (“Hughes”) has been the sole plaintiff since 30 January 2008.
Hughes’s claim against St Barbara arose from the withdrawal by Zygot of three mining lease applications (“MLAs”) in September 2001. Hughes alleged that these applications were part of the subject matter of an Option Deed between St Barbara and Kingstream dated 26 March 1997 as supplemented by a Deed dated 20 January 1998 and a letter dated 29 January 1999 from St Barbara’s lawyers to Kingstream. Kingstream exercised the option in February 1999. Hughes sought damages from St Barbara relying upon causes of action based on rectifi cation of the Supplemental Deed, allegations of breach of contract, breach of duty of care, estoppel and unilateral mistake.
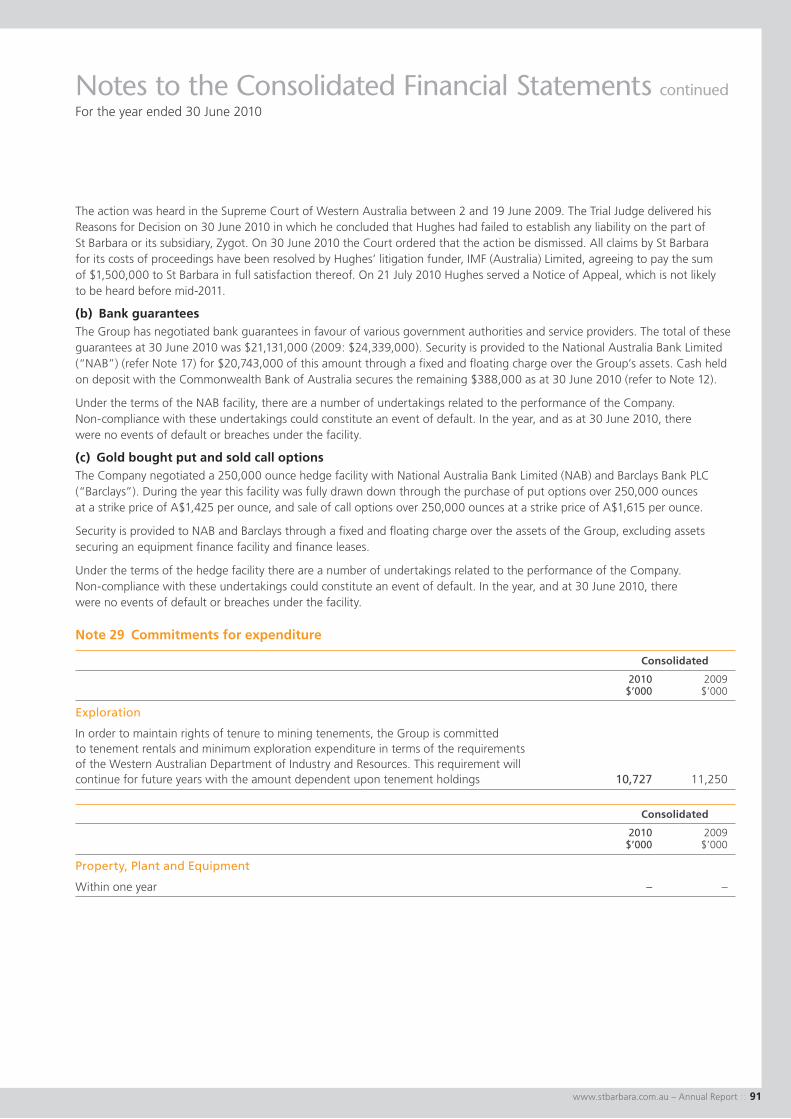
www.stbarbara.com.au – Annual Report : : 91
Notes to the Consolidated Financial Statements continuedFor the year ended 30 June 2010
The action was heard in the Supreme Court of Western Australia between 2 and 19 June 2009. The Trial Judge delivered his Reasons for Decision on 30 June 2010 in which he concluded that Hughes had failed to establish any liability on the part of St Barbara or its subsidiary, Zygot. On 30 June 2010 the Court ordered that the action be dismissed. All claims by St Barbara for its costs of proceedings have been resolved by Hughes’ litigation funder, IMF (Australia) Limited, agreeing to pay the sum of $1,500,000 to St Barbara in full satisfaction thereof. On 21 July 2010 Hughes served a Notice of Appeal, which is not likely to be heard before mid-2011.
(b) Bank guaranteesThe Group has negotiated bank guarantees in favour of various government authorities and service providers. The total of these guarantees at 30 June 2010 was $21,131,000 (2009: $24,339,000). Security is provided to the National Australia Bank Limited (“NAB”) (refer Note 17) for $20,743,000 of this amount through a fi xed and fl oating charge over the Group’s assets. Cash held on deposit with the Commonwealth Bank of Australia secures the remaining $388,000 as at 30 June 2010 (refer to Note 12).
Under the terms of the NAB facility, there are a number of undertakings related to the performance of the Company. Non-compliance with these undertakings could constitute an event of default. In the year, and as at 30 June 2010, there were no events of default or breaches under the facility.
(c) Gold bought put and sold call optionsThe Company negotiated a 250,000 ounce hedge facility with National Australia Bank Limited (NAB) and Barclays Bank PLC (“Barclays”). During the year this facility was fully drawn down through the purchase of put options over 250,000 ounces at a strike price of A$1,425 per ounce, and sale of call options over 250,000 ounces at a strike price of A$1,615 per ounce.
Security is provided to NAB and Barclays through a fi xed and fl oating charge over the assets of the Group, excluding assets securing an equipment fi nance facility and fi nance leases.
Under the terms of the hedge facility there are a number of undertakings related to the performance of the Company. Non-compliance with these undertakings could constitute an event of default. In the year, and at 30 June 2010, there were no events of default or breaches under the facility.
Note 29 Commitments for expenditure
Consolidated
2010 2009 $’000 $’000
Exploration
In order to maintain rights of tenure to mining tenements, the Group is committedto tenement rentals and minimum exploration expenditure in terms of the requirementsof the Western Australian Department of Industry and Resources. This requirement willcontinue for future years with the amount dependent upon tenement holdings 10,727 11,250
Consolidated
2010 2009 $’000 $’000
Property, Plant and Equipment
Within one year – –

92
Notes to the Consolidated Financial Statements continuedFor the year ended 30 June 2010
Note 29 Commitments for expenditure cont.
Consolidated
2010 2009 $’000 $’000
Finance Lease Commitments
Payable not later than one year 903 1,030
Payable later than one year, not later than fi ve years 1,281 1,671
2,184 2,701
Future fi nance charges (220) (307)
Recognised as a liability 1,964 2,394
Lease incentives on non-cancellable operating leases included in lease liabilities 30 90
Total lease liabilities 1,994 2,484
Current (Note 21) 779 937
Non-current (Note 21) 1,215 1,547
1,994 2,484
These fi nance lease commitments relate to plant and equipment, and are based on the cost of the assets and are payable over a period of up to 48 months.
Consolidated
2010 2009 $’000 $’000
Equipment Finance Facility
Payable not later than one year 5,934 5,699
Payable later than one year, not later than fi ve years 8,090 13,520
14,024 19,219
Future fi nance charges (1,103) (1,755)
Total lease liabilities 12,921 17,464
Current (Note 21) 5,197 4,818
Non-current (Note 21) 7,724 12,646
12,921 17,464
Consolidated
2010 2009 $’000 $’000
Analysis of Non-Cancellable Operating Lease Commitments
Payable not later than one year 755 828
Payable later than one year, not later than fi ve years 61 816
816 1,644

www.stbarbara.com.au – Annual Report : : 93
Notes to the Consolidated Financial Statements continuedFor the year ended 30 June 2010
Note 29 Commitments for expenditure cont.
Consolidated
2010 2009 $’000 $’000
Analysis of Non-Cancellable Operating Sub-lease receipts
Receivable not later than one year 292 281
Payable later than one year, not later than fi ve years – 292
292 573
Note 30 Related party transactions
(a) Directors and key management personnelDisclosures relating to Directors and key management personnel are set out in Note 38.
(b) Transactions with entities in the wholly-owned groupSt Barbara Limited is the parent entity in the wholly-owned group comprising the Company and its wholly-owned subsidiaries.
During the year the Company did not transact with any entities in the wholly-owned group (2009: $ Nil). Net receivables from subsidiaries amounted to $2,000 (2009: $2,000). The Company provided accounting and administrative assistance free of charge to all of its wholly-owned subsidiaries.
Loans payable to and advanced from wholly-owned subsidiaries to the Company are interest free, and payable on demand.
(c) Amounts receivable from and payable to entities in the wholly-owned group and controlled entities
Company
2010 2009 $’000 $’000
Aggregate amounts receivable at balance date from:
Entities in the wholly-owned group 852 852
Less provision for doubtful receivables (850) (850)
2 2
Aggregate amounts payable at balance date to:
Entities in the wholly-owned group 11,401 11,401
(d) GuaranteesSubsidiary companies have guaranteed the parent entity’s obligations under the bank guarantee facilities provided by the National Australia Bank Limited and Commonwealth Bank of Australia.
(e) Terms and conditionsOutstanding balances are unsecured, interest free and are repayable in cash on demand.
(f) Amounts receivable from Director related entitiesAt 30 June 2010, there were no amounts receivable from Director related entities (2009: $ Nil).
(g) Other Transactions with Directors of the Company and their Director related entitiesDuring the year ended 30 June 2010, there were no other transactions with Directors of the Company and their Director related entities.

94
Notes to the Consolidated Financial Statements continuedFor the year ended 30 June 2010
Note 31 Controlled entities
The Group consists of the Company and its wholly-owned controlled entities as follows.
Carrying value of Equity holding Company’s investment
June 2010 June 2009 June 2010 June 2009Name of entity Class of Shares % % $’000 $’000
Australian Eagle Oil Co Pty Ltd Ordinary 100 100 178 178
Capvern Pty Ltd Ordinary 100 100 – –
Eagle Group Management Pty Ltd Ordinary 100 100 – –
Murchison Gold Pty Ltd Ordinary 100 100 – –
Kingkara Pty Ltd Ordinary 100 100 – –
Oakjade Pty Ltd Ordinary 100 100 – –
Regalkey Holdings Pty Ltd Ordinary 100 100 – –
Silkwest Holdings Pty Ltd Ordinary 100 100 – –
Sixteenth Ossa Pty Ltd Ordinary 100 100 – –
Vafi tu Pty Ltd Ordinary 100 100 – –
Zygot Pty Ltd Ordinary 100 100 – –
178 178
Each company in the Group was incorporated in Australia.
Note 32 Interests in joint ventures
(a) Jointly controlled assets
June 2010 June 2009 Joint Venture Equity % Equity % Joint Venturers
WESTERN AUSTRALIA
Leonora Region
Mount Newman – Victory 87% 87% Astro Diamond Mines N.L.
Sandy Soak 91% 91% Hunter Resources Pty Ltd
Melita 80% 80% Dalrymple Resources N.L.
Weebo 12.8% 20% Plutonic Operations Limited
McEast/Pipeline (1) 20% 80% Cheperon Gold Partnership
Mt George (2) Nil 51% Trevor John Dixon
Black Cat (1) 40% 100%, Terrain Minerals Ltd diluting to 40%
Silver Phantom 70% 70% Bellriver Pty Ltd
South Rankin 75% 75% Comet Resources Limited
Cheritons Find 90% 90% Audax Resources NL
Kalgoorlie Region
Rocky Dam earning 51% earning 51% Rubicon Resources Ltd
(1) Terrain Minerals Limited earned a 60% interest in the Black Cat joint venture, which also resulted in the Company’s interest in the McEast/Pipeline joint venture reducing to 20%
(2) The Company withdrew from the Mt George joint venture on 17 February 2010
As at 30 June 2010 there was no joint venture assets recorded in the balance sheet (2009: Nil).

www.stbarbara.com.au – Annual Report : : 95
Notes to the Consolidated Financial Statements continuedFor the year ended 30 June 2010
Note 33 Events occurring after the balance sheet date
The Directors are not aware of any matter or circumstance that has arisen since the end of the fi nancial year that, in their opinion, has signifi cantly affected or may signifi cantly affect in future years the Company’s operations, the results of those operations or the state of affairs, except for the following:
• On 4 July 2010 the Company redeemed convertible notes with a face value of $1,200,000. There are no more convertible notes outstanding.
• On 13 August 2010 the Company signed an asset sale agreement for the sale of its Tarmoola process plant, which is on care and maintenance and surplus to the Company’s requirements, for a cash consideration of $3,000,000.
Note 34 Reconciliation of loss after income tax to net cash fl ows from operating activities
Consolidated
2010 2009 $’000 $’000
Loss after tax for the year (40,188) (76,344)
Depreciation and amortisation 56,509 46,294
Asset impairment write offs 37,946 66,042
Profi t on sale of assets (252) (110)
(Gain)/loss on sale of available for sale assets (2,724) 140
Options revaluation – 64
Net realised/unrealised loss/(gain) on gold derivatives 19,513 (1,515)
Discount on convertible notes buyback (312) (1,935)
Impairment of available for sale fi nancial asset – 6,192
Convertible notes buy-back transaction costs 25 791
Exploration expensed 5,184 13,442
Convertible note reserve released to income statement (432) –
Tenement write-off 108 –
Equity settled share-based payments 643 (32)
Change in operating assets and liabilities:
(Increase)/decrease in receivables and prepayments (4,495) 1,091
(Increase)/decrease in inventories 13,003 (10,020)
(Increase)/decrease in other assets – (2,020)
Increase/(decrease) in trade creditors and payables (192) (20,256)
Increase/(decrease) in non-current provisions 1,415 (293)
Increase/(decrease) in other liabilities (3,946) 2,792
Net cash fl ows from operating activities 81,805 24,324
Note 35 Non-cash investing and fi nancing activities
Consolidated
2010 2009 $’000 $’000
Acquisition of vehicles and equipment through fi nance leases 559 21,696

96
Notes to the Consolidated Financial Statements continuedFor the year ended 30 June 2010
Note 36 Earnings per share
Consolidated
2010 2009 Cents Cents
(a) Basic loss per shareLoss attributable to the ordinary equity holders of the Company (2.27) (5.63)
(b) Diluted loss per shareLoss attributable to the ordinary equity holders of the Company (2.27) (5.63)
(c) Reconciliation of earnings used in calculating earnings per share
Consolidated
2010 2009 $’000 $’000
Basic and diluted earnings per share
Loss after tax for the year (40,188) (76,344)
(d) Weighted average number of shares
Consolidated
2010 2009 Number Number
Weighted average number of ordinary shares used as the denominatorin calculating basic earnings per share 1,768,083,968 1,356,057,153
Weighted average number of ordinary shares and potential ordinary sharesused as the denominator in calculating diluted earnings per share 1,768,083,968 1,356,057,153
(e) Information concerning the classifi cation of securities(i) Options
Executive Options and Options granted to employees under the St Barbara Limited Executive Option and Employee Option Plans are considered to be potential ordinary shares and have been included in the determination of diluted earnings per share to the extent to which they are dilutive. The options have not been included in the determination of basic earnings per share. Details relating to the options are set out in Note 37.
(ii) Convertible Notes
The outstanding balance of convertible notes on issue at 30 June 2010 was $1,200,000. The convertible notes have not been included in the determination of diluted earnings per share for the 2010 year on the basis that the outstanding balance was repaid on 4 July 2010.
Note 37 Share-based payments
(a) Employee Option PlanThe establishment of the St Barbara Limited Employee Option Plan was approved by shareholders at the 2001 Annual General Meeting. Options are granted as part of an employee’s total remuneration package. Options are granted for a three to fi ve year period.
Options granted under the plan carry no dividend or voting rights.
When exercisable, each option is convertible into one ordinary share.

www.stbarbara.com.au – Annual Report : : 97
Notes to the Consolidated Financial Statements continuedFor the year ended 30 June 2010
Note 37 Share-based payments cont.
(a) Employee Option Plan cont.
Set out below are summaries of options granted to employees under the St Barbara Limited Employee Option Plan approved by shareholders:
Balance Granted Exercised Expired Balance Exercisable at start of during during during at end of at end of Expiry Exercise the year the year the year the year the year the yearGrant Date Date Price Number Number Number Number Number Number
Consolidated and parent entity – 2010
30 Sep 05 30 Sep 10 $0.279 1,000,000 – – – 1,000,000 1,000,000
01 Jul 06 30 Jun 11 $0.472 1,250,000 – – 750,000 (2) 500,000 500,000
11 Sep 06 11 Sep 11 $0.477 2,000,000 – – – 2,000,000 2,000,000
01 Dec 06 01 Dec 11 $0.530 500,000 – – – 500,000 500,000
06 May 09 (1) 02 Mar 14 $0.381 1,508,099 – – – 1,508,099 –
06 May 09 (1) 03 Apr 14 $0.411 5,361,672 – – 1,740,192 (2) 3,621,480 –
23 Sep 09 (1) 23 Sep 14 $0.287 – 15,287,917 – 840,159 (2) 14,447,758 –
Total 11,619,771 15,287,917 – 3,330,351 23,577,337 4,000,000
Weighted average exercise price $0.44 $0.29 $0.00 $0.40 $0.35 $0.45
(1) Vesting of options granted in May 2009 and September 2009 is subject to performance criteria as discussed below.(2) Expired on termination of employment with the Company.
Balance Granted Exercised Expired Balance Exercisable at start of during during during at end of at end of Expiry Exercise the year the year the year the year the year the yearGrant Date Date Price Number Number Number Number Number Number
Consolidated and parent entity – 2009
23 Dec 04 23 Dec 11 $0.118 5,000,000 – 5,000,000 – – –
30 Sep 05 30 Sep 10 $0.298 1,000,000 – – – 1,000,000 1,000,000
01 Jul 06 30 Jun 11 $0.491 1,750,000 – – 500,000 1,250,000 1,250,000
11 Sep 06 11 Sep 11 $0.496 2,360,000 – – 360,000 2,000,000 2,000,000
01 Dec 06 01 Dec 11 $0.549 500,000 – – – 500,000 250,000
26 Mar 07 26 Mar 12 $0.490 2,000,000 – – 2,000,000 – –
21 May 07 21 May 12 $0.512 1,000,000 – – 1,000,000 – –
06 May 09 02 Mar 14 $0.400 – 1,508,099 – – 1,508,099 –
06 May 09 03 Apr 14 $0.430 – 5,361,672 – – 5,361,672 –
Total 13,610,000 6,869,771 5,000,000 3,860,000 11,619,771 4,500,000
Weighted average exercise price $0.34 $0.42 $0.12 $0.50 $0.44 $0.45
The weighted average remaining contractual life of share options outstanding at the end of the year was 3.6 years (2009: 3.6 years).

98
Notes to the Consolidated Financial Statements continuedFor the year ended 30 June 2010
Note 37 Share-based payments cont.
(a) Employee Option Plan cont.
Following the 4 for 13 accelerated non-renounceable entitlement offer to shareholders completed in December 2009, which raised $124,000,000 (before costs), the exercise price of the unlisted options was adjusted pursuant to the formula contained in ASX Listing Rule 6.22.2. The adjustments were as follows:
Original Adjusted No. of Exercise ExerciseGrant Date options Price Price
30 September 2005 1,000,000 $0.298 $0.279
1 July 2006 1,250,000 $0.491 $0.472
11 September 2006 2,000,000 $0.496 $0.477
1 December 2006 500,000 $0.549 $0.530
6 May 2009 1,508,099 $0.400 $0.381
6 May 2009 5,361,672 $0.430 $0.411
23 September 2009 5,857,320 $0.306 $0.287
Fair value of options granted
The assessed fair value at grant date of options granted during the year ended 30 June 2010 was calculated for each issue of options. The fair value at grant date is independently determined using a Black-Scholes option pricing model that takes into account the exercise price, the term of the option, the impact of dilution, the share price at grant date and expected price volatility of the underlying share, the expected dividend yield and the risk free interest rate for the term of the option.
The model inputs for options granted during the year ended 30 June 2010 included:
(a) Options are granted for no consideration. The vesting of options granted in 2010 is subject to a continuing service condition as at each vesting date, and relative Total Shareholder Returns over a three year period. The peer group against which Total Shareholder Return is measured is presented in the Directors’ Report (page 45). The percentage of options that vest relative to Total Shareholder Returns is set out in the table below.
Relative TSR Performance Over Measurement Period % of Option to Vest
< 50th percentile 0%
50th percentile 50%
> 50th & < 75th percentiles Pro-rata between 50% & 75%
75th percentile and above 100%
Total Shareholder Return is measured against a peer group of companies.
(b) Exercise price is ordinarily the closing market price on the grant date.
(c) Grant date varies with each issue.
(d) Expiry date is 5 years from grant date.
(e) Share price varies at grant date with each issue and ranged from $0.287 to $0.306 per share.
(f) Price volatility of the Company’s shares as at the grant date varied with each issue, and ranged from 81.0% to 86.0%.
(g) Risk-free interest rate at grant date is based on bond rates for a similar term as for the options.

www.stbarbara.com.au – Annual Report : : 99
Notes to the Consolidated Financial Statements continuedFor the year ended 30 June 2010
Note 37 Share-based payments cont.
(b) Expenses arising from share-based payment transactionsTotal expenses/(gains) arising from equity settled share-based payment transactions recognised during the year as part of the employee benefi t expenses were as follows:
Consolidated
2010 2009 $’000 $’000
Options issued/expired under employee option plan 643 (32)
Note 38 Key Management Personnel Disclosures
(a) DirectorsThe following persons were Directors of St Barbara Limited during the fi nancial year:
• S J C Wise Chairman• T J Lehany Managing Director & CEO• D W Bailey Non-executive director• B J Gibson Non-executive director• P C Lockyer Non-executive director• R K Rae Non-executive director
(b) Key management personnel disclosuresThe following persons also had authority and responsibility for planning, directing and controlling the activities of the Group, directly or indirectly, during the fi nancial year:
• Timothy J Lehany Managing Director & CEO• David Rose Chief Operating Offi cer Appointed 7 September 2009• Martin Reed Chief Operating Offi cer Resigned 11 September 2009• Garth Campbell-Cowan Chief Financial Offi cer• Ross Kennedy Executive General Manager Corporate Services/
Company Secretary• Phil Uttley Executive General Manager Appointed 28 September 2009
Discovery & Growth• Adrian McArthur Acting General Manager Exploration Ceased acting in position
30 September 2009
(c) Key Management Personnel Compensation
Consolidated
2010 2009
Short term employee benefi ts 3,652,844 3,137,407
Post employment benefi ts 75,693 80,019
Long Service Leave 71,369 240,950
Share-based payments 975,420 93,158
Termination payments 133,639 2,706,901
4,908,965 6,258,435
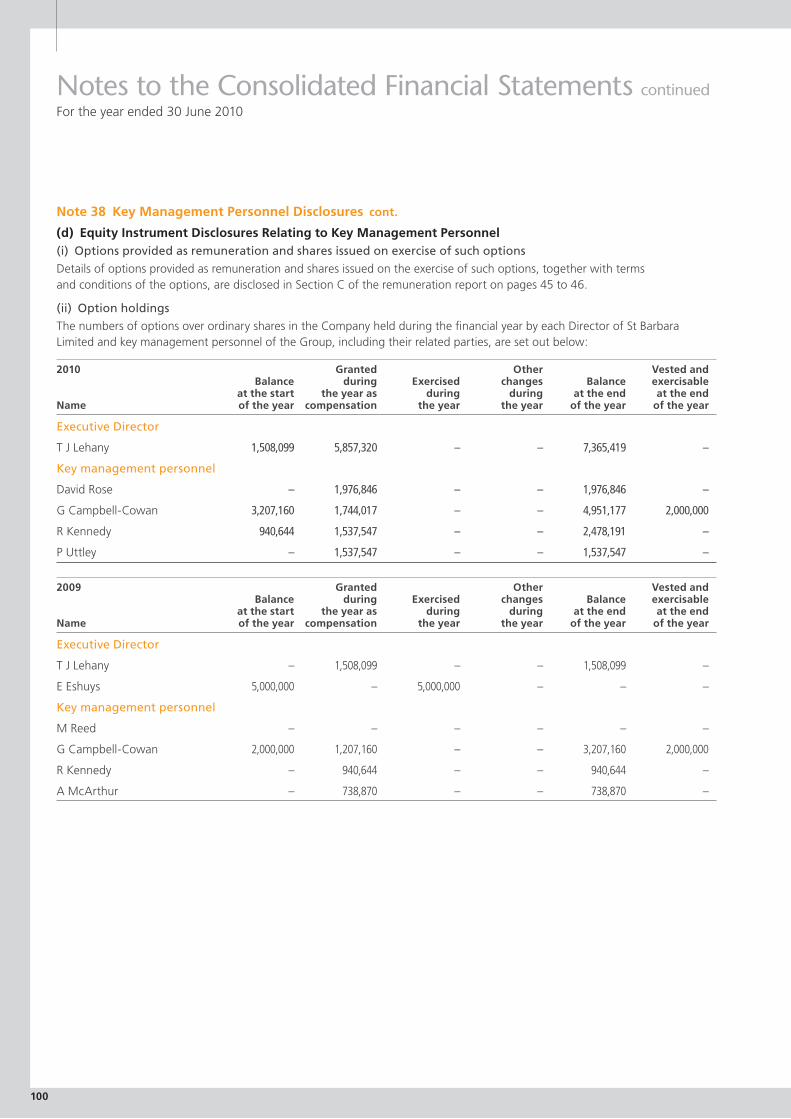
100
Notes to the Consolidated Financial Statements continuedFor the year ended 30 June 2010
Note 38 Key Management Personnel Disclosures cont.
(d) Equity Instrument Disclosures Relating to Key Management Personnel(i) Options provided as remuneration and shares issued on exercise of such options
Details of options provided as remuneration and shares issued on the exercise of such options, together with terms and conditions of the options, are disclosed in Section C of the remuneration report on pages 45 to 46.
(ii) Option holdings
The numbers of options over ordinary shares in the Company held during the fi nancial year by each Director of St Barbara Limited and key management personnel of the Group, including their related parties, are set out below:
2010 Granted Other Vested and Balance during Exercised changes Balance exercisable at the start the year as during during at the end at the endName of the year compensation the year the year of the year of the year
Executive Director
T J Lehany 1,508,099 5,857,320 – – 7,365,419 –
Key management personnel
David Rose – 1,976,846 – – 1,976,846 –
G Campbell-Cowan 3,207,160 1,744,017 – – 4,951,177 2,000,000
R Kennedy 940,644 1,537,547 – – 2,478,191 –
P Uttley – 1,537,547 – – 1,537,547 –
2009 Granted Other Vested and Balance during Exercised changes Balance exercisable at the start the year as during during at the end at the endName of the year compensation the year the year of the year of the year
Executive Director
T J Lehany – 1,508,099 – – 1,508,099 –
E Eshuys 5,000,000 – 5,000,000 – – –
Key management personnel
M Reed – – – – – –
G Campbell-Cowan 2,000,000 1,207,160 – – 3,207,160 2,000,000
R Kennedy – 940,644 – – 940,644 –
A McArthur – 738,870 – – 738,870 –

www.stbarbara.com.au – Annual Report : : 101
Notes to the Consolidated Financial Statements continuedFor the year ended 30 June 2010
Note 38 Key Management Personnel Disclosures cont.
(d) Equity Instrument Disclosures Relating to Key Management Personnel cont.
(iii) Share holdings
The numbers of shares in the Company held during the year by each Director of St Barbara Limited and key management personnel of the Group, including their related parties, are set out below. There were no shares granted during the year as compensation.
2010 Balance Balance at the start Exercise Other at the endName of the year of options changes Purchased Sold of the year
Directors
S J C Wise 6,463,724 – – 1,988,836 (1,616,230) 6,836,330
T J Lehany 570,000 – – 436,923 – 1,006,923
D W Bailey (1) 138,777 – – 42,701 – 181,478
B J Gibson 195,984 – – 60,304 – 256,288
P C Lockyer 48,777 – – 15,008 – 63,785
R K Rae 128,572 – – 125,283 – 253,855
Key management personnel
D Rose – – – 140,000 – 140,000
G Campbell-Cowan – – – – – –
R Kennedy 736,587 – – 340,179 (631,000) 445,766
Phil Uttley – – – – – –
(1) Mr Bailey held 850,000 convertible notes issued by the company which were redeemed on 4 June 2010.
2009 Balance Balance at the start Exercise Other at the endName of the year of options changes Purchased Sold of the year
Directors
S J C Wise 5,027,340 – – 1,436,384 – 6,463,724
T J Lehany – – – 570,000 – 570,000
E Eshuys (1) 25,942,403 5,000,000 (20,600,103) 3,925,000 (14,267,300) –
D W Bailey 107,937 – – 30,840 – 138,777
B J Gibson 152,431 – – 43,553 – 195,984
P C Lockyer 37,937 – – 10,840 – 48,777
R K Rae 100,000 – – 28,572 – 128,572
Key management personnel
M Reed – – – – – –
G Campbell-Cowan – – – – – –
R Kennedy 827,937 – – – (91,350) 736,587
A McArthur – – – – – –
G Viska 500,000 – (500,000) – – –
P Thompson 1,000,000 – (1,000,000) – – –
(1) Mr Eshuys resigned on 2 March 2009. Movements in shareholdings (purchases, sales, and exercise of options) have been disclosed up to this date. ‘Other Changes’ represents the balance of Mr Eshuys’s shareholdings at the date of his resignation.

102
Directors’ DeclarationFor the year ended 30 June 2010
In the Directors’ opinion:
(a) the consolidated fi nancial statements and notes set out on pages 50 to 101 are in accordance with the Corporations Act 2001, including:
i) complying with Accounting Standards, the Corporations Regulations 2001 and other mandatory professional reporting requirements; and
ii) giving a true and fair view of the Group’s fi nancial position as at 30 June 2010 and of their performance, as represented by the results of their operations, changes in equity and their cash fl ows, for the fi nancial year ended on that date; and
(b) there are reasonable grounds to believe that the Company will be able to pay its debts as and when they become due and payable; and
(c) the audited remuneration disclosures set out on pages 38 to 47 of the Directors’ report comply with Accounting Standards AASB 124 Related Party Disclosures and the Corporations Regulations 2001.
The Directors have been given the declarations by the chief executive offi cer and chief fi nancial offi cer for the year ended 30 June 2010 required by section 295A of the Corporations Act 2001.
The Directors draw attention to Note 1(a) to the fi nancial statements, which include a statement of compliance with International Financial Reporting Standards.
This declaration is made in accordance with a resolution of the Directors.
Timothy J LehanyManaging Director and CEO
Melbourne24 August 2010

www.stbarbara.com.au – Annual Report : : 103
Independent Audit ReportFor the year ended 30 June 2010
Independent auditor’s report to the members of St Barbara Limited
Report on the fi nancial reportWe have audited the accompanying fi nancial report of the Group comprising St Barbara Limited (the Company) and the entities it controlled at the year’s end from time to time during the fi nancial year, which comprises the consolidated statement of fi nancial position as at 30 June 2010, and consolidated income statement and consolidated statement of comprehensive income, consolidated statement of changes in equity and consolidated statement of cash fl ows for the year ended on that date, a description of signifi cant accounting policies and other explanatory notes 1 to 38 and the directors’ declaration.
Directors’ responsibility for the fi nancial report
The directors of the company are responsible for the preparation and fair presentation of the fi nancial report in accordance with Australian Accounting Standards (including the Australian Accounting Interpretations) and the Corporations Act 2001. This responsibility includes establishing and maintaining internal control relevant to the preparation and fair presentation of the fi nancial report that is free from material misstatement, whether due to fraud or error; selecting and applying appropriate accounting policies; and making accounting estimates that are reasonable in the circumstances. In note 1, the directors also state, in accordance with Australian Accounting Standard AASB 101 Presentation of Financial Statements, that the fi nancial report, comprising the fi nancial statements and notes, complies with International Financial Reporting Standards.
Auditor’s responsibility
Our responsibility is to express an opinion on the fi nancial report based on our audit. We conducted our audit in accordance with Australian Auditing Standards. These Auditing Standards require that we comply with relevant ethical requirements relating to audit engagements and plan and perform the audit to obtain reasonable assurance whether the fi nancial report is free from material misstatement.
An audit involves performing procedures to obtain audit evidence about the amounts and disclosures in the fi nancial report. The procedures selected depend on the auditor’s judgement, including the assessment of the risks of material misstatement of the fi nancial report, whether due to fraud or error. In making those risk assessments, the auditor considers internal control relevant to the entity’s preparation and fair presentation of the fi nancial report in order to design audit procedures that are appropriate in the circumstances, but not for the purpose of expressing an opinion on the effectiveness of the entity’s internal control. An audit also includes evaluating the appropriateness of accounting policies used and the reasonableness of accounting estimates made by the directors, as well as evaluating the overall presentation of the fi nancial report.
We performed the procedures to assess whether in all material respects the fi nancial report presents fairly, in accordance with the Corporations Act 2001 and Australian Accounting Standards (including the Australian Accounting Interpretations), a view which is consistent with our understanding of the Group’s fi nancial position and of its performance.
We believe that the audit evidence we have obtained is suffi cient and appropriate to provide a basis for our audit opinion.
Independence
In conducting our audit, we have complied with the independence requirements of the Corporations Act 2001.

104
Independent Audit Report continuedFor the year ended 30 June 2010
Auditor’s opinion
In our opinion:
(a) the fi nancial report of the Group is in accordance with the Corporations Act 2001, including:
(i) giving a true and fair view of the Group’s fi nancial position as at 30 June 2010 and of its performance for the year ended on that date; and
(ii) complying with Australian Accounting Standards (including the Australian Accounting Interpretations) and the Corporations Regulations 2001.
(b) the fi nancial report also complies with International Financial Reporting Standards as disclosed in note 1.
Report on the remuneration reportWe have audited the Remuneration Report included in pages 38 to 47 of the directors’ report for the year ended 30 June 2010. The directors of the company are responsible for the preparation and presentation of the remuneration report in accordance with Section 300A of the Corporations Act 2001. Our responsibility is to express an opinion on the remuneration report, based on our audit conducted in accordance with auditing standards.
Auditor’s opinion
In our opinion, the remuneration report of St Barbara Limited for the year ended 30 June 2010, complies with Section 300A of the Corporations Act 2001.
KPMG
Michael BrayPartner
Melbourne 24 August 2010

www.stbarbara.com.au – Annual Report : : 105
Shareholder Information
Twenty largest registered shareholders
St Barbara Limited Ordinary Fully Paid Shares (Total) as of 09 Sep 2010Top Holders Snapshot – Ungrouped Composition : Ord
Rank Name Units % of Units
1. J P Morgan Nominees Australia Limited 497,152,928 25.45
2. National Nominees Limited 359,983,623 18.43
3. HSBC Custody Nominees (Australia) Limited 288,174,934 14.75
4. Cogent Nominees Pty Limited 123,944,004 6.35
5. ANZ Nominees Limited <Cash Income A/C> 78,548,665 4.02
6. Resource Capital Fund IV LP 78,434,933 4.02
7. Citicorp Nominees Pty Limited 43,424,093 2.22
8. HSBC Custody Nominees (Australia) Limited-GSCO ECA 13,400,372 0.69
9. Queensland Investment Corporation 9,442,468 0.48
10. UBS Wealth Management Australia Nominees Pty Ltd 9,287,581 0.48
11. AMP Life Limited 8,318,792 0.43
12. Citicorp Nominees Pty Limited <Cwlth Bank Off Super A/C> 8,113,002 0.42
13. Berne No 132 Nominees Pty Ltd <376804 A/C> 7,628,204 0.39
14. Share Direct Nominees Pty Ltd <10026 Account> 6,449,053 0.33
15. Cassa Trading Pty Ltd <The Cassa Trading A/C> 6,221,557 0.32
16. Northwest Accounting Pty Ltd <Puutu Kunti Kurrama And Piniku> 5,607,937 0.29
17. ABN AMRO Clearing Sydney Nominees Pty Ltd <Custodian A/C> 4,421,729 0.23
18. Comsec Nominees Pty Limited 4,122,324 0.21
19. Nefco Nominees Pty Ltd 3,921,751 0.20
20. Invia Custodian Pty Limited <C Wise Cons P/L S/F Tap A/C> 3,624,430 0.19
Totals: Top 20 Holders Of Ordinary Fully Paid Shares (Total) 1,560,222,380 79.88
Total Remaining Holders Balance 392,946,027 20.12
Substantial Shareholders
Holder No. of Securities % of Total
M&G Investment Mgt 312,666,542 16.0%
Franklin Templeton Investments 131,301,218 6.7%
Hunter Hall Investment Mgt 112,341,492 5.8%

106
Distribution of Shareholdings
St Barbara Limited Ordinary Fully Paid Shares (Total) as of 31 Aug 2010Range of Units Snapshot Composition : Ord
% of IssuedRange Total holders Units Capital
1 – 1,000 952 427,448 0.02
1,001 – 5,000 2,591 7,955,500 0.41
5,001 – 10,000 2,074 16,775,828 0.86
10,001 – 100,000 4,842 156,211,222 8.00
100,001 – 9,999,999,999 712 1,771,798,409 90.71
Rounding 0.00
Total 11,171 1,953,168,407 100.00
Unmarketable Parcels
Minimum Parcel Size Holders Units
Minimum $500.00 parcel at $ 0.3250 per unit 1,539 1,275 854,567
Shareholder Information continued

www.stbarbara.com.au – Annual Report : : 107
this page has been left blank intentionally

108
Board of Directors
S J C Wise Chairman
T J Lehany Managing Director & CEO
D W Bailey Non-Executive Director
B J Gibson Non-Executive Director
P C Lockyer Non-Executive Director
R K Rae Non-Executive Director
Company Secretary
R J Kennedy
Registered Offi ce
Level 14, 90 Collins StreetMelbourne Victoria 3000
Telephone: +61 3 8660 1900Facsimile: +61 3 8660 1999Email: [email protected]: www.stbarbara.com.au
Share Registry
Computershare LimitedGPO Box 2975Melbourne Victoria 3001
Telephone (within Australia): 1300 653 935Telephone (international): +61 3 9415 4356Facsimile: +61 3 9473 2500
Banker
National Australia Bank500 Bourke StreetMelbourne VIC 3000
Auditor
KPMG 147 Collins StreetMelbourne VIC 3000
Solicitor
FreehillsQV1 Building250 St Georges TerracePerth WA 6000
Stock Exchange Listing
Australian Securities Exchange LimitedShares in St Barbara Limited are quoted on the Australian Securities ExchangeTicker Symbol: SBM
Corporate Directory

This report is printed on Monza Satin produced with 55% recycled fi bre (25% post consumer and 30% pre consumer) and FSC Certifi ed pulp, which ensures that all virgin pulp is derived from well-managed forests, and is manufactured by an ISO 14001 certifi ed mill. Monza Recycled is an FSC Mixed Source Certifi ed Paper.
DESIGN: COLLIER & ASSOCIATES THE STRATEGIC DESIGN COMPANY #14867
St Barbara Limited ABN 36 009 165 066