possibilities for future collaboration: environmental justice, health and place/social theory...
TRANSCRIPT

Possibilities for future collaboration: environmental justice, health and
place/social theory literatures
Tony Blakely, Eva Rehfuess

Structure• What is happening in New Zealand?
• Poverty comparative risk assessment project– example of international comparative study
• Issues that have arisen during workshop– Socio-economic position is more than just NZDep
– Residual confounding by SEP when just using NZDep
• Discussion (Eva)

Index of small area socio-economic deprivation
• Mapping need for health care
• Widely used for planning & funding health services
• Used in research as proxy for SES
Salmond, Crampton and Sutton
NZDep

New Zealand Census-Mortality Study: NZCMSwww.wnmeds.ac.nz/nzcms-info.html
Record linkage study of census and mortality data creating four cohort studies of the entire New Zealand population
• Study of socio-economic and ethnic differences in mortality
• Ideally suited to comparisons over time (& traverses period of major and radical macro-economic change)
• Ideally suited to multi-level analyses of contextual variables:– income inequality and social capital
– small area socio-economic deprivation
– physical environment exposures, such as air pollution and community resource access

Comparing census and mortality data ethnicity, 1991-94
Census Death registration ethnicity Census toethnicity Maori Pacific non-M
non-PTotal mortality
ratio
SoleMaori 3,117 6 1,449 4,569 1.32Pacific People 9 621 471 1,101 1.68non-M non-P 351 30 35,262 35,640 0.96
Total 3,471 657 37,182 41,310

50
55
60
65
70
75
80
1950 1955 1960 1965 1970 1975 1980 1985 1990 1995 2000
Lif
e ex
pec
tan
cy i
n y
ears
Non-Maori Male Non-Maori Female
Old official SNZ Mäori series Male Old official SNZ Mäori series Female

50
55
60
65
70
75
80
1950 1955 1960 1965 1970 1975 1980 1985 1990 1995 2000
Lif
e ex
pec
tan
cy i
n y
ears
Non-Maori Male Non-Maori Female
Old official SNZ Mäori series Male Old official SNZ Mäori series Female
Corrected average Mäori ethnic group Male Corrected average Mäori ethnic group Female

Cancer mortality rates: prioritised
Lung cancer, males
0
20
40
60
80
100
1980-84 1985-89 1990-95 1996-99
Prostate cancer
0
5
10
15
20
25
1980-84 1985-89 1990-95 1996-99
Colorectal cancer, males
0
5
10
15
20
25
1980-84 1985-89 1990-95 1996-99
Lung cancer, females
0
15
30
45
60
75
1980-84 1985-89 1990-95 1996-99
Breast cancer
0
10
20
30
40
50
1980-84 1985-89 1990-95 1996-99
Colorectal cancer, females
0
4
8
12
16
20
1980-84 1985-89 1990-95 1996-99

Key messages for UBC workshop
• Social inequalities in health (in NZ) are to a large degree played out by ethnicity and socio-economic factors - without the need to incorporate concepts of ‘physical’ or ‘social’ space
• However, it may be that:– residential segregation, income inequality and other
“upstream-upstream” factors drive these ethnic and socio-economic inequalities
– neighbourhood effects (physical and social) may also act over and above these ethnic and socio-economic inequalities

NZ health and place research: I
• Air pollution assoc. mortality in ChCh (Hales et al, ANZJPH, 2000;
24: 89-91) and chimney density assoc. with area deprivation• Exposure to high risk water supply 3.8 times more likely if
living in deprived neighbourhood (Hales et al, JECH, 2003; 57:581-3)
• Health and Air Pollution in New Zealand (in progress) (Canterbury: Simon Kingham, Andy Sturman, Jamie Pearce, Rachel Spronken-Smith and Jeff Wilson; WSMHS: Hales, Woodward, Blakely)
– previously estimated that 399 people 30 yrs + die each year from PM10 from vehicle emissions, 970 from air pollution from all sources
– GIS, modeling, public health, not really env justice (yet)
– includes use of NZCMS for multi-level analyses of area air pollution and mortality
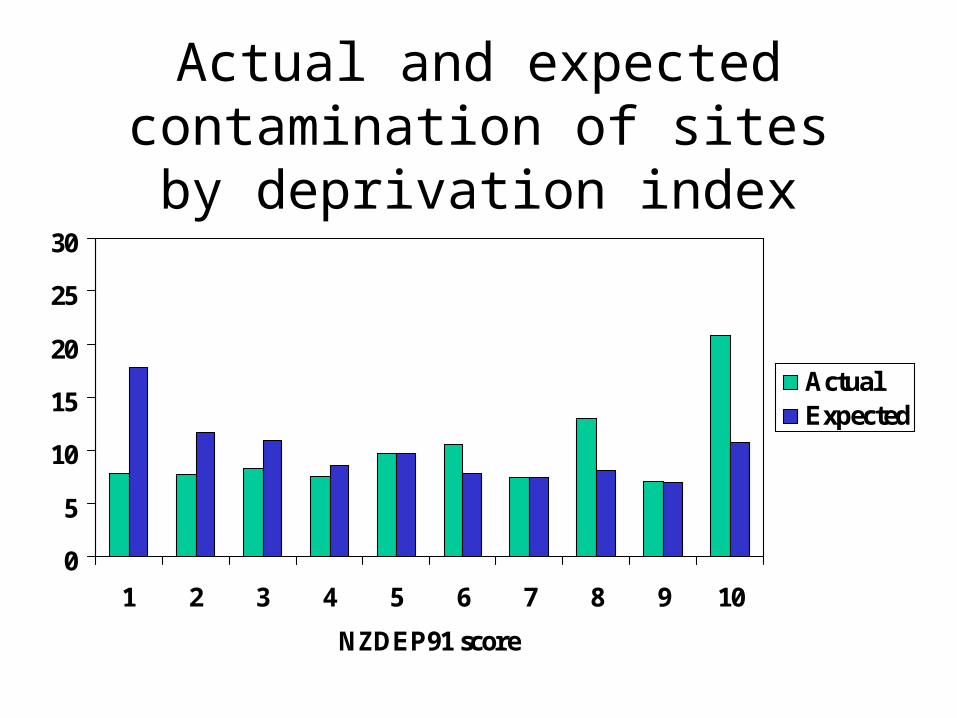
Actual and expected contamination of sites by deprivation index
0
5
10
15
20
25
30
1 2 3 4 5 6 7 8 9 10
NZDEP91 score
ActualExpected

Structure• What is happening in New Zealand?What is happening in New Zealand?
• Poverty comparative risk assessment project– example of international comparative study
• Issues that have arisen during workshopIssues that have arisen during workshop– Socio-economic position is more than just NZDepSocio-economic position is more than just NZDep
– Residual confounding by SEP when just using NZDepResidual confounding by SEP when just using NZDep
– What is the interpretation of an ‘independent’ effect of NZDep in What is the interpretation of an ‘independent’ effect of NZDep in multi-level study multi-level study
• DiscussionDiscussion

Percentage popn by World Bank region living on <$1 per day
0%
10%
20%
30%
40%
50%
60%
70%
80%
90%
100%
East Asia(incl China)
EasternEurope &CentralAsia
LatinAmerica &Caribbean
MiddleEast &NorthAfrica
South Asia Sub-Saharan
Africa
Total
1987
1993
1998

Distribution of world GDP - champagne glass
1.4%
1.9%
2.3%
11.7%
82.7%
1
2
3
4
5
Qu
inti
le o
f w
orl
d p
op
n:
1 =
po
ore
st

Poverty CRA project - an example of an international study
• International WHO co-ordinated project• 20 risk factor teams• We looked at distribution of risk factors by
povertyTobacco
Unsafe water/sanitation
Malnutrition
Etc...
Global Burden of DiseasePoverty

Key messages for UBC workshop
• Economic inequalities between countries often bigger than within countries
• Just as within (predominantly) US studies where health status is often left out of analysis, it is going to be difficult to include health status in international comparative studies

The boundaries and names shown and the designations used on this map do not imply the expression of any opinion whatsoever on the part of the World Health Organization concerning the legal status of any country, territory, city or area or of its authorities, or concerning the delimitation of its frontiers or boundaries. Dotted lines on maps represent approximate border lines for which there may not yet be full agreement. © WHO 2002. All rights reserved
LegendAFRO DAFRO EAMRO AAMRO BAMRO DEMRO BEMRO DEURO A
EURO BEURO CSEARO BSEARO DWPRO AWPRO BNot attributed
14 WHO regions

Results: 0-4 Malnutrition AFRDLowess plot of asset score by prevalence
PrevalencPrevalence of e of
malnutritimalnutritionon
(poor)(poor) Asset score rankAsset score rank (rich)(rich)
$1 $2Av prev = 40%
Av prev = 26%

RR summary: <$1 c.f. >$2
WHO regionUnsafewater/
sanitation
Underweight
Non breast-feeding
(0-5 mth)
Indoorair
pollutionTobacco Alcohol
Obesity(women)
AFRD 9.4 2.3 0.0 1.1 1.1 0.8 0.4
AFRE 4.6 2.6 0.0 2.0 0.7 0.5 0.4
AMRB 12.3 2.4 0.3 7.2 1.1 0.5 0.8
AMRD 8.9 3.7 0.3 14.6 0.6 0.8 0.8
EMRB 3.6 2.1 - - - - -
EMRD 15.1 1.7 0.3 4.0 1.7 - 0.7
EURB 3.1 1.9 0.0 1.2 0.8 0.8 0.8
EURC 11.8 2.4 - 1.3 1.1 0.8 -
SEARB 2.0 3.3 - - - -
SEARD 5.0 2.1 0.1 3.5 - - 0.4
WPRB 1.7 1.1 - 1.4 1.0 0.8 1.1
Total (crude) 3.3 3.1 0.1 2.2 0.9 0.7 0.4
Total (pooled) 7.9 2.5 0.1 3.8 1.1 0.7 0.5

Key messages for UBC workshop
• Broad international comparisons require simple study design
• Tackling the upstream determinants (e.g. income poverty) important to improving health and addressing ‘environmental justice’
• However, wider public health programmes (or healthy public policy) also required

Structure
• Aside: What is happening in New Zealand?Aside: What is happening in New Zealand?
• Inequality - where?Inequality - where?
• Aside: Poverty comparative risk assessment projectAside: Poverty comparative risk assessment project– example of international comparative studyexample of international comparative study
• Issues that have arisen during workshop– Socio-economic position is more than just NZDep
– Residual confounding by SEP when just using NZDep
– What is the interpretation of an ‘independent’ effect of NZDep in multi-level study
• Pre-workshop thoughts on collaborationPre-workshop thoughts on collaboration
• Discussion:Discussion:– What would the the ideal study be?What would the the ideal study be?
– What would the most practical study be?What would the most practical study be?

Not all socio-economically deprived people live in deprived areas, 1991 census data
Variable Census Percentage distribution by NZDep91 quintilecount 1 2 3 4 5
EthnicityMaori 165,300 6% 10% 15% 24% 45%Pacific 62,589 4% 7% 12% 23% 54%Non-Maori non-Pacific 1,411,941 25% 23% 21% 18% 13%
Socio-economic factorsUnemployed 89,823 11% 15% 18% 24% 33%Income < $20,000 326,523 11% 16% 20% 23% 30%Nil Education 557,028 14% 18% 20% 22% 26%NZSEI Occupational class 6 110,643 13% 18% 20% 24% 25%Nil car access 96,375 5% 9% 14% 24% 48%

Personal education varies within NZDep and vice versa: females 25-64 years
TertiaryTech.
SchoolNil
0
20,000
40,000
60,000
80,000
Highest qualification
NZDep 1
NZDep 2
NZDep 3
NZDep 4
NZDep 5

RR of mortality for smokers c.f. never smokers among 1.2 million kiwis, 1996-99
1
1.2
1.4
1.6
1.8
2
2.2
Male Female
RR
Age&Ethadjusted
& NZDepadjusted
& inc/ ed/ car/lab/ tenureadjusted
RR of mortality for smokers c.f. never smokers among 1.2 million kiwis, 1996-99
1
1.2
1.4
1.6
1.8
2
2.2
Male Female
RR
Age&Ethadjusted
& NZDepadjusted
& inc/ ed/ car/lab/ tenureadjusted

RR of mortality for smokers c.f. never smokers among 1.2 million kiwis, 1996-99
1
1.2
1.4
1.6
1.8
2
2.2
Male Female
RR
Age&Ethadjusted
& NZDepadjusted
& inc/ ed/ car/lab/ tenureadjusted
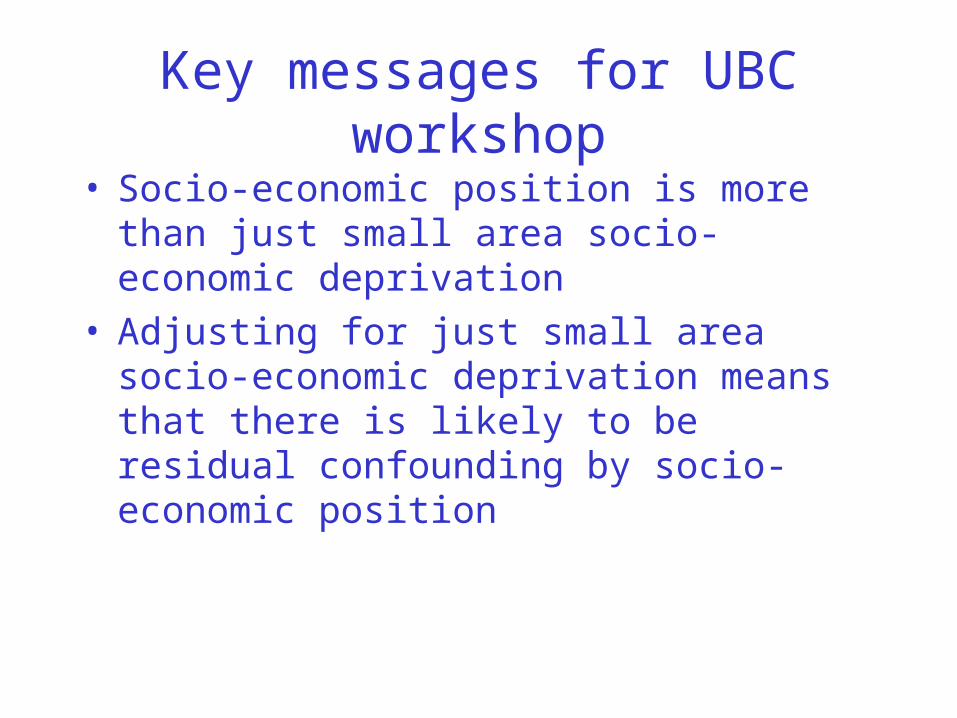
Key messages for UBC workshop
• Socio-economic position is more than just small area socio-economic deprivation
• Adjusting for just small area socio-economic deprivation means that there is likely to be residual confounding by socio-economic position

Outcomes of workshop
Short-term:
• Report?
• Series of papers?
Long-term:
• Improved information exchange?
• International comparative research?
• Opportunistic collaborations - up to individual participants

Methodological challenges to international comparison studies
Intensive versus extensive
• Requires comparable & detailed data
• Richer studies
• Fewer countries/ centres
• Requires comparable data
• Simple studies
• May involve many countries/centres

“Methodological” challenges to international collaboration
• Ideal (scientific or policy relevance criteria?) versus do-able study
• Cultural / contextual variations
• Pooled design/analysis versus comparing results from studies with different design/analysis
• Existing data versus new data
• Developed versus developing countries
• Mono versus multi-disciplinary
• Funding
• Time dimension (migration vs placement, time lags)
• Measure of SES (traditional, power, social exclusion)