possibilities for participatory forest management in … for participatory forest management in khor...
TRANSCRIPT

Possibilities for Participatory Forest Management in Khor Donya Natural Forest Reserve
Prepared By:
Madeena Mohammed Ahmed Elbashir B.Sc Honours, Forestry university of Khartoum
A thesis submitted to the University of Khartoum in fulfillment for the
requirements of the Degree of Master of Science in forest management
Supervisor Dr. Elnour AbedAlla Elsiddig
Department of forest management Faculty of Forestry
University of Khartoum
2007

i
Dedication
To my devoted husband Jamal and my dear sun Mohamed Jamal.
To the soul of my precious parents with mercy
To Haram my kind uncle who nursed me with my two sisters when we were young, and to my other
uncles.
To my beloved sisters Najwa and Doria.

ii
Acknowledgement
Very greatfull to my supervisor Dr Elnour Abdalla Elsiddig
who supported me, provided reference, and experience,
greatfull to him for the time and efforts he had spent with me
in this work patiently and kindly.
I wish to thank all the friends who participated in the
information and data collection, my thanks to Khor donya
forest staff, thanks to my sister Najwa and her husband
Ismail for looking after my son Mohamed, thanks to Handi
and to Abu oubaida and his family for helping. Thanks to the
family of my brother, Bashir. Finally my special thanks to
my husband for the time and support he granted me with
high aspiration.

iii
Table of Consents Subject Page No. Dedication i Acknowledgment ii Table of contents iii List of tables vi List of figures viii Appendices ix Glossary x Abstract in English xi Abstract in Arabic xii
Chapter one: Introduction
1.1 Background 1 1.2 The landuse categories 2 1.3 Water resource 3 1.4 Animal wealth 4 1.5 Population 4 1.6 Forest resources 5 1.7 Research problem 7 1.8 The aim of the study 8 1.9 The Specific objectives 8
Chapter Two: Literature Review
2.1 Degradation 10 2.2 Deforestation 11 2.3 Agriculture as a cause of deforestation and degradation 12 2 .4 Grazing 14 2. 5 Fuelwood as reason of deforestation and degradation 15 2. 6 Participation 16 2.7 Natural forests 17 2. 8 Forest management 18 2.9 Forest sustainability 19
Chapter Three: Study area 3.1 Location 21

iv
3.2 Administrative structure 21 3.3 Topography 22 3.4 Climate 22 3.4.1 Temperature 22 3.4.2 Rainfall 23 3.4.3 Relative humidity 24 3.5 Population 24 3.6 Vegetation 26 3.6.1 Kiter belt 26 3.6.2 Higlig and Talih belt 27 3.6.3 Sahab and Habil belt 27 3.6.4 The riverian forests 27
Chapter Four: Methodology
4.1 Introduction 30 4.2 Selection of the study area and the community groups 30 4.3 Data collection procedure 31 4.3.1 Reconnaissance survey 31 4.3.2 The Questionnaire 31 4.3.2.1 Pre-testing the questionnaire 31 4.3.2.2 Final format of the questionnaire 31 4.3.3 Remote sensing data 31 4.4 Data analysis 32 4.4.1 Statistical data analysis 32 4.4.2 Remote sensing analysis 32
Chapter Five: Results and Discussion
5.1 The target groups 33 5.2 Forest degradation 35 5.3 Impacts of deforestation 37 5.4 management planning 39 5.5 Land users categories 42 5.5.1 Forest uses 42 5.5.2 Forest land and agriculture 45 5.5.3 Conflicts 49 5.6 Forest Extension 56 5.7 Land use 57

v
5.8 Resources management 59
Chapter six: Conclusions and Recommendations
6.1 Conclusions 63 6.2 Recommendations 65 7. References 67

vi
List of tables Table Page No.Table (1.1) Landuse categories 3 Table (1.2) Water resources 3 Table (1.3) Forest products consumption in Blue Nile and Gazira State (in cubic meter m).
6
Table (3.1) Average maximum and minimum Temperature during 2005
23
Table (3.2) Average annual rainfall mm/ annum 2000-2006 24 Table (3.3) Increasing population (1989-2003) for Damazin locality 25 Table (3.4) population characteristics in the study area 25 Table (5.1) Target groups in the study area 33 Table (5.2) Right of accessibility to the forest 34 Table (5.3) Statement of forest land encroachment seen by forest officers
36
Table (5.4) Deforestation area in Khor donya forest reserve during 1983-2005
36
Table (5.5) Perception of forest officers about status of tree biodiversity
37
Table (5.6) Forest officers' opinion with respect to disappearance of wild animals
37
Table (5.7) Impacts of forest clearance on pastoral routes 38 Table (5.8) Awareness of forest officers about application of management plans
39
Table (5.9) Type of management plan 40 Table (5.10) Distribution of forest managers about management plan as success or failure
41
Table (5.11) Forest officers reasoning for system failure 41 Table (5.12) Local people perception about entry to the forest 42 Table (5.13) Energy sources as mentioned by local communities 43 Table (5.14) The source of the building material as mentioned by the 43 Table (5.15) The source for tree fruits collection 44 Table (5.16) Grazing sources 44 Table (5.17) Land use categories 45 Table (5.18) Practicing of Agriculture 47 Table (5.19) The site for cultivation 47 Table (5.20) The basis of cultivation. 48 Table (5.21) The basis of the contract 48

vii
Table (5.22) Respondents distribution with regards to existence of conflict in Damazin and Singa area.
49
Table (5.23) Respondents distribution with respect to categories between whom there is conflict
51
Table (5.24) Perception of local communities about difficult conflicts in Damazin area
52
Table (5.25) Nature of serious conflicts related to the location in the 53 Table (5.26) Who control the conflict within and between community members
54
Table (5.27) Existence of forest extension 56 Table (5.28) Perception of the local people about existence of management system
56
Table (5.29) Participation of local people and communities in forest activities
57
Table (5.30) Perception of local communities about the land use type 58 Table (5.31) Land use related to the nature of respondents work 59 Table (5.32) People perceptions towards their relation to resources management
59
Table (5.33) Tree biodiversity as perceived by local people 61 Table (5.34) The preferred trees 62

viii
List of figures
29 Geographical position of the study area Fig 3.1
46 Land use categories 1978 Fig 5.1
46 Land use categories 1999 Fig5.2
55 Blue Nile State Khor donya natural forest reserve Fig 5.3

ix
Appendices
73 Study area App 3.1 74 Grazing in khor donya forest App 5.1 75 Khor donya forest as source of fuel wood App 5.2 76 Forest and Agriculture App5.3

x
Glossary
FAO Food and Agriculture Organization
FNC Forest National Corporation
FRA Forest Resources Assessment
ITTO International Tropical Timber Organization
UNCED United Nation Conference on Environment and Development
WB World Bank

xi
Abstract
The forest management system adopted in Sudan, especially for natural
forest is ineffective and unsustainable. Many natural forest areas were
converted to land use other than forest. Shifting cultivation either
mechanized or traditional are the main landuses that cause deforestation and
land and forest degradation.The main issue considered by the present study
is that, the management planning system in Khor donya natural forest
reserve does not consider the involvement of various stakeholders. The study
discussed the extent of the degradation that has taken place in Blue Nile
natural forest, taking Khor donya natural forest reserve as an example. Three
target groups farmers, nomads and wood merchants, in addition to forest
officers who are associated to with forest are interviewed and their
perception towards participatory management assessed.
The research discussed the extent and causes of conflicts within and between
target groups. Conflicts are more pronounced between farmers and nomads.
The study concludes that the implementation and the application of annual
forestry programs by forest officers were not based on proper management
prescription. Serious conflicts were existed between forest land users and
forest officers about the rights to gain an access forest reserve. The attitude
of the land users towards the forestry administration was negative in the
views of its preventive measures that are applied in isolation from people
participation. The present study recommended that forest management
should be integrated with other type land use so as to maintain ecological
balance and sustainable productivity. Benefits arising from the forests
should therefore be equitably shared with local people. Consideration of
local people and their indigenous knowledge in forest management process
increase the chances for sustainable management of the forests.

xii
الخالصة الغابات الطبيعية
معظـم . المتبعة في السودان تعتبر غير فعالة وغير مـستدامة للغابات الطبيعية نظم اإلدارة الفنية
فالزراعة المتنقلة، اآلليـة . الغابات الطبيعية تم تحويلها إلستخدام األراضي غير إستخدام الغابات
. وتدهور األراضيوالتقليدية هي التي تتسبب في إزالة الغابات
تناولت هذه الدراسة الموضوع الرئيسي المتعلق باإلدارة الفنية حيث توصلت الدراسة إلى أن نظم
مـشاركة المـواطنين تاخذ فـى الحـسبان التخطيط الخاص بإدارة غابة خور دنيا المحجوزة ال
دى التدهور لدراسة م تناولت ا . والمجموعات المستهدفة التي ترتبط بالغابة وتجني منها فوائد عديدة
و إعتمدت الدراسة على نتائج . الذي أصاب غابة خور دنيا المحجوزة والغابات الطبيعية المجاورة
المزارعين، الرعاة، تجـار الحطـب ومـديري (الصور الجوية وإستبيان المجموعات المستهدفة
بـين لتقييم مستوى مشاركة المجتمعات المحليـة ومـدى النزاعـات ) غابات الدمازين السابقين
.وتوصلت الدراسة إلى أن النزاع بين المزارعين والرعاة يعتبر األكبر. المجموعات المستهدفة
بغابة خور دنيا ال يعتمد على خطـط عمـل السنوية العمل برامجتوصلت الدراسة إلى أن تطبيق
فإن النزاعات تنشب بين إدارة الغابات ومـستخدمي لهذا و إستخالص برامج سنوية فنية صحيحة
وبذلك فإن منع المواطنين من إكتساب الحقوق التي يرونها تجعل . الغابات حول حقوق اإلستخدام
.عالقتهم سالبة
لخلق المناخ المالئـم االخرى إستخدامات األراضي اوصت الدراسة بضررورة تكامل الغابات و
. واإلنتاج المستدام البيئللتوازن
. الغابات بين جميع المستفيدين ومستخدمى المورد اوصت الدراسة بعدالة توزيع العائد منكذلك
مشاركة المواطنين واإلستفادة من خبراتهم في إدارة الغابات سيـساعد ت الدراسة ان ركذلك إعتب
.على زيادة الفرص إلدارة الغابات على نظام اإلستدامة

1
Chapter one
Introduction
1.1 Background: Sudan is the largest country in Africa with an area of 2.5 million square
kilometers, (250 million hectare = 600 million feddans). This area lies
between latitudes 3° -23° North and longitudes 21°75 - 38° 5 east, with
large basin sloped down to the North. Sudan is bounded by series of
mountains on three sides which are Red Sea Mountains in North east,
Jabel Marra in the West and Amatong series in the South. Surface level of
it's land extends between 5000 - 15000 meter above see level, have long
sea coast of 700 kilometer along the Red sea. The Nile River with its
tributaries is the most dominant feature in the Sudan, traversing the
country from the South to the North. It is characterized by different eco-
climatic zones ranging from desert in the North to the high rainfall and
sub-humid region in the South. The zones are classified according to
Harrison and Jakson (1958), into four classes: -
The Arid Zone
Lies between the latitude (14°– 22° N) divided into two regions:-
a- desert equivalent to 28.9% of total area of Sudan, with an average
rainfall less than 75 mm/annum and vegetation is almost absent except
along water courses. The percentage of the desert is increasing with time
due to many factors, has reached to 34% of Sudan total area.
B-semi-desert comprises about (19.6%) of the total area of Sudan, with
an average rainfall 75-300 mm/annum (Harrison and Jackson1958). The
vegetation is composed of Acacia short grass shrubs and tree species
including Acacia tortillis, Acacia radiana and Acacia mellifera. The

2
percentage of semi-desert has increased to 20% and is subjected to the
degradation by the ratio of 9.68% (Nimer 2001).
Savanna Zone
This Zone is divided according to Harrison and Jackson (1958)
classification as follows:-
a. Low rainfall wood land savanna lies between latitudes 10°-14°N with
an average rainfall from 300-800 mm/annum. This zone has later been
divided into:
a.1 Low rainfall wood land savanna on sand soil which comprises (8.6%)
of total area of Sudan. The vegetation is subjected to degradation by 10%.
a.2 Low rainfall wood land savanna in central clay plain equivalent to
(12.7%).It is also degraded at a rate of 11.1 % (Nimer 2001).
b. High rainfall wood land savanna lies between the latitudes 4°-10°N
with an area of 13.8% of total area of Sudan.
The Flood Region
The Flood region of an area (9.8%) of the total area of Sudan.
The Mountain Region
The Mountain equivalent to 0.24% of total area of Sudan.
1.2 The landuse categories
Seven groups of landuse categories are recognized in Sudan. Table (1.1)
shows these groups.

3
Table (1.1) Landuse categories
category Assessment million
(Fadden) %
Range and pasture 218 36.34
Desert 94 15.65
Forest 57 9.67
Mechanized Agriculture 15 2.52
Conventional shifting cultivation 12 2.45
Irrigated Agriculture 4.5 .08
Undetermined landuse 199.5 33.29
Total 600 100
Source: Sudan comprehensive national strategy (1992).
1.3 Water resource
Water is the most important element for life; water used is drawn mainly from rain (Table 1.2).
Table (1.2) Water resources Water resources Miliar m3
Water from rain 1140
Water from Nile according to the Water protocol 20.55
Under ground water 4.9
Wades and Khors water 2.8
Source: Sudan comprehensive national strategy (1992).

4
1.4 Animal wealth Sudan is rich in animal wealth, the live-stock numbers are estimated as
follows:-
Sheep and goat 41.6 million
Cattle 21.6 million
Camel 2.8 million
Poultry 35.4 million
Fishing potential 150.000 million
Twenty five national parks throughout the country of an area equal to
42, 24 million Faddens of biodiversity of wild animals the reservation
of these parks is very week without management plans. Source: Sudan
comprehensive national strategy (1992).
1.5 Population The total population of Sudan is 24.9 million; about 69% of the people
are classified as rural, 20% as urban and 11% as nomads. The average
family size is 6 persons according to 1993 census. All components of
natural resources as they occur in nature are closely related and
interdependent, but misdirected policies, lack of awareness, weakness of
rules and legislation and unplanned economic activities lead to
deterioration of the natural resources. The most important resources
subjected to deterioration and which all resources depend on, is the forest
resources. Many studies linked resources degradation with population
increase.

5
1.6 Forest resources Sudan forest resources are continuously under exploitation. This situation
put forest resources in declining state. In 1958 the natural forests of
Sudan were estimated to cover 36-40% of Sudan total area (Harrison and
Jackson 1958), then the area declined to 19 % (FAO 1990), later to
11.7%. Again this existing forest cover is facing very high pressure and
continuous deforestation on legal or illegal basis. Elsiddig (2004) stated
that from the mid sixties onwards the depletion of the forest continued at
an increasing rate as a result of land use change and mismanagement. For
every 30 hectares cleared only one hectare is replanted. The forest
reservation process that started in 1923 is only able to gazette 30 million
faddens (4.3% of the total area of Sudan).
In general several types of economic activities are important causes of
deforestation and forest resources depletion. Agricultural practices are
responsible for 40-60% of total deforestation (lanly 1982, Mayers 1994,
Gutbi 1997). In Sudan the main cause of deforestation and degradation is
the cutting of trees for fuel wood, which constitutes 70% of the total
national energy consumption, so the total stock volume of forest has
declined. The estimation of the total stock volume in 1983 was 880
million cubic meters approximately, this declined to 440 million cubic
meters in 1995 (about 50%). The annual allowable cut estimated at 11.0
million cubic meters while Sudan annual consumption from forest
products was estimated at 16.0 million cubic meters (FNC, 1994).
Forest biomass energy remains the cheapest and most readily available
energy source for the bulk of the population; therefore programs to
increase the biomass resources in Sudan and to conserve utilization of
existing resources should be urgently initiated. Table (1.3) shows forest
products consumption in Blue Nile and Gazira state.

6
Table (1.3) Forest products consumption in Blue Nile and Gazira State (in cubic meter m).
Source: Consumption of forest product in Sudan 1994
State Fire wood charcoal dukhan construction maintenance furniture khalawis total % of total
Blue Nile 256947 148015 12943 46824 32831 814 1924 507595 3.31
Gazira 255559 146311 26268 37219 22424 17759 9525 1775065 11.25
total 512506 294326 49211 84043 55255 18573 11449 228266 14.56

7
Because of people displacement resulting from war and climate change,
people settled near forest resources. Increasing settlements lead to tree
cutting in order to meat people’s demand. So large areas were cleared
from forests. This lead to degradation and finally desertification, which
affects people who depend on the forest resources. If the natural resources
become degraded communities suffer from competition over scarce
energy sources and animal fodder which result in conflicts and to the
segmentation of the communities which affect the ability of them to work
in common.
1.7 Research problem Khor donya forest is a natural forest reserve that covers an area of
152,100 faddens (63,882 ha). It is the largest forest reserve in the central
region. The area is equal to 50% and 7.6% of ELRahad and ElGazira
irrigated schemes respectively. The total boundary length of the forest is
95 km, the forest lies just west to Damazin town. The forest is located
between latitudes 11o56-11◦ 40 N and longitude 34 18- 34o 7 E, gazetted
in 1974 under No 1163.
The forest was characterized by high biodiversity in the past. Khor donya
depression crosses the forest from the south to the north, the situation of
the forest adjacent to the railway line and Damazin high way gives the
forest economic importance. Management practice in the past was based
on protection of the stock and the boundary like all other natural forest.
The first cutting schedule of the forest was executed in 1980s with no
rehabilitating programs. The traditional shifting cultivation, grazing and
illicit felling start to prevail in the forest resulting from a crowd of
migrants and displaced people escaping from the war who settled in and
around the forest. In 1997 certain circumstances prevailed resulting from

8
the people pressure on the land. To promote agricultural investment, the
ministry of Agriculture gave long term permits to private agricultural
companies including Jandail (100,000 Fadden) and Eamar (15,000
Fadden) to plant crops and trees. These companies were first interested to
collect revenue from sales of wood in the form of fire wood and charcoal
from standing forest trees in their permitted or licensed area, and then
started to sub-lease their plots to outside farmers.
Serious conflicts arise between companies and farmers and between
farmers themselves. In 2005 local authorities of Blue Nile State gave
permission to the united nation staff for peace security (UN) to establish a
big camp inside the forest area. Due to all these malpractices, the forest
was subjected to sever deterioration and change in forest land use rights.
So Detailed investigation will give more realistic and precise
understanding to the problem and the impact of the community groups to
assess the problem and may suggest solution.
1.8 The aim of the study Referring to the above discussion the aim of this study is to assess the
extent of the degradation that happen to Khor donya natural forest reserve
and to evaluate the attempts to involve local community in forest
management to enhance sustainable forest management to satisfy
community needs and self reliance.
1.9 The Specific objectives - To investigate and identify problems and reasons contributing to the
degradation of Khor donya natural forest reserve.
- To investigate the situation arising from conflicts between different
categories living in and around Khor donya forest.

9
- To assess the perception of social groups towards forest management.
-To determine the possibilities of managing this forest relying on these
social groups (local community).

10
Chapter Two
Literature Review
2.1 Degradation Because of the difficulty of protection, natural forest are continuously
removed or degraded. Felling inside and outside forest reserves continued
illegally by people. As a result, forest cover is declining and the supply of
wood and forest products are diminishing, at the same time the demand is
predicted to increase at 1-2% per year (Ball, 1998).
Sudan is not suffering from the population pressure but actually there is
an imbalance of population distribution. People are concentrated in the
central part of the country because of its permanent water supply,
irrigated agricultural schemes and natural conditions suitable for life. The
region is also attracting more migrants from every where of the country
seeking better life. All have perceived the natural resources as assets that
can be entered without permission or authorization (Hasab elrsoul 1999).
Eisa (1996) stated that, Misdirected governmental policies, lack of public
awareness, weakness of legislation, ill planned economic activities are
important causes of degradation of vegetation. Degradation is defined as
the reduction in overall density of vegetation cover which leads to
changes in production and modification in species composition (Ibid).
Degradation also refers to deterioration of land when used beyond its
capacity.
The land use patterns are closely associated with human activities and
population distribution and these contribute considerably to general land
degradation. Nicholson (2002) stated that the environmental degradation
usually means that carrying capacity is reduced by some natural or human

11
factors. The effects of environmental degradation are not immediately
apparent. Vegetation has been cleared and deforestation has occurred as a
result of settlement and to satisfy food needs. Degradation also occurs
due to increase in livestock and charcoal burning. Experience has shown
that, when these competing needs are attempted to be satisfied with
regards to people and wild life the later tend to be lost (World Bank
1996).
2.2 Deforestation Deforestation is considered as the most serious form of environmental
degradation and perceived to be a contributing cause of the desertification
process that affects the countries of the Sudano / Sahelian zone (Casey
and Muir 1986). Deforestation affected 3.8 million hectares per year for
the world of open wood for the period 1976-1980 of which 2/3 million
are in Africa alone. The rate of deforestation reached nearly 17 million
hectares per year in 1991 (FAO 1995, Gutbi 1997).
The largest area of deforestation in East Africa region occurs in Sudan,
where it is estimated to be one million hectare annually (FRA 2000). The
clearing of trees for construction of roads, petrol pipe, commercial use,
agriculture, settlement, overgrazing in addition to fire cause sever
deforestation and loses of fertile soils.
FAO defines deforestation as reduction in the crown cover to less than
10% and change in land cover from forest to any other uses (FAO 1993).
Deforestation is a process occurring on large scale basis for many
centuries based on cutting down, burring and damaging of forests. The
rate of deforestation in the Sudan has been estimated as being almost 29
times higher than the rate of the reforestation (Mohamed 2005).
Deforestation and land-use conversion from forest to other land uses

12
continues world-wide at different rates. Deforestation is ceased in most
industrial countries because forests are managed for environmental
conservation and eco-tourism (Gadant 1987, Hummel 1991).
2.3 Agriculture as a cause of deforestation and degradation In Blue Nile state agriculture is a major production sector based on
extensive clearance of natural resources. In the past most land (< 75 % of
the total area) was covered with natural vegetation and have closed
natural forests. In specific areas where the land is favorable for permanent
settlement, the land was used for small scale subsistence and traditional
cultivation. With time and due to people increase, the demand for land for
agriculture and establishment of settlement was increased (Investment
map 2004). Clearance of wood lands to provide extra-croplands and
range lands is an important cause of deforestation. Agricultural expansion
has resulted in the clearance of 88000 hectare per year in Sudan and 50%
of the cultivated land became degraded and abandoned after 2-3 years
(Grainger 1990).
Kadouf (1986) reported that land-use pattern in the rain fed agricultural
areas have shown a domestic transformation over the last twenty years,
and that mechanized agricultural cultivation has been expanded without
adequate regards for either the interest of prior users or the long–term
viability of the new land-use pattern. Hauck (1974) reported that 8% of
the world population depends upon shifting cultivation and that, it is the
predominant agricultural practice over an area equivalent to
approximately 30% (360 million hectare) of the world total area of
exploitable soils. Ruthenberg (1971) defined shifting cultivation as those
types of agricultural systems involve an alternation between cropping for
a few years on selected and cleared plots and a long period when the soil
is rested essentially, cultivation shifts frequently within an area that is

13
otherwise covered by natural vegetations. UNHCR (1999) stated that,
because land is not limiting resources, shifting cultivators regard the soil
as a free gift of nature, and not as a capital that has to be maintained.
When soil fertility decreased and begins to show signs of erosion they
abandon it and seek for virgin land, then deforestation continues.
Mechanized agricultural system started in 1940s in Sudan to provide food
for allied forces during the Second World War (Atta elmoula 1985).
Mechanized agriculture started to expand in the central clay plain, and
jumped from half million hectare in 1967 to more than 8 million hectare
in 1989 (HCENR 2000).
Rain fed agriculture affecting physicochemical properties of the soil; also
the top soil is thoroughly disturbed in the process of removing the grass
roots as well as in mounding and ridging. The cropping period is lasting
for three or more years subjected to continuous mono-cropping leading to
loss in soil fertility (Hasab elrasul 1999). Mechanized agriculture in the
demarcated and un-demarcated areas causes environmental degradation,
the problem is serious in un-demarcated areas because there is no control
on their action. Even in the case of the demarcated schemes the leasing
condition that demands environmental protection is ignored and
recommended crop rotation not followed (Pearce and Turner 1990). Nye
and Greenland (1960) reported that, such attitudes are often reinforced by
the common belief that tropical soils deteriorated rapidly, both physically
and chemically under shifting cultivation. Clearing and burning of the
vegetation for agriculture cause considerable damage to the structure of
the soil, because the process of clearing exposes the soil to early rain.
Exposure to rain quickly leads to the formation of surface crust or
capping, Lundgren (1982) defines a collective name for the various land-
use systems in which woody perennials are deliberately grown on the

14
same piece of land with agricultural crops /or animals as an agroforestry
system.
2 .4 Grazing Owing to the nomadic life of the pastoralist people, the number of
animals increases cyclically irrespective of the carrying capacity of the
land. The ministry of Agriculture, Animal Wealth and Natural Resources
has claimed that the number of livestock increased from 60 million units
in 1989 to 100 million in 1995. This is far in excess of the 22 million
units of carrying capacity of the range land stated by the World Bank and
inevitably causes serious destruction of vegetation (Assudan weekly news
paper 1996). A mature stand of Acacia seyal produces 100-800 kg/ha of
standing accessible forage annually (Vink 1987). So it is common to see
Acacia seyal being cut, lopped or trimmed by nomadic herdsmen.
Abde Nour (2000) stated that wildlife habitats have been subjected to
deterioration as a result of expansion of mechanized agriculture together
with overgrazing of domestic livestock, drought and tree clearance
In the Sudan, 85% of the livestock belong to the nomads and semi-
nomads, restricted by the desert in the north and tsetse fly in the south.
They move within the savanna belt to graze their animals on the natural
pastures and browse on trees and shrubs (World Bank 1986). Towards the
end of the dry season, many savanna tree species produce a leaf flush
which provides vital food resources for livestock, and during this period
cattle can spend up to 60% of their time browsing in young leaves
(Scoones 1995). The general figure for browse from trees in tropical
Africa is 20% of the total livestock feed, but it can be as high as 30% in
the drier areas (World Bank 1986).

15
Hamny et al. (2002) conclude that agricultural cropping in rain areas in
Sinnar State has expanded in an extent that did not leave land for grazing.
The herders only use abandoned agricultural scheme for grazing. The
animal will no longer find a grazing land and this may lead to serious
land and resources conflicts between schemes owners and animal’s
herders.
2. 5 Fuelwood as reason of deforestation and degradation The energy consumption in Sudan amount to 73% fuelwood, 7%
biomass, 4% electricity and 16% petrol (FAO 1991). The World Bank
(1986) estimated that 82% of the Sudan's energy consumption was in the
form of fuelwood (i.e. fire wood and charcoal together equivalent to 43
million cubic meter of round wood annually).
A study by the FNC (1994) showed that about 40% of the round wood
consumption in the north is in the form of charcoal. A simple fact known
to every one in the Sudan is that, there is no other fuel easily obtainable
than wood in the rural areas. Electricity and petroleum products are
available only in the urban areas and they are generally too expensive for
domestic energy (Hasab elrasoul 1999).
In Sudan the main cause of forest degradation is tree cutting for wood-
fuel which constitutes more than 70% of the total national energy. The
annual rate of Sudan population growth is 2.6%, the demand for biomass
energy can be assumed to grow at about the present national consumption
rate of 0.71 cubic meter per capita, the present annual total consumption
of wood was estimated at 15.8 million cubic meters. This equivalent to
harvesting three million Feddans of natural forest (one Feddan produces
5.22 cubic meters of solid dry wood) (Hasab elrasoul 1999).

16
2. 6 Participation Many efforts directed towards natural resources management fail because
they pay inadequate attention to the various stakeholders involved and to
their particular interests (Grimble et al. 1995). It has become widely
accepted that participation of local people is a prerequisite for sustainable
forest management and it is recognized that involvement in forest
management must provide real benefits based on local and national needs
(Case 1990).
It is impossible to protect forests against the destruction of outsiders in
such circumstances that the cost of individual protection would far
outweigh any benefits. It therefore makes sense to a group of forest users
to come together to manage the resources in common, thus spreading the
cost of protection across a larger group of people (Mckean 1995). FAO
(1978) defines participation as a process by which rural people are able to
organize themselves and through the organization are able to identify
their needs, share in decision making, implementation and interaction.
Classens (1999) reported that, in South Africa conflicts and power
struggles between traditional authorities and local government are
common mainly because there is little clarity regarding the roles and
functions of these difficult groups and how they related to each other.
Few attempts have been made to reconcile overlapping areas of
jurisdiction. If any thing, the situation is becoming more complicated
with traditional leaders feeling increasingly threatened. In some areas
chiefs are no longer enforcing rules and regulations. As far as local
communities are concerned, the agenda is to regain control over natural
resources and through conservation practices, improve their economic
well-being. As a mean to improve the economic well-being, communities

17
will tend to invest in natural resource management, where they can get
better and quicker return within a short time (Western and Wright 1994).
In recent years and in consideration with the main streaming of
participatory approach, there has been a policy shift to advocate that local
resources users and their institutions play a much more active role in the
protection and management of natural resources (Ainslie 1999). Over the
last 10-15 years community involvement in natural resources and forest
management has received considerable policy development and research
attention in most countries and the move to local control has seen the
emergence of a range of "community based models" and initiatives for
natural resources management ( Muphree 2000).
2.7 Natural forests Natural savanna wood lands covered large area of Sudan and maintained
themselves by natural regeneration in the absence of man and animals
interference (chikamal 1999). The forest reserve estate in Sudan is very
small and constitutes only 4.5% of the total area of the Sudan compares
with the target of 25%. All natural forests (reserved or not reserved) are
degraded. Natural forests are generally ignored in the spade of forest
planning (Hasab elrasoul 1999). Natural forests can be defined as, any
natural plant formation in which trees form an appreciable part of the
vegetation (Bochet 1983).
The productivity of the natural forests is 0.5 cubic meter per hectare per
year in the Sahelian zone, rising to about one cubic meter per hectare per
year in Sudan (FAO 1990). The coverage of the natural forests was
estimated by FAO (1990) as being 19% of the total land area, the recent
global forest resources assessment (FRA 2000) gave country forest cover

18
estimate of 17% and an area for other wood land 10% giving a total of
27% (Mohamed 2005).
An important feature of natural forests is their great biodiversity, it is
estimated that, natural forests contain at least 50% and probably more of
all living species in the world (World Bank 1991).
2. 8 Forest management A forest management plan translates national or regional forest policies
into a thoughtfully prepared and well co-ordinated operational program
for a forest and for regulating forestry activities for a period of time
through the application of prescriptions that specify targets, actions and
control arrangement (ITTO 1992). The term forest management is applied
in situations where an integrated co-ordinate series of actions are taken
direct towards the achievement of specific objectives. In broadest sense
forest management is a process which effectively integrates the
biological, social and economic factors which influence the decisions
leading towards the implementation of one or more specific objectives
(UNCED 1992).
Forest protection from fire, from conversion to other land uses and from
losses caused by shifting cultivation and unlawful logging is a
fundamentally important principle of sustainable forest management
irrespective of the objectives (World Bank 1991). Forest resources and
forest land should be sustainably managed to meet the social, economic
cultural and human needs of present and future generations. These needs
are for forest products and services such as wood and wood products,
water, food, medicine, fuel, shelter, employment, recreation, habitat for
wild life …etc. It is important that forest management be supported by
legal and institutional frame-work (UNCED 1992).
19
In Sudan forest management started early in 1929 but it was only for the
reverain forest plantations. Proper management plan prepared for Sunt
plantation by Booth (1948) was the first to be prepared and applied. For
the natural forests there is no proper management plans except for a very
small number of natural forests reserves. All management activities
executed within the natural forest reserves are contained in the forest
legislation and concerned mainly with protection through patrolling
system. The legislation more oriented towards control and punishment
rather than directed towards development of forest and fulfillment of
people's needs (Elsiddig 1998).
The change in forest land use rights diminishes confidence and interest in
forest management and results in the degradation of forest (Lanly 1982).
2.9 Forest sustainability Forest resources and forest land should be managed to meet human needs
for future generations. Sustainable forest management will ensure that the
values derived from the forest meet present day needs while at the same
time ensuring their continued availability and contribution to long-term
development needs (FAO 1993). (WCED 1987) define sustainability as a
process of change in which the exploitation of resources, the direction of
investigation, the orientation of technological development, and
institutional change are in harmony and enhance both current and future
potential to meet needs. Solow (1992) defined sustainability in a simple
word (sustainability is making sure the next generation is as well-off as
the current generation and ensuring that, this is continuous for all time).
Participatory approach is necessary in the sustainability of forest
management. Hemosilla (1999) mentioned that sustainable forest
management will only be achieved when forest managers secure the

20
participation of rural people, by integrating their activities that sustain
their livelihood.
Recognition of the fundamental importance of the principle of
sustainability is essential in the preparation and subsequent
implementation of prescriptions in a forest management plan, irrespective
of the objectives of management. Sustainable management of tropical
forests may be regarded as one of the most important contributions which
the forestry sector can make to programmes of national development in
tropical developing countries (Catinot 1997).
The new attitude of forestry profession has been geared towards
sustainable forest management which considers that, local people living
in and around forest reserves must be fully involved in forest, their self-
reliance and accumulated experience should be respected and the task of
forest management should harmonize and integrate the views culture
aspirations and traditions of local people and knowledge of foresters
(Murry 1993).
Reserved forests in Sudan are usually good habitat for nomads, farmers
and wood loggers. Consideration of these target groups in forest
management is essential for consideration of their needs. Khor donya is
one of these forests where such groups live or move inside the forest and
may enter into conflicts if their movement is not organized by
participatory management.
21
Chapter Three
Study area
3.1 Location The Blue Nile State is located in the south eastern part of the Sudan
between latitudes 12o 35 and 9◦ 30 N and longitudes 35◦ 8 and 33◦ 8 E.
With an area equal to 8,500,000 fadden (38.500 km square). Twenty
percent of the area is water, 30% forest and rangeland, and 40%
mechanized agriculture (Blue Nile Investment Map 2004). The Blue Nile
State bounded by Ethiopia from the east and south east, Sinnar State from
the north east and Upper Nile from the south west (Figure 3.1 page 29)
3.2 Administrative structure Administratively the Blue Nile State is divided into five localities to
facilitate the security control and meeting local community needs on
health, education and other services. These localities are:-
1. Damazin locality ( Khor Donya natural forest reserve, our case
study lies within this locality) (Appendix. 3.1)
2. Ruseris locality
3. Bao locality
4. Gaesan locality
5. Kurmuk locality
Damazin locality lies between latitudes 11o 40 and 12o 29- N and
longitudes 33o 10 and 34o 22- E, covering an area of 9750 square km
(Department of survey, Damazin office 2003). This locality bounded by
Sinnar State in the North, Blue Nile river in the east, Upper Nile State in
the west Bao locality in the south. Damazin locality is further divided
into three administrative units:
22
a- Damazin unit
b- Elserao unit
c- Bout unit
In addition to this governmental administrative structure there are local
tribal administrators called Nuthar, Omad, and Mashaikhs. These are very
important and have strong power in governing the people.
3.3 Topography The main topographic feature is southern central clay plain called fung
clay plain, which originated from Blue Nile river precipitation of clay, the
percentage of which reaches 60%. The soil is heavy cracking clay with
dark brown colour which makes it difficult to absorb or penetrate water
i.e. of bad drainage surface. This central clay plain slopes gently to the
north by the rate not complete 6 km (Blue Nile Investment Map 2004).
3.4 Climate The study area lies within the savanna zone which is characterized by an
average rainfall ranging from 300-800 mm/annum. There are more
factors affecting the climate the most important two are temperature and
rainfall.
3.4.1 Temperature The maximum average temperature is between (31.2◦ - 40.6◦ C) while the
minimum average temperature is between (16.6◦-24.8◦ C), (see table 3.1).

23
Table (3.1) Average maximum and minimum Temperature during 2005 Months Maximum Minimum
January 35.2 16.6
February 36.9 18.3
March 39.5 21.7
April 40.6 24.2
May 38.5 24.8
June 35.3 22.6
July 32.1 21.4
August 31.2 21
September 32.5 20.9
October 34.9 21.3
November 36.8 19
December 35.6 16.9
mean 35.8 20.7
Source: Damazin Metrological Station
Table (3.1) shows that April is the hottest month (40.6◦ C) followed by
March (39.5◦ C and May (38.5◦ C). And the lowest temperature is shown
in January (16.6◦ C), December, February and November in the winter
season.
3.4.2 Rainfall
Rainfall is the main element of the climate. It is important and necessary
to the life and all living beings. Table (3.2) shows average annual rainfall
ranging from 2000-2006. Table (3.2) shows that the maximum average
rainfall in July (216 mm/annum) while the minimum average rain in
October was (30 mm/annum). The effective rain is continuing for six

24
Month (May-October). During these six years the highest rain was in
(2001-2002), and the lowest rain was in (2002-2003).
Table (3.2) Average annual rainfall mm/ annum 2000-2006 years May June July August Sept. Oct. Total
2000/2001 58.8 91.2 232.4 182 46 32 624.4
2001/2002 97.9 121.6 195.9 232.2 89 37.9 774.5
2002/2003 28.2 59 169.5 207.5 83.9 29.5 577.6
2003/2004 33.6 37.5 250.8 177.3 174.6 22.9 696.7
2004/2005 38.4 93.4 208 137.2 141.6 44 662.6
2005/2006 66.8 105.9 239.7 198 70 14 694.4
Average 54 84.8 216 189.2 100.8 30 674.7
Source: Damazin metrological station (2007).
3.4.3 Relative humidity The average relative humidity in the study area ranges between (20) in
March and (79%) in August.
3.5 Population
According to Sudan 3rd census in 1989 the total population of the Blue
Nile State was 677000 with population density 17.6 persons /Km2 and
3.01% rate of growth (Blue Nile investment map 2004). Most of the
population is concentrated in Damazin locality, the population of this
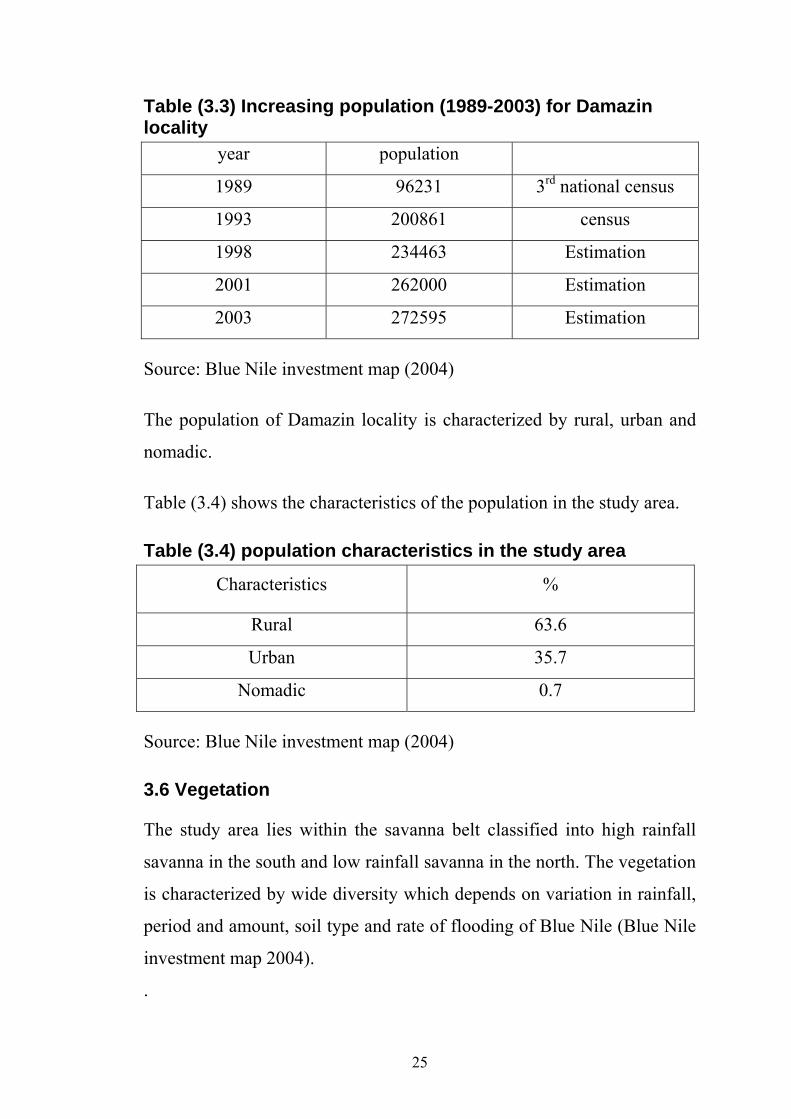
locality in 1989 was 96231, increased to 272595 in 2003. Table (3.3)
shows the increasing population for Damazin locality (1989-2003). The
population of Damazin locality is higher than the population of the other
four localities and equals 40.2% of the total population of the Blue Nile
State.
25
Table (3.3) Increasing population (1989-2003) for Damazin locality
year population
1989 96231 3rd national census
1993 200861 census
1998 234463 Estimation
2001 262000 Estimation
2003 272595 Estimation
Source: Blue Nile investment map (2004)
The population of Damazin locality is characterized by rural, urban and
nomadic.
Table (3.4) shows the characteristics of the population in the study area.
Table (3.4) population characteristics in the study area
Characteristics %
Rural 63.6
Urban 35.7
Nomadic 0.7
Source: Blue Nile investment map (2004)
3.6 Vegetation
The study area lies within the savanna belt classified into high rainfall
savanna in the south and low rainfall savanna in the north. The vegetation
is characterized by wide diversity which depends on variation in rainfall,
period and amount, soil type and rate of flooding of Blue Nile (Blue Nile
investment map 2004).
.

26
On heavy clay soil the following herbaceous species are found:
• Brachiaria spp (Umkoaat) • Rottboellia spp (Umbalila)
• Cymbopogon nervatua (nal)
• Ipomoea spp (taber).
On light clay soil the herbaceous existing there are:
• Dactlyocteniem spp (abu asabia)
• Seltaria spp.
• Pennisetum polystachion (um khmera).
• The herbaceous in the rainfed agriculture are:
• Ennisetum vamsum (elbaashoam)
• Ischaemum afram (ankog)
• Esmodium spp (abu arida).
The tree vegetation of the study area is divided into three categories as
follow:
3.6.1 Kiter belt: The kiter belt distributed in rainfall between 300-570 mm / annum
concentrated in heavy cracking clay plain that lies in the north. The
dominant tree species in this region include Acacia melifera (kiter)
Acacia laeta (laoot).
3.6.2 Higlig and Talih belt: This belt extends in rainfall between 570-800 mm /annum, located south
to the Kiter belt, on heavy clay soil. The dominant tree species are
Acacia seyal (talih), Acacia seyal verity fistula (suffer), Acacia senegal
(hashab), Acacia polycantha (kakamout) and Balanites aegyptiaca
(higlig).

27
3.6.3 Sahab and Habil belt: South of the Higlig-Talih belt where the rainfall is more than 800
mm/annum, the dominant tree spp are Anogessus leiocarpus (sahab),
pterocarpus indica (taraya), combretum hartmannianum), Terminalia
brownii (droot), and other broad-leaved tree species. The species which
are found on slopes or lower parts of hills or mountain are: Sterculia
setigera (tartar), Boswellia papyrifera.
3.6.4 The riverian forests: These are found in flood basins along the Blue Nile. From the
topographic point of view the reverian site is divided into three sites:
1. Maya, in which Acacia nilotica (sunt) is growing in pure stands.
2. Karab, where the flooded part is occupied by sunt tree, and the
high contours occupied by dahara tree species like higlig, loat,
dalaib, koke, Aradaib.
3. Gref where the dominant species includes Acacia nilotica (sunt)
Eucalyptus species (Kafoor), Khaya senegalensis (mohogany),
Conocarpus lancifolis (Damas), Cordia Africana (andrab),
Oxtenanthera abysinica (Gana) are found in plantaion. These tree
species are planted and well managed.
In the past and before 1960s the study area was covered with much
denser tree vegetation, estimated to cover 75% of the total area, but later
the vegetation was subjected to sever destruction particularly the natural
forest resources, due to so many factors like:
• Establishment of Ruseris damp in 1960s that resulted in the
removal of large numbers of trees along the river.
• Large scale mechanized rainfed agriculture introduced in
1975.

28
• Increase in the population, influx of large numbers of
displaced people escaping from the war, and drought, from the
western Sudan.
• Construction of the high way that facilitated transportation of
the wood products. Source: (Blue Nile investment map 2004).
And all these factors lead to extensive logging and clearing of
forest trees, and lead to sever degradation.

29
Sudan Map
Figure 3.1 Geographical location of the study area

30
Chapter Four
Methodology
4.1 Introduction The chapter is includes description of the methods of the research, the
survey, the questionnaire and the type of target groups, the procedure and
methods of data collection and data analysis. The study was conducted to
determine the extent of the degradation that has taken place in Blue Nile
natural forest taking Khor donya natural forest reserve as an example, and
also to assess the role of different target groups in the degradation process
and to identify who is involved in forest management. The primary
information was collected from the field; sources of secondary
information include FNC Blue Nile documents, annual reports of ministry
of agriculture reports and Damazin survey office.
4.2 Selection of the study area and the community groups The selection of the study area was based on the land use system that
resulted in conversion of the forests to other land use which contributes
seriously to deforestation and hence land degradation. The selection of
target groups is based on which group enters the forest and expected to
affect in degradation and to what extend they can be involved to
contribute in forest management. The selection of the community was
done randomly where three target groups were enquired (farmers, nomads
and wood merchants) and the selection of household was also made
randomly where 94 respondents were selected. The fourth target groups
were the forest officials of khor donya (foresters who were involved in
management of Khor donya forest for the period between 1989-2006).
31
4.3 Data collection procedure Three methods of data collection included reconnaissance survey,
questionnaire and remote sensing.
4.3.1 Reconnaissance survey Reconnaissance survey was done to check the boundary of the forest and
to see which activities and practices are carried in the adjacent areas
around the forest, to estimate the size of the damage that happened to the
forest and type of conflict that occurs in relation to the forest use.
4.3.2 The Questionnaire Two types of questionnaires were taken into consideration:
4.3.2.1 Pre-testing the questionnaire
The purpose of the Pre-testing questionnaire is to determine which target
groups can be included, and to help in development of the final
questionnaire to be applicable in answering the research problem. In pre-
testing questionnaire, the construction of the pre-testing questionnaire
depends on social forestry books, leaflets and author’s own experience.
Mass meeting and group discussion were also used.
4.3.2.2 Final format of the questionnaire
Final format of questionnaire was developed according to the result of
the pre-testing questionnaire. The pre-testing questionnaire was checked,
and accordingly some questions were added and others removed.
4.3.3 Remote sensing data Two images were used for detection of changes of forest cover in the
area.

32
4.4 Data analysis Two ways were used for data analysis:
-Statistical data analysis.
Remote sense analysis. -
4.4.1 Statistical data analysis Simple technique of analysis for manipulating the data obtained from the
field was used. The main tools used were the construction of simple
tables and selected cross-tabulation to answer many questions being
asked in the field.
4.4.2 Remote sensing analysis Africover map, using the geographical information system to determine
the recent tree stock area and the area which was converted to agricultural
schemes and rangeland.
Tow images were taken to include Khor donya forest area. The forest
cover was calculated as for 1987 and 1999.

33
Chapter Five
Results and Discussion
5.1 The target groups The target groups were represented by three categories of the land users
namely nomads, farmers and wood merchants. The fourth group
represented by the forest officials who were forest mangers in Damazin
circle.
Table (5.1) Target groups in the study area Category number %
Nomads 32 34
Farmers 47 50
Wood merchants 15 16
Total 94 100
Forest officers 9 100
Table (5.1) shows that three major target groups were interviewed in the
study area, these groups indicate that the interested parties (those with
stake in the forest) are those involved in the land use management and are
connected to the selected forest, (Khor donya natural forest reserve). In
addition, nine forest officers were interviewed. The objective behind
interviewing forest officers group is to see the understanding of this
category to the relationship of the other three groups to the forest.
Forest officer’s relationship to the forest is governed by management
regulations and forest policy, while the relationship of the land users to
the forest is governed by the needs of the categories and inherited
perceptions.
34
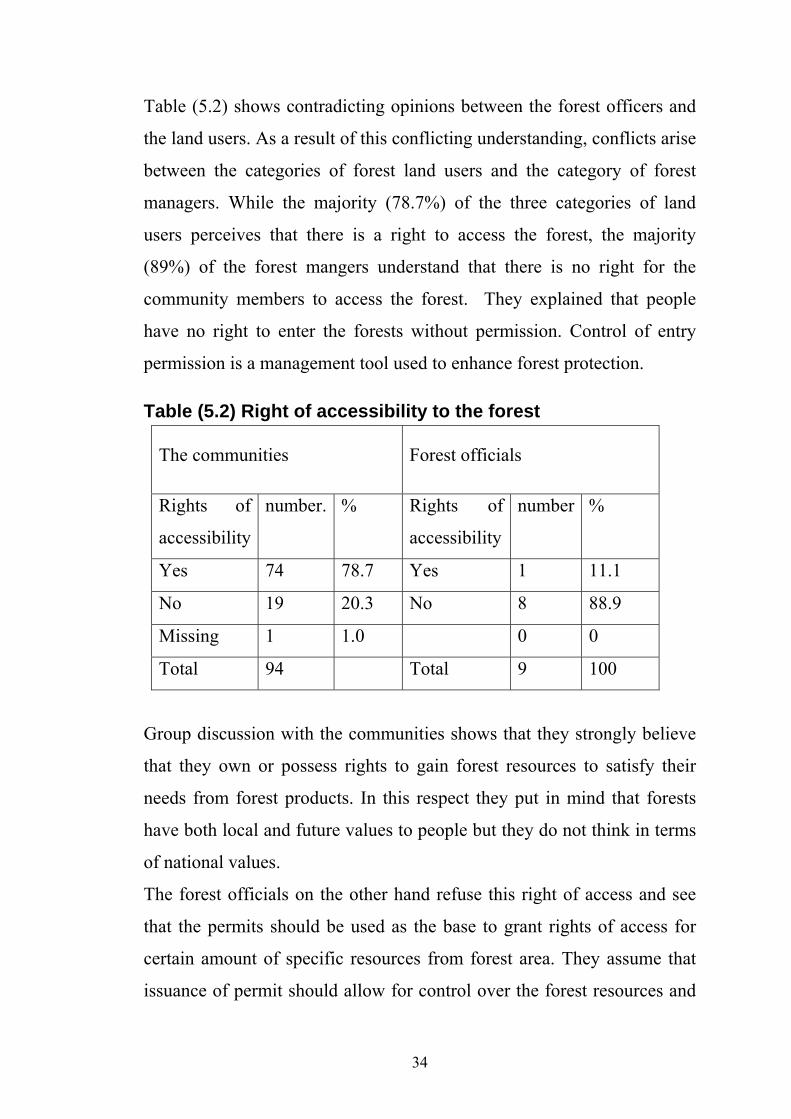
Table (5.2) shows contradicting opinions between the forest officers and
the land users. As a result of this conflicting understanding, conflicts arise
between the categories of forest land users and the category of forest
managers. While the majority (78.7%) of the three categories of land
users perceives that there is a right to access the forest, the majority
(89%) of the forest mangers understand that there is no right for the
community members to access the forest. They explained that people
have no right to enter the forests without permission. Control of entry
permission is a management tool used to enhance forest protection.
Table (5.2) Right of accessibility to the forest
The communities Forest officials
Rights of
accessibility
number. % Rights of
accessibility
number %
Yes 74 78.7 Yes 1 11.1
No 19 20.3 No 8 88.9
Missing 1 1.0 0 0
Total 94 Total 9 100
Group discussion with the communities shows that they strongly believe
that they own or possess rights to gain forest resources to satisfy their
needs from forest products. In this respect they put in mind that forests
have both local and future values to people but they do not think in terms
of national values.
The forest officials on the other hand refuse this right of access and see
that the permits should be used as the base to grant rights of access for
certain amount of specific resources from forest area. They assume that
issuance of permit should allow for control over the forest resources and

35
their use towards sustainable management. Although forest officers
perceive that, access on the basis of permit is a mean to sustainably
manage the forest, the local people think that forest entry based on permit
is used to collect revenue, and not necessarily as a tool to manage the
forest.
Rural people who most dependants on forest resources often have the
least power of access and limited role in management decision. Efforts to
give those people more secure and legal rights of access to forest land
must be made so as to encourage villagers to think of the long-term
sustainable forest use, and to participate in forest management.
5.2 Forest degradation The forest managers have the understanding that access to the forest
without permission is a kind of illegal entry that represents a major factor
of forest destruction through various types of unplanned practices. Local
people enter the forest for wood gathering, non timber products
collection, grazing and agricultural practices.
Table (5.3) shows that (77.7%) of the respondents of forest officials
mention that there is forest land encroachments resulting from
agricultural expansion and other types of land use in the forest. This
means that forest extension is absent and this is may be due to the
absence of forestry extension services in the study area.
It is becoming clear from the forest managers category perception that
there is legal access on the basis of permit and also there is illegal access
practiced by local communities. Both types of access were not based on
planning and they are found to represent main cause of deforestation
inside Khor donya forest.

36
Table (5.3) Statement of forest land encroachment seen by forest officers Agricultural encroachment number %
Yes 7 77.7
No 2 22.3
Total 9 100
Inventories and resources assessment carried out in Khor donya forest
between 1983 to 2005 indicated variable extent of deforestation. Table
(5.4) shows different forms of human activities in the form of agricultural
expansion, human settlements, aromo camps, road construction and
international organizations (UN) camps.
Table (5.4) Deforestation area in Khor donya forest reserve during
1983-2005 Activities Year Area/ Fadden
Aromo camps 1983-1995 5000
Companies agriculture expansion 1997 100000
Village settlement 1990 1000
UN camp 2005 1370
Road and protection embarkment 2000 300
Total 107670
All these activities shown in table (5.4) cause reduction in forest area
whether based on formal or informal way, and considered as land
encroachment that causes deforestation. Forest assessment using land sat

37
image provides land use categories areas in Khor donya forest reserve
(Figure 5.1) and (Figure 5.2) (See Section 5.5.2).
5.3 impacts of deforestation Expanding human activities on forest resources, which lead to forest
clearance, left serious negative impacts on biodiversity and other
resources and lead to forest degradation. Tables (5.5-5.7) represent some
of these impacts. Table (5.5) shows that all forest officers indicate that,
there is a loss of biodiversity in the area.
The dominance of low valued tree species and complete disappearance of
valuable species resulted because of deforestation. Overgrazing and crop
cultivation practices are the clear consequences of land pressure and are
known to cause deterioration of the soil and vegetation.
Table (5.5) Perception of forest officers about status of tree biodiversity Biodiversity lost Number %
Yes 9 100
No -
Total 9
Not only tree species are lost but also wild animals have been lost due to
disturbance of their habitats (Table 5.6).
Table (5.6) Forest officers' opinion with respect to disappearance of wild animals Wild animals exist number %
Yes 2 22.2
No 7 77.7
Total 9 100

38
Table (5.6) shows that (77.7%) of the forest managers mentioned that
there is no existence of wild animals in khor donya forest today. The
wildlife animals disappeared as a result of severs environmental change
caused by human activities, reflected in deforestation and degradation of
Khor donya forest. Agricultural expansion resulted in disappearance of
the demarcated pastoral routes. Table (5.7) reflects that there are no
demarcated pastoral routes for animals to be used for their passages while
they are moving to their seasonal grazing areas.
Table (5.7) Impacts of forest clearance on pastoral routes Existence of route number %
Yes 2 2.2
No 7 77.8
Total 9 100
Each year large numbers of livestock graze and browse in Khor Donya
Natural forest reserve which represents an important part of their seasonal
movement route (Appendix 5.1). Herders pass through the forest on their
way to the north during the rainy season and to the south during the dry
season. Some cattle owners keep their stock around the water holes along
the ways, depending on forage supply in the forest. When pasture is
becoming scarce, herders cause a wide spread of damage as a result of
tree lopping, which have negative effects on the forest, thus affecting
forest development.
The loss of pastoral routes lead to the movement of Pastoralists through
agricultural schemes, then leading to conflicts with the scheme owners.
The forest managers are aware about these problems and about the extent
of degradation that happens to the Khor donya forest. Forest degradation

39
and deforestation is caused by the communities who are highly dependent
on the forest, for products and services.
5.4 management planning
However, it seems that there is lack of planning of the procedure for
practicing access to Khor donya forest. Large companies are permitted to
possess camps and agricultural schemes inside the forest while local
target groups are not allowed to enter for products harvesting (Table 5.4).
Even the legally allowed to enter the forest, they are not provided this
right on planning and sustainable management. Hence legal and illegal
access to Khor donya forest caused deforestation rather than development
(Table 5.3). The result is the increase in deforested area since 1983 which
resulted in deforestation of large areas reaching over 100,000 faddens
(Table 5.4). Unplanned entry also resulted in loss of tree biodiversity
(Table 5.5 and 5.6) and loss of pastoral routes (Table 5.7). These losses
occurred inspite of the effort of the forest managers to prepare and apply
management plans.
Table (5.8) indicates that (66.7%) of the forest officers who managed
Khor donya forest, used management plans.
Table (5.8) Awareness of forest officers about application of management plans Existence of management
plan
Number. %
Yes 6 66.7
No 3 33.3
Total 9 100
However, the present annual programs are not infact based on proper
management plan prescriptions. It is rather a simple decision on
application of agro-forestry system as reflected in table (5.9) which

40
shows that from those who used management plans, (66.7%) of them
apply an integrated method, using agro-forestry approach. In the
agroforestry system that forest managers apply, they supervise the
execution of the ministerial order concerned with the establishment of the
(10%) method in which there was a contract between the forest
authorities and the farmers, which points that, farmers plant (10%) of the
area by trees and (90%) left to agriculture crops. In planting forest trees,
the farmer either uses seeds or seedlings, or conserves and protects (10%)
of the land left as fallow for natural regeneration. The system implies that
after 10 years all the area permitted for agricultural practices inside Khor
donya should be covered by trees.
However, 33.3 % of the forest officers who use management plan apply
contracts based on payment rather than tree planting (Table 5.9)
Table (5.9) Type of management plan
Type of plan number %
Integrated Methods 4 66.7
Payment method 2 33.3
Total 6 100
Failure of the integrated agroforestry system occurs because there was no
control over the system and farmers do not fulfill the contract. As a result
the land deforested was not reforested hence forest degradation.
Table (5.10) indicates that (75%) of the forest officers who apply
integrated agroforestry system, agree that the management system is a
failure.

41
Table (5.10) Distribution of forest managers about management plan as success or failure Statement about agroforestry number. %
Successful 1 25
Failure 3 75
Total 4 100
Inspite of the fact that the majority of the forest officers use management
plans in which they are applying integrated agroforestry method system
(Table 5.9), the majority of them stated that the system failed to result in
reforestation and rehabilitation of the managed part of the forest as
perceived by (75%) (Table 5.10).
Some reasons are known to explain why the system failed. This was
indicated by (100%) of the respondents who mention that the integration
failed to rehabilitate the forest, saying that the reason for the failure was
because farmers who signed contract did not care about trees and they
cultivate all the land. On the other hand (66.6%) of the forest managers
indicate that the other reason is the intensive grazing because there are
large numbers of herds that graze and browse on forest trees (Table 5.11).
Table (5.11) Forest officers reasoning for system failure Reason for failure number %
Farmers did not plant trees 3 100
grazing 2 66.6
Lack of finance 2 66.6
Yet ( 66.6% ) of the forest officers say that lack of finance constrains the
foresters efforts and make them unable to provide seeds, seedling and
follow up the forest activities.

42
5.5 Land users categories Table (5.1) shows the three land users categories and table (5.2) shows
that (78.7%) of the categories believe that they have right of access to the
forest reserve. Table (5.12) indicates that (74.5%) of the local people see
that the forest products are obtained illegally without permission, while
(9.5%) of people say that forest products are obtained legally with
permission. When the local people collect forest products without
permission, the community strongly believe that they possess the right of
access to the forest (see table 5.2). The forestry officials on the other
hand, absolutely refuse this, that is because the forest department (forest
officials) wants to use statutory permits as a system for giving legal
access. The communities understood that any attempt to prevent the
people from collection of certain forest products would result in protest
and resistance because communities are heavily dependant on the forest
for their survival. This may explain why (74.5%) of the people enter the
forest for collection of their needs without asking for permission.
Table (5.12) Local people perception about entry to the forest Means of entry Number %
without permission 70 74.5
Have permission 09 9.5
Missing 15 16
Total 94 100
5.5.1 Forest uses Table (5.13) shows that (96.8%) of the respondents (communities living
in/around Khor donya natural forest reserve) depend on fire wood as a
type of energy used for cooking food. Khor donya natural forest reserve
constitutes the source of (96%) of the fire wood collected by the

43
community (Table 5.13). On the other hand, (14.8%) of the local
communities use charcoal and almost (100%) of this group produce the
charcoal in Khor donya forest. Only (2%) of the local people use energy
alternative in the form of agricultural residues and also collected from
Khor donya forest. That means the communities depend mainly on the
forest for the energy where the wood is the dominant domestic fuel for
rural people (App 5.3).
Table (5.13) Energy sources as mentioned by local communities
Khor Donya
source
Others sources Type number %
number % number %
Fire wood 91 96.8 88 96 3 3.2
Charcoal 14 14.8 14 100 - -
Agricultural residues. 2 2.1 2 100 - -
Table (5.14) indicates that (43.6%) of the building poles were extracted
from Khor donya forest. Other sources include the market as said by
(51%). Unmentioned sources include (5.3%). As Khor donya forest
reserve is the nearest source of wood, the material obtained from the
market may have its source from Khor donya.
Table (5.14) The source of the building material as mentioned by the local communities Source number %
Market 48 51.0
Khor donya 41 43.6
Others 5 5.3
Total 94

44
There are other forests products obtained from the forest but are not
mentioned. The forest can generate income and can also be used as
source of food for the people who live there. Table (5.15) shows that
(53.2%) of the respondents collect tree fruits from Khor donya forest and
use fruit for food or sale. Group discussions with people and key
informants confirmed that people use various fruits as food and also
many of the people sell tree fruits at Damazin market.
Table (5.15) The source for tree fruits collection collection number %
Yes from khor donya 50 53.2
Yes from other forest 4 4.2
Not collect fruit 39 41.5
Missing 1 1.1
Total 94 100
Table (5.16) indicates that (72%) of the respondents use the forest land as
grazing source. This reflects the heavy dependence of local community
on Khor donya for their animals grazing. Pastoralists use the forest as
grazing area while they are moving north or south (Table 5.7)
Table (5.16) Grazing sources Source Number %
Forest land 68 72
other 26 28
total 94 100
Group discussions with forest officers indicate that, pastoralists and settled agro-
pastoralists depend on Khor donya forest for grazing, particularly when large areas

45
are intensively used for cultivation in large mechanized schemes. Large area in Khor
donya forest is converted to grazing land and agriculture (figure 5.3).
5.5.2 Forest land and agriculture Land sat images 1987 (Figure 5.1) and 1999 (Figure 5.2) indicate that land use in the
form of agricultural practices covers large area. Table (5.17) (Appendix 5. 4) indicates
that the area covered by forest and open wood lands decreased from (32614.03
hectares) in 1987 to (31730.95 hectares) in 1999. On the other hand the area of the
agricultural land and bare land increased from (26923.08 hectares) in 1987 to
27771.56 hectares) in 1999.
Table (5.17) Land use categories
% of total
1999
% of total
1987
Area /( ha)
1999
Area / ha
1987 Category
16.1 20.8 9589.02 12429.69 Forest
37.2 33.9 22141.93 20184.33 Open woodland
53.3 54.7 31730.95 32614.03 Sub-total
33.3 30.3 19842.78 18075.57 Agriculture land
13.3 14.9 7928.79 8847.51 Bare Land
46.6 45.2 27771.56 26923.08 Sub-total
100 100 59537.11 59537.11 ha Total

46
Figure (5.1) Landuse categories 1987 Figure (5.2) Landuse categories 1999

47
Table (5.18) indicates that (74.6%) of the respondents practice shifting
cultivation either mechanized shifting cultivation or traditional shifting
cultivation. A large part of Khor donya forest is presently under
cultivation, and the major cultivated area is located at the north part of
Khor donya forest, (Figure 5.3).
Table (5.18) Practicing of Agriculture Use of the land for agriculture number %
Yes 70 74.5
No 18 19.4
Missing 6 6.1
Total 94 100
When the local people who use the land for cultivation (74.5%) are
broken in relation to the site where they cultivate, (51.4 %) out of them
cultivate crops inside the forest land and (48.6% ) outside the forest land
(Table 5.19). Figure (5.3) shows that, the major area under cultivation is
located at the northern part of Khor donya forest. Table (5.1) shows that
(50%) of the respondents are farmers, which means that there are some of
the other target groups (24.5%) who practice cultivation not as the main
activity.
Table (5.19) The site for cultivation Site number % % of total respondents
Inside forest land 36 51.4 38.3
Outside forest land 34 48.6 36.2
Total (who use the
land for cultivation)
70 100 74.5
Table (5.20) shows the cultivation legality for land users who presently
practicing agriculture in Khor Donya forest. 55.5 % of such farmers

48
cultivate on the basis of contract, while (44.5%) cultivate inside the forest
without contract (illegally).
Table (5.20) The basis of cultivation. Cultivation legality number %
With contract 20 55.5
Without contract. 16 44.5
Total 36 100
Considering those who cultivate on the basis of contract (20 farmers),
65% of them stated that the contracts oblige them to provide percentage
of crop products against using the land, and only (35%) of them accept to
plant trees as stated by the contract (Table 5.21). Hence the farmers who
accept to plant trees constitute only 10% of all farmers (70 farmers) who
use the land for cultivation and they constitute (7.5%) of the entire target
group (94 person).
Table (5.21) The basis of the contract Contract basis number %
Provide percentage of products 13 65
Plant trees 7 35
Total 20 100
The numbers of farmers who plant trees (7.5% of the all target group)
would plant very small area compared to the area deforested and will not
be compatible with the objectives behind permit provided to access the
forest. The contract system is inefficient as long as only few (7.5) farmers
are connected with tree planting. That means the area cleared for crops
cultivation will increase but the area under forest will decrease.

49
Based on group discussion it is evident that the farmers ask for more plots
in the forest land in spite of the degradation they cause to the forest.
When the soil fertility decreases and the productively declines, the
farmers abandon the old farm and seek for virgin soil.
In addition to that, people who cultivate inside the forest build their huts
and sometimes construct big camps (in case of mechanized agriculture),
and hence result in people settlement inside the forest.
5.5.3 Conflicts Competition over forest resources can arise between government (forest
managers) and forest users as well as, among different communities of
forest users (target groups), and within forest-dependent communities.
Usually conflict arises on products use and management systems. How
the potential benefits of forest resources could be distributed is a key
question towards conflicts resolution. Conflicts exist over large areas
along the Blue Nile and its surrounding areas where different uses are
connected to the resources. A major source of conflict arises between local communities based on natural
resources and land use. Table (5.22) illustrates the conflicts between different target
groups in Damazin and Singa area as cases. The majority of respondents, (76.5%) in
Damazin area and (72.5%) in Singa area, mentioned that there is conflict in the area.
Table (5.22) Respondents distribution with regards to existence of conflict in Damazin and Singa area.
Dmazin Singa Conflicts number % number % Total
Existing 72 76.5 29 72.5 75.4 Not existing 22 23.4 10 25 23.9 Missing 0 0 1 2.5 0.7 Total 94 40 100
Table (5.23) shows the extent of involvement of the different
communities into conflicts between and within themselves. Within
categories conflicts seem to be negligible. Extend of conflicts between

50
categories varies. The nomads perceive that, they have the highest
conflict with farmers as mentioned by nomads, representing (18%) of
total target groups. Farmers on the other hand perceive that their conflicts
with merchants are highest as mentioned by farmers representing (20.2%)
of total target groups. Problems between farmers and nomads come next
as mentioned by farmers representing (15.9 %) of total, although nomads
(18% of total) see farmers as the major group having conflicts with them.
Merchants see that they have limited conflict with farmers (6.3%) or
nomads (2.1%).
The least conflict is between nomads and any of the other categories as
indicated by (19%) of all the respondents while the greatest conflict is
between the wood merchants and the other categories as indicated by
(30.8%) of the respondents. The conflicts between farmers and other
categories come in the middle when compared with the other two
categories (26.47%)
Wood merchants and farmers represent the categories that are the most
involved in conflict within themselves and with other categories. In facts
farmers rank second to the nomads having less extent of conflicts within
themselves compared to merchants but more than the extent of conflicts
in which nomads are involved (Table 5.23).

51
Table (5.23) Respondents distribution with respect to categories between whom there is conflict
Farmers nomads Wood merchants
Category No. %to total
respondents
No. %total
respond
ent
No. %total
respondent
Nomads (23) 17 18 1 1.0 5 5.3
Farmers ( 36) 2 2.1 15 15.9 19 20.2
Wood
merchants
(13)
6 6.3 2 2.1 5 5.3
Total 26.4 19.0 30.8
People were asked about the conflicts that create difficult problems.
Table (5.24) shows that some respondents perceive that, the most difficult
conflict is between farmers and nomads as mentioned by (22.3%) of all
respondents. Some other people (16%) understand that the most difficult
conflict is between people and government while about (15%) of all
respondents see that the most difficult conflict is between people in case
of land tenure. That means (53.2%) of the local people perceive that there
are difficult conflicts where resolution needs some effort. On the other
hand (23.4%) of the people perceive that conflicts are not alarming and
can easily be resolved (Table 5.24). Also (23.4%) see that there are no
conflicts of any kind (Table 5.24).

52
Table (5.24) Perception of local communities about difficult conflicts in Damazin area
Conflicts between No. % of total
conflicts
Farmers & Nomads 21 22.3
People & Government 15 16.0 Difficult conflicts
Between people (land
tenure) 14 14.9
Conflicts not
difficult 22 23.4
No conflicts 22 23.4
total 94 100
While the pastoralists have the understanding that farmers have taken
their route and use the land as part of cultivation areas, the farmers
perceive that pastoralist damage their crops. Pastoralists also feel that
farmers set fire on the dry pasture which also results in destruction of
grazing areas. Serious conflicts then arise between farmers and
pastoralists.
Conflict between people is not serious, may be related to land tenure.
Such conflicts are controlled by the traditional tribal administration or
customary land tenure law with traditional leaders given powers to
administer the allocation of land.
The location of conflicts may be related to conflicting groups. Table
(5.25) shows that serious conflicts between farmers and nomads in Khor
donya forest is located on north and south of the forest as mentioned by
(47% ) and (42.8%) of respondents respectively, may be because in these
two parts land is used for agricultural schemes (Figure 5.3). Also the
animals market is found adjacent to the northern part of the forest because

53
it is nearest to the high way. This may be a reason for concentration of
livestock while nomads are moving in these parts of the forest. Also
because the routes are lost, nomads may be compelled to pass through the
agricultural fields. Very limited conflicts occur between farmers and
nomads in the centre of the forest, as mentioned by (10.2%) of the
respondents (Table 5.25).
Table (5.25) Nature of serious conflicts related to the location in the forest
Between
farmers and
nomads
Between
people and
Government
(Tree felling)
Between
people (land
tenure)
% 0f total
(50 persons) location
number % number % number % number %
North 10 47 1 6.8 10 71.4 21 42
South 9 42.8 7 46.6 4 28.6 20 40
Center 2 10.2 7 46.6 - - 9 18
total 21 15 14 50 100
Conflicts between people and government related to tree felling takes
place in the central and south parts of the forest may be because the
remaining forest resources in Khor donya are concentrated in the middle
and south of the forest (Figure 5.3). Most of the people living around the
forest are displaced people escaping from war and natural disaster (e.g.
drought). They are depending mainly in their livelihood on forest and
forest products. Also the commercial wood traders are concentrated in the
central and southern parts because the forest area in the north part is
almost open or partially under regeneration. Land tenure problems were
concentrated in the north part of the forest because most problems are

54
related to illegal access through the northern boundaries to enter the
forest area for agricultural practice (Table 5.25).
Table (5.26) indicates that (24.5%) of the local people understand that
there is some control of the conflict between and within the local
communities. People perceived that there are different authorities that
contribute in conflicts control. Forest authorities provide the major
contribution as mentioned by (13.8%) of the respondents, followed by the
local authorities as perceived by (7.5%) of the respondents. Limited
control is provided by the ministry of agriculture as mentioned by (3.2%)
of the respondents.
Table (5.26) Who control the conflict within and between community members Who control number % % of total
Forest authorities 13 56.5 13.8
Local authorities 7 30.4 7.5
Ministry of Agriculture 3 13.1 3.2
Total 23 24.5
While the forest authorities may use the laws or negotiations to resolve
conflicts the local authorities use the customary institution of traditional
leaders including sheikhs, oumads and nuthar who are responsible for
maintaining customary law to collaborate with governmental
administration (ministry of agriculture and forest authorities).

55
Khor Donya Natural Forest reserve
Fig :( 5.3)

56
5.6 Forest Extension From the total respondents, only (24.5%) responded to the question about
existence of forest extension. There are very few people who witness that
there is forest extension
Provided to the local communities. Only (18.1%) of the local people
mentioned that there is forest extension (Table 5.27). About (75%) of the
local people did not respond, (Table 5.27).
Table (5.27) Existence of forest extension
Forest extension Number % of those who
responded % of total
Exist 17 73.6 18.1
Not exist 6 26.1 6.4
Total 23 100 24.5
No response 71 75.5
Table (5.28) indicates that only (34%) of the local people understand that there is
management practices in Khor donya forest. On the other hand (59.6%) of the
communities said that there is no management system practiced in Khor donya forest
reserve. Only (6.4%) mention that they don't know.
Table (5.28) Perception of the local people about existence of management system
Communities management system
number %
existing 32 34.0
Not existing 56 59.6
Don’t know 06 6.4
Total 94

57
It is forest extension that is responsible about knowledge transfer. The
respondents who know the existence of forest management partially
know through the contract upon which they contribute in integrated
management system (Table 5.19). The system provides them with
extension material that facilitates their participation in forest activities.
Fifty three percent (53%) of those people, who perceive that there is
management system practiced in Khor donya, agree that there is
participation of the local people in the management activities (Table
5.29). This number represents only (18%) of all respondents.
Table (5.29) Participation of local people and communities in forest activities participation number % %of total
Yes 17 53 18
No 15 47 16
total 32
Rest of people 62 66
Group discussion with these groups indicates that they understand that the
management system is contained in the forest protection by guards
basically to prevent local people from entry except on permit. Permission
is also based on contract with farmers to cultivate (Table 5.19). In this
sense, the management of the forest is not based on prescribed plan. It is
based on guarding by forest guards.
5.7 Land use
The local people are aware that deforestation is an on-going process
resulting from the type of land use practiced in the area. The local
communities understand that there is strong relationship between the
forest degradation and the land-use system. Table (5.30) shows that there
are different types of land use systems practiced in the area.

58
Excluding the monocropping system mentioned by (13.8%) of the
respondents, the land use is dominated by integrated system in which
trees constitute part of the system. Table (5.30) shows that (53.2%) of the
community prefer the integrated farming method in which crop is
integrated with tree (21.3%) or trees and grazing (31.9%). Also (27.7%)
accept forest as land use practice. Table (5.30) indicates that the majority
of people (80.9%), are against agricultural land use with monocultural
practice. The rest of respondents include (13.8%) who accept
monocropping and (5.3%) missing.
Table (5.30) Perception of local communities about the land use type Land use type number %
Monocropping 13 13.8
Forest only 26 27.7
Crop + tress 20 21.3
Crop + tress + grazing 30 31.9
Missing 5 05.3
Total 94 100
Table (5.31) shows the break down of the three categories in relation to
the type of land use preferred. Table (5.31) indicates that members in
each category prefer the type of land use that support their actual needs
and practices. The majority of farmers (81%) support agriculture, of
whom (66.6%) support integrated land use system. The majority of
nomads support land use where fodder is made available. Those nomads
who support forest land use only are (37.1%) while those who support
integrated land use where trees and grazing are components constitute
(37.2%). Still nomads may find possibilities for grazing under land use in
agriculture with trees (14.3%) but the minority (11.4%) support

59
monoculture. However the majority of wood merchants support forest as preferred
land use because they value the trees for wood production.
Table (5.31) Land use related to the nature of respondents work Land use type
Monocropping Forest only Crop + tress Crop, trees and
grazing
Nature of
work
number % number % number % number %
Farmers 6 14.4 8 19 14 33.3 14 33.3
Nomads 4 11.4 13 37.1 5 14.3 13 37.2
Merchants 3 25 5 41.7 1 8.3 3 25
% of total 13 13.8 26 27.7 20 21.3 30 31.9
5.8 Resources management
It is clear that people constitute different attitudes to the way the
resources can be managed because people have different stakes. Table
(5.32) indicates different perceptions of the local people towards their
relationship to resources management. The majority of respondents
(69.1%) have the understanding that management should be based on
participation. On the other hand, (25.5%) see that the government should
be the manager. Very few people (2.1%) accept that the resources should
be managed by the community.
Table (5.32) People perceptions towards their relation to resources management Management Number %
Participation 65 69.1
Government 24 25.5
Community 02 02.2
missing 03 3.2
Total 94 100

60
The perception of the people about resources management might have
been influenced by the conflicts. That very few accept community
management is because people constitute different interest in the
resources and so (94.6%) see the need for control by government. The
majority (69.1%) prefer that community have to participate with the
government and (25.5%) accept governmental control. The communities
mention that the best approach for forest management is participatory
approach and not only community alone or government alone because in
the participatory approach they share resources distribution for the
benefits and interest of all stakeholders
5.9 Tree Biodiversity Previous inventory and present results of people interviews indicate that
Damazin and Singa areas are rich with a diversity of trees. Table (5.33)
indicates that people in Damazin mention that, they know 31 tree species.
Considering the percentage of the community members in relation to each
species, this may indicate the species dominance or extent of use. Acacia
seyal is most dominant as mentioned by (89.4%) of respondents (Table
5.33) but Acacia senegal is much preferred as mentioned by (80%) of the
people, (Table 5.34).
Accordingly table (5.33) provides the list of the species known, listed in
descending order according to the percentage of people knowing the
species. However, it is clear from table (5.34) that the most preferred
species are the most known species except for Azadiracta indica which is
the fifth preferred species but ranked number (10) in the list of known
species (Table 5.33), and Acacia mellifera that ranks number six as
preferred by (12.5%) (Table 5.34) and number (18) as known by (4.25%),
(Table 5.33).
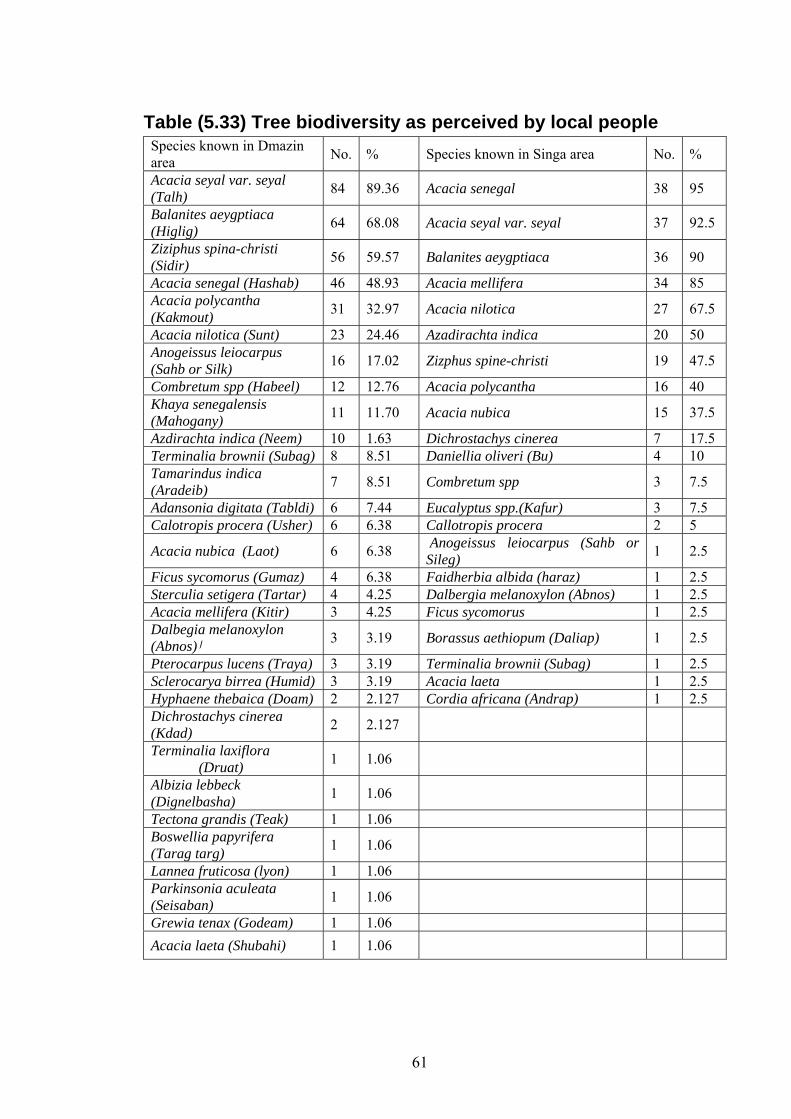
61
Table (5.33) Tree biodiversity as perceived by local people Species known in Dmazin area No. % Species known in Singa area No. %
Acacia seyal var. seyal (Talh) 84 89.36 Acacia senegal 38 95
Balanites aeygptiaca (Higlig) 64 68.08 Acacia seyal var. seyal 37 92.5
Ziziphus spina-christi (Sidir) 56 59.57 Balanites aeygptiaca 36 90
Acacia senegal (Hashab) 46 48.93 Acacia mellifera 34 85 Acacia polycantha (Kakmout) 31 32.97 Acacia nilotica 27 67.5
Acacia nilotica (Sunt) 23 24.46 Azadirachta indica 20 50 Anogeissus leiocarpus (Sahb or Silk) 16 17.02 Zizphus spine-christi 19 47.5
Combretum spp (Habeel) 12 12.76 Acacia polycantha 16 40 Khaya senegalensis (Mahogany) 11 11.70 Acacia nubica 15 37.5
Azdirachta indica (Neem) 10 1.63 Dichrostachys cinerea 7 17.5 Terminalia brownii (Subag) 8 8.51 Daniellia oliveri (Bu) 4 10 Tamarindus indica (Aradeib) 7 8.51 Combretum spp 3 7.5
Adansonia digitata (Tabldi) 6 7.44 Eucalyptus spp.(Kafur) 3 7.5 Calotropis procera (Usher) 6 6.38 Callotropis procera 2 5
Acacia nubica (Laot) 6 6.38 Anogeissus leiocarpus (Sahb or Sileg) 1 2.5
Ficus sycomorus (Gumaz) 4 6.38 Faidherbia albida (haraz) 1 2.5 Sterculia setigera (Tartar) 4 4.25 Dalbergia melanoxylon (Abnos) 1 2.5 Acacia mellifera (Kitir) 3 4.25 Ficus sycomorus 1 2.5 Dalbegia melanoxylon (Abnos)3.19 3 ا Borassus aethiopum (Daliap) 1 2.5
Pterocarpus lucens (Traya) 3 3.19 Terminalia brownii (Subag) 1 2.5 Sclerocarya birrea (Humid) 3 3.19 Acacia laeta 1 2.5 Hyphaene thebaica (Doam) 2 2.127 Cordia africana (Andrap) 1 2.5 Dichrostachys cinerea (Kdad) 2 2.127
Terminalia laxiflora (Druat) 1 1.06
Albizia lebbeck (Dignelbasha) 1 1.06
Tectona grandis (Teak) 1 1.06 Boswellia papyrifera (Tarag targ) 1 1.06
Lannea fruticosa (lyon) 1 1.06 Parkinsonia aculeata (Seisaban) 1 1.06
Grewia tenax (Godeam) 1 1.06 Acacia laeta (Shubahi) 1 1.06

62
Table (5.33) indicates that people prefer trees because of their economic
importance. The most preferred tree species is Acacia senegal because of
the value of gum Arabic produced by the species. Every tree species of
the eight preferred species has an important role in the livelihood of the
local community. Six benefits are mentioned by the local people as being
provided by the preferred species. Gum is the most important tree species
because it generates income to people. Fuel wood provided by four
species, building poles by three species, fodder by two species, fruits by
two species and shade by one species.
Table (5.34) The preferred trees species number % Purpose of use
Acacia senegal 32 80 Gum
Acacia seyal 25 62.5 For Fuel
Balanites aeyptiaca 15 37.5 Fruit and fodder
Acacia nilotica 11 27.5 Fuel and poles
Azadirachta indica 8 20 Shade
Acacia mellifra 5 12.5 Fuel
Ziziphus spina- Christi 3 7.5 Fruit and fodder
Eucalyptus spp 1 2.5 Poles

63
Chapter six
Conclusions and Recommendations
6.1 Conclusions - Large proportion of the respondents use Khor donya forest for grazing,
fruit and poles for construction of local houses and also use for farming.
This situation indicates heavy dependence of local community on Khor
donya forest. Products are either obtained legally or illegally and this may
usually result in symptoms of degradation.
- Forest products can generate income and may provide sources of food
for the people who live there.
- A large percentage of communities living in and around Khor donya
forest reserve practice shifting cultivation, either traditional or
mechanized shifting cultivation.
- The majority of the people cultivate inside Khor donya forest either on
the basis of contract or without contract, even for those who cultivate on
the basis of contract, few of them accept to plant trees as stated by the
contract.
- The majority of the respondents see that the forest management should
be based on participation.
- Large proportion of the interviewed sample has good knowledge about
the local tree species and their benefits.
- The perception of the forest officer about the status of biodiversity
indicates that there is disappearance of valuable tree species, wild animals
and absence of demarcated pastoral routes.
- The assessment of the interviewed samples forest official plus
community on the right of access reveal that there is legal access base on
permit and illegal access, but both types were not based on planning.

64
- Expanding human activities on forest for agriculture, wood, non-wood
products, fodder….etc. lead to forest clearance, cause serious negative
impacts and result in sever environmental change.
- The application of annual programs by forest officers are not based on
proper management prescription.
- The people consider the forest as important sources of food, fodder,
fuel, building materials, income generation and land possession.
- Absence of forest extension resulted in the destruction of the reserve
forest
- Serious conflicts arise between the forest land users and forest officers
about the right to forest resources. The attitude of land users towards the
forestry administration was negative in views of its preventive policies
that are applied in isolation from them.

65
6.2 Recommendations - Forest resources and forest lands should be sustainability managed to
meet the social, economic, ecological, cultural and spiritual needs of
present and future generation.
- Governments should promote and provide opportunities for the
participation of all stakeholders, including local communities and non-
governmental organizations in addition to individuals, forest dwellers and
women for development, implementation and planning of national forest
policies.
- Governments should solve the problems that hinder efforts to attain the
conservation and sustainable use of forest resources by providing options
to local communities, in particular the urban poor and poor rural
populations who are economically and socially dependent on forest
resources.
- The full participation of women in all aspects of the management,
conservation and sustainable development of forests should be actively
promoted.
- Financial resources should be provided for forestry annual programs and
for conservation of forests including protected natural forest areas. These
resources should be directed notably to economic sectors which would
stimulate economic and social substitution activities.
- Forest management system should be integrated with land use systems
so as to maintain ecological balance and sustainable productivity.
- Appropriate indigenous capacity and local knowledge regarding the
conservation and sustainable development of forests should be
recognized, respected, recorded, developed and introduced in the
implementation of forestry programs. Benefits arising from the utilization
of indigenous knowledge should therefore be equitably shared with local
people.

66
- Effective forestry extension services and programs are highly
recommended for all stakeholders including forest officers themselves.

67
7. References Abdel Nour, H. O. 2ooo. Problem of land degradation in Tropical Africa
with particular reference to the Sudan. Ministry of Agriculture and
Forests, Sudan.
Ainslie, A. 1999. Managing common property natural resources in rural
development. South Africa 16: 375-40.
Ali, M. M. 1996. Assessment and mapping of desertification in Western
Sudan using remote sensing techniques and GIS. M.Sc. thesis
University of Khartoum, pp. 169.
Assudan weekly news paper, 1996. No. 65, p.3
Atta elmoula, M. E. 1985. The problem of resource management in
Sudan. Environmental Monograph Series No. 4. Institute of
Environmental Studies, University of Khartoum.
Ball, J. 1998. The impact of sectoral development on natural forest
conservation. FAO. Rome.
Booth, G. A. 1949. Fung working plan for the period 1949-1958 Sudan
Forest Dep. For. Bull. No.2.
Bochet, J. J. 1983. Management of upland watersheds: Participation of
the mountain communities. FAO Conservation guide 8, FAO,
Rome.
Casey, J. and Muir, K. 1986. Forestry for rural development in
Zimbabwe, Social Forestry Net Work No. 3 C.
Catinot, R. 1997. The sustainable management of tropical rain forests.
General Secretariat, Association technique internationale.
Chikamal, S.S. Mbiru and O. Souvounnavong, 1999. Report of the
meeting of heads of forestry research in Eastern Africa, Kenya.
Forestry research institute, Muguga, Kenya, 14-16 December 1999.

68
Classen, E. 1999. South Africa, historical facts. www. Socanth. Cam. Ac.
Uk /pdf/social bodies full programme.
Cofoplan, B. 1991. Implementation, marinating and evaluation of
participatory forestry projects. Ministry of Environment and
Natural Resources, Forest Department, Kenya Nairobi.
Davise C. D. 1990. The ideal methods and tools for participatory
assessment monitoring and evaluation in community forestry.
FAO, Rome.
Eisa A. 1996. Development for environmental perspective. Sudan
environment conservation society. Sudan.
Elsiddig, E.A, Eltayeb, A.M., Abdelgadir, A.Y. 1988. Sustainable
management of natura forests in Jebal Marra with consideration to
community needs. Sudanese Environmental Conservation Society,
Khartoum. 68 pp.
Elsiddig, E. A. 2004 Community-based natural resource management in
Sudan: Awimbo, J.; Barrow, E. Karaba, M 2004.Community –
based natural resource managementin the IGAD region. IUCN,
Nairobi.
FAO 1978. People's participation in forestry local community
development. FAO forestry paper No. 7, FAO, Rome.
FAO 1985. Tree growing by rural people. Forestry Paper No. 64.
FAO 1990. Forestry and food security. Forestry Paper No. 90.
FAO 1993. The challenge of sustainable forest management: What future
for the World's forests? FAO, Rome.
FAO 1995. Deforestation trends in tropical Africa. African Journal of
Ecology, FAO Rome.

69
FAO 1999. The international meeting on special needs and requirements
of developing countries with low forest cover. Land unique type
October (4-6) 1999.
FNC 1994. Studies on forest products consumption in the Sudan. Forest
National Corporation, Khartoum.
FRA 2000. Global forest resources assessment. FAO forestry paper No.
140 Rome, Italy.
FNC 2007. Geographical information system Map. Forest National
Corporation 2007. Khartoum.
Gadant, I. 1987. Amanagement et developpment, un plaidoyer,technique
et ducumentaton (lavoisier) Paris.
Grainger A., 1990. The Threatening Desert: Controlling Desertification.
Earthscan Publications, London. 384 pp.
Grimble, R. J. and Chan, M-K. 1995. Stakeholder analysis for natural resource management in developing countries. Natural Resources Forum, 19(2): 113-124 .
Gutbi, N. 1997. Desertification and deforestation. social forestry and
environment, Sudanese social forestry society, news letter 3rd issue,
March 1997
Hamny, T.; Tibage, M. and Ahmed, A. 2002. Report on land use in
Sinnar State and their effects on Eldinder Reserve. Ministry of
Agriculture, Sinnar.
Harrison, M. N. and Jackson, J. K. 1958. Ecological classification of the
vegetation of the Sudan. Bull. Forestry department Khartoum. N.
S. No. (2).
Hasab elrasoul, F. 1999. Status of forestry research in Sudan. Report for
the meeting, of heads of forestry research in eastern Africa.
Muguga, Kenya 1999.

70
Hauck 1974. Tropical forest and shifting cultivation. FAO, United
Nation. www. Cambodia crops.org/problems/shifting-cultivation
FAO. HTM-25k.
HCENR 2000. Report on the expansion of mechanized agriculture at the
expense of natural wood land. Sudan.
Hemosilla, A. (1999). Towards sustainable forest management, an
examination of the technical, economic and institutional feasibility
of improving management of the global forest state. working paper
FAO/FP/01. FAO Rome.
Hummel, F. C. 1991 The outlook for forestry as a land use in Europe. ...
F. C. Hummel (ed.). Martinus Nijhoff/Dr. W. Junk Publishers.
Investment Map, 2004. Investment map for Blue Nil State, March 2004
.شرآة الجزيرة للخبراء المتحدين العالمية
ITTO. 1992. Guidelines for the Sustainable Management of Natural
Tropical Forests. Policy Development Series No. 1. International
Tropical Timber Organization
Kadouf, 1986. Agricultural land. www. Loop net. Com/land.
Lanly, T. P. 1982. Tropical forest resources. FAO forestry paper No.30,
Rome.
Lundgren, B. 1982. Introduction to agroforestry system 1:3 - 6 Mac
Donald L H (od) agroforestry in the Africa, humid tropic, United
Nations University Tokio, Japan.
Mayers, N. 1994. Tropical deforestation: Chapter 2 in the tropical
deforestation causes, London: UCL press
Mckean, M. 1995. Common property. Paper presented at international
conference, university of leiden 1995.
Mohamed, G.A. 2005. Improvement of traditional Acacia Senegal
agroforestry on sandy soils in Western Sudan, academic
dissertation. Helsinki 2005.

71
Morel, R. and Quantin, P. 1972. Observation sur l- evolution a- long
terme de la fertilite des sols cultives a grimnani. Republique Centra
Africa.
Muphree, 2000. Community based conservation, Africa wildlife
management in the new millennium. Mweka, Tanzania 18 p.
Murry, 1993. A goal of improved forest management rural community
development. www. Wds. World bank.org/wdsp/id
Nimer, M.B. 2001. Development of Dindir National Park. worshop on
development of Dinder national reserve. Sudan environment
conservation society.
Nicholson, N. 2002. Environmental degradation, Ns lecture 11 September
2002.
Nye, P. H. and Greenland, D. J. 1960. The soil under shifting cultivation.
Technical Communication 51. Harpenden: common wealth Bureau
of soils.
Pearce, D.W, Turner, R.K. (1990), Economics of Natural Resources and
the Environment, John Hopkins University Press, Baltimore.
Ruthenberg, H. 1971. Farming system in the tropics. Oxford, Calrendon
press.
Scoones, I. 1995. Livestock population and the household economy: a
case study from southern Zimbadwe PhD Thesis, University of
London.
Solow, 1992. Climate viability and impacts on east African livestock.
African Journal of range and forage science. Printed in South
Africa.
UNCED, 1992. United nation conference on environment and
development, held in Brazil in 1992.
Vink, 1987. Integrated land use plan for Rawashda forest reserve. FAO
field document No. 27.

72
WCED, 1987. World Commission for Environment and Development:
our common future. Oxford University.
Western and Wright, 1994.Community natural resources management.
Kleymeyer, C. D. 1994. Cultural traditions and community-based
conservation. In Natural connections: Perspectives in community-based
conservation, ed. D. Western and M. Wright,323–346. Washington, DC:
Island Press
Westoby, J. 1987. The purpose of the tree, first published 1987 ,108 c
Cowley road, Oxford Ox4, UK.
World Bank, 1986. Sudan forestry sector review. Main report.
World Bank, 1996. Towards environmental sustainable development in
sub-saharan Africa. Development of agriculture and environment
division, Washington D.C.
World Bank, 1991. The World Bank and the Environment. A progress
Report. Fiscal 1991. Washington, D.C.

73
Appendix
Appendix. 3.1 Study area

74
(Appendix. 5.1) Grazing in Khor Donya Forest

75
(Appendix. 5.2) Khor Donya Forest as a source of fuel wood

76
(Appendix.5.3) Forest and Agriculture (Land sat image)
05000
100001500020000250003000035000
forest Agriculture land
19871999