post demerger financial performance analysis: a case … doc/2018/ijrss_december2018... ·...
TRANSCRIPT
International Journal of Research in Social Sciences Vol. 8 Issue 12, December 2018,
ISSN: 2249-2496 Impact Factor: 7.081 Journal Homepage: http://www.ijmra.us, Email: [email protected] Double-Blind Peer Reviewed Refereed Open Access International Journal - Included in the International Serial Directories Indexed & Listed at: Ulrich's Periodicals Directory ©, U.S.A., Open J-Gage as well as in Cabell’s Directories of Publishing Opportunities, U.S.A
814 International Journal of Research in Social Sciences http://www.ijmra.us, Email: [email protected]
POST DEMERGER FINANCIAL PERFORMANCE ANALYSIS: A CASE STUDY OF SELECT INDIAN
INDIAN COMPANIES
Dr Seema Singhal*
ABSTRACT Demergers are important corporate strategy actions that aid the company in external growth and provide it competitive advantage. In today’s globalized economy,rather than mergers and acquisitions (M&A) , demergers are being increasingly used the world over, for improving competitiveness of companies through gaining greater market share. This paper has focused on the performance of Indian Companies which has gone for demergers. The main objective of this paper is to analyze whether the demergered Companies have achieved financial performance efficiency during the post demerger period specifically in the areas of profitability, leverage and liquidity. Paired sample t-test has been performed to determine the significance differences in financial performance standards four year before and four year after the demerger activity. In general, demerged Companies in India does not bring significance difference on the financial performance after the demerger. The finding of this study shows that there is no improvement in resulting Company’s return on equity, net profit margin, interest coverage, earning per share and dividend per share post-demerger. KEYWORDS: Demergers, Profitability, Leverage, Liquidity, window period, announcement date. Introduction The present paper examines the impact of demergers on the financial efficiency of the selected financial companies in India.By using the ratio analysis approach, we calculate the change in the position of the companies. we examine changes in the efficiency of the companies during the pre and post demerger periods.We found there is no significant change in liquidity position of the companies. This paper aims to examine the impact of demergers on the financial performance of the companies.The pre and post-demerger performances in terms of variables like Sales, Net Earnings, Debt Equity Ratio, and Return on Equity Ratio of the company are analyzed by applying independent sample t test as a main statistical tool. OBJECTIVES 1. To study pre and post demerger influence on profitability of the demerger companies. 2. To analyze pre and post demerger effect on leverage standards of the companies. 3. To determine pre and post demerger liquidity position of the companies. RESEARCH HYPOTHESES: 4. H0: Pre and Post-demerger, there is no significant improvement in profitability standards. 5. H0: Pre and Post-demerger, there is no significant improvement in leverage standards. 6. H0: Pre and Post-demerger, there is no significant improvement in liquidity position of the companies.
Objectives of the Study To study to what extent, demergers have resulted in improving the financial performance. For this purpose, financial performance of pre and post de-merger period will be measured, analyzed and compared in
* Associate Professor, Department of Commerce, MDSD Girls College, Ambala City,Haryana,India,
ISSN: 2249-2496 Impact Factor: 7.081
815 International Journal of Research in Social Sciences http://www.ijmra.us, Email: [email protected]
respect of selected cases. Also the average annual rate of growth in terms of profitability, solvency and activity prior to and during the post demerger period will also be analyzed;
Scope of the Study The sample companies for the present study have been selected in two stages. First, about 70 demergers during 1996 to 2006 were taken from Prowess 3.1; a database developed by Centre for Monitoring Indian Economy. Subsequently the companies whose announcement date of demerger is not given were left out. In the second stage those companies were excluded whose Stock Price Data for two years before announcement of demerger and two years after the announcement is not available. This exercise leaves me with a sample of 18 demerged companies which I have taken for my research work. The list of demerged companies was identified first from Bombay Stock Exchange (BSE) and National Stock Exchange web sites then finally from prowess 3.1. Sources of Data Besides reputed books and journals, the study is based on data taken from Prowess 3.1; a database developed by Centre for Monitoring Indian Economy (CMIE), company reports and Capitaline data basis. Web sites like bseindia.com, nseindia.com. moneycontrol.com, indiainfoline.com have also been extensively consulted. Statistical Techniques and Tools Used To analyze the data collected from sources and to prove hypotheses, various statistical tools and techniques have been applied in this study. Mean, Variance and standard deviation were used for descriptive statistics. The data has been analyzed with the help of SPSS andMS-Excel. In order to analyze the data, student’s t-test is used to evaluate the statistical significance of differences in paired means of financial variables computed for two sample groups, namely pre- demerger period and post demerger period. Pre and post demerger average ratios are calculated to measure the improvement in financial position. Then their significance is tested with the help of t- test and p- value. Ratio analysis is regarded as one of the best tools in analyzing and comparing the time series accounting data of different companies. That is why it has been used in the present study. For our study 10 important ratios of demerged companies for four years before demerger and four years after demerger have been calculated. The year of demerger is omitted because it is considered as transitional period. The ratios used for this purpose are liquidity ratios, solvency ratios, activity ratios and efficiency ratios. DATA ANALYSIS
Pre and post-demerger performance ratios are computed for the entire set of sample companies, which have gone through demerger during the selected period. The pre and post demerger performance ratios are compared to see if there is any statistically significant change in performance of demerged company after demerger, using “sample t-test” at confidence level of 0.01 or 99%.
LITERATURE REVIEW Chang and Hertzel (2004)37 in their paper investigated the relation between changes in firm value and
changes in ownership structure that take place around non-control-related targeted repurchases of common stock for a sample of223 target repurchases from 1979 to 1995. In contrast to the negative average abnormal return associated with the announcement of a control-related targeted repurchase (greenmail transaction), they found that the announcement of a non-control-related targeted repurchase is associated with a positive and significant average abnormal return. Cross-sectional analysis indicated that the change in firm value at the announcement of a non-control-related repurchase is negatively related to the resulting changes in both insider ownership and outside block-holdings. They also found significant differences in announcement-period stock price effects depending on the identity of the selling shareholder. Mishra and Goel (2005)38 they examined the financial implication of RIL-RPL merger on the shareholders’ wealth. The profitability for shareholders was investigated by examining the daily excess returns that accrue to the shareholders around the date of announcement of the merger deal. The study
ISSN: 2249-2496 Impact Factor: 7.081
816 International Journal of Research in Social Sciences http://www.ijmra.us, Email: [email protected]
shows that positive excess return occurred to the shareholders of the target company RPL and negative excess returns to the shareholder of the acquiring company, RIL. They found that in this process of merger, despite the deal appearing to be favourable to the shareholders gained from the deal. This deal was led with the ‘empire building’ motive along with spreading the risk and return more equally among the shareholders of two companies.
Mallik and Rakshit (2006)39in their article examined and explained how a company restructures its business and increase shareholders value through demerger. It also seeks to discuss the importance of demerger as a business planning tool. Pre and post demerger financial performance evaluation under traditional method and EVA based method has also been attempted in this paper. The efficiency of strategic decision in ensuring over all value creation for an enterprise will be examined on the basis of case study of Dabur India Ltd They analyzed that under traditional performance measurement system ROCE is 9.2% i.e. the company earns profit from its investment and the company is value creating company. But the EVA based evaluation it appears that the company has destroyed value to the extent of Rs. 22.84 Cr. In the end they concluded that before post demerger financial performance analysis was made, it was expelled that the demerger would represent a win - win situation for both the companies and create greater value for shareholders. Hence from the post demerger financial performance analysis it appears that Dabur India Ltd.; performance is good but Dabur Pharma Ltd.; financial position is not good. In the following areas the company should take immediate action for long-term better performance.
1. Dabur Pharma Ltd.; require efficient working capital management. 2. For Evaluation of Investment proposal modern methods should be used. 3. According to them, any company can succeed as a Pharmaceutical company unless the company
invents and develop new drugs. 4. The company recently entered into tie up with US based drug major to sell its oncology drugs. Ability
to provide high quality products at reasonable / low prices is essential not only to combat competition and to emerge as Key player, but also to meet social goals.
NAG (2006)40explained in his article that companies like L & T and Reliance have demerged their entities which is beneficial to their shareholders. He discussed the process of demerged and how it impacts the shareholders’ wealth. According to him demerger is the process of corporate restructuring in which a single or multiple business unit(s) is spun off as a new entity. Demerger is just the opposite of merger and tends to go in and out of fashion. When the market prices of shares are rising, the companies like to use their shares to acquire other companies. At this juncture, advisors of the company may suggest and encourage for a merger after taking over the other company. Where as in a falling market, mergers and initial public offers are less popular, and the merchant banks, which normally earn their fees from corporate activity, start looking at demerger possibilities of their clients. Demerger is not of recent origin. In the UK, Argos was spun out from British American Tobacco in 1990 and Zeneca was spun off from ICI in 1993. In India, the most prominent demergers in recent times include the cement division of L & T Ltd, named as Ultratech Cement Ltd, Reliance energy Ventures Ltd, Reliance Natural Resources Ventures Ltd, and Reliance Capital Ventures Ltd, - which spun out from RIL. While the demerger of Ultra tech from L & T seems to be one of L & T’s grand strategies to concentrate more on Infrastructure, Engineering, Energy and Turnkey businesses, the demergers of RIL were the outcome of ownership settlements between two siblings (Promoters) in RIL. This demerger had two important issues. The first important issue was that L & T Employees Welfare Foundation was given a stake in the company; in a way, it protected the interests of both existing and former employees. While the second issue was that shareholders at large also got benefited from this demerger. During early 2003, L & T’s Rs. 10 face value share prior to demerger was hovering around Rs. 350/400 per share. After the demerger, for every 100 shares of L 7 T, shareholders got 50 shares of L & T of Rs. 5 face value each and 40 shares of UCL with face value of Rs. 10 each. Around April 2004, the entire demerger process was complete. Initially there were some corrections in the market. Later, share prices of both L & T and UCL started rising. Within two years, shareholders of erstwhile L & T have almost trebled their wealth with a growth more than SENSEX or Nifty. In the first week of April 2006, face value of Rs.5 a share of L & T was quoted at Rs.2432, while of UCL quoted Rs.683 per share. This

ISSN: 2249-2496 Impact Factor: 7.081
817 International Journal of Research in Social Sciences http://www.ijmra.us, Email: [email protected]
means shareholders’ value went up more than 100 % within two years, which was unprecedented in the history of demergers of any company.
Sudarsanam and Qian (2007)41 in their findingsproposed and tested from a sample of 170 European spinoffs completed during the period from 1987 to 2005, the governance-based model for spin off value effects, which argued that spinoffs create shareholder value by enhancing corporate governance and mitigating agency costs in pot-spinoff firms., they present some evidence supporting the governance-based hypotheses. First, they found that spinoff parents are likely to have weaker corporate governance than non-spinoff control firms. Therefore, agency problems in spinoff parents seem to be more severe than those in non-spinoff control firms. Second, they found the strength of corporate governance for spinoff parents is generally negatively associated with the spinoff announcement period abnormal returns although the relationship is insignificant. Third, they concluded that post-spinoff firms with increased board independence or facing takeover threats earn significantly higher long-run abnormal returns than those without such activities. Finally, they document evidence that family-controlled parent firms have significantly lower performance than non-family-controlled parent firms. Therefore, they evidence indicates that the gains from spinoffs reflect the lessening of agency conflicts.
Unyong (2007)42in his article explored changes in compensation and pay-for-performance relationships for a sample of 124 spinoffs during 1990-1997. They concluded that the operating performance results support management incentive explanation over business focus as the source of value creation in spinoffs. Their findings suggested that changes in managerial incentive compensation are a significant motivation for corporate spinoffs. Corporate spinoffs enhance managerial incentive compensation and the changes in managerial incentive compensation explain the value enhancement and operating performance improvements ‘that occur following spinoffs.’ They reached a conclusion that the pay-performance relations improve following spinoff distributions in three aspects. First they found that PPS increases for spinoff subsidiaries but remains the same for the parent firms. Second, they advocated that PPS for spinoff subsidiaries does not decrease when a pre-parent’s CEO becomes a spinoff subsidiary’s CEO adjusting for size effects. Third, resulted the higher incentives are offered to the CEO of spinoff subsidiaries created from FI spinoffs than that of pre-parents involved in FI spinoffs. So the changes in managerial incentives are significant motives for corporate spinoffs. Firms appear to use spinoffs as a way to rewrite managerial compensation contracts more efficiently and to improve firm performance. While the managerial incentive hypothesis and the business focus hypothesis are not mutually exclusive, the results from operating performance show that the managerial incentive effect appears to dominate the business focus effect.
Lundh (2007)43in his project concluded that spinoffs are an increasing phenomenon on the Swedish stock market. He had observed 17 pre-spinoff companies that become 34 post- spin off companies which continued to be traded on the stock market. In this report one can read about factors that trigger spinoffs as well about the short and medium term risk and return that spinoffs yield. He compared the spinoff company and the parent company in the post-spinoff scenario it can be concluded that the company who is performing the best is also the riskier alternative and the spinoff performs better than the parent company in eleven out of seventeen times. There is also a correlation between risk and return- when higher return is observed it also brings higher risk, and it holds true in all samples except one.
Veld and Merkoulova (2008)44 in their researchreviewed the literature on the factors that influence the wealth effects associated with the announcements of corporate spin-offs. They used meta-analysis to summarize the findings of 26 event studies on spin-off announcements. They found a significantly positive average abnormal return of 3.02% during the event window. Returns are higher for larger spin-offs, for divestments that are tax or regulatory friendly and for spin-offs that lead to the divestiture of a non-related division. They also found that spin-offs that were later completed were associated with lower abnormal returns than non-completed spin-offs. They overviewed studies on the long-run stock price performance of spin-offs. Even though early studies found a long-run superior performance, this effect was no longer found in later studies that use more refined statistical tests.
ISSN: 2249-2496 Impact Factor: 7.081
818 International Journal of Research in Social Sciences http://www.ijmra.us, Email: [email protected]
Ramakrishnan (2008)45 indicated thatthe long-term post-merger performance of 414 mergers between 1993 and 2005. He has carried out statistical analyses of financial data pertaining to 87 pairs of merged firms. These mergers took place in the period 1996 to 2002. It is found that the merged firms demonstrate improvement in long-term financial performance after controlling for pre-merger performance, with increasing cash flow returns post merger, at an annual rate of 4.3%. This improved operating cash flow return is on account of improvements in the post-merger operating margins of the firms, though not of the efficient utilization of the assets to generate higher sales. Increase in market power also appears to be driving gains through mergers in India. As far as wealth gains on merger announcement are concerned, only the shareholders of the acquired firms appear to be enjoying significant positive share price returns of 11.6%. The shareholders of the acquiring firms and the combined firms do not seem to be witnessing any significant change in returns. With regard to the strategic factors affecting long-term post-merger financial performance, related mergers seem to be performing 5.4% lower than unrelated mergers. Both the transfer of corporate control from the acquired firm to the acquiring firm, and the business health of the acquired firm are positively related to the long-term post-merger performance of the firms. In the case of mergers where there is a transfer of management control, none of these three groups of shareholders witnesses any abnormal returns on announcement of the merger. The wealth gains to acquired firm shareholders on announcement of a merger are positively influenced by the relative size and the pre-merger performance of the acquired firm. The transfer of corporate control from the acquired firm to the acquiring firm is negatively associated with these abnormal share price returns. The level of industry-relatedness of the acquired and the acquiring firms, the method of payment for the acquired firm and the business health of the acquired firm do not appear to be playing a role in affecting the share price returns to the acquired firm shareholders, on announcement of a merger.
Anand and Singh (2008)46 they used event study methodology to analyze five mergers in Indian Banking Sector to capture the returns to shareholders as a result of the merger announcement during the period of 1999 to 2005. They explored the short-term shareholder wealth effects of the Indian Bank mergers. The merger of Times Bank with HDFC Bank (1999), The Bank of Madura with the ICICI Bank (2000), the ICICI Ltd. with ICICI Bank (2001), the Global Trust Bank (GTB) with the Oriental Bank of Commerce (OBC) (2004), and the Bank of Punjab (BOP) merger with the Centurian Bank (2005) have been studied. The findings of the study were in agreement with the European and the US bank mergers and acquisitions except for the fact that the value to the shareholders of the bidder banks has been destroyed in the US context. From the study, it emerged that merger announcement in the Indian banking industry has positive and significant shareholders’ wealth affect both for the bidder and target banks.
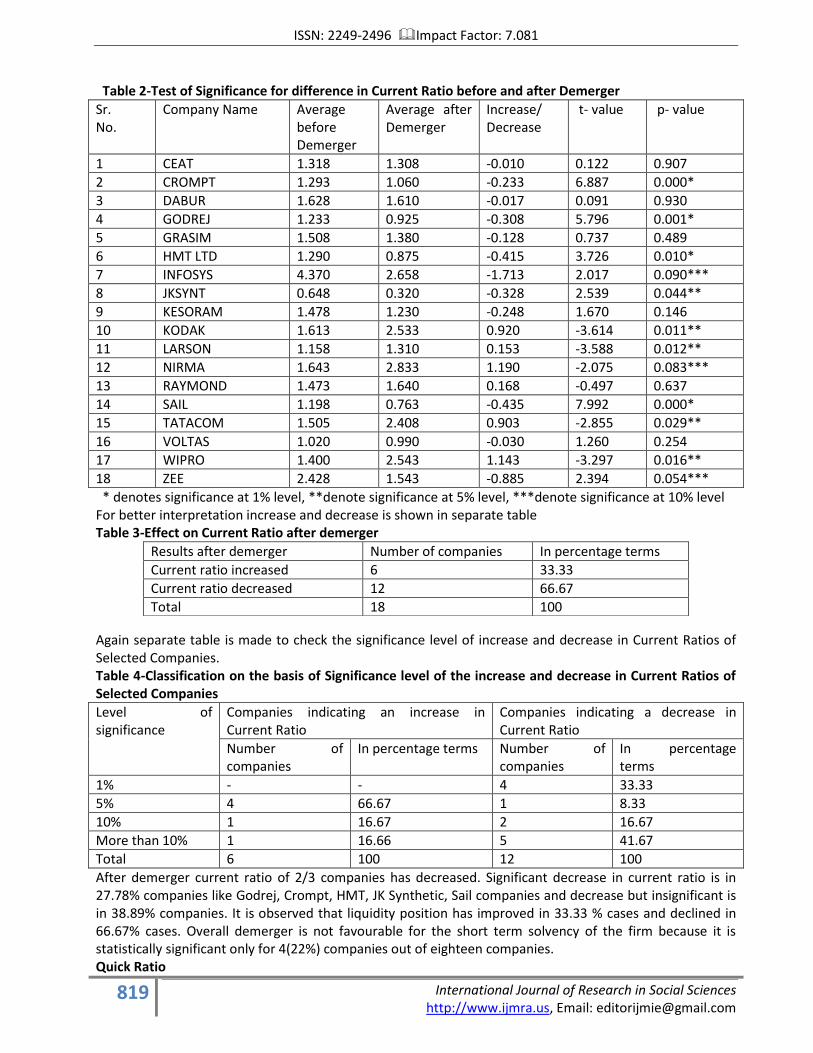
Analysis and Interpretation: A brief about financial position is detailed as under: Liquidity Position Liquidity refers to the ability of a firm to meet its short-term (usually up to 1 year) obligations. The ratios which indicate the liquidity of a company are Current ratio, Quick/Acid-Test ratio, and Cash ratio. These ratios are discussed below. Current Ratio The higher the current ratio, the greater will be the short-term solvency. A current ratio of 2:1 is considered satisfactory. After calculating current four years before and after demerger average is taken to apply t- test and significance level is assessed. Average of ratios is calculated by adding four years ratio and then dividing them with number of ratios. To test the significance level t-value and p-value is calculated with the help of SPSS package and Data analysis tool in Excel.
ISSN: 2249-2496 Impact Factor: 7.081
819 International Journal of Research in Social Sciences http://www.ijmra.us, Email: [email protected]
Table 2-Test of Significance for difference in Current Ratio before and after Demerger
Sr. No.
Company Name Average before Demerger
Average after Demerger
Increase/ Decrease
t- value p- value
1 CEAT 1.318 1.308 -0.010 0.122 0.907
2 CROMPT 1.293 1.060 -0.233 6.887 0.000*
3 DABUR 1.628 1.610 -0.017 0.091 0.930
4 GODREJ 1.233 0.925 -0.308 5.796 0.001*
5 GRASIM 1.508 1.380 -0.128 0.737 0.489
6 HMT LTD 1.290 0.875 -0.415 3.726 0.010*
7 INFOSYS 4.370 2.658 -1.713 2.017 0.090***
8 JKSYNT 0.648 0.320 -0.328 2.539 0.044**
9 KESORAM 1.478 1.230 -0.248 1.670 0.146
10 KODAK 1.613 2.533 0.920 -3.614 0.011**
11 LARSON 1.158 1.310 0.153 -3.588 0.012**
12 NIRMA 1.643 2.833 1.190 -2.075 0.083***
13 RAYMOND 1.473 1.640 0.168 -0.497 0.637
14 SAIL 1.198 0.763 -0.435 7.992 0.000*
15 TATACOM 1.505 2.408 0.903 -2.855 0.029**
16 VOLTAS 1.020 0.990 -0.030 1.260 0.254
17 WIPRO 1.400 2.543 1.143 -3.297 0.016**
18 ZEE 2.428 1.543 -0.885 2.394 0.054***
* denotes significance at 1% level, **denote significance at 5% level, ***denote significance at 10% level For better interpretation increase and decrease is shown in separate table Table 3-Effect on Current Ratio after demerger Again separate table is made to check the significance level of increase and decrease in Current Ratios of Selected Companies. Table 4-Classification on the basis of Significance level of the increase and decrease in Current Ratios of Selected Companies
Level of significance
Companies indicating an increase in Current Ratio
Companies indicating a decrease in Current Ratio
Number of companies
In percentage terms Number of companies
In percentage terms
1% - - 4 33.33
5% 4 66.67 1 8.33
10% 1 16.67 2 16.67
More than 10% 1 16.66 5 41.67
Total 6 100 12 100
After demerger current ratio of 2/3 companies has decreased. Significant decrease in current ratio is in 27.78% companies like Godrej, Crompt, HMT, JK Synthetic, Sail companies and decrease but insignificant is in 38.89% companies. It is observed that liquidity position has improved in 33.33 % cases and declined in 66.67% cases. Overall demerger is not favourable for the short term solvency of the firm because it is statistically significant only for 4(22%) companies out of eighteen companies. Quick Ratio
Results after demerger Number of companies In percentage terms
Current ratio increased 6 33.33
Current ratio decreased 12 66.67
Total 18 100
ISSN: 2249-2496 Impact Factor: 7.081
820 International Journal of Research in Social Sciences http://www.ijmra.us, Email: [email protected]
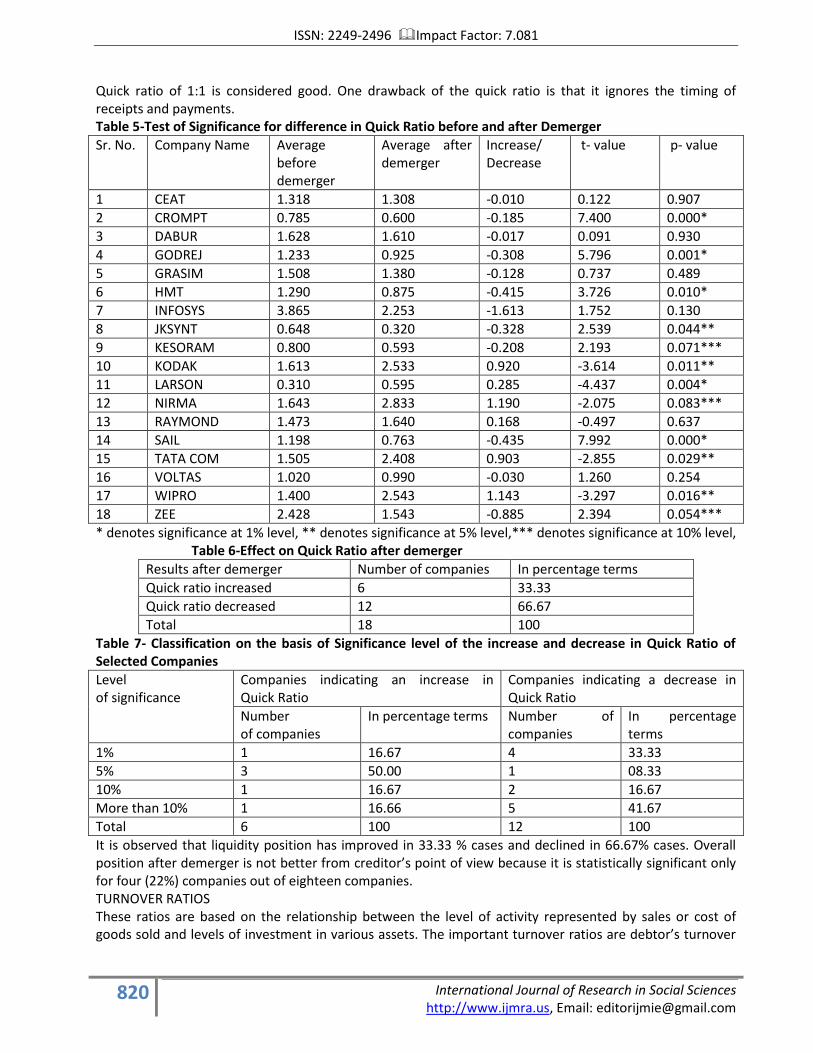
Quick ratio of 1:1 is considered good. One drawback of the quick ratio is that it ignores the timing of receipts and payments. Table 5-Test of Significance for difference in Quick Ratio before and after Demerger
Sr. No. Company Name Average before demerger
Average after demerger
Increase/ Decrease
t- value p- value
1 CEAT 1.318 1.308 -0.010 0.122 0.907
2 CROMPT 0.785 0.600 -0.185 7.400 0.000*
3 DABUR 1.628 1.610 -0.017 0.091 0.930
4 GODREJ 1.233 0.925 -0.308 5.796 0.001*
5 GRASIM 1.508 1.380 -0.128 0.737 0.489
6 HMT 1.290 0.875 -0.415 3.726 0.010*
7 INFOSYS 3.865 2.253 -1.613 1.752 0.130
8 JKSYNT 0.648 0.320 -0.328 2.539 0.044**
9 KESORAM 0.800 0.593 -0.208 2.193 0.071***
10 KODAK 1.613 2.533 0.920 -3.614 0.011**
11 LARSON 0.310 0.595 0.285 -4.437 0.004*
12 NIRMA 1.643 2.833 1.190 -2.075 0.083***
13 RAYMOND 1.473 1.640 0.168 -0.497 0.637
14 SAIL 1.198 0.763 -0.435 7.992 0.000*
15 TATA COM 1.505 2.408 0.903 -2.855 0.029**
16 VOLTAS 1.020 0.990 -0.030 1.260 0.254
17 WIPRO 1.400 2.543 1.143 -3.297 0.016**
18 ZEE 2.428 1.543 -0.885 2.394 0.054***
* denotes significance at 1% level, ** denotes significance at 5% level,*** denotes significance at 10% level, Table 6-Effect on Quick Ratio after demerger
Results after demerger Number of companies In percentage terms
Quick ratio increased 6 33.33
Quick ratio decreased 12 66.67
Total 18 100
Table 7- Classification on the basis of Significance level of the increase and decrease in Quick Ratio of Selected Companies
Level of significance
Companies indicating an increase in Quick Ratio
Companies indicating a decrease in Quick Ratio
Number of companies
In percentage terms Number of companies
In percentage terms
1% 1 16.67 4 33.33
5% 3 50.00 1 08.33
10% 1 16.67 2 16.67
More than 10% 1 16.66 5 41.67
Total 6 100 12 100
It is observed that liquidity position has improved in 33.33 % cases and declined in 66.67% cases. Overall position after demerger is not better from creditor’s point of view because it is statistically significant only for four (22%) companies out of eighteen companies. TURNOVER RATIOS These ratios are based on the relationship between the level of activity represented by sales or cost of goods sold and levels of investment in various assets. The important turnover ratios are debtor’s turnover

ISSN: 2249-2496 Impact Factor: 7.081
821 International Journal of Research in Social Sciences http://www.ijmra.us, Email: [email protected]
ratio, inventory/stock turnover ratio, fixed assets turnover ratio, and working capital turnover ratio. These are described below: Debtors Turnover Ratio Efficiency of the Company to manage the credit is assessed with the help of Debtors Turnover Ratio. It measures the liquidity of a firm's debts. It is calculated by dividing the Net Credit Sales by Average Debtors outstanding during the year. Net credit sales are the gross credit sales minus returns, if any, from customers. Average debtors are the average of debtors at the beginning and at the end of the year. This ratio shows how rapidly debts are collected. Higher Debtor Turnover Ratio shows that the organization has better and efficient management of credit. Table 8-Test of significance for difference in Debtors Turnover Ratio before and after Demerger
Sr. No.
Company Name
Average before demerger
Average after demerger
Increase/ Decrease
t- value p- value
1 CEAT 6.480 6.870 0.390 -0.488 0.643
2 CROMPT 3.058 3.248 0.190 -0.603 0.569
3 DABUR 6.488 9.675 3.188 -9.294 0.000*
4 GODREJ 9.575 9.220 -0.355 0.343 0.743
5 GRASIM 6.175 10.640 4.465 -3.802 0.009*
6 HMT 5.778 1.508 -4.270 7.820 0.000*
7 INFOSYS 8.530 8.078 -0.452 1.772 0.127
8 JKSYNT 9.720 13.020 3.300 -2.052 0.086***
9 KESORAM 8.838 8.470 -0.368 0.593 0.575
10 KODAK 7.918 12.998 5.080 -2.845 0.029**
11 LARSON 6.765 4.870 -1.895 3.660 0.011**
12 NIRMA 10.783 12.000 1.218 -1.071 0.325
13 RAYMOND 5.850 3.948 -1.903 3.733 0.010*
14 SAIL 7.715 9.423 1.708 -2.231 0.067***
15 TATA COM 3.965 3.243 -0.723 2.086 0.082***
16 VOLTAS 5.595 4.138 -1.458 3.405 0.014**
17 WIPRO 6.330 5.483 -0.848 0.912 0.397
18 ZEE 3.353 2.110 -1.243 3.999 0.007*
* denote significance at 1% level, ** denote significance at 5% level,*** denote significance at 10% level Table 9 -Effect on Debtor Turnover Ratio after demerger
Results after demerger Number of companies In percentage terms
Debtor Turnover Ratio increased 8 44.44
Debtor Turnover Ratio decreased 10 55.56
Total 18 100.00
The impact of demerger on the liquidity position of a company depends on the quality of debtors to a great extent. Higher the value of Debtors Turnover ratio, the more efficient is the management of credit. Table 10-Classification on the basic of Significance level of the increase and decrease in Debtor Turnover Ratio of Selected Companies
Level of significance Companies indicating an increase in Debtor turnover ratio
Companies indicating a decrease in Debtor turnover ratio
Number of companies
In percentage terms
Number of companies
In percentage terms
1% 2 25.0 3 30
5% 1 12.5 2 20
10% 2 25.0 1 10
ISSN: 2249-2496 Impact Factor: 7.081
822 International Journal of Research in Social Sciences http://www.ijmra.us, Email: [email protected]
More than 10% 3 37.5 4 40
Total 8 100 10 100
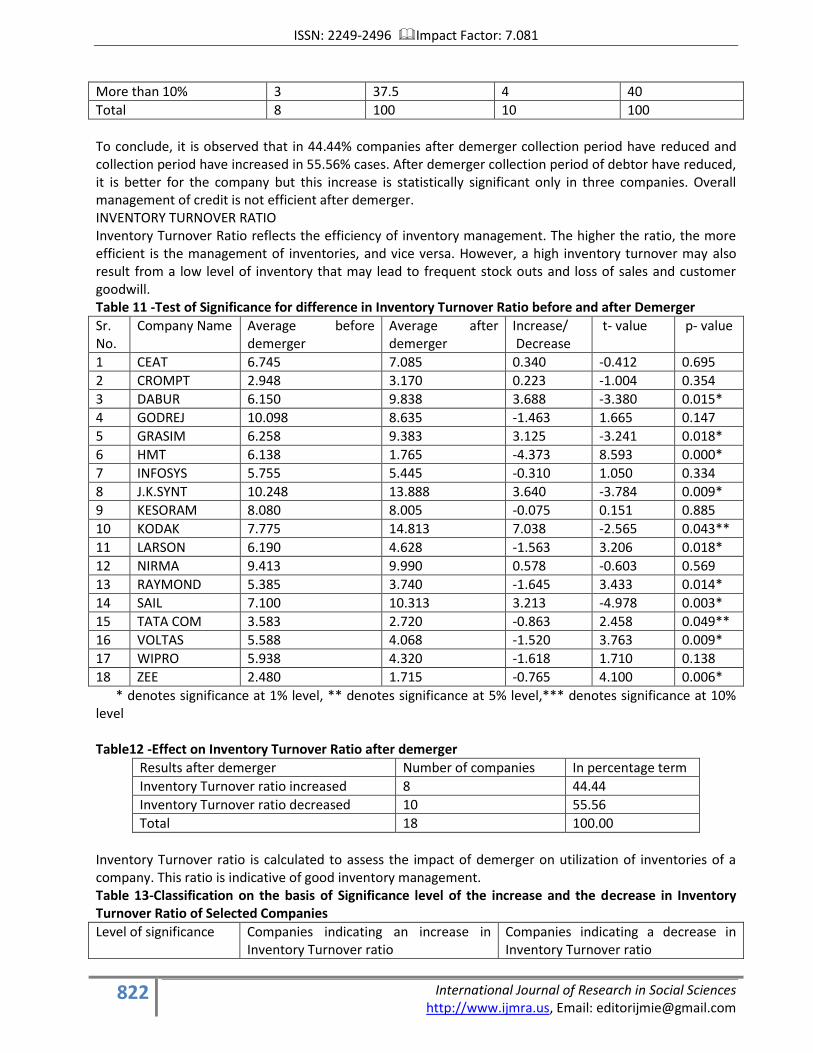
To conclude, it is observed that in 44.44% companies after demerger collection period have reduced and collection period have increased in 55.56% cases. After demerger collection period of debtor have reduced, it is better for the company but this increase is statistically significant only in three companies. Overall management of credit is not efficient after demerger. INVENTORY TURNOVER RATIO Inventory Turnover Ratio reflects the efficiency of inventory management. The higher the ratio, the more efficient is the management of inventories, and vice versa. However, a high inventory turnover may also result from a low level of inventory that may lead to frequent stock outs and loss of sales and customer goodwill. Table 11 -Test of Significance for difference in Inventory Turnover Ratio before and after Demerger
Sr. No.
Company Name Average before demerger
Average after demerger
Increase/ Decrease
t- value p- value
1 CEAT 6.745 7.085 0.340 -0.412 0.695
2 CROMPT 2.948 3.170 0.223 -1.004 0.354
3 DABUR 6.150 9.838 3.688 -3.380 0.015*
4 GODREJ 10.098 8.635 -1.463 1.665 0.147
5 GRASIM 6.258 9.383 3.125 -3.241 0.018*
6 HMT 6.138 1.765 -4.373 8.593 0.000*
7 INFOSYS 5.755 5.445 -0.310 1.050 0.334
8 J.K.SYNT 10.248 13.888 3.640 -3.784 0.009*
9 KESORAM 8.080 8.005 -0.075 0.151 0.885
10 KODAK 7.775 14.813 7.038 -2.565 0.043**
11 LARSON 6.190 4.628 -1.563 3.206 0.018*
12 NIRMA 9.413 9.990 0.578 -0.603 0.569
13 RAYMOND 5.385 3.740 -1.645 3.433 0.014*
14 SAIL 7.100 10.313 3.213 -4.978 0.003*
15 TATA COM 3.583 2.720 -0.863 2.458 0.049**
16 VOLTAS 5.588 4.068 -1.520 3.763 0.009*
17 WIPRO 5.938 4.320 -1.618 1.710 0.138
18 ZEE 2.480 1.715 -0.765 4.100 0.006*
* denotes significance at 1% level, ** denotes significance at 5% level,*** denotes significance at 10% level Table12 -Effect on Inventory Turnover Ratio after demerger
Results after demerger Number of companies In percentage term
Inventory Turnover ratio increased 8 44.44
Inventory Turnover ratio decreased 10 55.56
Total 18 100.00
Inventory Turnover ratio is calculated to assess the impact of demerger on utilization of inventories of a company. This ratio is indicative of good inventory management. Table 13-Classification on the basis of Significance level of the increase and the decrease in Inventory Turnover Ratio of Selected Companies
Level of significance Companies indicating an increase in Inventory Turnover ratio
Companies indicating a decrease in Inventory Turnover ratio

ISSN: 2249-2496 Impact Factor: 7.081
823 International Journal of Research in Social Sciences http://www.ijmra.us, Email: [email protected]
Number of companies
In percentage term Number of companies
In percentage term
1% 2.0 25.0 3.0 30.0
5% 3.0 32.5 3.0 30.0
10% - - - -
More than 10% 3.0 37.5 4.0 40.0
Total 8.0 100.0 10.0 100.0
To conclude, liquidity position has improved in 5 companies out of 18 companies means inventory is turning into receivable very rapidly through sales and declined in 6 companies out of 18 companies which shows slow moving stock. This ratio shows how rapidly the inventory is turning into receivables through sales. High ITR indicates good inventory management. Demerged firms’ efficiency in tuning its inventories is continuously improving in five companies (28%) out of eighteen companies which have shown significant increase. These companies are Dabur, Grasim, JK Synthetics, Kodak and SAIL. Demerged firms’ shows slow moving stock in six companies (33%) out of eighteen companies which have shown significant decrease. These companies are HMT, Larson, SAIL, TATA COM, Voltas and Zee. FIXED ASSETS TURNOVER RATIO This ratio measures the efficiency with which fixed assets are employed. A high ratio indicates a high degree of efficiency in asset utilization while a low ratio reflects an inefficient use of assets. However, this ratio should be used with caution because when the fixed assets of a firm are old and substantially depreciated, the fixed assets turnover ratio tends to be high (because the denominator of the ratio is very low). . It may also be indicative of under utilizations or non-utilization of certain assets. Thus with the help of this ratio, it is possible to identify such underlined or unutilized assets and arrange for their disposal. Table 14-Test of Significance for difference in Fixed Asset Turnover Ratio before and after Demerger
Sr. No.
Company Name Average before demerger
Average after demerger
Increase/ Decrease
t- value p- value
1 CEAT 6.745 7.085 0.340 -0.412 0.695
2 CROMPT 2.948 3.170 0.223 -1.004 0.354
3 DABUR 6.150 9.838 3.688 -3.380 0.015*
4 GODREJ 10.098 8.635 -1.463 1.665 0.147
5 GRASIM 6.258 9.383 3.125 -3.241 0.018*
6 HMT 6.138 1.765 -4.373 8.593 0.000*
7 INFOSYS 5.755 5.445 -0.310 1.050 0.334
8 JKSYNT 10.248 13.888 3.640 -3.784 0.009*
9 KESORAM 8.080 8.005 -0.075 0.151 0.885
10 KODAK 7.775 14.813 7.038 -2.565 0.043**
11 LARSON 6.190 4.628 -1.563 3.206 0.018*
12 NIRMA 9.413 9.990 0.578 -0.603 0.569
13 RAYMOND 5.385 3.740 -1.645 3.433 0.014*
14 SAIL 7.100 10.313 3.213 -4.978 0.003*
15 TATA COM 3.583 2.720 -0.863 2.458 0.049**
16 VOLTAS 5.588 4.068 -1.520 3.763 0.009*
17 WIPRO 5.938 4.320 -1.618 1.710 0.138
18 ZEE 2.480 1.715 -0.765 4.100 0.006*
* denote significance at 1% level, ** denote significance at 5% level, *** denote significance at 10% level.
ISSN: 2249-2496 Impact Factor: 7.081
824 International Journal of Research in Social Sciences http://www.ijmra.us, Email: [email protected]
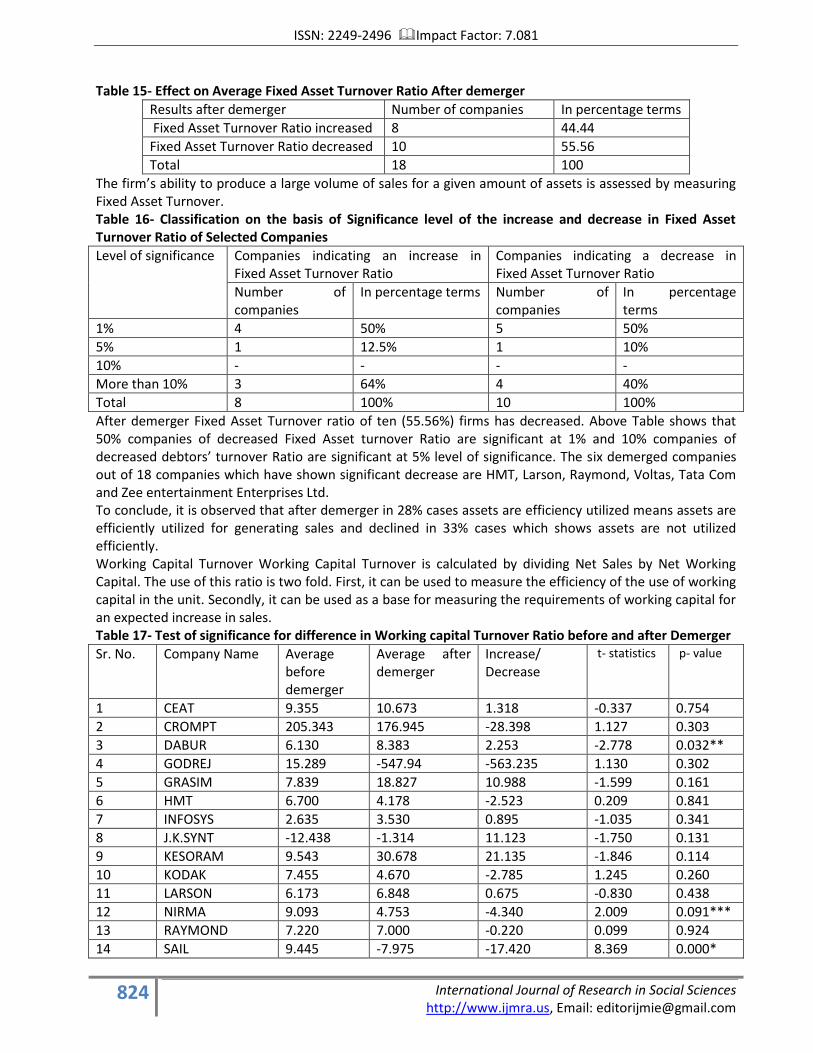
Table 15- Effect on Average Fixed Asset Turnover Ratio After demerger
Results after demerger Number of companies In percentage terms
Fixed Asset Turnover Ratio increased 8 44.44
Fixed Asset Turnover Ratio decreased 10 55.56
Total 18 100
The firm’s ability to produce a large volume of sales for a given amount of assets is assessed by measuring Fixed Asset Turnover. Table 16- Classification on the basis of Significance level of the increase and decrease in Fixed Asset Turnover Ratio of Selected Companies
Level of significance Companies indicating an increase in Fixed Asset Turnover Ratio
Companies indicating a decrease in Fixed Asset Turnover Ratio
Number of companies
In percentage terms Number of companies
In percentage terms
1% 4 50% 5 50%
5% 1 12.5% 1 10%
10% - - - -
More than 10% 3 64% 4 40%
Total 8 100% 10 100%
After demerger Fixed Asset Turnover ratio of ten (55.56%) firms has decreased. Above Table shows that 50% companies of decreased Fixed Asset turnover Ratio are significant at 1% and 10% companies of decreased debtors’ turnover Ratio are significant at 5% level of significance. The six demerged companies out of 18 companies which have shown significant decrease are HMT, Larson, Raymond, Voltas, Tata Com and Zee entertainment Enterprises Ltd. To conclude, it is observed that after demerger in 28% cases assets are efficiency utilized means assets are efficiently utilized for generating sales and declined in 33% cases which shows assets are not utilized efficiently. Working Capital Turnover Working Capital Turnover is calculated by dividing Net Sales by Net Working Capital. The use of this ratio is two fold. First, it can be used to measure the efficiency of the use of working capital in the unit. Secondly, it can be used as a base for measuring the requirements of working capital for an expected increase in sales. Table 17- Test of significance for difference in Working capital Turnover Ratio before and after Demerger
Sr. No. Company Name Average before demerger
Average after demerger
Increase/ Decrease
t- statistics p- value
1 CEAT 9.355 10.673 1.318 -0.337 0.754
2 CROMPT 205.343 176.945 -28.398 1.127 0.303
3 DABUR 6.130 8.383 2.253 -2.778 0.032**
4 GODREJ 15.289 -547.94 -563.235 1.130 0.302
5 GRASIM 7.839 18.827 10.988 -1.599 0.161
6 HMT 6.700 4.178 -2.523 0.209 0.841
7 INFOSYS 2.635 3.530 0.895 -1.035 0.341
8 J.K.SYNT -12.438 -1.314 11.123 -1.750 0.131
9 KESORAM 9.543 30.678 21.135 -1.846 0.114
10 KODAK 7.455 4.670 -2.785 1.245 0.260
11 LARSON 6.173 6.848 0.675 -0.830 0.438
12 NIRMA 9.093 4.753 -4.340 2.009 0.091***
13 RAYMOND 7.220 7.000 -0.220 0.099 0.924
14 SAIL 9.445 -7.975 -17.420 8.369 0.000*
ISSN: 2249-2496 Impact Factor: 7.081
825 International Journal of Research in Social Sciences http://www.ijmra.us, Email: [email protected]
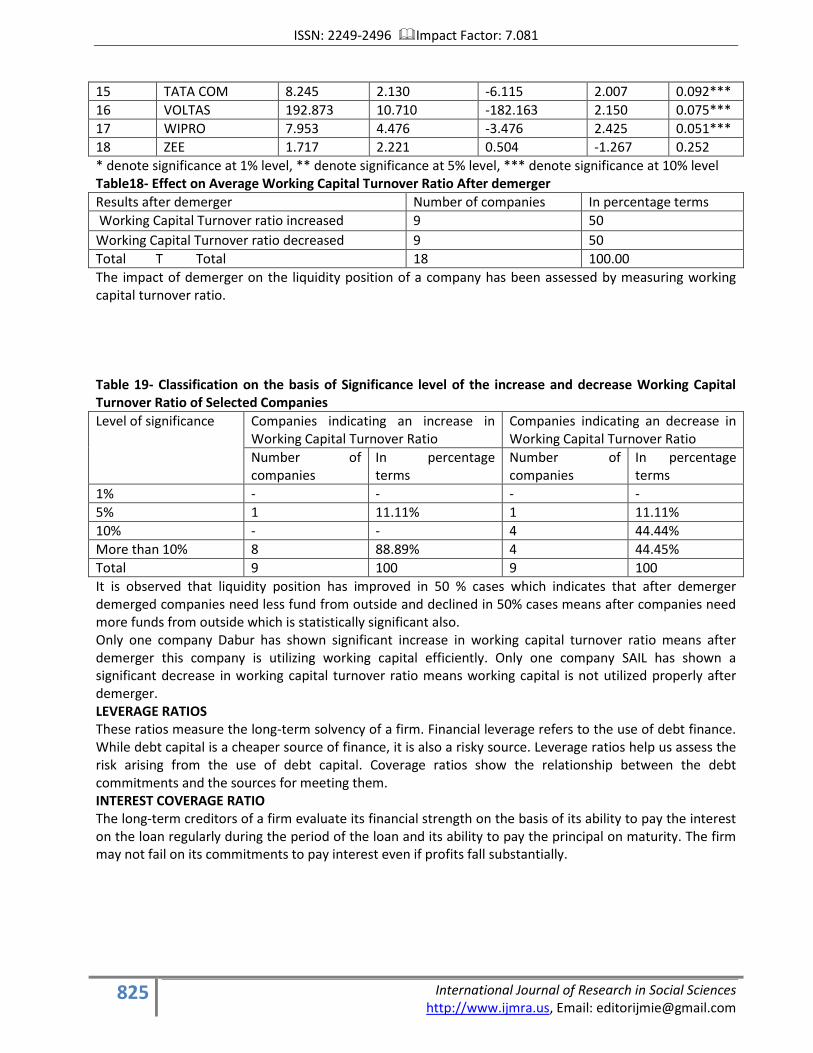
15 TATA COM 8.245 2.130 -6.115 2.007 0.092***
16 VOLTAS 192.873 10.710 -182.163 2.150 0.075***
17 WIPRO 7.953 4.476 -3.476 2.425 0.051***
18 ZEE 1.717 2.221 0.504 -1.267 0.252
* denote significance at 1% level, ** denote significance at 5% level, *** denote significance at 10% level Table18- Effect on Average Working Capital Turnover Ratio After demerger
Results after demerger Number of companies In percentage terms
Working Capital Turnover ratio increased 9 50
Working Capital Turnover ratio decreased 9 50
Total T Total 18 100.00
The impact of demerger on the liquidity position of a company has been assessed by measuring working capital turnover ratio. Table 19- Classification on the basis of Significance level of the increase and decrease Working Capital Turnover Ratio of Selected Companies
Level of significance Companies indicating an increase in Working Capital Turnover Ratio
Companies indicating an decrease in Working Capital Turnover Ratio
Number of companies
In percentage terms
Number of companies
In percentage terms
1% - - - -
5% 1 11.11% 1 11.11%
10% - - 4 44.44%
More than 10% 8 88.89% 4 44.45%
Total 9 100 9 100
It is observed that liquidity position has improved in 50 % cases which indicates that after demerger demerged companies need less fund from outside and declined in 50% cases means after companies need more funds from outside which is statistically significant also. Only one company Dabur has shown significant increase in working capital turnover ratio means after demerger this company is utilizing working capital efficiently. Only one company SAIL has shown a significant decrease in working capital turnover ratio means working capital is not utilized properly after demerger. LEVERAGE RATIOS These ratios measure the long-term solvency of a firm. Financial leverage refers to the use of debt finance. While debt capital is a cheaper source of finance, it is also a risky source. Leverage ratios help us assess the risk arising from the use of debt capital. Coverage ratios show the relationship between the debt commitments and the sources for meeting them. INTEREST COVERAGE RATIO The long-term creditors of a firm evaluate its financial strength on the basis of its ability to pay the interest on the loan regularly during the period of the loan and its ability to pay the principal on maturity. The firm may not fail on its commitments to pay interest even if profits fall substantially.
ISSN: 2249-2496 Impact Factor: 7.081
826 International Journal of Research in Social Sciences http://www.ijmra.us, Email: [email protected]
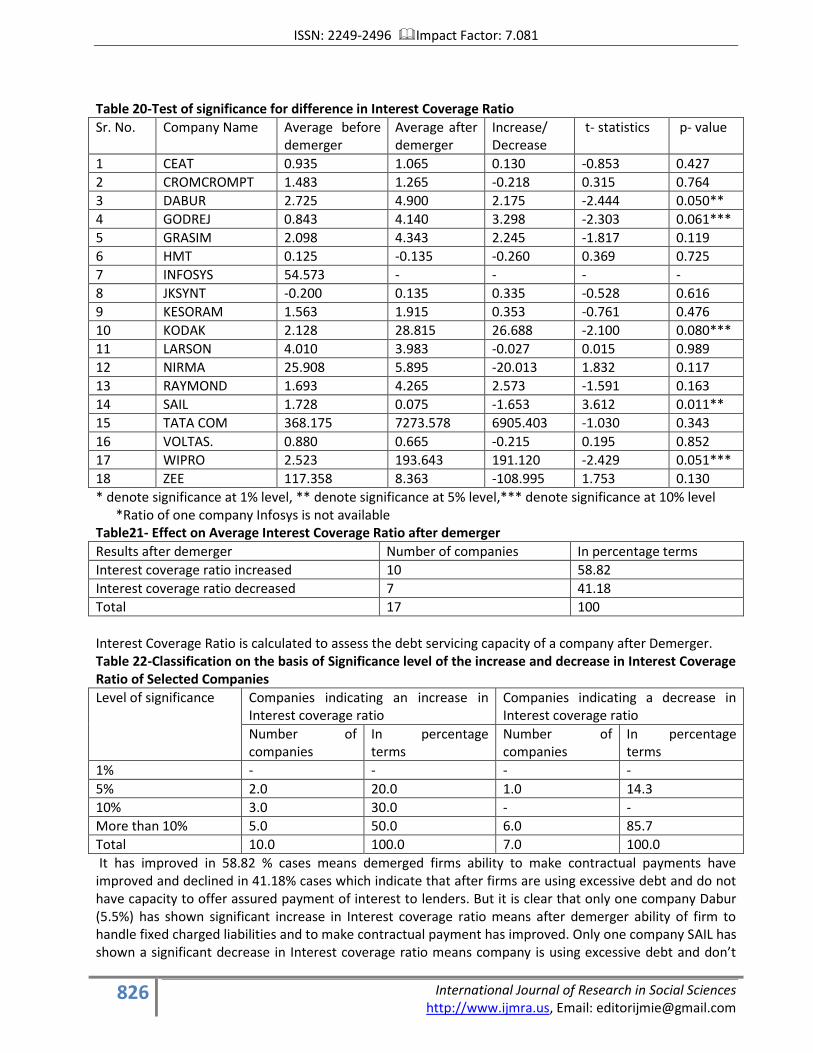
Table 20-Test of significance for difference in Interest Coverage Ratio
Sr. No. Company Name Average before demerger
Average after demerger
Increase/ Decrease
t- statistics p- value
1 CEAT 0.935 1.065 0.130 -0.853 0.427
2 CROMCROMPT 1.483 1.265 -0.218 0.315 0.764
3 DABUR 2.725 4.900 2.175 -2.444 0.050**
4 GODREJ 0.843 4.140 3.298 -2.303 0.061***
5 GRASIM 2.098 4.343 2.245 -1.817 0.119
6 HMT 0.125 -0.135 -0.260 0.369 0.725
7 INFOSYS 54.573 - - - -
8 JKSYNT -0.200 0.135 0.335 -0.528 0.616
9 KESORAM 1.563 1.915 0.353 -0.761 0.476
10 KODAK 2.128 28.815 26.688 -2.100 0.080***
11 LARSON 4.010 3.983 -0.027 0.015 0.989
12 NIRMA 25.908 5.895 -20.013 1.832 0.117
13 RAYMOND 1.693 4.265 2.573 -1.591 0.163
14 SAIL 1.728 0.075 -1.653 3.612 0.011**
15 TATA COM 368.175 7273.578 6905.403 -1.030 0.343
16 VOLTAS. 0.880 0.665 -0.215 0.195 0.852
17 WIPRO 2.523 193.643 191.120 -2.429 0.051***
18 ZEE 117.358 8.363 -108.995 1.753 0.130
* denote significance at 1% level, ** denote significance at 5% level,*** denote significance at 10% level *Ratio of one company Infosys is not available Table21- Effect on Average Interest Coverage Ratio after demerger
Results after demerger Number of companies In percentage terms
Interest coverage ratio increased 10 58.82
Interest coverage ratio decreased 7 41.18
Total 17 100
Interest Coverage Ratio is calculated to assess the debt servicing capacity of a company after Demerger. Table 22-Classification on the basis of Significance level of the increase and decrease in Interest Coverage Ratio of Selected Companies
Level of significance Companies indicating an increase in Interest coverage ratio
Companies indicating a decrease in Interest coverage ratio
Number of companies
In percentage terms
Number of companies
In percentage terms
1% - - - -
5% 2.0 20.0 1.0 14.3
10% 3.0 30.0 - -
More than 10% 5.0 50.0 6.0 85.7
Total 10.0 100.0 7.0 100.0
It has improved in 58.82 % cases means demerged firms ability to make contractual payments have improved and declined in 41.18% cases which indicate that after firms are using excessive debt and do not have capacity to offer assured payment of interest to lenders. But it is clear that only one company Dabur (5.5%) has shown significant increase in Interest coverage ratio means after demerger ability of firm to handle fixed charged liabilities and to make contractual payment has improved. Only one company SAIL has shown a significant decrease in Interest coverage ratio means company is using excessive debt and don’t
ISSN: 2249-2496 Impact Factor: 7.081
827 International Journal of Research in Social Sciences http://www.ijmra.us, Email: [email protected]
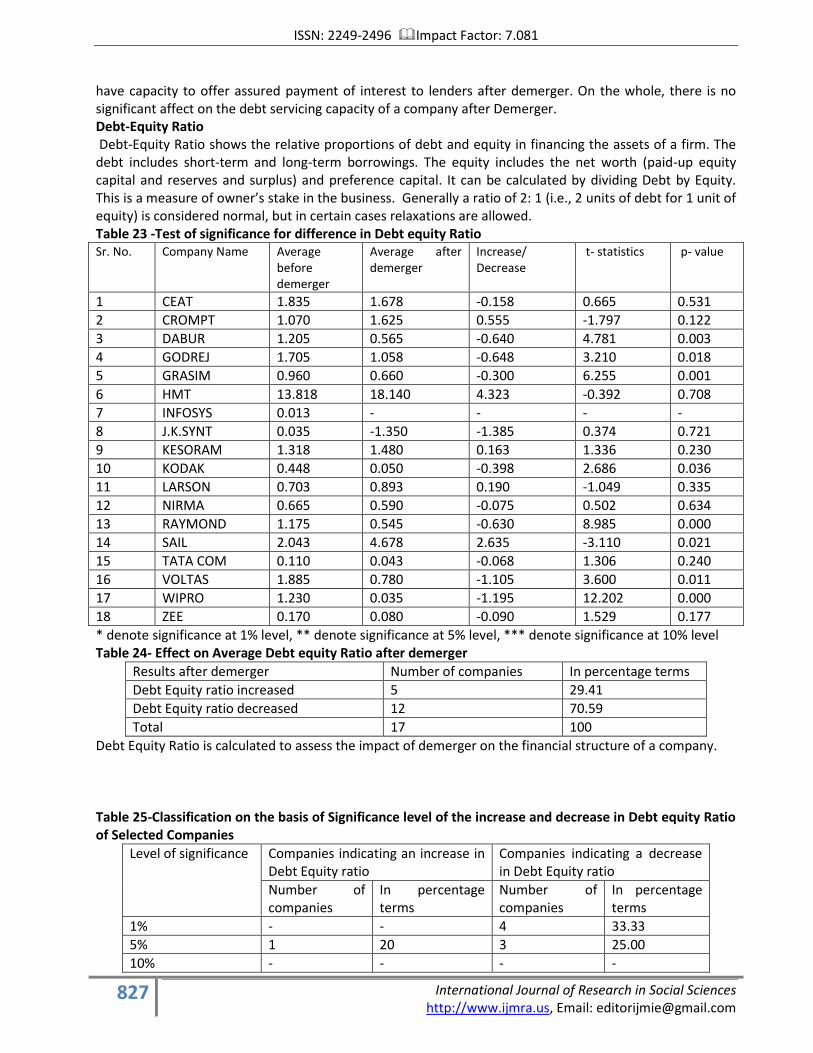
have capacity to offer assured payment of interest to lenders after demerger. On the whole, there is no significant affect on the debt servicing capacity of a company after Demerger. Debt-Equity Ratio Debt-Equity Ratio shows the relative proportions of debt and equity in financing the assets of a firm. The debt includes short-term and long-term borrowings. The equity includes the net worth (paid-up equity capital and reserves and surplus) and preference capital. It can be calculated by dividing Debt by Equity. This is a measure of owner’s stake in the business. Generally a ratio of 2: 1 (i.e., 2 units of debt for 1 unit of equity) is considered normal, but in certain cases relaxations are allowed. Table 23 -Test of significance for difference in Debt equity Ratio Sr. No. Company Name Average
before demerger
Average after demerger
Increase/ Decrease
t- statistics p- value
1 CEAT 1.835 1.678 -0.158 0.665 0.531
2 CROMPT 1.070 1.625 0.555 -1.797 0.122
3 DABUR 1.205 0.565 -0.640 4.781 0.003
4 GODREJ 1.705 1.058 -0.648 3.210 0.018
5 GRASIM 0.960 0.660 -0.300 6.255 0.001
6 HMT 13.818 18.140 4.323 -0.392 0.708
7 INFOSYS 0.013 - - - -
8 J.K.SYNT 0.035 -1.350 -1.385 0.374 0.721
9 KESORAM 1.318 1.480 0.163 1.336 0.230
10 KODAK 0.448 0.050 -0.398 2.686 0.036
11 LARSON 0.703 0.893 0.190 -1.049 0.335
12 NIRMA 0.665 0.590 -0.075 0.502 0.634
13 RAYMOND 1.175 0.545 -0.630 8.985 0.000
14 SAIL 2.043 4.678 2.635 -3.110 0.021
15 TATA COM 0.110 0.043 -0.068 1.306 0.240
16 VOLTAS 1.885 0.780 -1.105 3.600 0.011
17 WIPRO 1.230 0.035 -1.195 12.202 0.000
18 ZEE 0.170 0.080 -0.090 1.529 0.177
* denote significance at 1% level, ** denote significance at 5% level, *** denote significance at 10% level Table 24- Effect on Average Debt equity Ratio after demerger
Results after demerger Number of companies In percentage terms
Debt Equity ratio increased 5 29.41
Debt Equity ratio decreased 12 70.59
Total 17 100
Debt Equity Ratio is calculated to assess the impact of demerger on the financial structure of a company. Table 25-Classification on the basis of Significance level of the increase and decrease in Debt equity Ratio of Selected Companies
Level of significance Companies indicating an increase in Debt Equity ratio
Companies indicating a decrease in Debt Equity ratio
Number of companies
In percentage terms
Number of companies
In percentage terms
1% - - 4 33.33
5% 1 20 3 25.00
10% - - - -

ISSN: 2249-2496 Impact Factor: 7.081
828 International Journal of Research in Social Sciences http://www.ijmra.us, Email: [email protected]
More than 10% 4 80 5 41.67
Total 5 100 12 100
It is observed that 29.41% demerged companies owners are putting relatively less money of their own. It is a danger signal for creditors. After demerger debt equity ratio has shown significant increase in only one company (5.5%) SAIL In SAIL claim of creditor has increased after demerger. It indicates that companies are depending more on outsider funds to finance its expending activities. This confirms that leverage imbalances have increased in post demerger period, which is risky from creditor’s point of view. The ratio of 7 companies (39%) out of eighteen companies has declined which is statistically significant at 1% level of significance in the post demerger period. It is beneficial from creditors, shareholders and creditor’s point of view. These companies are Dabur, Godrej, Grasim, Kodak, Raymond, Voltas and Wipro. PROFITABILITY RATIOS While valuing the efficiency and worth of companies, we need to know the return that a company is able to earn on its capital, namely its equity plus debt. A company that earns a higher return on the capital it employs is more valuable than one which earns a lower return on its capital. The tools for measuring these returns are: Return on Capital Employed (ROCE) Return on Capital Employed thus reflects the overall earnings performance and operational efficiency of a company's business. It is an important basic ratio that permits an investor to make inter-company comparisons. Return on Capital Employed is valuable financial ratio for evaluating a company's efficiency and the quality of its management. The operating profit of a company is a better indicator of the profits earned by it than is the net profit. ROCE indicates the efficiency with which the long-term funds of a firm are utilized. Table 26-Test of Significance for difference in Return on Capital Employed Ratio
Sr. No.
Company Name Average before demerger
Average after demerger
Increase/ Decrease
t- statistics
p- value
1 CEAT -00.960 0.300 1.260 -0.587 0.579
2 CROMP 05.333 -1.018 -6.350 1.087 0.319
3 DABUR 14.858 15.378 0.520 -0.323 0.757
4 GODREJ -01.780 8.773 10.553 -2.898 0.027
5 GRASIM 06.325 8.648 2.323 -0.938 0.384
6 HMT -20.733 -79.970 -59.238 0.826 0.440
7 INFOSYS 36.315 45.265 8.950 -1.755 0.130
8 JKSYNT -26.913 197.663 224.575 -0.993 0.359
9 KESORAM 04.978 6.250 1.273 -0.490 0.642
10 KODAK -04.803 11.173 15.975 -1.476 0.190
11 LARSON 09.555 7.530 -2.025 0.842 0.432
12 NIRMA 25.300 12.478 -12.823 4.267 0.005
13 RAYMOND 05.720 5.990 0.270 -0.081 0.938
14 SAIL 04.015 -10.198 -14.213 3.951 0.008
15 TATA COM 27.990 19.608 -8.383 2.025 0.089
16 VOLTAS -02.285 -5.753 -3.468 0.491 0.641
17 WIPRO 19.555 41.430 21.875 -3.718 0.010
18 ZEE 35.480 3.063 -32.418 18.246 0.000
* denote significance at 1% level, ** denote significance at 5% level, *** denote significance at 10% level

ISSN: 2249-2496 Impact Factor: 7.081
829 International Journal of Research in Social Sciences http://www.ijmra.us, Email: [email protected]
Table 27- Effect on Average Return on Capital Employed Ratio after demerger
Results after demerger Number of companies In percentage terms (%)
ROCE ratio increased 10 55.56
ROCE ratio decreased 8 44.44
Total 18 100
Table 28 -Classification on the basis of Significance level of the increase and decrease in Return on Capital Employed Ratio of Selected Companies
Level of significance Companies indicating an increase in ROCE ratio
Companies indicating a decrease in ROCE ratio
Number of companies
In percentage terms
Number of companies
In percentage terms
1% 1.0 10.0 3.0 37.5
5% 1.0 10.0 - -
10% - - 1.0 12.5
More than 10% 8.0 80.0 4.0 50.0
Total 10.0 100.0 8.0 100.0
The impact of demerger on the profitability related to sources of long term funds of a company has been assessed by measuring Return on Capital Employed Ratio. It is observed that in 55.56% demerged company’s long term funds of owners and lenders (Capital employed) are used efficiently after demerger. In 44.44% companies Capital employed is not used efficiently. The impact of demerger on the profitability related to sources of long term funds of a company has been assessed by measuring Return on Capital Employed Ratio. Return on Capital Employed is to test the profitability related to sources of long term funds. Only two companies have shown significant increase in ROCE means long term funds of owners and lenders (Capital employed) are used efficiently after demerger. These companies are Wipro and Godrej. It is clear from the tables only 3 companies have shown significant decrease in ROCE means capital employed is not used efficiently after demerger. These companies are Nirma, SAIL and Zee. Return on Net Worth Return on net worth (RONW) is defined as Profit after Tax divided by net worth. It is a basic ratio that tells a shareholder what he is getting out of his investment in the company. It determines earning power of equity capital and corresponds more closely to the shareholders’ value maximization hypothesis. It is comparable across time (pre-and post-demerger time of eight years) The impact of demerger on the return of the shareholders of a company has been assessed by measuring Return on Net worth Ratio. Table 29- Test of significance for difference in Return on Net worth Ratio
Sr. No.
Company Name Average before demerger
Average after demerger
Increase/ Decrease
t- statistics
p- value
1 CEAT -1.370 0.298 1.668 -0.673 0.526
2 CROMPT 7.145 -3.570 -10.715 1.102 0.313
3 DABUR 21.463 21.308 -0.155 0.067 0.948
4 GODREJ -3.483 13.300 16.783 -2.887 0.028**
5 GRASIM 10.895 13.555 2.660 -0.679 0.522
6 HMT -154.933 58.518 213.450 -2.489 0.047**
7 INFOSYS 37.038 45.265 8.228 -1.705 0.139
8 JKSYNT 5.520 13.813 8.293 -0.115 0.913
9 KESORAM 10.715 10.143 -0.573 0.103 0.921
10 KODAK -6.305 12.293 18.598 -1.385 0.215
11 LARSON 13.288 10.348 -2.940 1.403 0.210
12 NIRMA 34.198 17.738 -16.460 4.892 0.003*
ISSN: 2249-2496 Impact Factor: 7.081
830 International Journal of Research in Social Sciences http://www.ijmra.us, Email: [email protected]
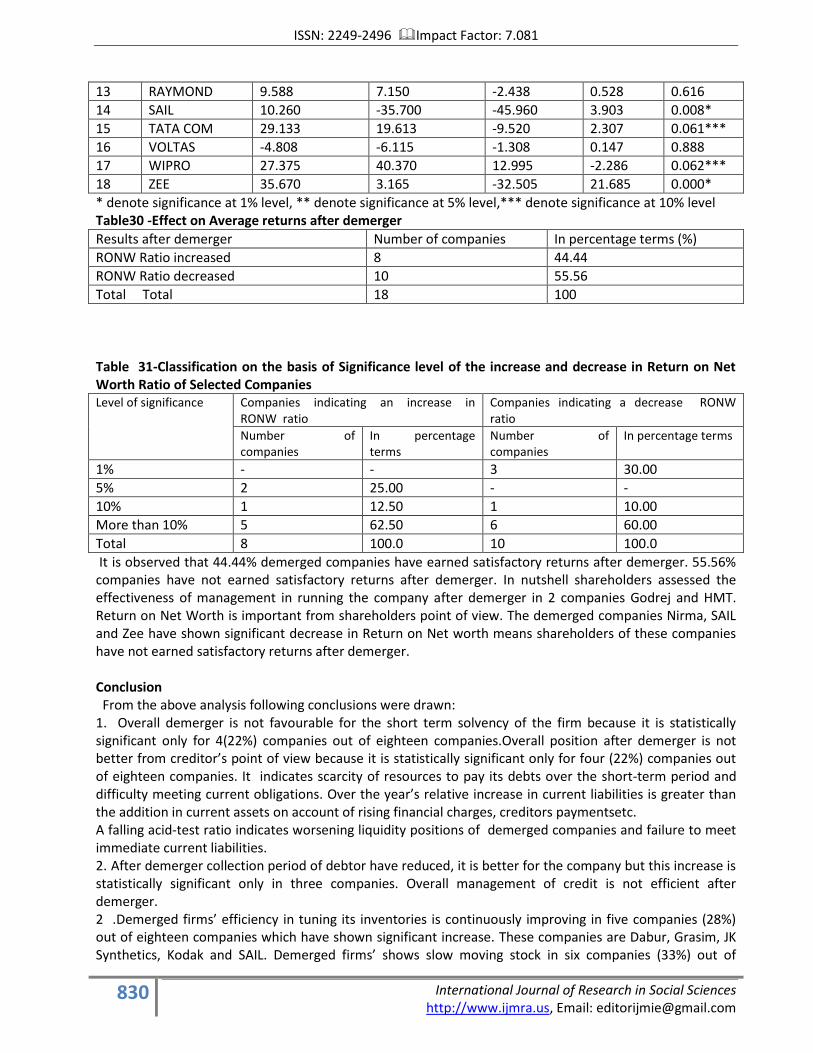
13 RAYMOND 9.588 7.150 -2.438 0.528 0.616
14 SAIL 10.260 -35.700 -45.960 3.903 0.008*
15 TATA COM 29.133 19.613 -9.520 2.307 0.061***
16 VOLTAS -4.808 -6.115 -1.308 0.147 0.888
17 WIPRO 27.375 40.370 12.995 -2.286 0.062***
18 ZEE 35.670 3.165 -32.505 21.685 0.000*
* denote significance at 1% level, ** denote significance at 5% level,*** denote significance at 10% level Table30 -Effect on Average returns after demerger
Results after demerger Number of companies In percentage terms (%)
RONW Ratio increased 8 44.44
RONW Ratio decreased 10 55.56
Total Total 18 100
Table 31-Classification on the basis of Significance level of the increase and decrease in Return on Net Worth Ratio of Selected Companies Level of significance Companies indicating an increase in
RONW ratio Companies indicating a decrease RONW ratio
Number of companies
In percentage terms
Number of companies
In percentage terms
1% - - 3 30.00
5% 2 25.00 - -
10% 1 12.50 1 10.00
More than 10% 5 62.50 6 60.00
Total 8 100.0 10 100.0
It is observed that 44.44% demerged companies have earned satisfactory returns after demerger. 55.56% companies have not earned satisfactory returns after demerger. In nutshell shareholders assessed the effectiveness of management in running the company after demerger in 2 companies Godrej and HMT. Return on Net Worth is important from shareholders point of view. The demerged companies Nirma, SAIL and Zee have shown significant decrease in Return on Net worth means shareholders of these companies have not earned satisfactory returns after demerger. Conclusion From the above analysis following conclusions were drawn: 1. Overall demerger is not favourable for the short term solvency of the firm because it is statistically significant only for 4(22%) companies out of eighteen companies.Overall position after demerger is not better from creditor’s point of view because it is statistically significant only for four (22%) companies out of eighteen companies. It indicates scarcity of resources to pay its debts over the short-term period and difficulty meeting current obligations. Over the year’s relative increase in current liabilities is greater than the addition in current assets on account of rising financial charges, creditors paymentsetc. A falling acid-test ratio indicates worsening liquidity positions of demerged companies and failure to meet immediate current liabilities. 2. After demerger collection period of debtor have reduced, it is better for the company but this increase is statistically significant only in three companies. Overall management of credit is not efficient after demerger. 2 .Demerged firms’ efficiency in tuning its inventories is continuously improving in five companies (28%) out of eighteen companies which have shown significant increase. These companies are Dabur, Grasim, JK Synthetics, Kodak and SAIL. Demerged firms’ shows slow moving stock in six companies (33%) out of
ISSN: 2249-2496 Impact Factor: 7.081
831 International Journal of Research in Social Sciences http://www.ijmra.us, Email: [email protected]
eighteen companies which have shown significant decrease. These companies are HMT, Larson, SAIL, TATA COM, Voltas and Zee. 3. The six demerged companies out of 18 companies which have shown significant decrease are HMT, Larson, Raymond, Voltas, Tata Com and Zee entertainment Enterprises Ltd. To conclude, it is observed that after demerger in 28% cases assets are efficiency utilized means assets are efficiently utilized for generating sales and declined in 33% cases which shows assets are not utilized efficiently. Only one company Dabur has shown significant increase in working capital turnover ratio means after demerger this company is utilizing working capital efficiently. Only one company SAIL has shown a significant decrease in working capital turnover ratio means working capital is not utilized properly after demerger. 3. It has improved in 58.82 % cases means demerged firms ability to make contractual payments have improved and declined in 41.18% cases which indicate that after firms are using excessive debt and do not have capacity to offer assured payment of interest to lenders. But it is clear that only one company Dabur (5.5%) has shown significant increase in Interest coverage ratio means after demerger ability of firm to handle fixed charged liabilities and to make contractual payment has improved. Only one company SAIL has shown a significant decrease in Interest coverage ratio means company is using excessive debt and don’t have capacity to offer assured payment of interest to lenders after demerger. On the whole, there is no significant affect on the debt servicing capacity of a company after Demerger. 4.It is observed that 29.41% demerged companies owners are putting relatively less money of their own. It
is a danger signal for creditors. Over the years the debt amount had increased on account of inefficient
borrowing policies and at the same time low operating probability contributed limited funds to service the
debt and amortization of the same. The analysis indicates that the claims of lenders are more than the
equity shareholders’ and their interests are not safe & they have to bear the probable futurelosses.
5. After demerger debt equity ratio has shown significant increase in only one company (5.5%) SAIL In SAIL
claim of creditor has increased after demerger. It indicates that companies are depending more on
outsider funds to finance its expending activities. This confirms that leverage imbalances have increased in
post demerger period, which is risky from creditor’s point of view. Over the years the debt amount had
increased because of inefficient borrowing policies. This analysis indicates that the claims of lenders are
more than the equity shareholders’ and their interests are not safe & they have to bear the probable
futurelosses.
6 The ratio of 7 companies (39%) out of eighteen companies has declined which is statistically significant at 1% level of significance in the post demerger period. It is beneficial from creditors, shareholders and creditor’s point of view. These companies are Dabur, Godrej, Grasim, Kodak, Raymond, Voltas and Wipro. 7.The impact of demerger on the profitability related to sources of long term funds of a company has been assessed by measuring Return on Capital Employed Ratio. Return on Capital Employed is to test the profitability related to sources of long term funds. Only two companies have shown significant increase in ROCE means long term funds of owners and lenders (Capital employed) are used efficiently after demerger. These companies are Wipro and Godrej. It is clear from the tables only 3 companies have shown significant decrease in ROCE means capital employed is not used efficiently after demerger. These companies are Nirma, SAIL and Zee. 8.It is observed that 44.44% demerged companies have earned satisfactory returns after demerger. 55.56% companies have not earned satisfactory returns after demerger. In nutshell shareholders assessed the effectiveness of management in running the company after demerger in 2 companies Godrej and HMT. Return on Net Worth is important from shareholders point of view. The demerged companies Nirma, SAIL and Zee have shown significant decrease in Return on Net worth means shareholders of these companies have not earned satisfactory returns after demerger.
ISSN: 2249-2496 Impact Factor: 7.081
832 International Journal of Research in Social Sciences http://www.ijmra.us, Email: [email protected]
References 1. Mohanty, P. (1999): Sources of Value Loss in Unrelated Corporate Diversification, paper
presented at the Third Capital Markets Conference held at UTI Institute 2. Mehrotra Vikas, Mikkelson Wayn, Partch Megan (2003): The Design of Financial Policies in
Corporate Spin-offs, The Review of Financial Studies, winter 2003; 16, 4; ABI/INFIRM Global pp 1359-1388.
3. Kohtamaki Marko, Kekale Tauno and Riitta Viitala (2004): Trust and Innovation: from Spin – Off Idea to Stock Exchange, Creativity and Innovation Management, Vol.13, Number 2 June, pp 75 – 86.
4. Kumar Rajesh (2004): Effect of RPL-RIL Merger on Shareholders’ Wealth and Corporate Performance, The ICFAI Journal of Applied Finance, September, pp 13-34.
5. Veld C and Veld Merkoulova Y V (2004): Do Spin- Offs Really Create Value? The European Case, Journal of Banking and Finance, Vol. 28, No. 5, May, pp 1111-1135.
6. Chang Saeyong and Hertzel Michael (2004): Equity Ownership and Firm Value: Evidence from Targeted Stock Repurchases The Financial Review 39, pp 389 – 407.
7. Mishra A.K. and Goel Rashmi (2005): Returns to Shareholders from Mergers: The Case of RIL and RPL Merger IMB Management Review, September pp 69 -79.
8. Malik K.Amit and Rakshit Dabdas (2006): Corporate Restructuringthrough Demerger: A Case Study, Journal of Finance India (December) Vol. XX No.4 pp 1321– 1338.
9. Nag G.C. (2006): Demerger: A Boon for Shareholders’ Market Value,Effective Executive, July, pp 63 -71.
10. Sudarsanam Sudi and Qian Binsheng (2007): Shareholder Value Gains from European Spinoffs: The Effect of Internal and External Control Mechanisms, JEL Classification: G 34, pp 1 – 47.
11. Unyong Pyo (2007) Enhancing Managerial Incentives and Value Creation: Evidence from Corporate Spinoffs Journal of Economics and Finance Vol.31, Number 3, pp 341 – 358.
12. Lundh Hampus (2007): Corporate Spinoffs: A Risk and Return Perspective, Bechelor Thesis in Finance, Jonkoping International Business School, January, pp 1-32.
13. Veld Chris and Veld Yulia V. & Merkoulova (2008): Value Creation through Spin-Offs: A Review of the Empirical Evidence, website ssrn.com, pp 1 – 28.
14. Ramakrishanan K (2008): Long term Post-Merger Performance of Firms in India, Vikalpa, Volume 33, No. 2, April-June, pp 47-62.
15. Anand Manoj and Singh Jagandeep (2008): Impact of Merger Announcement on Shareholders’ Wealth: Evidence from Indian Private Sector Banks, Vikalpa, Vol. 33, No. 1, January-March, pp 35-54.