post-harvest food losses estimation- development
TRANSCRIPT

1
POST-HARVEST FOOD LOSSES ESTIMATION- DEVELOPMENT OF
CONSISTENT METHODOLOGY
INTRODUCTION
Jaspreet Aulakh and Anita Regmi
Current world population is expected to reach 10.5 billion by 2050 (UN March, 2013),
further adding to global food security concerns. This increase translates into 33% more human
mouths to feed, with the greatest demand growth in the poor communities of the world.
According to Alexandratos and Bruinsma (2012), food supplies would need to increase by 60%
(estimated at 2005 food production levels) in order to meet the food demand in 2050. Food
availability and accessibility can be increased by increasing production, improving distribution,
and reducing the losses. Thus, reduction of post-harvest food losses is a critical component of
ensuring future global food security.
Food and Agriculture Organization of U.N. predicts that about 1.3 billion tons of food are
globally wasted or lost per year (Gustavasson, et al. 2011). Reduction in these losses would
increase the amount of food available for human consumption and enhance global food security,
a growing concern with rising food prices due to growing consumer demand, increasing demand
for biofuel and other industrial uses, and increased weather variability (Mundial, 2008; Trostle,
2010). A reduction in food also improves food security by increasing the real income for all the
consumers (World Bank, 2011). In addition, crop production contributes significant proportion
of typical incomes in certain regions of the world (70 percent in Sub-Saharan Africa) and
reducing food loss can directly increase the real incomes of the producers (World Bank, 2011).
Over the past decades, significant focus and resources have been allocated to increase
food production. For example, 95% of the research investments during the past 30 years were
reported to have focused on increasing productivity and only 5% directed towards reducing
losses (Kader 2005; Kader and Roller 2004; WFLO 2010). Increasing agricultural productivity
is critical for ensuring global food security, but this may not be sufficient. Food production is
currently being challenged by limited land, water and increased weather variability due to
climate change. To sustainably achieve the goals of food security, food availability needs to be
also increased through reductions in the post-harvest process at farm, retail and consumer levels.
Food losses do not merely reduce food available for human consumption but also cause
negative externalities to society through costs of waste management, greenhouse gas production,
and loss of scarce resources used in their production. Food loss is estimated to be equivalent to 6-
10 percent of human-generated greenhouse gas emissions (Gustavasson, et al. 2011; Vermeulen,
et al. 2012). A significant contributor of this problem is through methane gas generation in
landfills where food waste decomposes anaerobically (Buzby and Hyman, 2012). The US
Environmental Protection Agency reports that in the United States about 31 million MT of food

2
waste accounted for 14% of the 2008 solid waste produced in the country (EPA, 2011) costs
roughly 1.3 billion dollars to landfill (Schwab, 2010; Buzby and Hyman, 2012). This is cost to
the society through utilities bills and taxes.
A study by Institute of Mechanical Engineers indicates that that current agricultural
practices use 4.9 Gha (global hectares or 4931 million hectares) of the total 14.8 Gha (14894
million hectares) of land surface on the earth (Fox and Fimeche, 2013). Agricultural production
in addition uses 2.5 trillion m3
of water per year and over 3% of the total global energy
consumption (Fox and Fimeche, 2013). With estimated food losses of about 30-50 % of total
production, this translates to wasting 1.47-1.96 Gha of arable land, 0.75-1.25 trillion m3 of water
and 1% to 1.5% of global energy (Fox and Fimeche, 2013).
Given the significant role food loss reductions could have toward sustainably
contributing to global food security, it is important to have reliable measures of these losses.
Unfortunately, most of the available postharvest loss and food waste estimates are based on the
anecdotal stories with few actual measured or estimated numbers. Moreover these numbers, in
turn, feed into estimates of food availability which are widely used in food security assessments
and policy analyses. For example, FAO’s Food Balance Sheet provides data for most food
security and consumption analyses across the world (http://faostat.fao.org/site/354/default.aspx)
and presents a comprehensive picture of a country's food supply during a specified reference
period. Food supply available for human consumption is obtained by deducting from total
supplies the quantities exported, fed to livestock, used for seed, and losses during storage and
transportation. The food loss estimate in the Balance Sheet is currently calculated using an ad
hoc methodology. A robust accounting of food losses which is updated regularly will improve
the overall data in the Food Balance Sheet and provide more reliable information for analyses
and policy making.
In light of this need, this paper illustrates a conceptual model which will support the
development of a template for estimating the post-harvest losses in different staple crops. This
paper is divided into four main sections- the first section defines food loss and food waste, the
second section discusses the factors responsible for the current food loss situation in different
parts of world, and the third section talks about measurement problems, and existing
methodologies. The final section of this paper proposes a conceptual model that aims at
strengthening future PHL estimates.
FOOD LOSSES AND FOOD WASTE
Post-harvest Food Loss (PHL) is defined as measurable qualitative and quantitative
food loss along the supply chain, starting at the time of harvest till its consumption or other end
uses (De Lucia and Assennato,1994; Hodges, Buzby and Bennett, 2011). PHLs can occur either
due to food waste or due to inadvertent losses along the way. Thus, food waste is the loss of
edible food due to human action or inaction such as throwing away wilted produce, not

3
consuming available food before its expiry date, or taking serving sizes beyond’s one’s ability to
consume. Food loss on the other hand, is the inadvertent loss in food quantity because of
infrastructure and management limitations of a given food value chain. Food losses can either be
the result of a direct quantitative loss or arise indirectly due to qualitative loss. Food loss and
food waste add to contribute to post-harvest food losses as presented in Figure 1.
Food losses can be quantitative as measured by decreased weight or volume, or can be
qualitative, such as reduced nutrient value and unwanted changes to taste, color, texture, or
cosmetic features of food (Buzby and Hyman, 2012). Quantitative food loss can be defined as
reduction in weight of edible grain or food available for human consumption. The quantitative
loss is caused by the reduction in weight due to factors such as spillage, consumption by pest and
also due to physical changes in temperature, moisture content and chemical changes (FAO,
1980). This definition is unsatisfactory since food grains undergo reduction in weight due to
drying, a necessary postharvest process for all grains (FAO, 1980). Although this process
involves considerable reduction in weight, there is no loss of food value, and therefore, should
not be counted as loss. Therefore our analysis will only consider quantitative losses due to
spillage and other unintended losses along the supply chain rather than intentional weight loss
through drying or other processing.
The qualitative loss can occur due to incidence of insect pest, mites, rodents and birds, or
from handling, physical changes or chemical changes in fat, carbohydrates and protein, and by
contamination of mycotoxins, pesticide residues, insect fragments, or excreta of rodents and
birds and their dead bodies. When this qualitative deterioration makes food unfit for human
consumption and is rejected, this contributes to food loss.
Food waste, as earlier mentioned, is a subset or sub-category of the food losses (Buzby,
and Hyman, 2012). According to Buzby and Hyman, Bloom (2010), food waste occurs when the
an edible food item goes unutilized as a result of human action or inaction and is often the result
of a decision made farm-to-fork by businesses, governments, and farmers (Buzby and Hyman,
2012). The definitions of food waste and food losses are not consistent worldwide. For e.g.,
Buzby, and Hyman, 2012, report that Dutch Ministry of Economic Affairs, Agriculture, and
Innovation defines food waste to include quality considerations and residual and waste flows in
addition to the food loss (Waarts et al., 2011). Wastes & Resources Action Programme (WRAP)
final report in 2009 defines waste as ‘any substance or object which the holder discards or
intends or is required to discard’ (Quested and Johnson, 2009). Different studies use appropriate
definitions for their needs.

4
Fig. 1. Post-harvest food loss components.
FACTORS CONTRIBUTING TO TOTAL FOOD LOSS
Factors that contribute to food loss range from mechanization of practices such as
harvesting to handling, processing and others, to weather conditions, production practices,
management decisions, transportation facilities, grading issues, infrastructure, consumer
preferences/attitudes, and availability of financial markets. A typical post-harvest chain
comprises of a number of stages for the movement of harvested output from the field to the final
retail market. The losses incurred at each step vary depending upon the organization and
technologies used in the food supply chain. For example, in less developed countries where the
supply chain is less mechanized, larger losses are incurred during drying, storage, processing and
in transportation (Fig. 2).
5
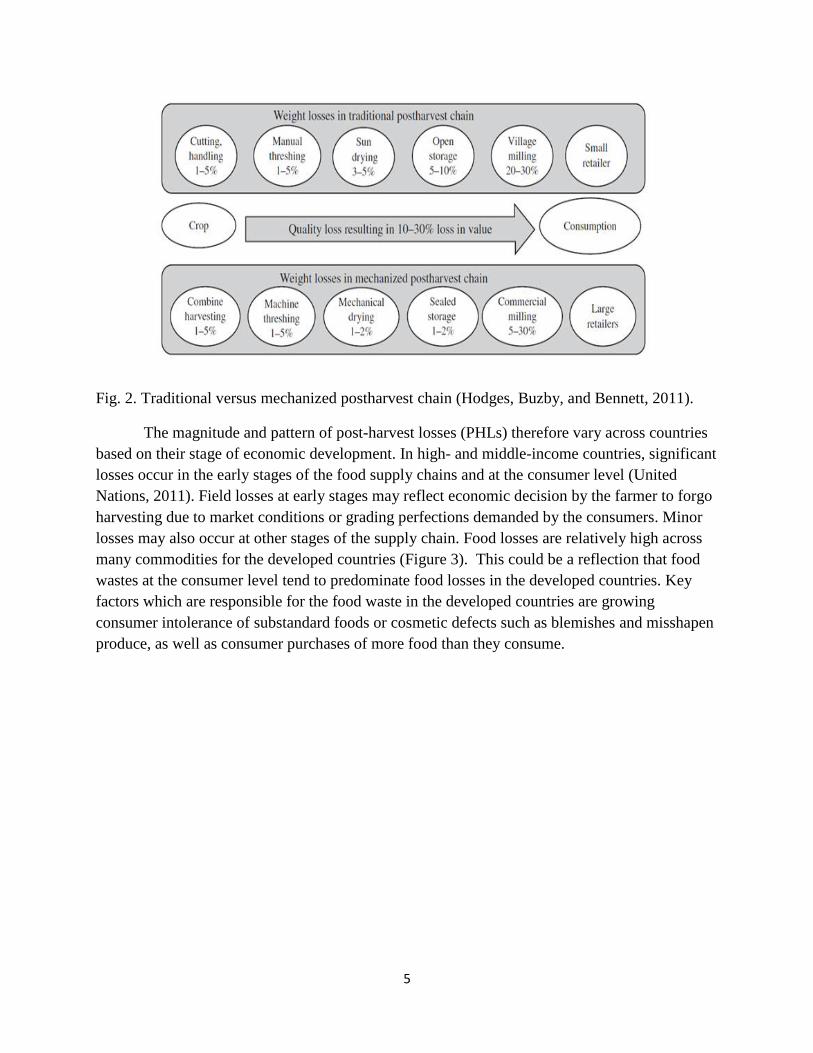
Fig. 2. Traditional versus mechanized postharvest chain (Hodges, Buzby, and Bennett, 2011).
The magnitude and pattern of post-harvest losses (PHLs) therefore vary across countries
based on their stage of economic development. In high- and middle-income countries, significant
losses occur in the early stages of the food supply chains and at the consumer level (United
Nations, 2011). Field losses at early stages may reflect economic decision by the farmer to forgo
harvesting due to market conditions or grading perfections demanded by the consumers. Minor
losses may also occur at other stages of the supply chain. Food losses are relatively high across
many commodities for the developed countries (Figure 3). This could be a reflection that food
wastes at the consumer level tend to predominate food losses in the developed countries. Key
factors which are responsible for the food waste in the developed countries are growing
consumer intolerance of substandard foods or cosmetic defects such as blemishes and misshapen
produce, as well as consumer purchases of more food than they consume.
6
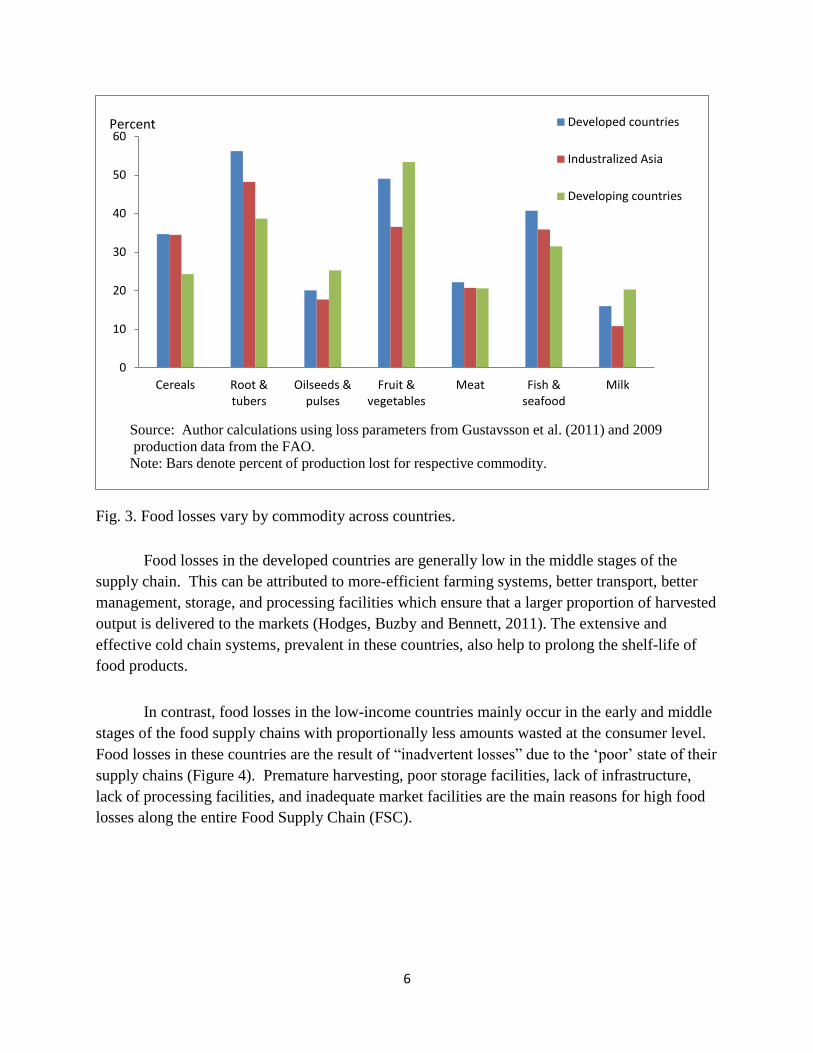
Fig. 3. Food losses vary by commodity across countries.
Food losses in the developed countries are generally low in the middle stages of the
supply chain. This can be attributed to more-efficient farming systems, better transport, better
management, storage, and processing facilities which ensure that a larger proportion of harvested
output is delivered to the markets (Hodges, Buzby and Bennett, 2011). The extensive and
effective cold chain systems, prevalent in these countries, also help to prolong the shelf-life of
food products.
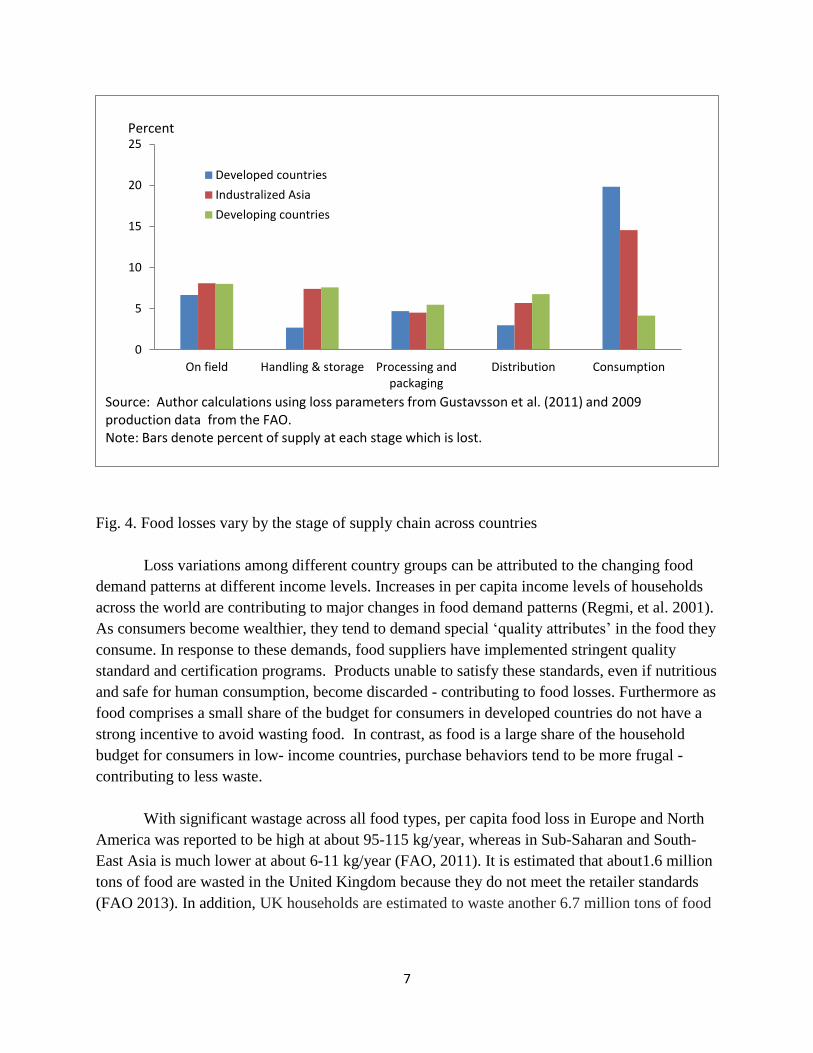
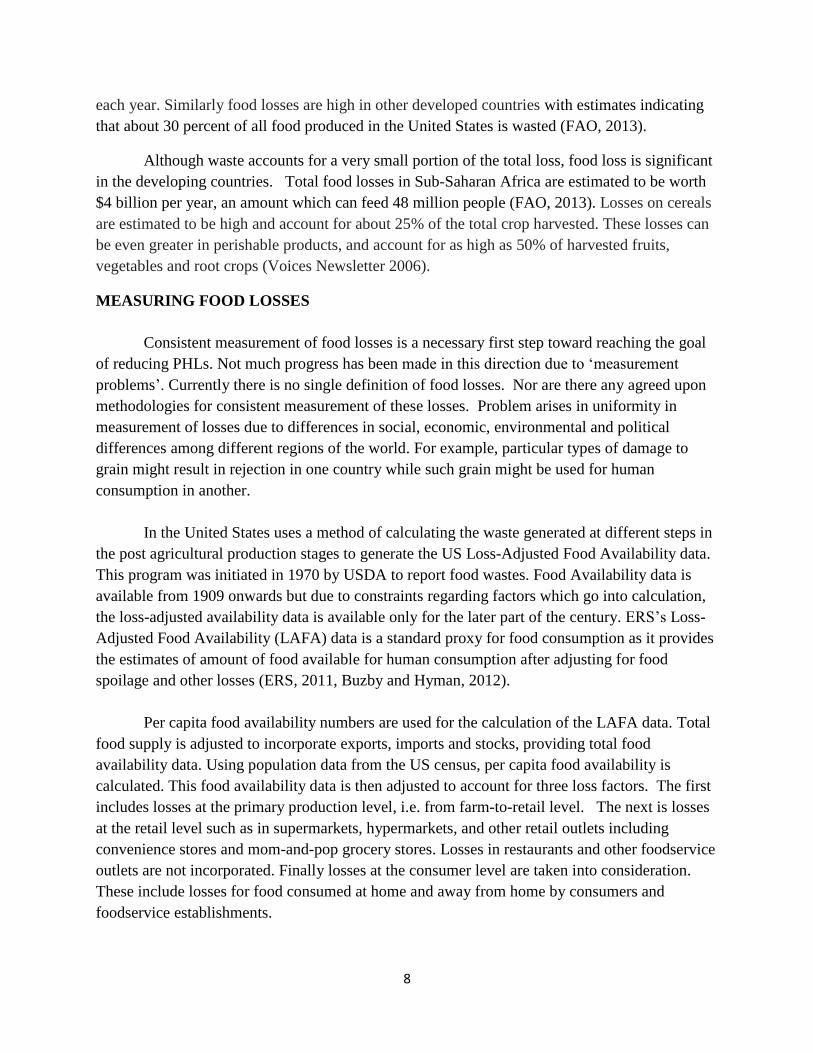
In contrast, food losses in the low-income countries mainly occur in the early and middle
stages of the food supply chains with proportionally less amounts wasted at the consumer level.
Food losses in these countries are the result of “inadvertent losses” due to the ‘poor’ state of their
supply chains (Figure 4). Premature harvesting, poor storage facilities, lack of infrastructure,
lack of processing facilities, and inadequate market facilities are the main reasons for high food
losses along the entire Food Supply Chain (FSC).
0
10
20
30
40
50
60
Cereals Root &tubers
Oilseeds &pulses
Fruit &vegetables
Meat Fish &seafood
Milk
Developed countries
Industralized Asia
Developing countries
Percent
Source: Author calculations using loss parameters from Gustavsson et al. (2011) and 2009
production data from the FAO.
Note: Bars denote percent of production lost for respective commodity.
7
Fig. 4. Food losses vary by the stage of supply chain across countries
Loss variations among different country groups can be attributed to the changing food
demand patterns at different income levels. Increases in per capita income levels of households
across the world are contributing to major changes in food demand patterns (Regmi, et al. 2001).
As consumers become wealthier, they tend to demand special ‘quality attributes’ in the food they
consume. In response to these demands, food suppliers have implemented stringent quality
standard and certification programs. Products unable to satisfy these standards, even if nutritious
and safe for human consumption, become discarded - contributing to food losses. Furthermore as
food comprises a small share of the budget for consumers in developed countries do not have a
strong incentive to avoid wasting food. In contrast, as food is a large share of the household
budget for consumers in low- income countries, purchase behaviors tend to be more frugal -
contributing to less waste.
With significant wastage across all food types, per capita food loss in Europe and North
America was reported to be high at about 95-115 kg/year, whereas in Sub-Saharan and South-
East Asia is much lower at about 6-11 kg/year (FAO, 2011). It is estimated that about1.6 million
tons of food are wasted in the United Kingdom because they do not meet the retailer standards
(FAO 2013). In addition, UK households are estimated to waste another 6.7 million tons of food
0
5
10
15
20
25
On field Handling & storage Processing andpackaging
Distribution Consumption
Developed countries
Industralized Asia
Developing countries
Percent
Source: Author calculations using loss parameters from Gustavsson et al. (2011) and 2009 production data from the FAO. Note: Bars denote percent of supply at each stage which is lost.
8
each year. Similarly food losses are high in other developed countries with estimates indicating
that about 30 percent of all food produced in the United States is wasted (FAO, 2013).
Although waste accounts for a very small portion of the total loss, food loss is significant
in the developing countries. Total food losses in Sub-Saharan Africa are estimated to be worth
$4 billion per year, an amount which can feed 48 million people (FAO, 2013). Losses on cereals
are estimated to be high and account for about 25% of the total crop harvested. These losses can
be even greater in perishable products, and account for as high as 50% of harvested fruits,
vegetables and root crops (Voices Newsletter 2006).
MEASURING FOOD LOSSES
Consistent measurement of food losses is a necessary first step toward reaching the goal
of reducing PHLs. Not much progress has been made in this direction due to ‘measurement
problems’. Currently there is no single definition of food losses. Nor are there any agreed upon
methodologies for consistent measurement of these losses. Problem arises in uniformity in
measurement of losses due to differences in social, economic, environmental and political
differences among different regions of the world. For example, particular types of damage to
grain might result in rejection in one country while such grain might be used for human
consumption in another.
In the United States uses a method of calculating the waste generated at different steps in
the post agricultural production stages to generate the US Loss-Adjusted Food Availability data.
This program was initiated in 1970 by USDA to report food wastes. Food Availability data is
available from 1909 onwards but due to constraints regarding factors which go into calculation,
the loss-adjusted availability data is available only for the later part of the century. ERS’s Loss-
Adjusted Food Availability (LAFA) data is a standard proxy for food consumption as it provides
the estimates of amount of food available for human consumption after adjusting for food
spoilage and other losses (ERS, 2011, Buzby and Hyman, 2012).
Per capita food availability numbers are used for the calculation of the LAFA data. Total
food supply is adjusted to incorporate exports, imports and stocks, providing total food
availability data. Using population data from the US census, per capita food availability is
calculated. This food availability data is then adjusted to account for three loss factors. The first
includes losses at the primary production level, i.e. from farm-to-retail level. The next is losses
at the retail level such as in supermarkets, hypermarkets, and other retail outlets including
convenience stores and mom-and-pop grocery stores. Losses in restaurants and other foodservice
outlets are not incorporated. Finally losses at the consumer level are taken into consideration.
These include losses for food consumed at home and away from home by consumers and
foodservice establishments.

9
Food losses at the consumer level can arise because of “nonedible share” of a food, such
as asparagus stalk or apple core. These data are obtained from the National Nutrient Database for
Standard Reference, compiled by USDA’s Agricultural Research Service (ARS, 2008; Buzby
and Hyman, 2012). Food loss can be the result of plate waste from the edible share such as loss
while cooking or loss from uneaten food.
FAO’s Food Balance Sheet data calculates per capita food availability for all countries
for which they have data based on a methodology similar to USDA’s. To obtain food
availability, postharvest losses, feed, and food destined for industrial uses are deducted from total
food supply, which includes production adjusted for net trade and stocks. FAO’s estimates of
postharvest losses which enter food availability calculation, unfortunately, are not based on a
robust methodology. Development of a consistent methodology to estimate postharvest losses
will greatly benefit FAO’s efforts in this area.
Another issue to consider in determining a consistent methodology for measuring and
estimating postharvest losses is the role of food processing. Processing can lead to a reduction in
food weight; however, this loss is not automatically a postharvest loss. In processing, a part of
grain is transformed to a by-product, for e.g. in the case of rice and wheat milling a part of the
grain is lost with the separation of the bran. But this bran may be fed to livestock and thus is
usually utilized elsewhere in the food industry. Similarly, broken grains maybe sold in the
market place, but at cheaper rates. Thus, they are not direct food loss since they have alternative
uses, often at lower prices (FAO, 1980). Hence it is important to clearly define how postharvest
food losses will measured, and to the extent possible, make this definition be globally consistent.
PROPOSED STUDY TO ESTIMATE POSTHARVEST LOSSES
The objective of this study is to develop a consistent and comprehensive framework for
estimating PHL. Using this framework, a second phase of the research project will develop
econometric models with partners and collaborators to estimate PHLs for selected countries and
commodities. The ultimate goal of the project is to improve global food balance sheet data via
better estimates of PHLs. Ad hoc methods for calculating PHLs have been used in the past to
estimate food availability data. Poor PHL estimates impact the quality of food availability data
and other assessments based on that data. For example, food security assessments and other
analyses which consider projections of future food needs rely on food balance sheet information.
Thus, strengthening of PHLs database will help improve other estimations and projections which
rely on food balance sheets.

10
Review of Existing Methodologies and Gaps
Limited work has been conducted in the estimation of PHLs. Most of the published works
available on PHL estimation are FAO initiatives, based on surveys in the developing countries.
Other works include estimation methods such as Loss-Adjusted Data in the developed countries
with considerable inconsistencies in the entry data, and few independent country and commodity
specific studies. In the following section some of these published methodologies and their gaps
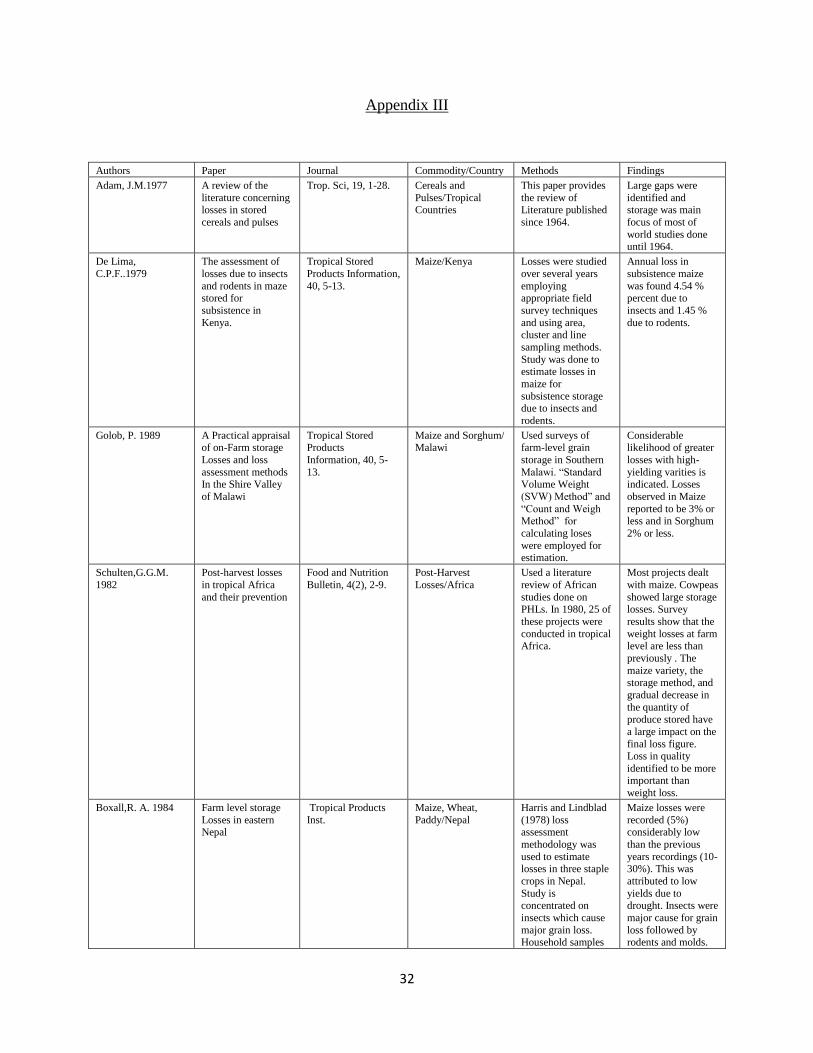
are discussed. Other important studies are listed in Appendix III of this paper. Some patterns are
highlighted towards the end of this section which emerged while reviewing these papers.
In designing studies to estimate PHL, the first challenge is to establish the procedure to
accurately measure weight loss which will be used to estimate total PHLs. The conventional
method for estimating losses in maize is to take the ratio of weights of discarded cobs over good
cobs (Compton, Floyd, Ofosu and Agbo, 1998). This method tends to underestimate the losses as
it does not account for partially-filled or partially-damaged cobs. Therefore, Compton et al.,
1998, proposed a modified count and weigh method (gravimetric method) to assess weight loss
in stored maize cobs (Compton, Floyd, Ofosu and Agbo, 1998). This method has also been
widely used by number of other studies done on maize in other parts of the world as listed in
Appendix III. Compton and Sherington (1998) further modify this approach to propose a new
method to estimate the weight loss due to insect pests in stored maize cobs in Ghana. They
highlight that most of the earlier assessment methods are relatively time-consuming and demand
specialized staff and equipment. The researchers in this study develop a scale system ranging
from 1-6 depending upon the damage to the cobs. Coefficients were established for each damage
class using a modification of the count and weight technique (Boxall, 1986; Compton and
Sherington, 1998).
For the estimation of the damage class coefficients in equation (1) to be used in this
method, samples were obtained from each of these six damage classes. The mean weight loss for
each damage class was used as a preliminary estimate of coefficient. Later they were further
adjusted after obtaining fit between visible percentage of grain loss (Visloss) and cob weight loss
(Wgtloss). Visloss was estimated using visual scale and weigh method and Wgtloss by modified
weight and count method, mentioned above. These coefficients were repeatedly adjusted within
reasonable ranges to give best visual fit between Visloss and Wgtloss. Then, total loss based on
the visual code method was estimated by the equation below.
(1)
Where: N1,…,N6 are the number of cobs in classes 1 to 6 in the sample, NT =total number of cobs
in the sample, and Visloss is estimated weight loss.
11
In the Visloss count method, individuals were assigned to score the cob samples
independently into different damage classes depending upon the photographs provided to them.
The study calculates the mean bias of visual estimates and the standard error for the estimates of
weight loss using visual scale equation. The bias was estimated for each sample within a batch as
the difference between predicted value using visual scales (Visloss) and the measured loss using
count and weigh method (Wghtloss). Only in one out of the five batches, this bias was
significant. However, the magnitude of the bias was very small (0.7%). Overall, post-harvest
weight loss estimations in the sample batches of this study conducted for maize in Ghana were in
range of 4.8%-21.5%.
Another study conducted in Punjab (India) provides an example of postharvest loss
estimation for a perishable product. The study was conducted for kinnow (citrus fruit) using
random sampling technique in the largest production region of the state in 2004-05 (Gangwar,
Singh and Singh, 2007). After selection of the region, four villages were randomly chosen and
the kinnow growers were grouped into three categories depending upon the size of their
orchards: (1) less than 2 ha; (ii) 2-5 ha; and (iii) above 5 ha. Data were gathered during the fruit
harvesting and marketing seasons through pre-tested questionnaire by personal interview
method. Simple averages and percentages were used to calculate the post-harvest losses at
different stages identified in the kinnow supply chain.
In the kinnow study, two methods of harvesting were adopted. The first method involves just
dropping them on the ground and the second one uses clippers, followed by the collection of
fruits in crates or bags. In the first method PHLs at the harvesting level were recorded to be
10.63 % compared to only 2.51 % in the second method. PHLs also varied depending upon the
distance to the market. When they are marketed to medium-distance markets, PHLs were 5.15%
whereas for long-distance markets they were 8.17 %. Overall losses were 14.47 % for the Delhi
market and 21.91% for the Bangalore market.
Basavaraja, Mahajanashetti, and Udagatti (2007) conducted a study to estimate PHLs on
cereals in the state of Karnataka (India). The study covered rice and wheat and was designed to
identify which stage of the post-harvest is responsible for the greatest loss (Appendix I ,
Basavaraja, Mahajanashetti and Udagatti, 2007). Survey data was collected from 100 farmers, 20
wholesalers, 20 processors and 20 retailers for the year 2003-04 (Appendix II). Linear
regression was used to examine the role of different factors affecting post-harvest losses in the
rice supply chain from the field to processors and sellers. The storage stage was identified as
contributing to the highest percentage weight losses along the entire supply chain. Losses at the
farm level were estimated at 3.82% for rice and 3.28% for wheat. Education level of farmers and
weather conditions also had significant impact on post-harvest losses.
The review of these past studies provides evidence that the measurement of post-harvest
losses (PHLs) can be time and labor consuming. There is not one practical option which can be
adopted to obtain more accurate measures of PHLs. Instead similar but improved experimental
12
studies could be used where the measured losses can then be regressed on a number of factors to
obtain parameters which can later be used for predicting losses. The idea behind this is to use
factors whose values are readily available or easily computable, such as preexisting indices
which denote the quality of supply chain, agro-climatic zone and other factors.
The second observation made while reviewing these studies is that the nature and incidence
of losses can significantly vary across commodities, particularly when comparing perishables
and non-perishables. For example, for similar farm, harvest and marketing situations, packaged
grains and citrus will likely incur different levels of losses during transportation. Therefore
distance to market may not be of importance to grains, but it becomes very important to
perishables in the developing countries.
Finally, as implied by the second observation, the critical stage in the supply chain where the
greatest magnitude of PHLs occurs differs across countries and commodities. In the Punjab
citrus case, two stages appear to be critical, harvesting and transportation. Significant losses
could be prevented by using harvesting techniques which prevent damage to the fruit. Similarly,
losses could also be minimized by either reducing the distance to markets, or likely by using
climate-controlled transportation with proper packaging of fruit. On the other hand, the
Karnataka study indicated that for cereals such as rice and wheat, 75% of the total PHLs occur at
farm level and 25 % at market level. Storage (33-35%) was the biggest contributor of these
losses along the entire supply chain.
Given the nature of PHLs, studies to date have not followed a consistent methodology.
There are a number of inconsistencies which exist among these studies which make the
comparisons among the measured estimates doubtful. The first inconsistency is that they report
the percentage loss of weight of either the sample or the total production. (For e.g. Damage by
mold may be localized to one part of the storage space. If the experimental sample is obtained
from that section the extrapolations of the sample loss to the overall production will provide an
inflated measure. This leads to unreliable measures and disparity in reporting the common
denominator for comparison.
The second inconsistency arises from the fact that they do not follow a holistic approach to
measurement of PHLs. Most of the studies in the last three decades as shown in Figure 6 have
focused only on the storage stage of the supply chain, ignoring the other important steps which
also contribute to PHLs. Important stages which contribute to overall PHLs are listed on the left
hand side of Figure 6. This represents a gap in the estimation procedure which needs to be
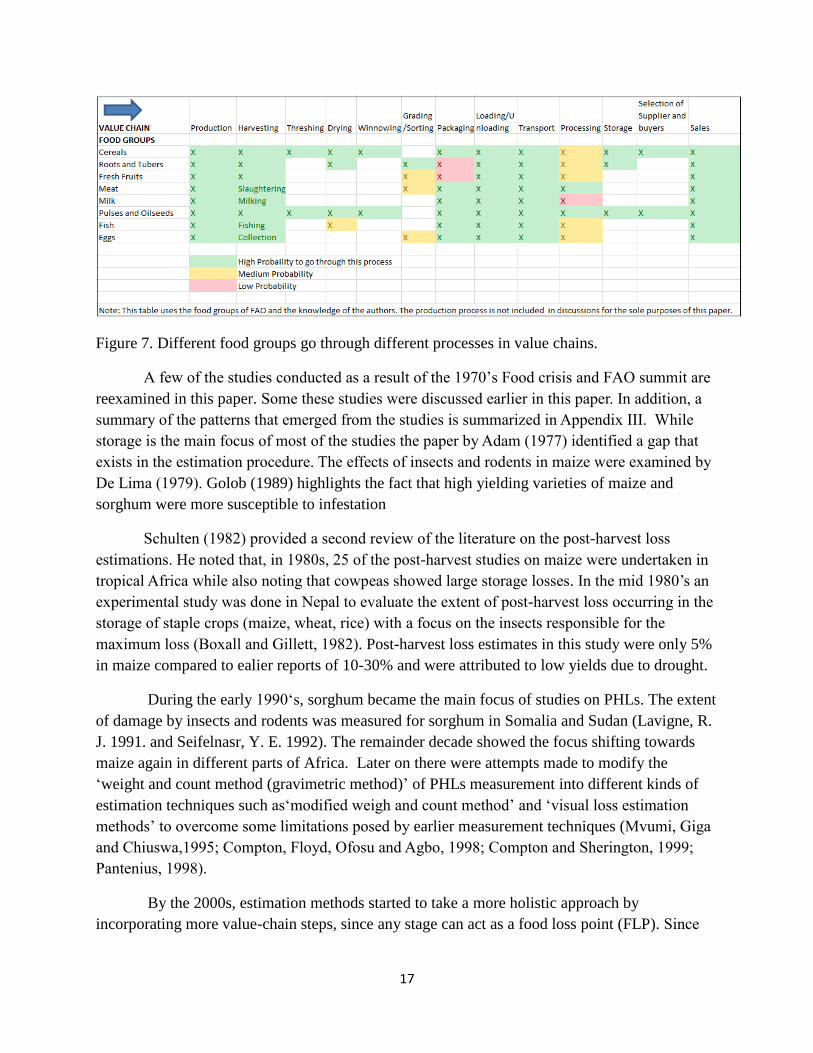
addressed for more reliable future estimates. Figure 7 presents the various steps a commodity
goes through depending upon the food groups to which it belongs (eggs don’t pass through as
many hands as the cereal does in post-harvest value chain). The stages and length of value chain
depend on the perishability and physical properties of a crop. The third inconsistency comes
from the fact that only a few crops have been studied through the loss measurement lens. Maize
and sorghum have been the focus for most of the experimental studies (Figure 6 literature review

13
summary). The need for such a focus is often justified by the importance of maize as a staple
crop of developing regions of the world.
Efforts to estimate post-harvest losses have therefore been hindered by the dearth of reliable
parameters for estimation. To date, no single and consistent framework exists which is used in
the estimation of PHLs. African Postharvest Losses Information System or APHLIS is an
attempt to address this need for a consistent estimation framework. It has a regional focus and is
designed to compute quantitative postharvest losses for cereals under different farming and
environmental conditions in East and Southern Africa. APHLIS is backed up by a database and a
postharvest loss calculator which together facilitate the estimation of annual postharvest losses
(by province) for the cereal grains of the countries of East and Southern Africa.
For calculating the losses, APHLIS divides the African region into 5 broad climatic zones
based on the Koppen Climatic code (Peel, Finlayson and McMahon, 2007). These are the
tropical savannah, semi-arid, temperate dry winter hot summer, temperate dry winter summer,
and desert. These zones are assigned numbers and corresponding parameters for estimation
purposes. The framework focuses mainly on large grain borer damage and on 7 cereal crops,
maize, rice, sorghum, millet, wheat, barley, and teff. The calculator incorporates grain losses at
different stages of the supply chain in its estimation. The stages included are 1) harvesting and
drying, 2) threshing and shelling, 3) winnowing, and 4) transportation. The inputs required for
the loss estimations by this system requires entries on production quantity (tons), marketed
percentage, rain at harvest (0 or 1), storage duration (months), and incidence of large grain borer
infestation (0 or 1), The default parameters are then used to predict the losses for that season and
crop.
These default loss parameters set in the online calculator are obtained from published work
or surveys conducted in the region. When a crop is harvested multiple times within a year (three
seasons), the associated losses are estimated to be higher. Hence, the final percentage loss is
computed as a weighted average. Similarly, farmer or farm characteristics and decisions
regarding marketing and storage, as well as weather conditions affect the parameters considered
for PHL estimation in the calculator. The calculator then provides a loss estimate associated
with a given proportion of borer infested grain at harvest.
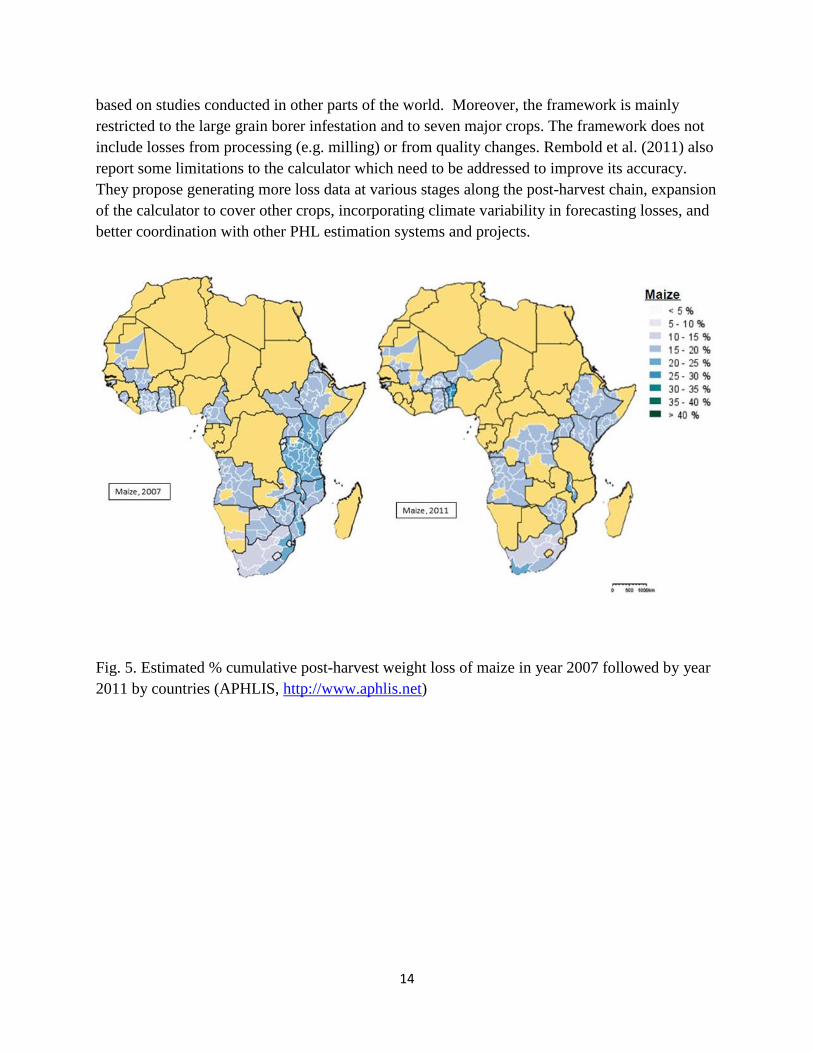
Figure 5 shows an example of the maps which are generated using this application. The maps
give an overall regional dispersion of losses. The legend in figure 5 provides the extent of
damage by larger grain borer (LGB). No information is available for yellow regions of the maps
(Figure 5). The changes of these maps over the years can be essential input to see the impact of
new policies or innovations in highly affected regions. The detailed description of APHLIS is
provided in the text box.
APHLIS provides a valuable framework for estimating PHLs in south and east Africa.
However, it has its limitations. The parameters used in the online calculator are often old or
14
based on studies conducted in other parts of the world. Moreover, the framework is mainly
restricted to the large grain borer infestation and to seven major crops. The framework does not
include losses from processing (e.g. milling) or from quality changes. Rembold et al. (2011) also
report some limitations to the calculator which need to be addressed to improve its accuracy.
They propose generating more loss data at various stages along the post-harvest chain, expansion
of the calculator to cover other crops, incorporating climate variability in forecasting losses, and
better coordination with other PHL estimation systems and projects.
Fig. 5. Estimated % cumulative post-harvest weight loss of maize in year 2007 followed by year
2011 by countries (APHLIS, http://www.aphlis.net)
15
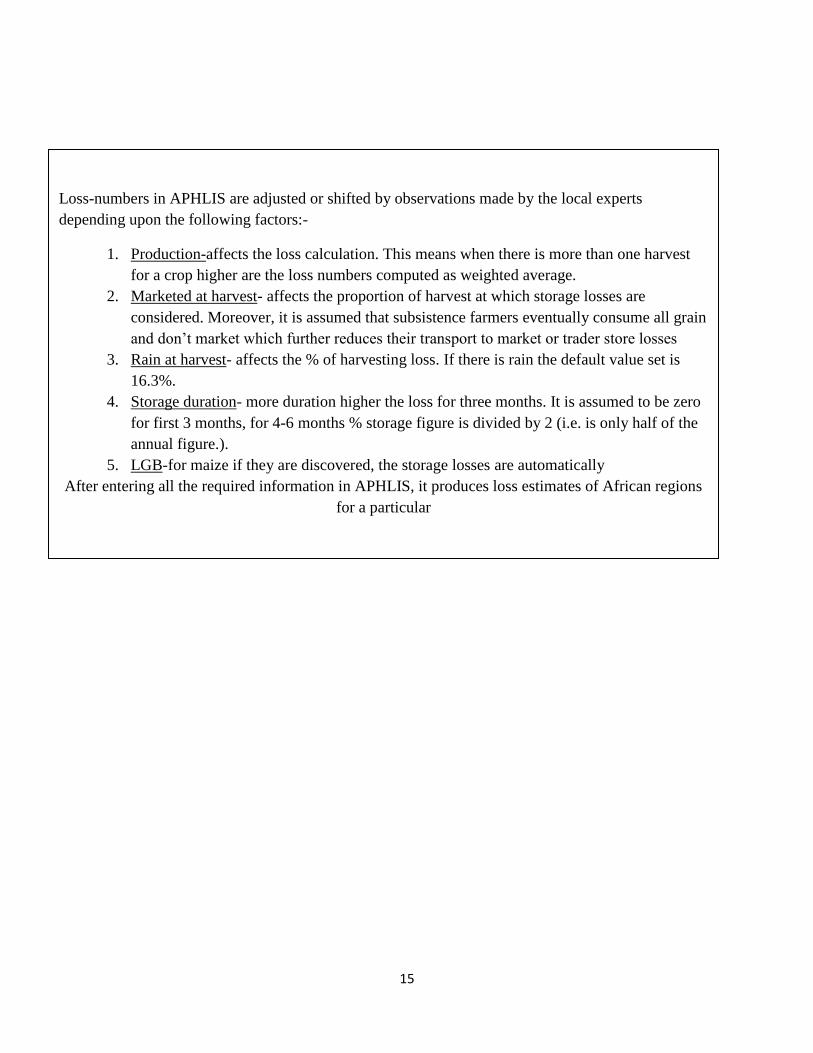
Loss-numbers in APHLIS are adjusted or shifted by observations made by the local experts
depending upon the following factors:-
1. Production-affects the loss calculation. This means when there is more than one harvest
for a crop higher are the loss numbers computed as weighted average.
2. Marketed at harvest- affects the proportion of harvest at which storage losses are
considered. Moreover, it is assumed that subsistence farmers eventually consume all grain
and don’t market which further reduces their transport to market or trader store losses
3. Rain at harvest- affects the % of harvesting loss. If there is rain the default value set is
16.3%.
4. Storage duration- more duration higher the loss for three months. It is assumed to be zero
for first 3 months, for 4-6 months % storage figure is divided by 2 (i.e. is only half of the
annual figure.).
5. LGB-for maize if they are discovered, the storage losses are automatically
After entering all the required information in APHLIS, it produces loss estimates of African regions
for a particular

16
.
Figure 6. Chronological depiction of experimental studies reviewed in this paper
17
Figure 7. Different food groups go through different processes in value chains.
A few of the studies conducted as a result of the 1970’s Food crisis and FAO summit are
reexamined in this paper. Some these studies were discussed earlier in this paper. In addition, a
summary of the patterns that emerged from the studies is summarized in Appendix III. While
storage is the main focus of most of the studies the paper by Adam (1977) identified a gap that
exists in the estimation procedure. The effects of insects and rodents in maize were examined by
De Lima (1979). Golob (1989) highlights the fact that high yielding varieties of maize and
sorghum were more susceptible to infestation
Schulten (1982) provided a second review of the literature on the post-harvest loss
estimations. He noted that, in 1980s, 25 of the post-harvest studies on maize were undertaken in
tropical Africa while also noting that cowpeas showed large storage losses. In the mid 1980’s an
experimental study was done in Nepal to evaluate the extent of post-harvest loss occurring in the
storage of staple crops (maize, wheat, rice) with a focus on the insects responsible for the
maximum loss (Boxall and Gillett, 1982). Post-harvest loss estimates in this study were only 5%
in maize compared to ealier reports of 10-30% and were attributed to low yields due to drought.
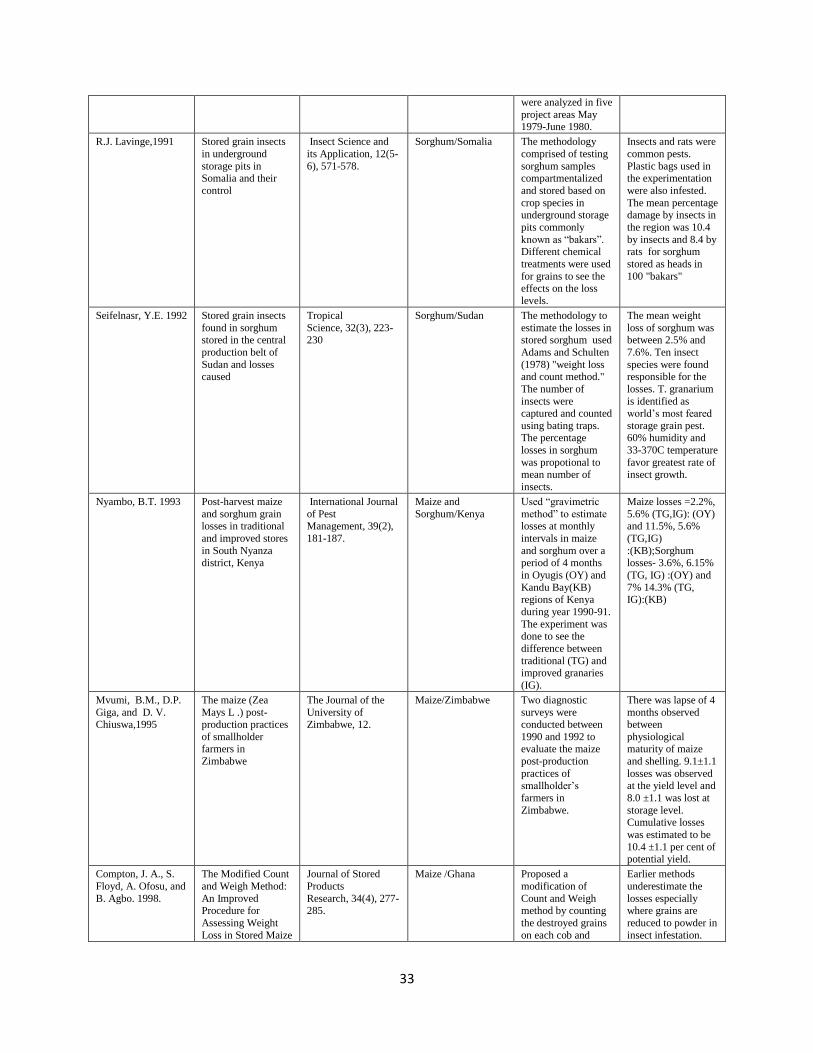
During the early 1990‘s, sorghum became the main focus of studies on PHLs. The extent
of damage by insects and rodents was measured for sorghum in Somalia and Sudan (Lavigne, R.
J. 1991. and Seifelnasr, Y. E. 1992). The remainder decade showed the focus shifting towards
maize again in different parts of Africa. Later on there were attempts made to modify the
‘weight and count method (gravimetric method)’ of PHLs measurement into different kinds of
estimation techniques such as‘modified weigh and count method’ and ‘visual loss estimation
methods’ to overcome some limitations posed by earlier measurement techniques (Mvumi, Giga
and Chiuswa,1995; Compton, Floyd, Ofosu and Agbo, 1998; Compton and Sherington, 1999;
Pantenius, 1998).
By the 2000s, estimation methods started to take a more holistic approach by
incorporating more value-chain steps, since any stage can act as a food loss point (FLP). Since

18
storage has been the main target as mentioned a number of times, some studies were later
undertaken to measure the impact of various kinds of insect treatments at the storage stage
(Haile, 2006). There were attempts made to estimate the PHLs in the entire value chain of the
commodity studied, for (e.g. Kinnow and Rice/Wheat in India) (Gangwar and Singh, 2007 and
Basavaraja, Mahajanashetti and Udagatti, 2007). Authors using a more holistic measurement
approach found the added advantage of identifying the stage contributing the most to the PHL
damage.
19
Framework for estimating post-harvest food losses
For the development of a consistent methodology for the assessment of post-harvest
losses of food commodities, it is necessary understand the concepts of loss. There is wide range
of variations adopted by researches. This can be attributed to the complexity and variability of all
the post-harvest operations involved in the movement of food from harvest to fork. For the
purpose of this paper definitions provided in second section will be adopted for further analysis.
The best way to understand the theoretical or conceptual model is to understand steps which
comprise of the post-harvest operations.
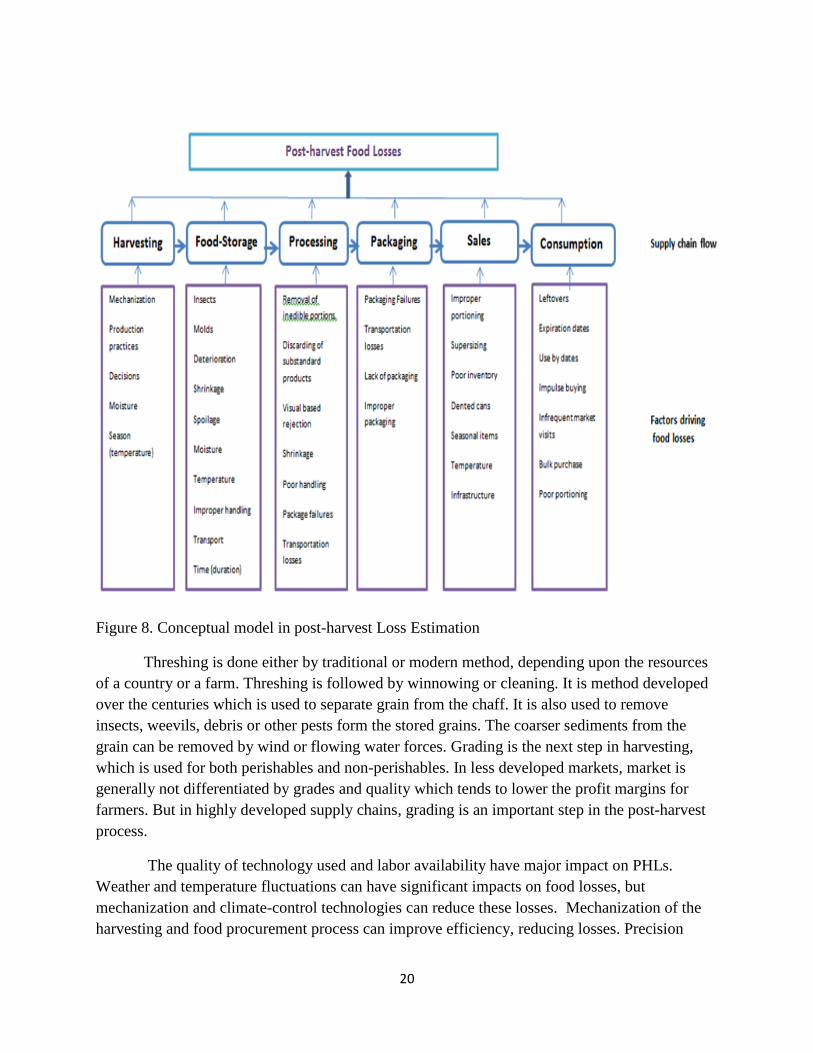
Food travels along the value chain from harvesting to consumption. Losses occur at
each stage along the chain and contribute to total PHL. The loss at each stage is driven by
different factors, examples of which are described in Figure 8. The relative importance of a
particular stage or factor toward contributing to total PHL will vary across countries and
commodities. For example, estimating losses for a sophisticated, vertically integrated chain will
likely require consideration of fewer factors than for a less integrated chain where the
commodity undergoes several transactions before reaching the retail outlet. Therefore while the
conceptual framework is the same across all countries and commodities, the actual econometric
model used for PHL will vary across countries and commodities. Our future econometric
analysis will exclude losses during the consumption stage of the value chain.
Food leaves the field by the process of harvesting, where mature crops are gathered from
the fields. Harvesting methods can vary from most-labor intensive on small farms to most
expensive and sophisticated farm machinery, like the combine harvester. There are also other
external factors which affect the amount and quality of food harvested from the field. On a broad
base, food products can be divided into two main categories- perishable and non-perishable.
Perishable commodities comprise of food products which last only for short periods of time such
as a few days to weeks. e.g. - milk, meat, fish, fruits, tuber and vegetables etc. On the other hand
non-perishables have longer shelf life lasting from months to years, for e.g. cereals, rice, lentils,
and dried fruits. Different food groups vary in the way they are harvested from the field. For
perishable food groups the process consists of plucking and storing in boxes or bags but in case
of non-perishables such as cereals additional steps such as threshing and cleaning are required.
20
Figure 8. Conceptual model in post-harvest Loss Estimation
Threshing is done either by traditional or modern method, depending upon the resources
of a country or a farm. Threshing is followed by winnowing or cleaning. It is method developed
over the centuries which is used to separate grain from the chaff. It is also used to remove
insects, weevils, debris or other pests form the stored grains. The coarser sediments from the
grain can be removed by wind or flowing water forces. Grading is the next step in harvesting,
which is used for both perishables and non-perishables. In less developed markets, market is
generally not differentiated by grades and quality which tends to lower the profit margins for
farmers. But in highly developed supply chains, grading is an important step in the post-harvest
process.
The quality of technology used and labor availability have major impact on PHLs.
Weather and temperature fluctuations can have significant impacts on food losses, but
mechanization and climate-control technologies can reduce these losses. Mechanization of the
harvesting and food procurement process can improve efficiency, reducing losses. Precision

21
agriculture in developed countries has been an important revolution for making agriculture
production system more efficient in terms of production and harvesting.
Drying is the second important component of the post-harvest food chain (PHFC).
Drying is also a method of food preservation which works by removing water from the food.
This method has been used since centuries to preserve food. A solar or electric food dehydrator
can greatly speed the drying process. Air drying, sun drying, smoking or winds drying are few
methods that are employed to evaporate water from cereals. Drying effectively prevents the
growth of bacteria, yeasts and molds in the food. For non-perishable, however, it is an important
activity before they can be moved to storage.
As indicated earlier in literature review, transport conditions and transport distance play
an important role in influencing the magnitude of PHLs. Larger distance, bad modes of transport
and outdated use of storage containers lead to higher PHLs. Furthermore, storage conditions such
as temperature, moisture, technology, container material and buildings contribute greatly to
losses incurred at this stage. High moisture and temperature provide favorable environment for
pest and mold multiplications. They also lead to faster biological deterioration by catalyzing the
ripening process. Time of storage duration can give higher chances for these pests to complete
their reproductive cycles and multiply. The rate of multiplication of pests and molds depends
essentially on the species affecting the product.
Processing of initially stored or fresh food is an essential part to make it marketable and
to meet consumer demands. The condition of processing plants play a major role in defining the
extent of PHLs. Food losses at processing facilities may occur due to procurement of
substandard produce, which not meet the requirement of sales and marketing divisions. These
products are then discarded. Visual inspection by workers can also play an important role since
the workers may engage in disposing contaminated foods (cereals and meats) or misshapen
produce (fruits and vegetable). Sudden shrinkages due to changes in temperature and moisture
changes can also lead to discarding some of agriculture products at processing facilities.
22
Packaging of the processed products is affected by numerous biological and
technological factors. Less developed supply chains have poor or no standards for packaging
materials resulting in speedy spoilage. The lack of adequate packaging leads to transportation
losses while moving this packaged product to the market. Poorly-packaged food lose moisture
quickly when exposed to unfavorable conditions, contributing in turn to food losses. These
losses can be greater if poor-packaging is accompanied by poor-logistics for marketing. Poor
market logistics is a big concern in less developed food supply chains.
To sum up, different factors affect the efficiency of each stage as products move to the
next stage in the supply chain. Variations in the optimal conditions result in inadvertent food
losses which are higher than the standard conversion factors for food processing. To summarize,
three main factors appear to contribute to most losses: technology, weather and infrastructure.
Therefore, these factors, along with other site-specific play a significant role in determining food
losses from the farm to the retail outlet. This study will exclude food losses at the consumer
level.

23
Table 1. Factors affecting post harvest losses at critical stages of food supply chain.
Note: Food waste at the consumer-level will not be covered in this study.
Factors affecting postharvest losses (PHL)
(Xj)Critical stages of
food supply chain
(Si) Moisture Weather Pests/disease Infrastructure
Size of
operation
Level of
mechanization
Quality of
management
Operator
characteristics
Access to
capital
Harvesting X X X X X X X X
Food storage X X X X X X X X X
Processing X X X X X X X X X
Packaging X X X X X X
Sales X X X X X

24
For statistical estimation work, the total PHL at any post-harvest stage for a given
commodity and region is the sum total of food losses occurring at each of stage of the process
(Table 1).
Total PHL = Sum of PHL at each stage of the food supply chain
∑ ∑ …………………………………………………………….(3)
Where ‘Si’ stands for the losses in each critical stage of FSC (Food Supply Chain);‘Xj’ stands for
the factors affecting losses at each step and ‘i’ represents critical stages from harvesting to sales.
∑ ……………………………………………………………………………….(4)
The equation (4) on the right hand side represents post-harvest losses at particular stage
in the food supply channel and on the left hand side represents all the measurable factors which
contribute to these losses. Food losses at the different stages represented in Figure 6 can further
be represented in a functional form as follows.
Losses at harvesting given by,
PHLSH = f (agroclimatic factors, farm and farmer related factors, level of mechanization, and
credit availability).
Losses in storage is given by,
PHLSS = f (agroclimatic factors, farm and farmer related factors, length of storage, distance to
storage, quality of storage, and credit availability).
Losses during processing given by,
PHLSP = f (agroclimatic factors, processing plant related factors, quality of supply chain, use of
standards and grading, and credit availability).
Losses during packaging are given by
PHLSPK = f (agroclimatic factors, firm and operator related factors, quality of packaging,
transportation, and credit availability).
Finally losses during sales are given by,
PH SQ = f (agroclimatic factors, retail outlet and manager related factors, quality of logistics and
inventory control, and credit availability).
As earlier mentioned, we will be focusing only on the segment of the supply chain which
covers harvesting through sales and will exclude food losses at the consumer stage. In the actual
equations which will be estimated, we will focus on readily available information which can be

25
used to predict losses. These may include weather and climate data, indicators of agroclimatic
zones, appropriate indices to represent the quality of management and the stages of the supply
chain. Controlled experimental surveys will be developed to calculate losses at each stage.
Different measurable factors which impact the food losses will be explored and indexed where
possible. These losses will then be regressed using the different factors as variables. The
estimated parameters can be used to project and updating future losses and also to identify which
component of the chain needs the greatest attention to minimize losses.
CONCLUSION
This paper has highlighted the importance of reducing postharvest food losses as a
necessary step in ensuring future global food security in a sustainable manner. Given the
challenges posed by climate change and limited land and water resources, food security cannot
be achieved merely through increases in agricultural productivity. Attention also needs to be
given to measures to reduce losses along the farm-to-consumer chain. Reduced losses not only
reflect an increase in food available for human consumption, but they also reflect a more
judicious use of our limited natural resources.
There have been very few past studies conducted to estimate food losses. The existing
studies have been mostly one-off and do not adopt any consistent methodologies. While the
African Postharvest Losses Information System or APHLIS has recently made an effort to
provide a framework to calculate food losses using a common methodology for south and east
Africa, the input used in this process is based on work which may be outdated or not directly
relevant. Therefore, it is critical that a more broader and updated effort be implemented to
improve the ability to estimate postharvest food losses.
The paper outlines a framework which can be adopted for consistent estimation of
postharvest losses for different commodities and countries. As a follow-up to this work, using
the methodology discussed here, surveys can be designed to conduct field work to estimate
losses. Based on the survey data, econometric models can be used for selected commodities and
countries to estimate the losses.
26
References:
Adams, J. M. 1977. “A review of the literature concerning losses in stored cereals and pulses,
published since 1964.” Trop. Sci, 19, 1-28.
Agricultural Research Service (ARS). 2008. National nutrient database for standard
reference. United State Department of Agriculture, Washington, DC.
Alexandratos, N., and J. Bruinsma. 2012. “World agriculture towards 2030/2050: the saving
water. From Field to Fork-Curbing Losses and Wastage in the Food Chain 2012 revision.”
Working paper: FAO: ESA No. 12-03, p.4.
Basavaraja, H., S. B. Mahajanashetti, and N. C. Udagatti. 2007. “Economic analysis of post-
harvest losses in food grains in India: a case study of Karnataka.” Agricultural Economics
Research Review 20(1).
Bloom, J. 2010. American Wasteland. Da Capo Press, Cambridge, MA.
Boxall, R. A., and R. Gillett. 1982. “Farm level storage losses in Eastern Nepal.” Tropical Products
Inst., 50, 20-25.
Buzby, J. C., and H. Jeffrey. 2012. “Total and per capita value of food loss in the United
States.” Food Policy 37: 561-570.
Buzby, J. C., and J. Hyman. 2012. “Total and per capita value of food loss in the United
States.” Food Policy, 37(5), 561-570.
Chestney, N. 2013. Available at: http://www.reuters.com/article/2013/01/10/food-waste-
idUSL5E9CAC3Q20130110. Accessed January 14, 2013.
Compton, J. A. F., and J. Sherington. 1999. “Rapid assessment methods for stored maize
cobs: Weight losses due to insect pests.” Journal of Stored Products Research, 35(1), 77-87.
Compton, J. A., S. Floyd, A. Ofosu, and B. Agbo. 1998. “The modified count and weigh
method: an improved procedure for assessing weight loss in stored maize cobs.” Journal of
Stored Products Research, 34(4), 277-285.
De Lima, C.P.F .1979. “The assessment of losses due to insects and rodents in maize stored for
subsistence in Kenya.” Tropical Stored Products Information, 38,21-25.
Dutch ministry of economic affairs, A., and Innovation, The Hague.Emergency Response
(OSWER). Washington, DC.

27
Food and Agriculture Organization. 1980. Assessment and Collection of Data on Post-
harvest Food Grain Losses, FAO Economic and Social Development Paper 13. Rome.
Food and Agriculture Organization. 2004. The State of the Food Insecurity in the World
2005. Rome. Italy.
Food Balance Sheet Data. 2013. Available at: http://faostat.fao.org/site/354/default.aspx.
Accessed January 10, 2013.
Fox, T. and C. Fimeche. 2103. “Global food Waste Not, Want Not.” IMechE. England and
Wales.
Gangwar, L. S., D. Singh, and Singh, D. B. 2007. “Estimation of post-harvest losses in
Kinnow Mandarin in Punjab using a modified formula.” Agricultural Economics Research
Review, 20(2).
Golob, P. 1989. “A practical appraisal of on-farm storage losses and loss assessment methods in the
Shire Valley of Malawi.” Tropical Stored Products Information, 40, 5-13.
Gustavsson, J., Cederberg, C., Sonesson, U., van Otterdijk, R., Meybeck, A. 2011.“Global
Food Losses and Food Waste: Extent Causes and Prevention.” Rome, Food and Agriculture
Organization (FAO) of the United Nations.
Haile, A. 2009. “On-farm storage studies on sorghum and chickpea in Eritrea..” African Journal of
Biotechnology, 5(17).
Hodges, R.J., J.C. Buzby, and B. Bennett. 2011 “Postharvest losses and waste in developed
and less developed countries: opportunities to improve resource use.” Journal of Agricultural
Science 149:37-45
International Bank for Reconstruction and Development/ The World Bank; the Natural
Resources Institut/ UK, and FAO/UN. 2011. MISSING FOOD: The Case of Postharvest
Grain Losses in Sub-Saharan Africa. Washington DC: World Bank Report, April,
Kader, A.A. 2005. “Increasing food availability by reducing postharvest losses of fresh
produce.” Acta Horticulture 682:2169-2176.
Kader, A.A. and R.S. Rolle. 2004. “The Role of Post-harvest Management in Assuring the
Quality and Safety Horticultural Crops”. Food and Agriculture Organization. Agricultural
Services Bulletin 152, 52 p.

28
Knight, A. and C. Davis. 2007. “What a waste! Surplus fresh foods research projects,
S.C.R.A.T.C.H.”
Lavigne, R. J. 1991. “Stored grain insects in underground storage pits in Somalia and their control.”
Insect Science and its Application, 12(5-6), 571-578.
Loss-adjusted food availability data, Economic Research Service (ERS). 2011. ERS US
Department of Agriculture, Washington, DC.
Lundqvist, J., C. De. Fraiture, and D. Molden. 2008. “Saving water: from field to fork:
curbing losses and wastage in the food chain”. Stockholm, Sweden: Stockholm International
Water Institute.
Mundial, B. 2008. “Double Jeopardy: responding to high food and fuel prices.” Cumbre
Hokkaido-Toyako del G, 8, 2.
Mvumi, B. M., D. P. Giga, and D. V. Chiuswa. 1995. The maize (Zea mays L.) post-production
practices of smallholder farmers in Zimbabwe: findings from surveys. The Journal of the University
of Zimbabwe, ½,115-130
Nyambo, B. T. 1993. “Post‐harvest maize and sorghum grain losses in traditional and improved stores
in South Nyanza District, Kenya.” International Journal of Pest Management, 39(2), 181-187.
Pantenius, C. U. 1988.” Storage losses in traditional maize granaries in Togo.” Insect Science and its
Application, 9(6), 725-735.
Peel, M. C., B. L. Finlayson, and T. A. McMahon. 2007. “Updated world map of the
Köppen-Geiger climate classification.” Hydrology and Earth System Sciences Discussions
Discussions, 4(2), 439-473.
Post-Harvest Losses Information Systems. 2013. Available at: http://www.aphlis.net/.
Accessed January 10, 2013.
Quested T., and Johnson, H. 2009. “Household Food and Drink Waste in the UK: Final
Report.” Wastes & Resources Action Programme (WRAP).
Regmi, A., Deepak, M. S., Seale Jr, J. L., and Bernstein, J. 2001. “Cross-Country Analysis of
Food Consumption Patterns. Changing Structure of Global Food Consumption and Trade.”
Anita Regmi, 14.
Rembold. F., R. Hodgex, M. Bernard, H. Knipchild, and O. Leo. 2011. “The African
Postharvest Losses Information System (APHLIS)”. JRC Scientific and Technical Reports.
Luxemburg.
29
SAVE FOOD: Global Initiative on Food Losses and Waste Reduction, FAO. 2013. Available
at: http://www.fao.org/save-food/key-findings/en/ . Accessed on April 2, 2013
Schulten, G. G. M. 1982 .”Post-harvest losses in tropical Africa and their prevention.” Food and
Nutrition Bulletin, 4(2), 2-9.
Schwab, J. 2010. Environmental Protection Agency (EPA). Office of Solid Waste and
Seifelnasr, Y. E. 1992. “Stored grain insects found in sorghum stored in the central production belt of
Sudan and losses caused.” Tropical Science, 32(3), 223-230
Smithers, R. 2013. Available at:http://www.guardian.co.uk/environment/2013/jan/10/half-
world-food-waste. Accessed January 14, 2013.
Think Eat Save. Available at: http://www.thinkeatsave.org/index.php/be-informed/fast-facts.
Accessed on March 12, 2013.
Trostle, R. 2010. “Global Agricultural Supply and Demand: Factors Contributing to the
Recent Increase in Food Commodity Prices.” (Rev. DIANE Publishing.)
United Nations, Food and Agricultural Organization. 2011. Global Food Losses and Food
Waste- Extent, Causes and Prevention. Rome.
Voices Newsletter. 2006. Available online at: http://www.farmradio.org/wp-
content/uploads/Voices_79.pdf. Accessed April 2, 2013.
Waarts, Y., M. Eppink, E. Oosterkamp, S. Hiller, A. Van der Sluis, and T. Timmermans.
2011. “Reducing food waste: obstacles experienced in legislation and regulation.” LEI
report/LEI Wageningen UR (-059).
World Food Logistics Organization. 2010. Identification of Appropriate Postharvest
Technologies for improving Market Access and Incomes for Small Horticultural Farmers in
Sub-Saharan Africa and South Asia. Alexandria VA, March.

30
Appendix I
Source: Basavaraja, H., S. B. Mahajanashetti, and N. C. Udagatti. 2007.

31
Appendix II
Source: Basavaraja, H., S. B. Mahajanashetti, and N. C. Udagatti. 2007.
32
Appendix III
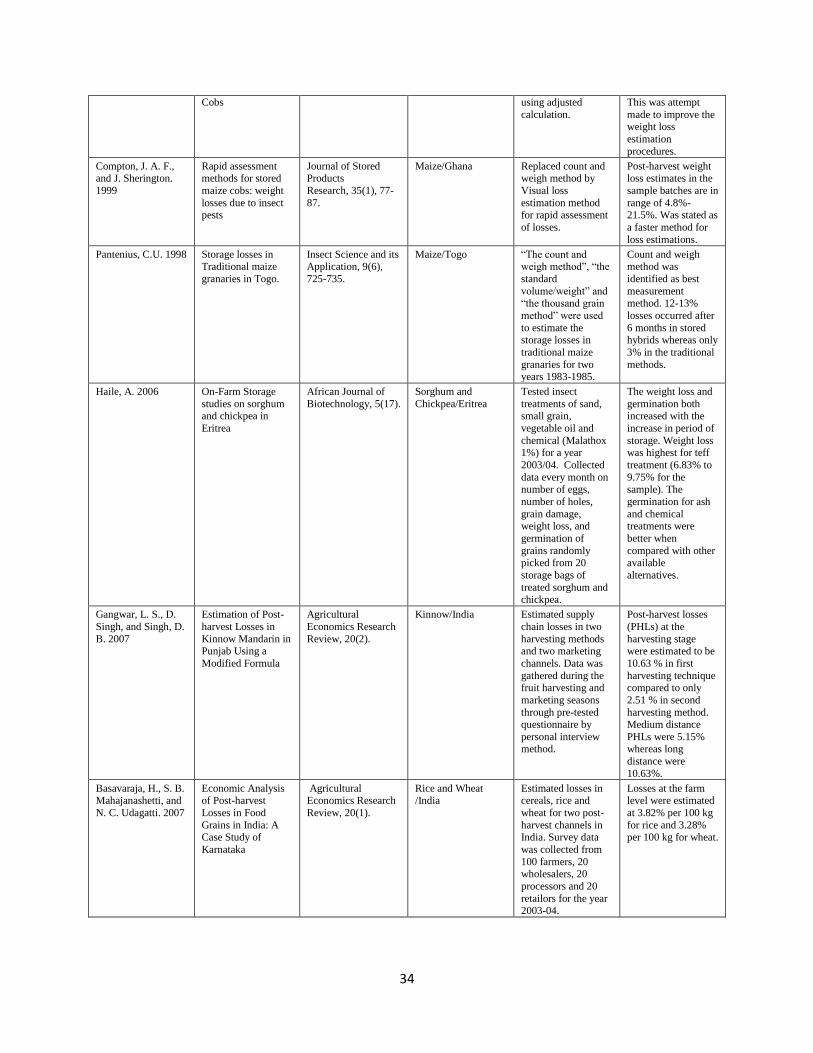
Authors Paper Journal Commodity/Country Methods Findings
Adam, J.M.1977 A review of the
literature concerning losses in stored
cereals and pulses
Trop. Sci, 19, 1-28. Cereals and
Pulses/Tropical Countries
This paper provides
the review of Literature published
since 1964.
Large gaps were
identified and storage was main
focus of most of
world studies done until 1964.
De Lima,
C.P.F..1979
The assessment of
losses due to insects
and rodents in maze stored for
subsistence in
Kenya.
Tropical Stored
Products Information,
40, 5-13.
Maize/Kenya Losses were studied
over several years
employing appropriate field
survey techniques
and using area,
cluster and line
sampling methods.
Study was done to estimate losses in
maize for
subsistence storage due to insects and
rodents.
Annual loss in
subsistence maize
was found 4.54 % percent due to
insects and 1.45 %
due to rodents.
Golob, P. 1989 A Practical appraisal of on-Farm storage
Losses and loss
assessment methods In the Shire Valley
of Malawi
Tropical Stored Products
Information, 40, 5-
13.
Maize and Sorghum/ Malawi
Used surveys of farm-level grain
storage in Southern
Malawi. “Standard Volume Weight
(SVW) Method” and
“Count and Weigh Method” for
calculating loses
were employed for
estimation.
Considerable likelihood of greater
losses with high-
yielding varities is indicated. Losses
observed in Maize
reported to be 3% or less and in Sorghum
2% or less.
Schulten,G.G.M.
1982
Post-harvest losses
in tropical Africa
and their prevention
Food and Nutrition
Bulletin, 4(2), 2-9.
Post-Harvest
Losses/Africa
Used a literature
review of African
studies done on PHLs. In 1980, 25 of
these projects were
conducted in tropical Africa.
Most projects dealt
with maize. Cowpeas
showed large storage losses. Survey
results show that the
weight losses at farm level are less than
previously . The
maize variety, the storage method, and
gradual decrease in
the quantity of produce stored have
a large impact on the
final loss figure. Loss in quality
identified to be more important than
weight loss.
Boxall,R. A. 1984 Farm level storage
Losses in eastern Nepal
Tropical Products
Inst.
Maize, Wheat,
Paddy/Nepal
Harris and Lindblad
(1978) loss assessment
methodology was
used to estimate losses in three staple
crops in Nepal.
Study is concentrated on
insects which cause
major grain loss. Household samples
Maize losses were
recorded (5%) considerably low
than the previous
years recordings (10-30%). This was
attributed to low
yields due to drought. Insects were
major cause for grain
loss followed by rodents and molds.
33
were analyzed in five
project areas May 1979-June 1980.
R.J. Lavinge,1991 Stored grain insects
in underground
storage pits in Somalia and their
control
Insect Science and
its Application, 12(5-
6), 571-578.
Sorghum/Somalia The methodology
comprised of testing
sorghum samples compartmentalized
and stored based on
crop species in underground storage
pits commonly
known as “bakars”. Different chemical
treatments were used
for grains to see the effects on the loss
levels.
Insects and rats were
common pests.
Plastic bags used in the experimentation
were also infested.
The mean percentage damage by insects in
the region was 10.4
by insects and 8.4 by rats for sorghum
stored as heads in
100 "bakars"
Seifelnasr, Y.E. 1992 Stored grain insects
found in sorghum stored in the central
production belt of
Sudan and losses caused
Tropical
Science, 32(3), 223-230
Sorghum/Sudan The methodology to
estimate the losses in stored sorghum used
Adams and Schulten
(1978) "weight loss and count method."
The number of
insects were captured and counted
using bating traps. The percentage
losses in sorghum
was propotional to mean number of
insects.
The mean weight
loss of sorghum was between 2.5% and
7.6%. Ten insect
species were found responsible for the
losses. T. granarium
is identified as world’s most feared
storage grain pest. 60% humidity and
33-370C temperature
favor greatest rate of insect growth.
Nyambo, B.T. 1993 Post-harvest maize
and sorghum grain losses in traditional
and improved stores
in South Nyanza district, Kenya
International Journal
of Pest Management, 39(2),
181-187.
Maize and
Sorghum/Kenya
Used “gravimetric
method” to estimate losses at monthly
intervals in maize
and sorghum over a period of 4 months
in Oyugis (OY) and
Kandu Bay(KB) regions of Kenya
during year 1990-91.
The experiment was done to see the
difference between
traditional (TG) and improved granaries
(IG).
Maize losses =2.2%,
5.6% (TG,IG): (OY) and 11.5%, 5.6%
(TG,IG)
:(KB);Sorghum losses- 3.6%, 6.15%
(TG, IG) :(OY) and
7% 14.3% (TG, IG):(KB)
Mvumi, B.M., D.P.
Giga, and D. V. Chiuswa,1995
The maize (Zea
Mays L .) post-production practices
of smallholder farmers in
Zimbabwe
The Journal of the
University of Zimbabwe, 12.
Maize/Zimbabwe Two diagnostic
surveys were conducted between
1990 and 1992 to evaluate the maize
post-production
practices of smallholder’s
farmers in
Zimbabwe.
There was lapse of 4
months observed between
physiological maturity of maize
and shelling. 9.1±1.1
losses was observed at the yield level and
8.0 ±1.1 was lost at
storage level. Cumulative losses
was estimated to be
10.4 ±1.1 per cent of potential yield.
Compton, J. A., S.
Floyd, A. Ofosu, and
B. Agbo. 1998.
The Modified Count
and Weigh Method:
An Improved Procedure for
Assessing Weight
Loss in Stored Maize
Journal of Stored
Products
Research, 34(4), 277-285.
Maize /Ghana Proposed a
modification of
Count and Weigh method by counting
the destroyed grains
on each cob and
Earlier methods
underestimate the
losses especially where grains are
reduced to powder in
insect infestation.
34
Cobs using adjusted
calculation.
This was attempt
made to improve the weight loss
estimation
procedures.
Compton, J. A. F., and J. Sherington.
1999
Rapid assessment methods for stored
maize cobs: weight
losses due to insect pests
Journal of Stored Products
Research, 35(1), 77-
87.
Maize/Ghana Replaced count and weigh method by
Visual loss
estimation method for rapid assessment
of losses.
Post-harvest weight loss estimates in the
sample batches are in
range of 4.8%-21.5%. Was stated as
a faster method for
loss estimations.
Pantenius, C.U. 1998 Storage losses in Traditional maize
granaries in Togo.
Insect Science and its Application, 9(6),
725-735.
Maize/Togo “The count and weigh method”, “the
standard
volume/weight” and “the thousand grain
method” were used
to estimate the storage losses in
traditional maize
granaries for two years 1983-1985.
Count and weigh method was
identified as best
measurement method. 12-13%
losses occurred after
6 months in stored hybrids whereas only
3% in the traditional
methods.
Haile, A. 2006 On-Farm Storage
studies on sorghum and chickpea in
Eritrea
African Journal of
Biotechnology, 5(17).
Sorghum and
Chickpea/Eritrea
Tested insect
treatments of sand, small grain,
vegetable oil and
chemical (Malathox 1%) for a year
2003/04. Collected
data every month on number of eggs,
number of holes,
grain damage, weight loss, and
germination of
grains randomly picked from 20
storage bags of
treated sorghum and chickpea.
The weight loss and
germination both increased with the
increase in period of
storage. Weight loss was highest for teff
treatment (6.83% to
9.75% for the sample). The
germination for ash
and chemical treatments were
better when
compared with other available
alternatives.
Gangwar, L. S., D.
Singh, and Singh, D.
B. 2007
Estimation of Post-
harvest Losses in
Kinnow Mandarin in Punjab Using a
Modified Formula
Agricultural
Economics Research
Review, 20(2).
Kinnow/India Estimated supply
chain losses in two
harvesting methods and two marketing
channels. Data was
gathered during the fruit harvesting and
marketing seasons
through pre-tested questionnaire by
personal interview method.
Post-harvest losses
(PHLs) at the
harvesting stage were estimated to be
10.63 % in first
harvesting technique compared to only
2.51 % in second
harvesting method. Medium distance
PHLs were 5.15% whereas long
distance were
10.63%.
Basavaraja, H., S. B. Mahajanashetti, and
N. C. Udagatti. 2007
Economic Analysis of Post-harvest
Losses in Food
Grains in India: A Case Study of
Karnataka
Agricultural Economics Research
Review, 20(1).
Rice and Wheat /India
Estimated losses in cereals, rice and
wheat for two post-
harvest channels in India. Survey data
was collected from
100 farmers, 20 wholesalers, 20
processors and 20
retailors for the year 2003-04.
Losses at the farm level were estimated
at 3.82% per 100 kg
for rice and 3.28% per 100 kg for wheat.