postal regulatory commission submitted 3/18/2014 … analysis of... · chapter 3 volume, revenue...
TRANSCRIPT
Promoting financial transparency
2013
FINAN
CIA
L A
NAL
YSIS
Analysis of United States Postal Service Financial Results and10-K Statement for Fiscal Year 2013
Postal Regulatory CommissionSubmitted 3/18/2014 2:44:16 PMFiling ID: 89445Accepted 3/18/2014

POSTAL REGULATORY COMMISSION
In response to the many concerns and questions regarding the financial position of the United States Postal Service, my colleagues and I have determined that our analysis of the Service’s financial data that had in previous years been included as part of the Annual Compliance Determination, should be published separately to provide greater clarity, transparency and accountability.
Thus, for 2013, we have divided our reporting responsibilities into three separate reports. The first document is this Financial Analysis Report, focused on the financial performance of the Postal Service. The second document will be the Annual Compliance Determination (ACD) itself, fulfilling the Commission’s responsibility to produce an annual assessment of Postal Service rates and service. The third document will review the annual performance plans and goals established by the Postal Service under Sections 2803 and 2804 of Title 39 of the U.S. Code.
This Financial Analysis Report includes more in-depth discussion of the cost savings the Postal Service has generated, a closer look at the financial impact of the various classes of mail, and a review of the Service’s assets and liabilities. In particular, I would point readers to the Commission’s analysis of the Service’s limited available cash and borrowing capacity. Without ready access to capital, the Service is constrained in its ability to invest in new products, technology and operating systems that are necessary for its future success.
We hope this new format is helpful and look forward to your comments and suggestions as to how we can improve the process of making the Postal Service’s situation more transparent and its functions more accountable.
As always, I thank my fellow commissioners, Vice Chairman Mark Acton and Commissioner Robert G. Taub, and the PRC staff members for their significant contributions and dedication.
Ruth Y. Goldway Chairman, Postal Regulatory Commission
LETTER FROM THE CHAIRMAN


Table of ContentsPurpose of this Report ...................................................................................................i
Executive Summary ......................................................................................................ii
Chapter 1Overview ....................................................................................................................1
Chapter 2Financial Statement Analysis .........................................................................................3 A. Income Statement 1. Revenue Compared to Prior Year and Plan 2. Expense Analysis a. Personnel Expenses b. Non-Personnel Expenses 3. Comparison to the Postal Service Operating Plan B. Balance Sheet Analysis 1. Assets 2. Liabilities C. Debt and Cash Flow Analysis
Chapter 3Volume, Revenue and Cost Analysis by Product ..............................................................21 A. General B. Product and Category 1. First-Class Mail 2. Standard Mail 3. Periodicals 4. Package Services Mail 5. Market Dominant Services 6. Competitive Products
Chapter 4Finacial Sustainability Analysis .....................................................................................37 A. Key Ratios B. Altman Z-Score C. Working Capital Analysis and Trends
Appendix A - Financial Results Under Current Classification............................................43


POSTAL REGULATORY COMMISSION i
Prior Annual Compliance Determinations (ACDs) included a chapter that reported on the Postal Service’s overall financial health, including data on total volumes, revenues, costs, and contribution to institutional costs by product. This ACD analysis identified certain Postal Service financial highlights (or setbacks) for the year under review, but it was not a comprehensive discussion of all the financial data provided by the Postal Service from the Form 10-K filing and the Annual Compliance Report (ACR). This separate financial report provides a more comprehensive financial review.
This report provides an in-depth analysis of the Postal Service’s financial health primarily using information reported in its FY 2013 Form 10-K measured against FY 2012 and its FY 2013 Integrated Financial Plan (Financial Plan). Additionally, data filed with the FY 2013 ACR, such as the Cost and Revenue Analysis report (CRA), the Cost Segments and Components report (CSC), and the Revenue, Pieces, and Weight report (RPW) were all utilized in developing and analyzing the data which form the basis of the financial results.
Appendix A of this report includes the volumes, revenues, attributable costs, and contribution to institutional costs for FY 2013 by product. The details of this appendix are available in two library references: (1) the public version is designated PRC-FinRpt13-LR1; and (2) the non-public version is designated PRC-FinRpt13-NP-LR1. This information replaces the previous version that was filed in the ACD as Appendix D, library references PRC-ACR2012-LR1 and PRC-ACR2012-NP-LR1.
PURPOSE OF THIS REPORT
ii 2013 FINANCIAL ANALYSIS
EXECUTIVE SUMMARY
In FY 2013, the Postal Service reported its seventh consecutive financial loss, amassing a total net deficit of $46.2 billion since FY 2007. The growing net deficit has eroded Postal Service liquidity, resulted in the maximum use of available debt, and put the Postal Service in a situation where its net liabilities exceed its net assets. In addition, the change in mail mix, particularly the growth of Standard Mail as a percent of total mail, jeopardizes the Postal Service’s ability to cover total costs. This is because Standard Mail generates much lower net revenue per piece than First-Class Mail, and as a result, contributes less towards the Postal Service’s overhead costs. The total net loss in FY 2013 is $10.9 billion lower than the total net loss in FY 2012 and $1 billion better than expected under the Financial Plan. The significant improvement over the operating plan was due almost entirely to higher than expected volumes which produced $1.1 billion more revenue than the Postal Service had forecast. The Postal Service has reduced expenses in FY 2013. Total labor costs, excluding the payments into the retiree health benefits fund, declined. Workhours and the average hourly compensation and benefits rate were both lower than last year. This indicates that the Postal Service’s finances may be improving. However, the Postal Service’s current financial situation calls into question its long-term viability.
It is difficult to determine a single measurement that signifies financial health for a government entity. By using a qualitative assessment of the Postal Service’s finances, the Commission concludes that the Postal Service’s financial condition has deteriorated significantly since the passage of the Postal Accountability and Enhancement Act (PAEA). The Commission finds that:
■ sustained losses have resulted in significant negative net worth; ■ the Postal Service has a low level of cash on hand with which to fund current payments; ■ liquid assets (current assets) are insufficient to meet payment of current liabilities; ■ the Postal Service has no further access to borrowing under current law; and ■ the Postal Service’s dependence on borrowed capital and the structure of financing sources
provide no flexibility for funding capital improvements.

POSTAL REGULATORY COMMISSION 1
The PAEA, enacted in FY 2007, included numerous provisions directly related to the Postal Service’s finances. The PAEA (1) allowed the Postal Service to retain earnings rather than limit net income to an amount necessary to break even; (2) replaced the cost of service ratemaking regime with an inflation-based price cap; and (3) required the prefunding of retiree health care costs. Since passage of the PAEA, the Postal Service has been unable to accumulate retained earnings, but rather has amassed a total net deficit of $46.2 billion. In FY 2007 and FY 2008, the added expense of funding the Postal Service Retiree Health Benefits Fund (RHBF) was the primary cause of the overall net loss as the Postal Service reported income from operations for both years. However, in addition to the RHBF payment requirements, the significant loss of volumes and revenues from internet diversion and extensive business downturns resulted in operating losses for FY 2009 and FY 2010. Since FY 2010, the Postal Service has reduced operating expenses and increased efficiency in order to better align operating expenses with the current volumes. The Postal Service began to realize noticeable savings from those efforts in FY 2013. Figure 1 below shows the net income and loss results for the prior 10 years. During the period from FY 2004 through the fourth quarter of FY 2006, the Postal Service reported net losses in three quarters and net income in 9 quarters. After FY 2006, net losses occurred in 25 out of 28 quarters.
The growing net deficit has eroded Postal Service liquidity, resulting in the maximum use of available debt, and put the Postal Service into a situation where its net liabilities exceed its net assets. The Postal Service has failed to make the FY 2011, FY 2012 and FY 2013 statutory payments into the RHBF and restricted its capital
CHAPTER 1OVERVIEW
Source – USPS Forms 10-K, Forms 10-Q and USPS Annual Reports
Figure 1 Postal Service Income/(Loss) in $ Millions
(20,000.0)
(15,000.0)
(10,000.0)
(5,000.0)
0.0
5,000.0
2003 2004 2005 2006 2007 2008 2009 2010 2011 2012 2013
$ in
Mill
ions
Fiscal Year
Postal Service Net Income (Loss) FY 2003 - 2013
Net Income (Loss) Net Income (Loss) w/o RHBF Net Income (Loss) Net Income (Loss) w/o RHBF

2 2013 FINANCIAL ANALYSIS
spending on assets that are necessary for the improvement and continuance of its operations. To conserve its limited liquidity, the Postal Service has reduced costs while striving to maintain service standards, resulting in significant reductions to workhours and the number of career employees. The Postal Service has also reduced certain non-personnel expenses.
In its Five-Year Business Plan and FY 2013 Form 10-K, the Postal Service identifies strategies for moving towards profitability. Figure 2 illustrates the strategy relating to the decline in attributable costs corresponding to diminishing mail volumes. For the first time in 10 years, the percentage decline in attributable costs has exceeded the percentage decline in mail volume. This is an important indicator of the ability of the Postal Service to effectively manage costs and if continued can improve the financial picture in the future.
Figure 2 Mail Volume and Attributable Cost - Precent
Change in Prior Year
Source –PRC Annual Compliance Reports, FY 2007 – 2012, Appendix D, Table D-1, Fiscal Year Volume, Revenue, Cost and Cost Coverage by Class Current Classification and FY 2013 Financial Report, Appendix A.
-‐14.0% -‐12.0% -‐10.0% -‐8.0% -‐6.0% -‐4.0% -‐2.0% 0.0% 2.0% 4.0% 6.0%
FY 2007 FY 2008 FY 2009 FY 2010 FY 2011 FY 2012 FY 2013
Percen
t
Mail Volume and A2ributable Cost -‐ Percent Change in Prior Year
Mail Volume A:ributable Cost

POSTAL REGULATORY COMMISSION 3
1 “…taking aggressive actions within existing law to maintain liquidity and reduce the costs of operations to reflect current and future mail volumes” FY 2013 Form 10-K at 1. 2 Deferred revenue was increased to record omitted revenue from a recalculation of Forever stamp usage included in Postage in the Hands of the Public (PIHOP) during the past years.
CHAPTER 2FINANCIAL STATEMENT ANALYSIS
This section evaluates the past, current and projected financial condition and reported financial results of the Postal Service. The Postal Service files four financial statements in its 10-K report. These are the Income Statement, the Balance Sheet, the Changes in Net Deficiency, and the Cash Flow Statement. The income statement measures the Postal Service’s financial performance (profit and loss) over a 1-year period. The balance sheet summarizes the Postal Service’s assets and liabilities at the end of each fiscal year. The net deficiency statement aggregates the accumulated net deficit from operations and initial capital contribution. The cash flow statement measures the Postal Service’s inflow and outflow of cash during the year.
A. Income StatementTo facilitate detailed analysis of the components of the Postal Service’s Income Statement, the Commission separately identifies elements of the reported Operating Revenue and Operating Expense. In FY 2013, the Postal Service made a $1.3 billion adjustment to total market dominant products revenue. For purposes of this analysis, the adjustment is shown separately. Operating expenses are adjusted to exclude the payment into the RHBF and adjustments to the workers’ compensation liability. These adjustments and expenses are properly recognized as accounting entries by the Postal Service. These are broken out to facilitate an in-
Table 1 United States Postal Service Income Statement FY 2012 and FY 2013
Restated to Facilitate Analysis
Source – USPS FY 2013 Form 10-K at 75 and 21, USPS Preliminary Financial Information September 2013.
($ in Millions) FY 2013 FY 2012 VarianceFY 2013
PlanVariance from Plan
Operating Revenue as reported by the Postal Service $67,318 $65,223 $2,095 $64,875 $2,443
less: Adjustment for postage related to Forever Stamps (1,316) - (1,316) - (1,316)
Net Operating Revenue $66,002 $65,223 $779 $64,875 $1,127
Operating Expense as reported by the Postal Service 72,128 80,964 (8,836) 72,337 (209)
less: Statutory accrual into Retiree Health Benefit Fund (5,600) (11,100) 5,500 (5,600) 0
Adjustment to long term Workers Compensation Liability 311 (2,341) 2,652 0 311
Net Operating Expense $66,839 $67,523 $(684) $66,737 $102
Interest income $24 $25 $(1) $23 $1
Interest Expense 191 190 1 206 (15)
Net Loss from Operations $(1,004) $(2,465) $1,461 $(2,045) $1,041
Adjustment for postage related to Forever Stamps 1,316 - 1,316 - 1,316
Statutory accrual into Retiree Health Benefit Fund (5,600) (11,100) 5,500 (5,600) 0
Adjustment to long term Workers Compensation Liability 311 (2,341) 2,652 0 311
Net Loss $(4,977) $(15,906) $10,929 $(7,645) $2,668

4 2013 FINANCIAL ANALYSIS
depth analysis of the financial health of the Postal Service. Table 1 represents the Commission’s breakdown.
The total net loss in FY 2013 is $10.9 billion lower than the total net loss in FY 2012. This difference is due in part to the accounting treatment of the RHBF payments. Two payments, totaling $11.1 billion, accrued in FY 2012 compared to only one, of $5.6 billion, in FY 2013. This accounted for $5.5 billion of the difference. An increase in the discount rate in FY 2013 lowered the present value of the workers’ compensation liability, which, in turn, resulted in a $2.7 billion difference in the workers’ compensation expense. Total operating revenues were $780 million higher than in FY 2012, primarily due to the price increase for market dominant and competitive products effective January 27, 2013. Increased volumes for competitive products also contributed to higher revenues.
Total expenses for the year were $8.8 billion lower than FY 2012. Most of this reduction was due to the deferral of the FY 2011 RHBF payment to FY 2012 and a significant decline in the workers’ compensation liability adjustment. However, other net operating expenses also declined by $0.7 billion. Compensation and benefit costs, excluding the RHBF payments and fair value adjustment to workers’ compensation costs, make up 76 percent of total operating expenses, and account for most of the decline in overall expenses
The net operating loss without the revenue adjustment, RHBF payments and workers’ compensation expense is $1.0 billion, $1.5 billion better than FY 2012. This improvement reflects a 1.2 percent growth in mail revenue and a 1.0 percent reduction in operating expenses.
1. Revenues compared to Prior Year (PY)
Table 2 presents FY 2013 and FY 2012 revenue by class.
Market dominant revenues from operations declined 3 percent from FY 2012, with the largest revenue decline originating from First-Class Mail. The $1 billion loss in revenue from First-Class Mail could not be offset by gains of $272 million in Standard Mail.
Table 2 Revenues by Class for FY 2012 and FY 2013
Source – USPS FY 2013 Form 10-K at 23
($ in millions) FY 2013 FY 2012 $ Var. % Var.
First-Class Mail $29,426 30,433 (1,007) -3.3%
Standard Mail 16,985 16,713 272 1.6%
Periodicals 1,658 1,731 (73) -4.2%
Package Services 1,136 1,610 (474) -29.4%
Other 3,014 3,263 (249) -7.6%
Market Dominant Mail $52,219 53,750 (1,531) -2.8%
Adjustment to Income 1,316 -
Total Market Dominant Revenue $53,535 53,750 (215.5) -0.4%

POSTAL REGULATORY COMMISSION 5
Table 3 shows revenue for competitive services mail for FY 2012 and FY 2013. Overall, shipping services revenue increased $2.3 billion over FY 2012, a 20 percent increase. During both FY 2012 and FY 2013, there were significant shifts of volumes and revenue to competitive products. These transferred products include First-Class commercial parcels, First-Class Outbound International packages, Standard Mail lightweight parcels, Single-Piece Parcel Post, and certain categories of PO Boxes from the market dominant product list. These transfers account for almost half of the increase in competitive product revenues. Even without those transfers, every product except Priority Mail Express, had higher revenue than FY 2012.
2. Expense Analysis
Personnel expenses, including compensation and benefits expenses and system-wide benefit expenses, account for 78 percent of total expenses. Transportation accounts for 9 percent. The remaining 13 percent includes depreciation, rent and utilities, and supplies and services. The Postal Service reduced compensation and benefits almost $1 billion by increased use of non-career workforce and voluntary retirement incentives. Higher fuel costs increased transportation costs by $105 million. Replacement of Priority Mail brand shipping supplies, resulting from the rebranding of Express Mail to Priority Express Mail, led to a $137 million increase in costs of supplies . Miscellaneous costs also increased with the additional accrual of $16 million resulting from the adjustment to the contingent legal liability.
Table 3 Revenues for Competitive Products
Source – USPS FY 2013 Form 10-K at 25
($ in millions) FY 2013 FY 2012 $ Var. % Var.
Priority Mail $6,374 5,940 434 7.3%
Parcel Select, Parcel Return & Standard Parcels 2,125 1,456 669 45.9%
First-Class Packages 1,192 876 316 36.1%
Standard Post Mail 344 - 344 -
Priority Mail Express 794 802 (8) -1.0%
Competitive International Mail 2,213 1,837 376 20.5%
Domestic & International Services 698 515 183 35.5%
Total Shipping & Packages Revenue $13,740 11,426 2,314 20.3%
3 USPS FY 2013 Form 10-K at 43.4 Reassessment of contingent liabilities from employment suits currently pending against the Postal Service including the class action EEOC suit on the Postal Service’s National Reassessment Process (NPR) for rehabilitation and limited duty employees. See note 7 to Financial Statements, USPS Form 10-K filing at 93 and 43.

6 2013 FINANCIAL ANALYSIS
a. Personnel Expenses
Salaries account for the largest portion of personnel expenses, representing 63 percent of total personnel costs. The largest benefit costs for current employees are Federal Employee Retirement System (FERS) pension costs (10 percent) and health benefit premiums (9 percent). Total retiree health benefit expenses consisting of current premiums for an annuitant’s health benefits when combined with statutory prefunding RHBF payments make up 15 percent of total personnel expenses, the second largest subcategory of personnel expense, salaries being first.
Table 4 Total Expenses, FY 2012 and FY 2013
Source – PRC derived from USPS National Trial Balance, September 2013
($ in Millions) FY 2013 FY 2012 $ Var. % Var.
Compensation & Benefits Expenses:Salaries $46,328 $47,320 (992) -2.1%
Workers Compensation 1,372 1,388 (16) -1.2%
Annuitant Health Benefits-Current Payment 2,850 2,629 221 8.4%
Other Personnel Related 380 370 11 2.9%
$50,930 $51,707 (777) -1.5%
Transportation 6,735 6630 105 1.6%
Other Expenses 9,174 9186 (12) -0.1%
$66,839 $67,523 (684) -1.0%
Systemwide Personnel Expenses:
Workers Compensation Fair-Value Adjustment (311) 2,341 (2,652) -113.3%
Annuitant Health Benefits-PSRHBF Fund 5,600 11,100 (5,500) -49.5%
Total Expenses $72,128 $80,964 $(8,836) -10.9%
Figure 3 FY 2013 Compensation and Benefits Expense
Source – PRC derived from USPS National Trial Balance, September 2013.
Salaries 63%
Health Benefits 9%
Workers Compensation 2%Other
Personnel Cost 1%
Retirement 10%
Retiree Health Benefit
Premiums 5%
Statutory RHB
Accrual 10%Other
25%
FY 2013 Compensation and Benefits Expense
Salaries $35,638 Health Benefits $4,951
Workers Compensation $1,061 Other Personnel Cost $380
Retirement $5,738 Retiree Health Benefit Premiums $2,850
Statutory RHB Accrual $5,600
Salaries 63%
Health Benefits 9%
Workers Compensation 2%
Other Personnel
Cost 1%
Retirement 10%
Retiree Health Benefit
Premiums 5%
Statutory RHB
Accrual 10%Other
25%
FY 2013 Compensation and Benefits Expense
Salaries $35,638 Health Benefits $4,951
Workers Compensation $1,061 Other Personnel Cost $380
Retirement $5,738 Retiree Health Benefit Premiums $2,850
Statutory RHB Accrual $5,600

POSTAL REGULATORY COMMISSION 7
5 FY 2013 Form 10-K at 31. 6 The new non-career employee designations are: Postal Support Employees (PSEs) for APWU positions, City Carrier Assistants (CCAs), and Mail Handler Assistants (MHAs).7 These limits are generalized. The determination of how many non-career employees are allowed is based on facility, number of career employees by facility, and other considerations. These limits are defined in the contracts.
Overall compensation and benefits expenses were lower than in FY 2012, primarily due to a reduction of approximately 12.3 million workhours. According to the Postal Service, several savings initiatives translated into reductions in overall workhours.5 POStPlan resulted in approximately 2.4 million lower workhours for Postmasters and 5.8 million lower workhours in Customer Service. Network Consolidations resulted in a decrease in the Mail Handlers category workhours of approximately 6.4 million. Increased package volume resulted in increased workhours in City Delivery of approximately 4.8 million over FY 2012.
On a percentage basis, the Postal Service reduced mail processing workhours more than the decline in volume in FY 2013. Reduction in workhours in excess of volume declines implies improvements in productivity. As shown in Figure 4, there have only been 2 years since FY 2005 where the reduction in mail volume has been higher than the reduction in mail processing workhours. In most years, the workhours have been reduced at a greater rate than volume.
The FY 2010-FY 2015 American Postal Workers Union (APWU) Collective Bargaining Agreement contract, in addition to the arbitrated contract decisions with the National Association of Letter Carriers (NALC) and the National Mailhandlers Union (NMHU), allows for a change in employee complement that has begun to affect salary expenses. The new agreement eliminates the Casual and Transitional employee category, leaving only one non-career category6 covered by contract. These non-career employees are entitled to general wage increases, and health benefits after a year of employment, but have a lower annual salary base. Additionally, the previous limitations on the number of non-career employees that could be employed by the Postal Service have been significantly increased. Prior to the negotiation, or arbitration decisions, the limit was generally 10 percent of career employees. This limitation has been increased to 20 percent of career employees.7
Figure 4 Change in Mail Processing Workhours vs. Change in Mail Volume
FY 2006 - FY 2013
Source – Postal Regulatory Commission Annual Compliance Determination Appendix D for FY 2007 – FY 2012, FY 2013 Financial Report Appendix D

8 2013 FINANCIAL ANALYSIS
The Postal Service has taken advantage of these provisions and has significantly increased the proportion of non-career employees in the clerk position. This has contributed significantly to the reduction in the productive hourly rate for clerks over FY 2013.
The number of total career employees declined by approximately 37,000 in FY 2013 due to attrition of career employees and the use of retirement incentives.
In the second quarter of FY 2013, the number of career employees declined by approximately 22,000, primarily as a result of the latest incentivized early retirement/resignation proposal offered to APWU workers. This lowered salary expenses by $639 million or 1.8 percent compared to FY 2012. The increase in annuitant health benefit payments ($221 million) resulting from an increase in the number of retirees is $15 million lower than the health benefit savings gained from attrition of career employees.
There were approximately 8,514 PSE employees hired in FY 2013. A total of 30,428 CCAs and 5,382 MHAs were also added in FY 2013. The increase in non-career employees will affect the average rates of pay for the affected positions. The payroll data for these new non-career employees are just now being included in the data reports and are not yet available to the Commission. However, information filed in the FY 2013 ACR includes estimates of the Productive Average Wage Rate (PAWR) for several positions. This material shows that there have been reductions in the PAWR for several positions, most notably Clerks, Mail Handlers, City Carriers, Vehicle Drivers, and Building Maintenance Personnel.8
Source – Postal Service Active Employee Statistical Summary Reports and National Payroll Hour Summary Reports
Figure 5 Work Force Breakdown
8 The Productive Average Wage Rate is the total compensation and benefits divided by the weighted workhours by craft. See Docket No. ACR2013, USPS answer to CHIR 1, question 1.

POSTAL REGULATORY COMMISSION 9
The reduction in workhours and wage rates has contributed to a significant increase in Total Factor Productivity (TFP) over FY 2012. Part of the improvement is related to the reduction in capital investment, primarily due to the liquidity issues now facing the Postal Service. TFP measures the change in the relationship between outputs (workload processed) and inputs (resource usage) over a period of time. Total workload is calculated using weighted mail volumes, miscellaneous output and the change in delivery points. Resources used consist of labor, materials (including purchased transportation) and deployed capital assets. Workload growth less growth in resources used equals TFP growth. Figure 6 shows the growth in TFP since 1970. During the first two decades (1970 to 1999), labor costs grew despite significant capital investment in automation. This resulted in very little growth in productivity. Total annual growth in TFP averaged only 0.3 percent from FY 1970 to FY 1999. From FY 2000 until FY 2007, the Postal Service aggressively reduced workhours and its employee complement and TFP grew at an average annual rate of 1.5 percent. In FY 2008 and FY 2009, the Postal Service’s inability to reduce workhours to match the large declines in mail volume resulted in declines in TFP. Over the last 4 years, TFP growth has resumed. TFP has increased 1.9 percent in FY 2013, which is the fourth straight year of improvement. Weighted workload declined at the smallest level since FY 2007.9 The increase in package volumes has somewhat offset the significant declines in letter mail volumes leading to the smallest decline in weighted mail
9Mail volumes are weighted by the attributable costs reported in the CRA. The decline in costs and volumes for letter mail was offset somewhat by increases in package volumes and costs, leading to the smaller decline in weighted volumes.
Table 5 Productive Hourly Rate
Source – National Payroll Hours Summary Reports and National Consolidated Trial Balance Reports
Segment/Subsegment FY 2013 FY 2012 % Change
Supervisors & Technicians $49.617 $50.030 -0.8%
Clerks A-J 39.683 41.001 -3.2%
Mail Handlers 40.225 41.393 -2.8%
Clerks & Mail Handlers A-J 39.804 41.103 -3.2%
City Delivery Carriers 42.846 43.607 -1.7%
Vehicle Drivers 41.677 43.206 -3.5%
Rural Carriers 35.146 34.692 1.3%
Building Services 39.706 40.987 -3.1%
Operating Equipment 49.637 48.822 1.7%
Building Equipment 46.375 45.595 1.7%
Motor Vehicle Services 44.932 45.162 -0.5%
City & Rural Carriers 40.315 40.690 -0.9%
Headquarters /1 $63.326 $63.024 0.5%

10 2013 FINANCIAL ANALYSIS
volumes since FY 2007. The reduction in workhours and average wage rates, in addition to the continued restrictions in capital investment deployments, allowed the Postal Service to further reduce resource inputs. An important factor to note is that for the first time since FY 2003, the postal inflation factor, an indication of the change in the cost of the resources used, declined due primarily to the reductions in the average annual wages.
b. Non-Personnel Expenses
Transportation costs accounted for 42 percent of non-personnel costs in FY 2013. Table 6 compares total transportation costs by category for FY 2012 and FY 2013.
Table 6 Transportation Cost by Category FY 2012 and FY 2013
Source – PRC derived from USPS National Trial Balance, September 2013.
($ in Millions) FY 2013 FY 2012 $ Var. % Var.
Highway Transportation $3,409 3,377 32 1.0%
Air Transportation 2,378 2,259 120 5.3%
International Transportation 905 950 (45) -4.7%
Other Transportation 42 44 (2) -5.1%
Total Transportation $6,735 6,630 105 1.6%
Figure 6 U.S. Postal Service
Total Factor Productivity (TFP) 1970-2013
100
105
110
115
120
125
130
135
1970
1972
1974
1976
1978
1980
1982
1984
1986
1988
1990
1992
1994
1996
1998
2000
2002
2004
2006
2008
2010
2012
Inde
x(19
70=1
00)
Fiscal Year
U.S. Postal ServiceTotal Factor Productivity (TFP) 1970-2013
TFP
Average Annual Growth1970 - 99 = 0.3%2000 - 13 = 1.3%
TFP
Average Annual Growth1970 - 99 = 0.3%2000 - 13 = 1.3%
Source – USPS Total Factor Productivity Tables, FY 2013.

POSTAL REGULATORY COMMISSION 11
The Postal Service’s network realignment initiative reduced the overall contract highway miles driven, but not enough to offset slightly higher diesel fuel prices ($3.96 per gallon during FY 2013 compared to $3.93 per gallon during FY 2012). Growth in shipping and package volume of 22 percent over FY 2012 resulted in comparatively higher costs of $120 million in air transportation, or 5.3 percent. These cost increases are primarily in the FedEx Day transportation accounts and explain $118 million of the total air transportation increase. Transaction fees paid to move the mail internationally were $45 million lower in the current year, reducing the overall higher transportation expense for FY 2013. Post Office and processing facility closures and consolidations and a constriction on capital spending due to liquidity restrictions resulted in a $215 million, or 5.8 percent, decrease in property-related costs over prior years.
The replacement of mail transporting equipment in Supplies and Services resulted in additional costs of $144 million over FY 2012. Legal expenses also increased by $16 million over FY 2012 reflecting the re-evaluation of existing legal claims and probable litigation outcomes.
3. Comparison to the Postal Service Operating Plan
Compared to the FY 2013 Operating Plan (Operating Plan), the actual $1 billion net FY 2013 Operating Plan loss was significantly lower than the FY 2012 Operating Plan loss of $2.0 billion. The significant improvement over the FY 2013 Operating Plan was due almost entirely to higher than expected volumes which produced $1.1 billion more revenue than the Postal Service had forecast. Market dominant mail was the primary driver as volumes were 3.6 percent higher than shown in the FY 2013 Operating Plan. However, planned total operating expenses tracked the FY 2013 Operating Plan as shown in Table 8 with only a minor increase of 0.2 percent, or $102 million. Labor-related costs were higher than shown in the FY 2013 Operating Plan due to the retirement incentive of approximately $353 million10 paid to APWU employees in FY 2013.
First-Class Mail and Standard Mail accounted for all of the higher volumes and revenue as compared to the Postal Service’s Operating Plan. As stated in the Postal Service’s financial plan, the Postal Service expected First-Class Mail and Standard Mail volumes to decline 6.1 percent and 3.2 percent respectively. 11 During FY 2013, First-Class Mail volumes declined 4.2 percent, 2 billion pieces less than reflected in the Operating
10 Docket No. ACD2013, January 27, 2013, Postal Service Response to CHIR No. 3, question 3. 11 Postal Service FY 2013 Integrated Financial Plan at 3.
Table 7 Other Expenses FY 2012 and FY 2013
Source – PRC derived from USPS National Trial Balance, September 2013
($ in Millions) FY 2013 FY 2012 $ Var. % Var.
Depreciation and Amortization $1,901 2,075 (174) -8.4%
Rent and Utilities 1,582 1,622 (41) -2.5%
Total Property Expenses $3,483 $3,698 (215) -5.8%

12 2013 FINANCIAL ANALYSIS
Plan, while Standard Mail volumes increased 1.5 percent in FY 2013 rather than declining as had been expected. These higher volume and revenue results correspond to a stronger economy than forecast in the Postal Service’s FY 2013 Operating Plan, especially in retail sales and employment. Total FY 2013 operating expenses were $209 million, or 0.3 percent, under the FY 2013 Operating Plan. Compensation and benefits were in total, $120 million higher than in the FY 2012 Operating Plan as current retiree health payments and separation incentive payments to APWU employees were slightly higher than expected, primarily due to a higher than anticipated number of employees that took advantage of the early retirement offer. Additionally, compensation costs for city delivery and in the Other category, comprised of plant and vehicle maintenance, operational support, postmasters and administration, increased by $308 million over what was budgeted in the FY 2013 Plan. The higher city carrier costs are largely due to higher than anticipated workhour usage during FY 2013. City carrier workhours were 1.8 percent more than in the FY 2013 Operating Plan. Reductions in labor costs were experienced in Customer Service and Retail ($205 million) and Mail Processing ($111 million). Lower compensation and benefits costs for mail processing is likely related to the large number of employees within the mail processing function who took the early retirement incentive and also an increase in the number of lower paid non-career employees. Thus, despite a higher than budgeted usage of workhours, the lower average wage resulted in the smaller than budgeted cost.12
Table 8
FY 2013 Expenses Compared to Plan
Source – PRC derived from USPS National Trial Balance, September 2013 and USPS Preliminary Financial Information, September 2013.
($ in Millions) FY 2013 FY 2013 Plan $ Var. % Var.
Compensation & Benefits Expenses: Salaries $46,328 46,241 87 0.2%
Workers Compensation 1,372 1,401 (29) -2.1%
Annuitant Health Benefits-Current Payment 2,850 2,798 52 1.9%
Other Personnel Related 380 370 10 2.7%
50,930 50,810 120 0.2%
Transportation 6,735 6,656 79 1.2%
Other Expenses 9,174 9,271 (97) -1.0%
66,839 66,737 102 0.2%
Systemwide Personnel Expenses:
Workers Compensation Fair-Value Adjustment (311) - (311) 0.0%
Annuitant Health Benefits-PSRHBF Fund 5,600 5,600 - 0.0%
Total Expenses 72,128 72,337 (209) -0.3%
12 USPS Preliminary Financial Information, September 2013 at 3.

POSTAL REGULATORY COMMISSION 13
B. Balance Sheet AnalysisThis section analyzes the Postal Service’s financial condition based on balance sheet data prepared according to U.S. Generally Accepted Accounting Principles (GAAP) comparing two points in time, September 30, 2013 (FY 2013) and September 30, 2012 (FY 2012).
The balance sheet has three parts: assets, liabilities and net assets. The difference between the assets and the liabilities is known as net assets. Working capital is the difference between current assets and current liabilities. The bottom line of a balance sheet must always balance as the difference between total assets and total liabilities is recorded as net assets in the liabilities and net deficiency/surplus section of the statement. This indicates whether assets were financed by borrowing (liability) or by capital contributions and accumulated earnings from prior years. Negative deficiency, another term for capital deficiency, occurs when liabilities are greater than assets.
Table 9 compares the Postal Service’s asset and liability structure for FY 2012 and FY 2013. The analysis is derived from the Postal Service’s Balance Sheet. Current assets are the sum of cash and cash equivalents, receivables and supplies and prepayments. Current assets can be easily converted to cash for financing operations. Noncurrent assets, mainly buildings and equipment (capital assets), are more difficult to convert to cash in a short time. Likewise, current liabilities are obligations that will come due within one year while noncurrent liabilities are long-term financial obligations.
Table 9 Structure of Assets and Liabilities
Source – PRC derived from USPS FY2013 Form 10-K at 76 and 77
Indicator
ValueChange for the period analyzed
$ in millions % of the balance total $ in millions
9/30/2013 9/30/2012 at the end of the period analyzed
9/30/2013
at the beginning of the period analyzed
9/30/2012
Variance % Variance
1 2 3 4 5 6 7AssetsCash, cash equivalents and short term investments 2,638 2,319 12% 10% 319 14%
Receivables 984 918 5% 4% 66 7%
Supplies and prepayments 122 126 1% 1% (4) -3%
1. Current assets, total 3,744 3,363 17% 15% 381 11%
2. Noncurrent assets 17,897 19,248 83% 85% (1,351) -7%
3. Total Assets 21,641 22,611 100% 100% (970) -4%
Liabilities and Net AssetsWorkers’ Compensation 1,322 1,337 2% 2% (15) -1%
Retiree health benefits 16,766 11,205 27% 20% 5,561 50%
Short-term portion of debt 9,800 9,500 16% 17% 300 3%
1. Current Liabilities 36,683 32,109 60% 56% 4,574 14%
Workers’ Compensation 15,918 16,230 26% 28% (312) -2%
Long-term portion of debt 5,200 5,500 8% 10% (300) -5%
2. Noncurrent Liabilities 24,781 25,348 40% 44% (567) -2%
3. Total Liabilities 61,464 57,457 100% 100% 4,007 7%
4. Capital Deficiency (39,823) (34,846) -184% -154% (4,977) 14%
Assets; Liabilities and Net Assets 21,641 22,611 100% 100% (970) -4%

14 2013 FINANCIAL ANALYSIS
As shown in Table 9, the total sum of the Postal Service’s assets includes a large amount of noncurrent assets. Noncurrent assets, consisting mostly of significantly depreciated Buildings and Equipment, comprise 83 percent of total assets. This high percentage reflects the nature of postal operations, which for routine operations rely on a vast delivery network of retail and processing facilities and a vehicle fleet.
Current Liabilities, consisting largely of retiree health benefit obligations and short-term borrowing, contributed to a larger portion, 60 percent, of total liabilities than noncurrent liabilities, 40 percent. The FY 2011, FY 2012, and FY 2013 statutory prefunding obligations for retiree health benefits totaling $16.7 billion comprise 44 percent of current liabilities.13 The bulk of the net liabilities consist of the retiree health benefits fund payments, workers’ compensation liability ($17.2 billion), and the total net debt owed by the Postal Service to the Federal Financing Bank ($15 billion).
In FY 2013, the Postal Service’s total liabilities exceeded the total value of assets by $39.8 billion. The large net deficiency results from annual net operating losses since FY 2006, the slow replacement of fully depreciated capital assets, and the high amount of employee related liabilities. These deficits indicate that the Postal Service’s financial state is quite precarious. All current activity is financed with internally generated cash, which severely limits the Postal Service’s capability to invest in productive assets. The initial capital contributions, coupled with small surpluses in the years prior to FY 2006, are not sufficient to fund all the Postal Service’s current obligations. Figure 7 shows the Postal Service’s asset and liability structure as of September 30, 2013.
13 The Postal Service has stated in its FY2013 Form 10-K that, as in the current year, the Postal Service will not make the FY 2014 statutory prefunding retiree health benefit payment due to the Service’s low cash balance and competing obligations that require the use of its cash to continue operations.
Figure 7 FY 2013 Assets and Liabilities

POSTAL REGULATORY COMMISSION 15
1. Assets
During the last year, the assets decreased by $1 billion, or 4 percent to $21.6 billion. Property and Equipment decreased by a net of $1.4 billion, representing 99.7 percent of the decrease in total assets.14 The decrease in the net value of Property and Equipment is mainly due to the capital constraints the Postal Service has been under for the past few years. While current operations can be maintained with existing assets, the Postal Service will need to start reinvesting in new equipment and vehicles to replace its exsiting assets.
As seen in Figure 8, the lack of available working capital has limited capital investments undertaken by the Postal Service in the current and prior two years and has resulted in a lack of growth in key infrastructure assets required for primary postal operations.15 Capital investments in physical resources are necessary to increase productivity. Growth in capital assets with an initial useful life of over one year and used in operations was negative 7 percent due to the lack of investment and continued wear and tear of existing assets.
The U.S. Government Accountability Office (GAO) identified the growth in e-commerce as a revenue growth area for the Postal Service through its competitive NSA products.16 GAO highlighted the Postal Service strengths in last mile delivery and access to large residential buildings as fostering the delivery of single packages to residential addresses in rural areas. For the burgeoning e-commerce market to become a viable option, the Postal Service needs to replace and improve its existing aging vehicles to accommodate the shift in mail mix toward a higher fraction of packages and to invest in new and efficient mail processing technologies and equipment. The Postal Service’s ability to make these investments is impacted by the lack of available working capital.
14 GAAP requires the recording of property and equipment assets at cost rather than fair market value. See Accounting Standards Codification (ASC) 360-10-30.15 See GAO, U.S. Postal Service: Strategy Needed to Address Aging Delivery Fleet, GAO-11-386, May 2011. 16 GAO, U.S. Postal Service: Opportunities to Increase Revenue Exist with Competitive Products; Reviewing Long-Term Results Could Better Inform Promotions Decisions, GAO-13-578 (June 2013), p.18.
Source – PRC derived from USPS Forms 10-K and Annual Reports for FY 2006 - 2013
Figure 8 Growth in Capital Assets

16 2013 FINANCIAL ANALYSIS
17 FY 2013 Form 10-K at 18.18 Merriam-Webster defines tranche as a portion of obligations differentiated from other issues especially by maturity or rate of return.
Current receivables,
5%Cash and
cash equivalents,
12%
Noncurrent assets, 83%
Postal Service Asset Structure on September 30, 2013
Source – PRC derived from USPS FY 2013 Form 10-K at 76
Figure 9 Postal Service Asset Structure on September 30, 2013
2. Total Liabilities
In FY 2013, total liabilities increased by $4 billion. The majority of the increase occurred in current liabilities. The RHBF increased by $5.5 billion and the short-term portion of debt increased by $0.3 billion. These increases were partially offset by decreases in other current liabilities. Deferred revenue, comprised solely of prepaid postage, decreased $1 billion.
The recognition of a correction of prior year sales of Forever Stamps as additional revenue, resulted in a reduction to the balance of deferred revenue reported as a liability in the Postage in the Hands of the Public (PIHOP) account.17
Long-term debt and capital lease obligations decreased $0.4 billion and long-term employee related liabilities, including workers’ compensation decreased $0.2 billion. The decrease in total long-term debt is a result of the maturity of the fixed interest rate notes, with the tranche18 maturing on January 31, 2014 moved to short-term debt, increasing the obligations due within a year and putting additional pressure on Postal Service cash flow.
The long-term portion of workers’ compensation liability is highly sensitive to discount and inflation rates in actuarial estimation, and new and existing claims. Discount rates rose slightly during the current year lowering the long-term workers’ compensation liability. Total workers’ compensation liability decreased 2 percent or $0.3 billion from September 30, 2012.

POSTAL REGULATORY COMMISSION 17
Figure 10 shows the structure of Postal Service liabilities as of September 30, 2013.
C. Debt and Cash Flow AnalysisAs the Commission noted in the FY 2011 ACD, the “availability of cash through operating revenues and debt is the most important requirement of any business organization. Without the ability to generate sufficient cash from business operations, or to access sufficient debt capacity to invest in the business, an organization cannot continue to operate.”19 The issue of the Postal Service’s liquidity levels has been the subject of Commission review in the past four ACDs. In the FY 2008 ACD, the Commission noted that declines in revenues and the inability of the Postal Service to reduce costs fast enough could impede the Postal Service’s ability to meet large year-end and workers’ compensation payments.20 As of the end of FY 2013, the Postal Service has been unable to generate enough cash, either through operations or debt, to make payments for the last 3 years, and anticipates that it will not be able to fund the FY 2014 payment.21
The inability to generate sufficient cash also has affected long-term investment. As the Commission noted in the FY 2012 ACD, the Postal Service had reduced capital spending in order to conserve cash. The Commission stated that if this situation continued, important assets would deteriorate and could cause increases in maintenance costs and potentially impact service performance.22 This concern was also expressed in Docket No. R2013-11, the Exigent Rate Request, where the Commission noted that continued low levels of liquidity which impairs the Postal Service’s ability to invest in needed capital is significant to the entire postal system. Insufficient capital investment could impair the Postal Service’s ability to meet the delivery requirements of the USO, service performance could be impacted, and access to postal services could be substantially impacted. 23
19 Docket No. FY 2011ACD, March 2012, at 22.20 Docket No. FY 2008ACD, March 2009, at 24-25.21 USPS Form 10-K Statement, FY 2013 at 9.22 Docket No. FY 2012ACD, March 2013 at 29.23 Docket No. R2013-11, Order No. 1926, December 24, 2013, at 119.
Current liabilities,
28%
Long Term liabilities,
11% Current portion,
32%
Long Term portion,
29%
Employee related
liabilities, 61%
Postal Service Liabilities Structure on September 30,
2013Figure 10
Postal Service Liabilities Structure on September 30, 2013
Source – PRC derived from USPS FY 2013 Form 10-K at 77

18 2013 FINANCIAL ANALYSIS
At the end of FY 2013, the Postal Service cash and cash equivalents totaled $2.3 billion, almost $240 million higher than FY 2012. This is significantly higher than the $0.8 billion cash forecast in the Postal Service’s Operating Plan. Higher than expected revenues were the primary contributor to the higher cash balance. The total cash available represents about 9 days of operating expenses, at an average daily expense rate of $250 million. Table 10 compares the Postal Service’s cash flow from FY 2007 to FY 2013.
The Postal Service’s overall liquidity, the combination of the end of year cash balance and the Postal Service’s remaining borrowing capacity, is significantly lower due to the Postal Service’s use of debt to finance operations and the overly ambitious RHBF payments. In FY 2012, the Postal Service reached its statutory maximum borrowing limit of $15 billion. Fixed interest rate debt on September 30, 2013 consists of short-term borrowings from the Federal Financing Bank (FFB) of $3.3 billion due within a year and $5.2 billion due after May 2, 2016. In addition to fixed rate notes, the Postal Service has two revolving floating interest rate short-term credit lines which expire at the end of next April and other note provisions that expire at the end of the next fiscal year allowing for borrowing with two days prior notice. The two revolving credit lines were fully drawn on September 30, 2013. Table 11 compares the total liquidity available to the Postal Service in FY 2013 and FY 2012.
Table 10 USPS Cash Flows FY 2007 - 2013
($ in Millions)
Source – PRC derived from USPS FY 2013 Form 10-K
FY 2007
FY 2008
FY 2009
FY 2010
FY 2011
FY 2012
FY 2013
Net Income/(Loss) (5,142) (2,806) (3,794) (8,505) (5,067) (15,906) (4,977) Non-Cash items and Other Cash Flows 2,539 2,367 5,367 5,213 5,561 15,474 5,912 Cash Flows from Investing Activities 500 (1,938) (1,806) (1,518) (1,063) (585) (588) Cash Flows from Financing Activities: Increase (decrease) in debt 2,100 3,000 3,000 1,800 1,000 2,000 0 Payments for Capital Leases (19) (29) (46) (50) (51) (51) (59) U.S. government appropriations - expensed (76) (61) (64) (63) (63) (129) (48) Net Cash (Used) provided by financing activities 2,005 2,910 2,890 1,687 886 1,820 (107) Net Increase/(Decrease) in Cash (98) 533 2,657 (3,123) 317 803 240 Cash Balance BOY 997 899 1,432 4,089 966 1,283 2,086 Cash Balance EOY 899 1,432 4,089 966 1,283 2,086 2,326 Debt Outstanding 4,200 7,200 10,200 12,000 13,000 15,000 15,000

POSTAL REGULATORY COMMISSION 19
As can be seen, since the Postal Service has used the entire statutory limit of available debt by FY 2012, the total liquidity of the Postal Service is limited to the available cash and cash equivalents.
The Postal Service ended FY 2013 with $9.8 billion in principal debt payments due within a year. The long-term debt was reduced by $300 million as a result of near-term maturity dates.
Source – PRC derived from USPS FY 2013 Form 10-K
Table 11 Total USPS Liquidity End of FY 2013 Compared to FY 2012
($ in Millions)
FY 2013 FY 2012
Cash and Cash Equivalents 2,326 2,086 Current Portion of Debt 9,800 9,500 Long-Term Debt 5,200 5,500 Total Debt 15,000 15,000 Statutory Debt Limit 15,000 15,000 Available Debt 0 0 Total Liquidity (Cash + Available Debt) 2,326 2,086

20 2013 FINANCIAL ANALYSIS
POSTAL REGULATORY COMMISSION 21
This section examines volumes, revenues, and attributable costs by class and product.
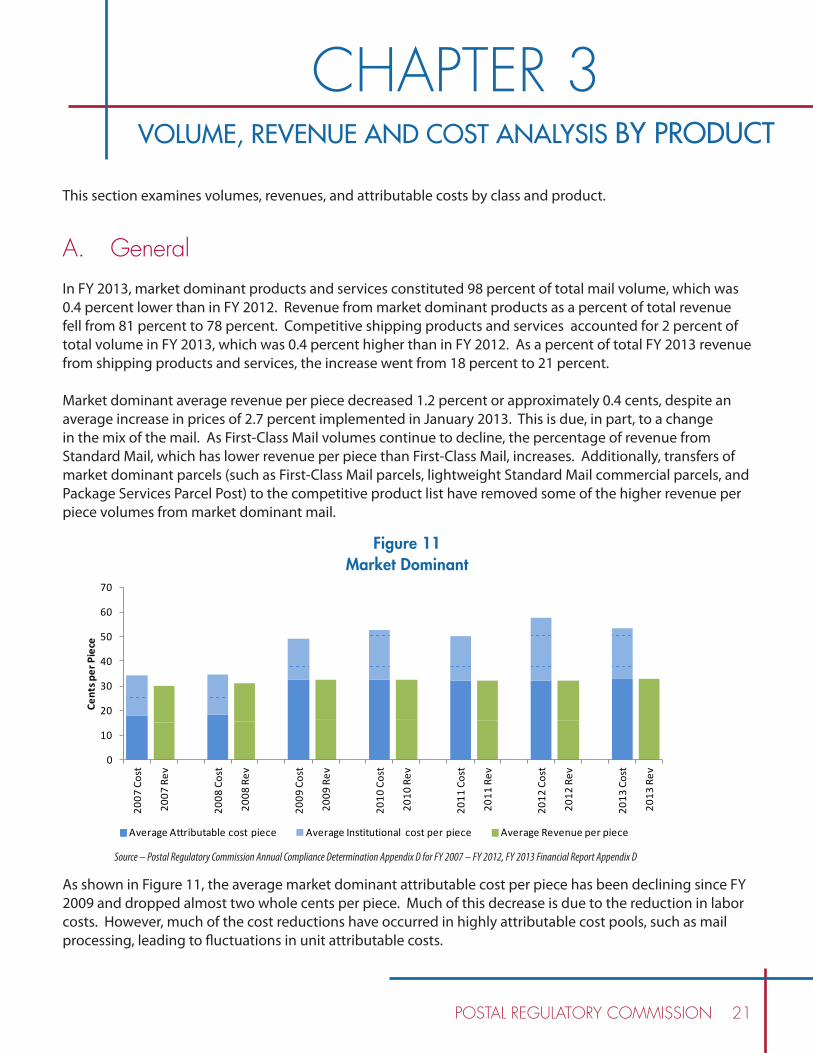
A. General In FY 2013, market dominant products and services constituted 98 percent of total mail volume, which was 0.4 percent lower than in FY 2012. Revenue from market dominant products as a percent of total revenue fell from 81 percent to 78 percent. Competitive shipping products and services accounted for 2 percent of total volume in FY 2013, which was 0.4 percent higher than in FY 2012. As a percent of total FY 2013 revenue from shipping products and services, the increase went from 18 percent to 21 percent.
Market dominant average revenue per piece decreased 1.2 percent or approximately 0.4 cents, despite an average increase in prices of 2.7 percent implemented in January 2013. This is due, in part, to a change in the mix of the mail. As First-Class Mail volumes continue to decline, the percentage of revenue from Standard Mail, which has lower revenue per piece than First-Class Mail, increases. Additionally, transfers of market dominant parcels (such as First-Class Mail parcels, lightweight Standard Mail commercial parcels, and Package Services Parcel Post) to the competitive product list have removed some of the higher revenue per piece volumes from market dominant mail.
As shown in Figure 11, the average market dominant attributable cost per piece has been declining since FY 2009 and dropped almost two whole cents per piece. Much of this decrease is due to the reduction in labor costs. However, much of the cost reductions have occurred in highly attributable cost pools, such as mail processing, leading to fluctuations in unit attributable costs.
CHAPTER 3VOLUME, REVENUE AND COST ANALYSIS BY PRODUCT
Figure 11 Market Dominant
0
10
20
30
40
50
60
70
2007
Cos
t
2007
Rev
2008
Cos
t
2008
Rev
2009
Cos
t
2009
Rev
2010
Cos
t
2010
Rev
2011
Cos
t
2011
Rev
2012
Cos
t
2012
Rev
2013
Cos
t
2013
Rev
Cent
s per
Pie
ce
Market Dominant
Average Attributable cost piece Average Institutional cost per piece Average Revenue per piece
Source – Postal Regulatory Commission Annual Compliance Determination Appendix D for FY 2007 – FY 2012, FY 2013 Financial Report Appendix D

22 2013 FINANCIAL ANALYSIS
The average revenue per piece of shipping products and services decreased 2.0 percent or 8.92 cents, despite an average increase in shipping products and services prices of 5.8 percent for Priority Express Mail (formerly Express Mail) and 6.3 percent for Priority Mail products implemented in January 2013. The transfer of market dominant parcels to the competitive product list reduced the average revenue per piece. The revenue per piece of the transferred products, even after the price increases, was lower than most other competitive products.
The decrease in average revenue per piece accompanied a 4.6 percent decrease in average cost per piece in FY 2013, yielding an increase of 4.5 percent in average contribution per piece. The products transferred in FY 2013, Standard Post mail and First-Class Package International Service, cover their attributable costs by 100.9 percent and 119 percent, respectively. Like the reduction in average revenue per piece, the reduction in unit costs for competitive products can be traced to the transfer of market dominant products to the competitive product list. Most of the decline in unit costs occurred during FY 2012 when the transfers were implemented24 and, while every category of competitive products unit costs declined in FY 2012, during FY 2013, only the unit costs of Priority Express, First-Class Package Service, and Parcel Return Service declined.
24 Lightweight commercial First-Class parcels, lightweight Standard Mail parcels, certain PO Box services, Package Services Parcel Post, and First-Class Package International Service were transferred to competitive products over FY 2012 and 2013, USPS Form 10-K statement at 5.
Figure 12 Competitive Products
Source – Postal Regulatory Commission Annual Compliance Determination Appendix D for FY 2007 – FY 2012, FY 2013 Financial Report Appendix D
0
100
200
300
400
500
600
700
2007
Cos
t
2007
Rev
2008
Cos
t
2008
Rev
2009
Cos
t
2009
Rev
2010
Cos
t
2010
Rev
2011
Cos
t
2011
Rev
2012
Cos
t
2012
Rev
2013
Cos
t
2013
Rev
Cent
s per
Pie
ce
Competitive Products
Average Attributable cost per piece Average Institutional cost per piece Average Revenue per piece

POSTAL REGULATORY COMMISSION 23
As shown in Figure 13, total institutional costs, both including and excluding statutory retiree health benefit accruals, have increased since FY 2003.
Institutional costs, excluding accruals to the RHBF, have increased 6 percent since FY 2007. The primary driver of institutional cost, other than the RHBF payments, is the street portion of delivery costs. In general, these costs do not vary with volume because the carriers must travel the delivery route regardless of the amount of mail they are carrying. In contrast, mail processing costs vary directly with volume. The Postal Service has been able to reduce mail processing costs to largely correspond to the decline in mail volume. Mail processing costs are considered 100 percent attributable, whereas city carrier costs are only 30 percent attributable.
The direct costs of mail processing and city carrier in-office costs have been declining since FY 2003 and are now less than 22 percent of total accrued costs. City carrier street costs and rural carrier costs now amount to over 28 percent of total accrued costs, a significant increase since FY 2003. Figure 14 illustrates this trend.
Figure 13 Institutional Costs
Source – PRC derived from USPS Cost and Revenue Analysis Reports for FY 2003 – FY 2013
Source – PRC derived from USPS Cost and Revenue Analysis Reports for FY 2003-FY 2013

24 2013 FINANCIAL ANALYSIS
This trend suggests that institutional costs as a share of total costs are likely to rise in the future. Revenue per piece by class is capped at inflation; therefore it is difficult for the Postal Service to cover increases in institutional costs through rate increases.
B. Product and Category 1. First-Class Mail
As a percent of total volume, First-Class Mail fell from over 43 percent in FY 2012 to just above 42 percent in FY 2013. There were declines in all categories of First-Class Mail except Domestic NSA and Inbound International & NSA Mail. Presort and Single-Piece First-Class Mail each lost over 1.2 billion pieces. The largest percentage decline of 15.5 percent was in First-Class Mail parcels. (This could be the result of market dominant mail migrating to the competitive product First-Class Package Service.) International outbound mail volume also showed a double-digit decline of 12.2 percent, as First-Class Package International was transferred to the competitive product list on January 27, 2013.
Total First-Class Mail revenues declined almost $1 billion in FY 2013 despite an increase in rates and changes in mail mix that resulted in higher revenue of $500 million. Slightly more than half of the revenue decline, $522 million, occurred in First-Class Mail letters. First-Class Mail Flats ($147 million decline), First-Class Parcels ($68 million decline), and Outbound First-Class International ($207 million decline) accounted for most of the remaining drop in revenues.
Figure 14 Comparison of Mail Processing and Delivery Costs to Total Costs
Source – PRC derived from USPS Cost and Revenue Analysis Reports for FY 2003 – FY 2013

POSTAL REGULATORY COMMISSION 25
Table 12 First-Class Mail Volumes and Revenues, FY 2012 and FY 2013
Source - USPS Revenue, Pieces and Weight Reports for FY 2013 and FY 2012
Mail Volume Mail Revenue
FY 2013 (in millions)
FY 2012 (in millions)
Increase or Decrease (in millions)
% Change
FY 2013 (in millions)
FY 2012 (in millions)
Increase or Decrease (in millions) % Change
Single Piece:
Letters 21,524.3 22,734.7 (1,210.42) -5.3% 10,162.2 10,524.3 (362.1) -3.4%
Cards 1,052.9 1,157.3 (104.41) -9.0% 352.1 367.5 (15.4) -4.2%
Presort: 38,724.9 39,935.9 (1,211.00) -3.0% 14,319.6 14,479.3 (159.7) -1.1%
Letters 2,419.3 2,588.1 (168.85) -6.5% 586.9 604.6 (17.7) -2.9%
Cards 1,898.6 2,048.0 (149.43) -7.3% 2,519.7 2,666.7 (146.9) -5.5%
Flats 247.7 293.3 (45.53) -15.5% 579.9 648.4 (68.5) -10.6%
Parcels 213.5 209.6 3.96 1.9% 75.4 73.7 1.6 2.2%
Domestic NSA Mail 231.5 263.5 (32.07) -12.2% 457.6 665.0 (207.3) -31.2%
International First Class - Outbound 387.7 386.3 1.40 0.4% 281.4 252.4 29.1 11.5%
Inbound International & NSA Mail 136.5 139.6 (3.2) -2.3%
Fees 66,700.4 69,616.8 (2,916.36) -4.2% 29,471.3 30,421.4 (950.1) -3.1%
Total First Class Mail
Although the decline in volumes for First-Class Mail was significant, the Postal Service’s Operating Plan had forecast a much larger reduction. Compared to the Operating Plan, total First-Class Mail volumes were 1.3 billion pieces higher than expected, which led to additional revenue of almost $2 billion over the planned revenue. Most of the improvement in First-Class Mail volumes was due to higher than projected economic activity during FY 2013. Additionally, during quarter 4 of FY 2013, the Postal Service adjusted First-Class Mail revenues to reflect higher Forever stamp usage than had previously been assumed. Part of the additional revenue can be attributed to this accounting change rather than an increase in actual volumes or the result of the January 2013 rate increase.

26 2013 FINANCIAL ANALYSIS
Total attributable costs for First-Class Mail declined in FY 2013, mainly as a result of reductions in postmasters, supervisors, mail processing, city carrier in-office direct labor, and rural carriers.
Table 13 Total Attributable Costs for First-Class Mail FY 2011- FY 2013
Source – FY 2013 based on Appendix A, Financial Report, FY 2012 and FY 2011 based on PRC-LR-1
($ 000)FY 2013 FY 2012 % change FY 2011 % change
First-Class Mail Single Piece Letters 5,905,238 6,276,049 -5.91% 6,848,209 -8.35% Single Piece Cards 291,436 297,063 -1.89% 336,435 -11.70% Total Single Piece Letters and Cards 6,196,674 6,573,112 -5.73% 7,184,644 -8.51% Presort Letters 4,604,618 4,949,285 -6.96% 4,963,359 -0.28% Presort Cards 195,388 214,785 -9.03% 220,231 -2.47% Total Presort Letters and Cards 4,800,006 5,164,070 -7.05% 5,183,590 -0.38% Single-Piece Flats 1,192,085 1,284,282 -7.18% 1,488,616 -13.73% Presort Flats 493,578 506,763 -2.60% 457,783 10.70% Total Flats 1,685,662 1,791,045 -5.88% 1,946,399 -7.98% Single-Piece Parcels 583,503 659,147 -11.48% 1,143,605 -42.36% Presort Parcels 0 0 25,369 -100.00% Total Parcels 583,503 659,147 -11.48% 1,168,973 -43.61% First-Class Domestic NSAs 22,836 27,530 0 Outbound First-Class International 321,532 438,548 -26.68% 438,476 0.02% Inbound International Single-Piece Letters 227,964 199,495 14.27% 249,704 -20.11% Total First-Class 13,838,177 14,852,948 -6.83% 16,171,786 -8.16%
Table 14 Unit Attributable Costs for First-Class Mail FY 2011- FY2013
Source – FY 2013 based on Appendix A, Financial Report, FY 2012 and FY 2011 based on PRC-LR-1
(Cents per Piece)FY 2013 FY 2012 % change FY 2011 % change
First-Class Mail Single Piece Letters 27.53 27.58 -0.18% 27.89 -1.12% Single Piece Cards 27.78 25.65 8.31% 25.96 -1.21% Total Single Piece Letters and Cards 27.54 27.49 0.20% 27.80 -1.12% Presort Letters 11.89 12.39 -4.05% 11.89 4.22% Presort Cards 8.08 8.30 -2.68% 8.00 3.77% Total Presort Letters and Cards 11.67 12.14 -3.93% 11.65 4.24% Single-Piece Flats 93.95 91.27 2.94% 94.39 -3.31% Presort Flats 78.90 78.94 -0.04% 70.01 12.75% Total Flats 88.98 87.40 1.80% 87.25 0.18% Single-Piece Parcels 236.06 224.65 5.08% 184.06 22.05% Presort Parcels 152.25 -100.00% Total Parcels 236.06 224.65 5.08% 183.23 22.60% First-Class Domestic NSAs 10.69 13.14 -18.59% Outbound First-Class International 138.91 166.40 -16.52% 141.29 17.77% Inbound International Single-Piece Letters 102.05 95.28 7.10% 104.88 -9.15% Total First-Class 20.82 21.38 -2.61% 21.93 -2.48%

POSTAL REGULATORY COMMISSION 27
Although the total average attributable unit cost for First-Class Mail declined in FY 2013, the average unit costs for city delivery street time, vehicle service drivers, miscellaneous operating costs, supplies and services, and equipment depreciation increased over FY 2012. The largest increases in unit costs occurred in single-piece cards, flats, and parcels. The increases were largest in mail processing and city carrier street time. The reason why these increases occurred is not clearly definitive in this ACR. The Commission is currently exploring this issue.
2. Standard Mail
Standard Mail volumes increased as a percentage of total mail volume to 51 percent, an additional 1 percent over FY 2012. Standard Mail revenue as a percentage of total revenue remained the same as FY 2012 at almost 26 percent.
During FY 2013, Standard Mail letters, carrier route, and Every Door Direct Mail (EDDM) accounted for the bulk of the increase of total Standard Mail volumes. The significant reduction in Standard Mail parcel volume was due mostly to the continuing transfer of lightweight parcels to the competitive product Parcel Select which began in FY 2012. The volume of Standard Mail Flats is also declining, continuing a trend that began in FY 2006, though the rate of decline is less in FY 2013 than in previous years.
Source - USPS Revenue, Pieces and Weight Reports for FY 2012 and FY 2013
Table 15 Standard Mail Volume and Revenue FY 2012 and FY 2013
Mail Volume Mail Revenue
FY 2013 (in millions)
FY 2012 (in millions)
Increase or Decrease
(in millions) % ChangeFY 2013
(in millions)FY 2012
(in millions)
Increase or Decrease
(in millions) % Change
High Density & Satur. Ltrs. 5,711.6 5,563.6 148.1 2.7% 805.2 766.9 38.28 5.0%
High Density & Satur. Flt/Pcls 11,337.7 11,319.9 17.8 0.2% 1,929.8 1,887.1 42.70 2.3%
Carrier Route 9,507.3 9,119.9 387.3 4.2% 2,372.6 2,244.3 128.30 5.7%
Letters 46,754.3 46,149.8 604.4 1.3% 9,263.7 8,979.3 284.40 3.2%
Flats 5,568.0 5,939.6 (371.6) -6.3% 2,134.1 2,229.6 (95.46) -4.3%
Parcels 72.4 303.6 (231.1) -76.1% 70.5 284.9 (214.37) -75.3%
Every Door Direct Mail Retail 974.8 450.4 524.4 116.4% 138.4 64.0 74.47 116.4%
Domestic NSA Mail 1,036.5 952.8 83.6 8.8% 214.6 194.8 19.87 10.2%
International NSA Mail - 1.3 (1.3) -100.0% 0.1 0.7
Fees 56.3 61.8 (5.49) -8.9%
Total Standard Mail 80,962.6 79,801.0 1,161.5 1.5% 16,985.3 16,713.3 272.08 1.6%

28 2013 FINANCIAL ANALYSIS
As with volumes, Standard Mail Letters, Carrier Route, and EDDM25 accounted for the bulk of the increase in Standard Mail revenues. The largest decline in revenue can be attributed to the reductions in Standard Mail parcels, most of which were transferred to the Parcel Select competitive product.
Total attributable costs for Standard Mail declined from FY 2012 by almost $405 million, primarily from reductions in mail processing and city delivery in-office costs. Only carrier route costs increased over FY 2012.
25 The Postal Service projected revenue of $100 million from EDDM in FY 2013, GAO, U.S. Postal Service: Overview of Initiatives to Increase Revenue and Introduce Nonpostal Services and Experimental Postal Products Report, GAO-13-216, (Washington, D.C.; January, 2013) at 21.
Table 16 Total Attributable Costs Standard Mail FY 2011- FY 2013
Source – FY 2013 based on Appendix A, Financial Report, FY 2012 and FY 2011 based on PRC-LR-1
($ 000)FY 2013 FY 2012 % change FY 2011 % change
Standard Mail High Density and Saturation Letters 341,411 346,973 -1.60% 349,010 -0.58% High Density and Saturation Flats and Parcels 842,701 900,140 -6.38% 882,761 1.97% Every Door Direct Mail 38,458 0 0 Carrier Route 1,778,661 1,720,605 3.37% 1,642,311 4.77% Letters 4,902,887 5,045,520 -2.83% 5,274,622 -4.34% Flats 2,514,246 2,761,670 -8.96% 3,139,029 -12.02% Not Flat-Machinables and Parcels 109,645 337,853 -67.55% 767,298 -55.97% Standard Mail NSAs 93,119 103,884 -10.36% 23,281 346.21% Standard Mail International 1 148 87 Total Standard Mail 10,621,129 11,216,793 -5.31% 12,078,399 -7.13%
Table 17 Unit Attributable Costs Standard Mail FY 2011- FY 2013
Source – FY 2013 based on Appendix A, Financial Report, FY 2012 and FY 2011 based on PRC-LR-1
(Cents per Piece)FY 2013 FY 2012 % change FY 2011 % change
Standard Mail High Density and Saturation Letters 5.98 6.24 -4.15% 6.17 1.03% High Density and Saturation Flats and Parcels 7.43 7.65 -2.81% 7.73 -1.03% Every Door Direct Mail 3.95 Carrier Route 18.71 18.87 -0.84% 17.53 7.61% Letters 10.49 10.93 -4.08% 10.43 4.85% Flats 45.16 46.50 -2.88% 46.28 0.47% Not Flat-Machinables and Parcels 152.36 111.30 36.89% 104.57 6.43% Standard Mail NSAs 8.98 10.90 -17.59% 16.18 -32.61% Standard Mail International 0.84 11.01 -92.39% 12.23 -9.92% Total Standard Mail 13.12 14.06 -6.67% 14.26 -1.44%
POSTAL REGULATORY COMMISSION 29
The average attributable unit cost for all categories of Standard Mail, except Standard Mail Parcels, declined in FY 2013. There was a significant unit attributable cost increase in mail processing for Standard Mail parcels over FY 2012, primarily due to the transfer of the lighter weight parcels to Parcel Select. The parcel volume remaining in Standard Mail is comprised of heavier and more non-machinable parcels that are more expensive to process and deliver. Standard Mail NSA unit attributable costs also declined during FY 2013. Most of the decline is due to a change in the mix of mail within the NSA. Reductions in the use of Mixed AADC and AADC volumes, offset by greater use of 3-Digit and 5-Digit presorted mail, accounted for the decline in this product.
3. Periodicals Mail
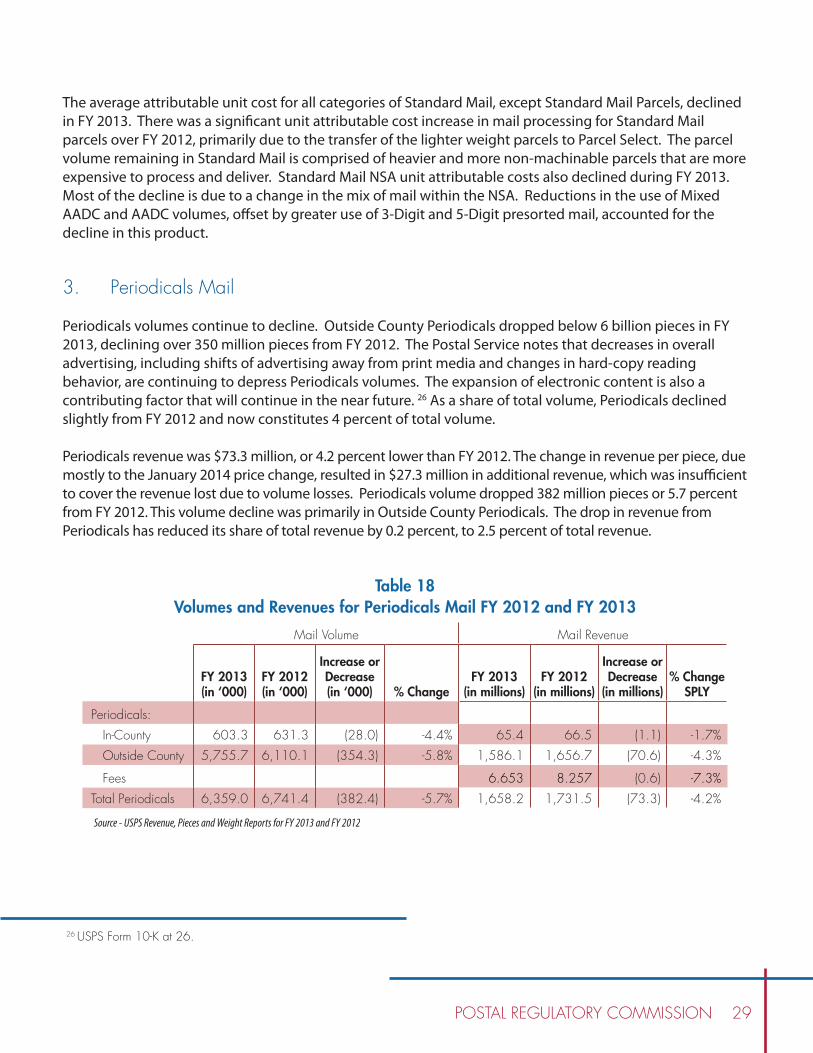
Periodicals volumes continue to decline. Outside County Periodicals dropped below 6 billion pieces in FY 2013, declining over 350 million pieces from FY 2012. The Postal Service notes that decreases in overall advertising, including shifts of advertising away from print media and changes in hard-copy reading behavior, are continuing to depress Periodicals volumes. The expansion of electronic content is also a contributing factor that will continue in the near future. 26 As a share of total volume, Periodicals declined slightly from FY 2012 and now constitutes 4 percent of total volume.
Periodicals revenue was $73.3 million, or 4.2 percent lower than FY 2012. The change in revenue per piece, due mostly to the January 2014 price change, resulted in $27.3 million in additional revenue, which was insufficient to cover the revenue lost due to volume losses. Periodicals volume dropped 382 million pieces or 5.7 percent from FY 2012. This volume decline was primarily in Outside County Periodicals. The drop in revenue from Periodicals has reduced its share of total revenue by 0.2 percent, to 2.5 percent of total revenue.
26 USPS Form 10-K at 26.
Table 18 Volumes and Revenues for Periodicals Mail FY 2012 and FY 2013
Source - USPS Revenue, Pieces and Weight Reports for FY 2013 and FY 2012
Mail Volume Mail Revenue
FY 2013 (in ‘000)
FY 2012 (in ‘000)
Increase or Decrease (in ‘000) % Change
FY 2013 (in millions)
FY 2012 (in millions)
Increase or Decrease
(in millions)% Change
SPLY
Periodicals:
In-County 603.3 631.3 (28.0) -4.4% 65.4 66.5 (1.1) -1.7%
Outside County 5,755.7 6,110.1 (354.3) -5.8% 1,586.1 1,656.7 (70.6) -4.3%
Fees 6.653 8.257 (0.6) -7.3%
Total Periodicals 6,359.0 6,741.4 (382.4) -5.7% 1,658.2 1,731.5 (73.3) -4.2%
30 2013 FINANCIAL ANALYSIS
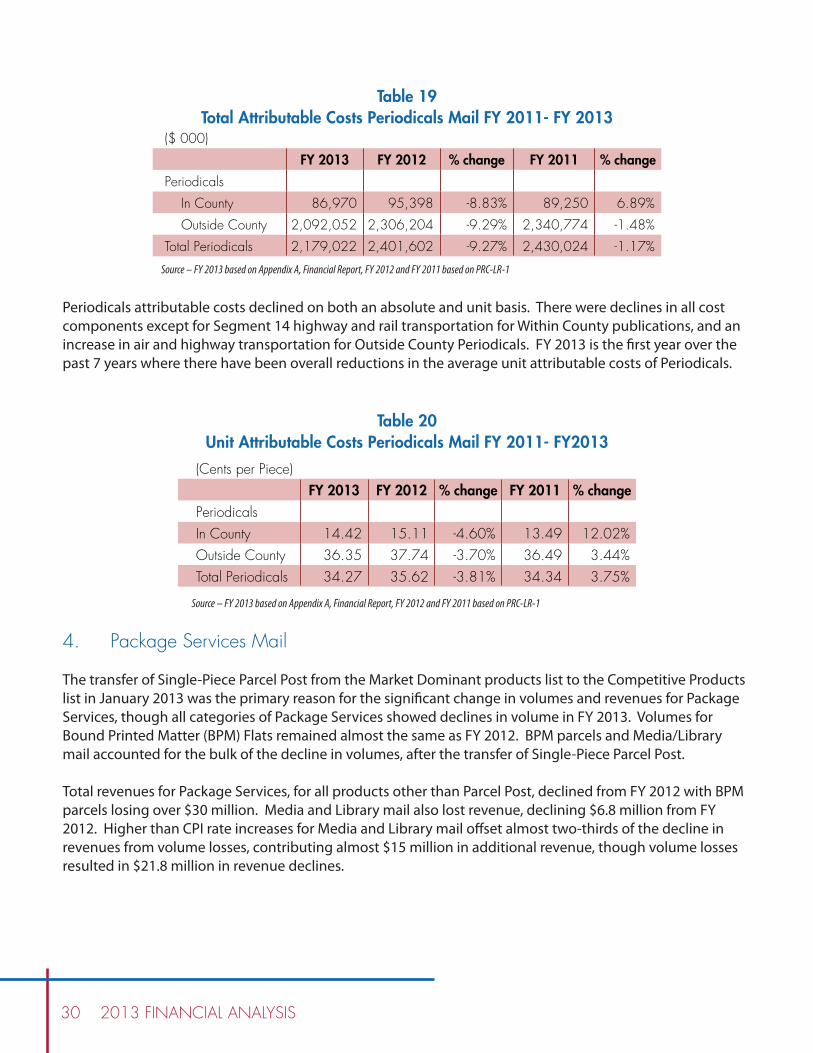
Periodicals attributable costs declined on both an absolute and unit basis. There were declines in all cost components except for Segment 14 highway and rail transportation for Within County publications, and an increase in air and highway transportation for Outside County Periodicals. FY 2013 is the first year over the past 7 years where there have been overall reductions in the average unit attributable costs of Periodicals.
4. Package Services Mail
The transfer of Single-Piece Parcel Post from the Market Dominant products list to the Competitive Products list in January 2013 was the primary reason for the significant change in volumes and revenues for Package Services, though all categories of Package Services showed declines in volume in FY 2013. Volumes for Bound Printed Matter (BPM) Flats remained almost the same as FY 2012. BPM parcels and Media/Library mail accounted for the bulk of the decline in volumes, after the transfer of Single-Piece Parcel Post.
Total revenues for Package Services, for all products other than Parcel Post, declined from FY 2012 with BPM parcels losing over $30 million. Media and Library mail also lost revenue, declining $6.8 million from FY 2012. Higher than CPI rate increases for Media and Library mail offset almost two-thirds of the decline in revenues from volume losses, contributing almost $15 million in additional revenue, though volume losses resulted in $21.8 million in revenue declines.
Table 19 Total Attributable Costs Periodicals Mail FY 2011- FY 2013
Source – FY 2013 based on Appendix A, Financial Report, FY 2012 and FY 2011 based on PRC-LR-1
($ 000)
FY 2013 FY 2012 % change FY 2011 % change
Periodicals
In County 86,970 95,398 -8.83% 89,250 6.89%
Outside County 2,092,052 2,306,204 -9.29% 2,340,774 -1.48%
Total Periodicals 2,179,022 2,401,602 -9.27% 2,430,024 -1.17%
Table 20 Unit Attributable Costs Periodicals Mail FY 2011- FY2013
Source – FY 2013 based on Appendix A, Financial Report, FY 2012 and FY 2011 based on PRC-LR-1
(Cents per Piece)FY 2013 FY 2012 % change FY 2011 % change
PeriodicalsIn County 14.42 15.11 -4.60% 13.49 12.02%Outside County 36.35 37.74 -3.70% 36.49 3.44%Total Periodicals 34.27 35.62 -3.81% 34.34 3.75%

POSTAL REGULATORY COMMISSION 31
Table 21 Volumes and Revenues for Package Services FY 2012 and FY 2013
Source - USPS Revenue, Pieces and Weight Reports for FY 2013 and FY 2012
Mail Volume Mail Revenue
FY 2013 (in millions)
FY 2012 (in millions)
Increase or Decrease
(in millions) % ChangeFY 2013
(in millions)FY 2012
(in millions)
Increase or Decrease
(in millions) % Change
Single-Piece Parcel Post 29.549 70.945 -41.396 -58.3% 339.075 773.799 -434.724 -56.2%
Bound Printed Matter Flats 229.613 230.521 -0.908 -0.4% 184.772 185.789 -1.017 -0.5%
Bound Printed Matter Parcels 216.387 243.307 -26.92 -11.1% 274.589 305.489 -30.9 -10.1%
Media & Library Mail 93.537 100.365 -6.828 -6.8% 313.655 320.464 -6.809 -2.1%
Inbound Surf. Parcel Post (UPU Rates) 0.906 1.115 -0.209 -18.7% 17.933 20.908 -2.975 -14.2%
International NSA Mail 0.001 0.008 -0.007 0.0% 0.002 0.018 -0.016 0.0%
Fees 2.895 3.249
Total Package Services 569.993 646.261 -76.268 -11.8% 1130.026 1606.467 -476.441 -29.7%
Package Services’ attributable costs declined significantly, mainly due to the transfer of market dominant product Single-Piece Parcel Post to the competitive product Standard Post. Of the total $530 million reduction in costs, $510 million was due to the transfer to the competitive product Parcel Post. Total attributable costs for all other products declined in FY 2013. On a unit attributable cost basis, only BPM Flats and Parcels Mail increased. Most of these unit increases were in delivery costs, as city carrier, street, and rural carrier unit costs increased for these products. There were also unit cost increases in all components of transportation for BPM parcels and an increase in unit air and rail transportation costs for BPM Flats.
Source – FY 2013 based on Appendix A, Financial Report, FY 2012 and FY 2011 based on PRC-LR-1
($ 000)
FY 2013 FY 2012 % change FY 2011 % change
Package Services
Alaska Bypass 10,304 0 0
Single Piece Parcel Post 330,644 840,359 -60.65% 821,119 2.34%
Bound Printed Matter Flats 130,418 138,302 -5.70% 125,417 10.27%
Bound Printed Matter Parcels 263,130 281,152 -6.41% 314,562 -10.62%
Media and Library Mail 372,402 376,770 -1.16% 431,068 -12.60%
International Package Services 11,597 11,597 0.00% 10,727 8.11%
Total Package Services 1,118,495 1,648,180 -32.14% 1,702,892 -3.21%
Table 22 Total Attributable Costs Periodicals Services FY 2011- FY 2013

32 2013 FINANCIAL ANALYSIS
Table 23 Unit Attributable Costs Periodicals Services FY 2011- FY 2013
Source – FY 2013 based on Appendix A, Financial Report, FY 2012 and FY 2011 based on PRC-LR-1
(Cents per Piece)
FY 2013 FY 2012 % change FY 2011 % change
Package Services
Alaska Bypass 795.88 0.00 0.00
Single Piece Parcel Post 1,170.02 1,184.09 -1.19% 1,169.39 1.26%
Bound Printed Matter Flats 56.80 60.00 -5.33% 49.80 20.47%
Bound Printed Matter Parcels 121.60 115.55 5.23% 128.25 -9.90%
Media and Library Mail 393.98 375.19 5.01% 399.77 -6.15%
International Package Services 1,278.74 1,032.74 23.82% 1,040.45 -0.74%
Total Package Services 195.89 255.00 -23.18% 251.84 1.26%
5. Market Dominant Services
Market dominant Special Services include Certified, Insurance, Money Orders, PO Boxes, and other products that enhance market dominant products. Total revenues declined approximately $270 million in FY 2013, primarily due to reductions in fees from the Delivery Confirmation (now USPS Tracking) product. In January 2013, the Postal Service expanded tracking services for competitive products. Products that previously charged for the tracking service are now being offered this service at no cost. As a result, fee revenue from USPS Tracking service is significantly lower. This decrease accounts for almost $157 million of the decline in total Special Services revenues. The remaining reductions in revenues occurred in Registry, Stamped Envelopes and Cards, Return Receipts, and PO Boxes. Much of the reduction in PO Box revenue occurred following the transfer of certain PO Boxes to the competitive products list.
Attributable costs for market dominant Special Services declined $489 million from FY 2012. Attributable costs for most products declined. Over half of the cost reduction is related to the costs of providing no cost USPS Tracking that were transferred to the product, rather than attributed to the service. Additionally, about $85 million in PO Box costs were transferred to the competitive PO Box product, as the Postal Service designated more boxes as competitive products during FY 2013.
Table 24 Market Dominant Special Service Revenues
Source – FY 2013 based on Appendix A, Financial Report, FY 2012 and FY 2011 based on PRC-LR-1
($ 000)
FY 2013 FY 2012 % change FY 2011 % change
Total Market Dominant Services 1,350,349 1,840,079 -26.6% 2,137,583 -13.9%

POSTAL REGULATORY COMMISSION 33
Table 25 Total Attributable Costs for Market Dominant Special Services
Source – FY 2013 based on Appendix A, Financial Report, FY 2012 and FY 2011 based on PRC-LR-1
($ 000)
FY 2013 FY 2012 % change FY 2011 % change
Total Market Dominant Services 2,068,226 2,334,595 -11.41% 2,796,332 -16.51%
6. Competitive Products
Competitive products continue to make up a low 2 percent of total mail volume; however, their share of total revenue increased to 20.7 percent in FY 2013 compared to 17.5 percent in FY 2012. With the exception of Priority Express Mail, volume and revenue increased for all competitive products.
Competitive products volumes grew significantly over FY 2013, though a significant portion of the increase followed the transfer of First-Class Mail commercial parcels and lightweight Standard Mail parcels from the market dominant product list to the competitive product list. Even without these transfers, competitive products showed healthy volume growth in most products. Priority Mail volumes grew 6 percent over FY 2012 indicating that the Postal Service has been successfully marketing the Priority Mail Flat Rate envelopes and boxes during FY 2013. The growth in First-Class Package Service is influenced by the continuing transfer of products, but the bulk of the increase is from new volume. Parcel Select and Parcel Return Service also exhibited strong growth in FY 2013, with Parcel Return Service volume increasing over 9 percent compared to FY 2012.
Revenues increased almost 19 percent in 2013, or over $2 billion. The largest contributors to this growth in revenue are First-Class Package Service, Priority Mail, and Parcel Select. Most of the increase in revenue was due to the increased volumes in competitive products, adding over $1.1 billion in additional revenue from FY 2012, not including additional revenue from transferred market dominant products. The transfer of Single-Piece Parcel Post to the competitive product list, now labeled Standard Post, added over $340 million to the competitive products revenue increase. The January 27, 2013 rate increase, which averaged about 9 percent, for all products generated approximately $160 million in additional revenue. International competitive products also showed significant increases in revenues due to changes in revenue per piece. This total change accounted for $307 million in additional revenue. However, it was the growth in volume that contributed 75 percent of the total growth in competitive products revenues. The additional volume in competitive products added $1.6 billion to the total growth in Postal Service revenue.

34 2013 FINANCIAL ANALYSIS
Due to the competitive nature of the individual products, the Postal Service does not publicly report attributable costs by product. Therefore, this discussion is limited to the overall attributable costs for competitive products. FY 2013 individual product costs can be found in the Postal Service’s ACR filing, in non-public library references USPS-FY13-NP11 and USPS-FY13-NP12.
Total competitive product attributable costs have increased over 18 percent from FY 2012 due partially to the transfer of the former Single-Piece Parcel Post to the new Standard Post competitive product, increases in First-Class Package Services, and additional transfers of PO Boxes to the competitive product list. These increases in costs accounted for almost 40 percent of the increase in total competitive product attributable cost increases. Most of the increase in costs is primarily due to increasing volumes of competitive products, particularly for Priority Mail and Parcel Select. There were increasing costs across-the-board in all cost segments. On a unit basis, total competitive product unit costs declined by almost 4 percent in FY 2013. This decline is due primarily to the addition of the lower unit costs of the transferred market dominant products and reductions in Priority Express costs, although the unit costs of Parcel Select increased over FY 2012. Priority Mail unit costs did not change in FY 2013 while unit costs of Parcel Select increased almost 11 percent over FY 2012. The Postal Service explained that eligibility requirements for Parcel Select may have caused more heavy-weight pieces to migrate from Standard Post and market dominant Parcel Post. These heavy-weight pieces are characteristic of Parcel Post which is heavier and less presorted and requires more mail processing and transportation resources.27
27 Postal Service Response to CHIR No. 2, questions 3 and 4, January 14, 2014.
Table 26 Competitive Products Volume and Revenue FY 2012 and FY 2013
Source - USPS Revenue, Pieces and Weight Reports for FY 2013 and FY 2012
Mail Volume Mail Revenue
FY 2013
(in millions)
FY 2012
(in millions)
Increase or
Decrease
(in millions) % Change
FY 2013
(in millions)
FY 2012
(in millions)
Increase or
Decrease
(in millions) % Change
Priority Express Mail 39.116 39.823 -0.707 -1.8% 794.1 801.6 (7.5) -0.9%
First-Class Package Service 546.052 411.127 134.925 32.8% 1,195.6 875.0 320.5 36.6%
Standard Post Mail 25.238 0 25.238 0.0% 344.4 - 344.4 0.0%
Priority Mail 873.312 823.774 49.538 6.0% 6,387.6 5,936.8 450.8 7.6%
Parcel Select Mail 1287.046 937.631 349.415 37.3% 1,904.3 1,341.4 562.8 42.0%
Parcel Return Service 50.805 46.571 4.234 9.1% 123.7 114.8 8.9 7.8%
International Mail 282.203 273.525 8.678 3.2% 2,213.0 1,837.3 375.7 20.4%
Total Shipping Services Mail 3103.8 2532.451 571.321 22.6% 12,962.6 10,906.9 2,055.7 18.8%
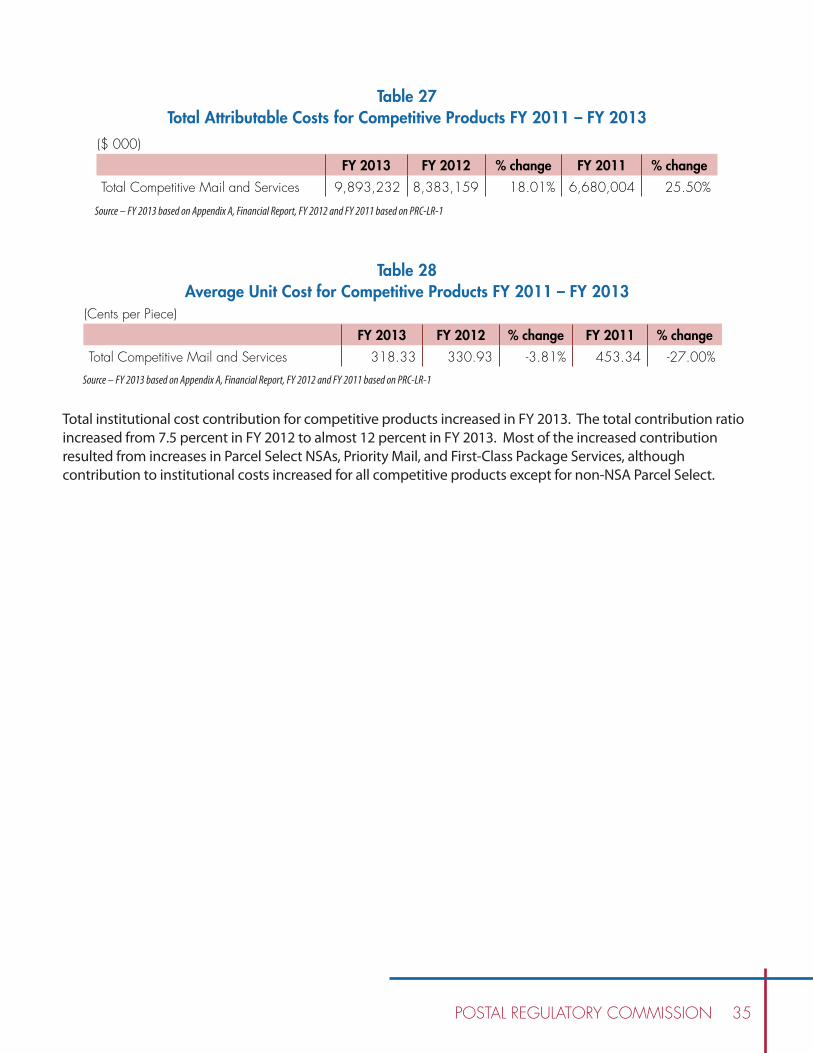
POSTAL REGULATORY COMMISSION 35
Table 27 Total Attributable Costs for Competitive Products FY 2011 – FY 2013
Source – FY 2013 based on Appendix A, Financial Report, FY 2012 and FY 2011 based on PRC-LR-1
($ 000)
FY 2013 FY 2012 % change FY 2011 % change
Total Competitive Mail and Services 9,893,232 8,383,159 18.01% 6,680,004 25.50%
Table 28 Average Unit Cost for Competitive Products FY 2011 – FY 2013
Source – FY 2013 based on Appendix A, Financial Report, FY 2012 and FY 2011 based on PRC-LR-1
(Cents per Piece)
FY 2013 FY 2012 % change FY 2011 % change
Total Competitive Mail and Services 318.33 330.93 -3.81% 453.34 -27.00%
Total institutional cost contribution for competitive products increased in FY 2013. The total contribution ratio increased from 7.5 percent in FY 2012 to almost 12 percent in FY 2013. Most of the increased contribution resulted from increases in Parcel Select NSAs, Priority Mail, and First-Class Package Services, although contribution to institutional costs increased for all competitive products except for non-NSA Parcel Select.

36 2013 FINANCIAL ANALYSIS

POSTAL REGULATORY COMMISSION 37
CHAPTER 4FINANCIAL SUSTAINABILITY ANALYSIS
A. Key RatiosFinancial analysis applicable to the profit driven private sector may be less relevant to government agencies because revenue streams, equity structures, and management incentives differ from one another. It is also difficult to determine a single measurement that signifies financial health for a government agency. Financial performance, although not a primary indicator of success, influences the fulfillment of missions and objectives for government agencies with a service -related mission such as the Postal Service.
Financial viability is affected by a combination of environmental, economic, and organizational factors, including decisions and actions of management and the governing board. For example, the decline in volume of high contribution margin First-Class Mail (a negative environmental trend) can lead to the erosion of a healthy cost coverage base. However, Postal Service management’s response to this decline and constraints on management flexibility also affect the financial condition of the agency.
Financial ratios are tools used to interpret accounting information to capture an agency’s financial health and the ability to satisfy its financial obligations. Ratio analysis helps assess profitability and informs stakeholders in appraising an agency’s performance based on its current earnings. For example, by computing a solvency ratio such as debt ratio, stakeholders are able to monitor the correlation between assets and liabilities. Both the ability of an agency to meet its short-term financial obligation (liquidity) and the ability of an enterprise to meet its long-term financial obligations (solvency) are critical in evaluating the Postal Service’s current financial situation.
Ratio analysis is also insightful in analyzing an agency’s past performance to help identify weaknesses and highlight improvements. At present, many agencies use ratio analysis to provide an opportunity for an agency to estimate future trends and the foundation of budget planning to guide growth and development. Ratio analysis, along with other pertinent data, is used by management and stakeholders to assess an agency’s current and future financial condition and performance. This section focuses on three key financial ratios to analyze the Postal Service’s overall financial health.
Financial data used in the ratio analysis of the Postal Service are derived from accounting information not adjusted for inflation and represent historical costs instead of current or replacement costs. It should be noted that future revenues and cash flows of an agency may depend on changing demographics, industry dynamics, government regulation, and predictions of performance based solely on past growth; therefore, historical information may be inaccurate.

38 2013 FINANCIAL ANALYSIS
Table 29Ratio Analysis of Financial Statements
Source - PRC derived from USPS Forms 10-K and USPS Annual Reports
9/30/2013 9/30/2012
Ratios Value Change Description of ratio
Postal Service Historic 10 Year Average Value
Debt ratio (debt to assets ratio) 2.8 2.5 0.30
A debt ratio is calculated by dividing total liabilities (i.e. long-term and short-term liabilities) by total assets. It shows how much the company relies on debt to finance assets (similar to debt-to-equity ratio).
1.33
Fixed assets to Net worth -0.44 -0.54 0.10
This ratio indicates the extent to which the entity’s cash is frozen in the form of fixed assets, such as property, plant, and equipment.
2.52
Current liability ratio 0.60 0.56 0.04
Current liability ratio is calculated by dividing current liabilities by total (i.e. current and noncurrent) liabilities. 0.50
Debt ratio indicates the proportion of an agency’s debt to its total assets. The debt ratio gives stakeholders a quick measure of the amount of debt that the agency has on its balance sheets in comparison to its assets. The higher the ratio, the greater the risk associated with the agency’s operation. A low debt ratio indicates conservative financing with an opportunity to borrow in the future at no significant risk.
Debt ratio provides information about the Postal Service’s ability to absorb asset reductions arising from losses and is a primary signal describing financial stability. On December 31, 2013, the debt ratio for the Postal Service was 2.8, slightly exceeding the debt ratio for FY 2012. The Postal Service’s debt ratio has a critical value more than twice as high as the average 10-year value of 1.33. This ratio indicates that the Postal Service does not have sufficient capital (equity) and cannot raise investment funds beyond basic earnings or borrowing. The accruals of nonpayment of the statutory RHBF and the long-term workers’ compensation obligations have skewed the Postal Service’s liabilities in relation to its assets. To reduce the debt ratio to historic averages, the Postal Service would have to increase its current cash position or investments in capital assets and reduce its large balance obligations of the RHBF and workers’ compensation.
The fixed asset to net worth ratio analyzes fixed assets as a percentage of net worth to determine an agency’s liquidity and the profitability of its operations. Net worth is the residual amount representing the excess of an agency’s assets over its liabilities. The Postal Service’s fixed assets consist primarily of Buildings and Equipment that cannot be easily converted into cash. A high fixed asset to net worth ratio signifies an inability to respond to financial emergencies rapidly or free cash easily for further investment and growth. The Postal Service has accumulated deficits in excess of its fixed assets, resulting in negative fixed assets to net worth ratio rendering the results of the ratio meaningless.

POSTAL REGULATORY COMMISSION 39
The current liability ratio shows that the Postal Service’s share of short-term liabilities to total liabilities was 60 percent, an increase of 4 percent from the start of FY 2013. This ratio indicates the amount of current debt payments required to be paid within a year. The accrual of the unpaid statutory RHBF prefunding payments is included in current obligations, accounting for the increase in current liabilities. The decrease in workers’ compensation liability resulting from higher discount rates lowered long-term obligations comparative to the start of the year. Understanding the Postal Service’s liabilities is critical, especially if the cash flows generated from operations make the Postal Service unable to meet its current debt. This inability to finance current debt requirements is the core of the Postal Service’s liquidity issues.
B. Altman Z-ScoreFinancial analysis evaluates the financial strength of a company through the use of a variety of metrics. In conjunction with financial ratios, they are used to gauge an entity’s long-term viability. However, sometimes the entity’s ratios reflect conflicting views. To help eliminate this confusion, NYU professor Edward Altman developed the Z-Score in 1968 as a tool to explicitly address the likelihood that a company would go bankrupt.
The Altman Z-score is applied here to predict the probability of bankruptcy of an entity with the attributes of the Postal Service.28 The Z-score model is a quantitative model developed to predict the financial distress of a business, using a blend of the traditional financial ratios and a statistical method known as multiple discriminant analysis. A 4-factor model for a private non-manufacturer is used to evaluate the financial stability of the USPS:
Table 30 Altman Z-Score
Source – PRC derived from USPS FY 2013 Form 10-K
Ratio Calculation Ratio value on 9/30/2013
Weighting factor
Product (col. 3 x col. 4)
1 2 3 4 5
T1 Working Capital/Total Assets (1.5) 1.2 (1.8)
T2 Retained Earnings/Total Assets (1.8) 1.4 (2.6)
T3 Earnings/Total Assets (0.05) 3.3 (0.2)
T4 Capital/Total Liabilities (0.6) 0.6 (0.4)
Altman Z-Score (5.0)
28 This discussion is not meant to suggest that bankruptcy provisions are applicable to the Postal Service, a government sponsored entity.
Z-score = T1+T2+T3+T4, where:Discrimination ranges:
■ 1.1 or less – Distress zone ■ 1.1 to 2.6 – Grey zone ■ 2.6 or more – Safe zone

40 2013 FINANCIAL ANALYSIS
Most commonly, a lower Z-score reflects higher odds of bankruptcy. The four performance ratios in the calculation of the Z-score are combined into a single score by weighting. The coefficients are estimated from a set of firms which had declared bankruptcy. A matched sample of firms is collected and matched by industry and estimated assets. Altman’s Z-Score formula has achieved ample acceptance by management accountants, auditors and courts used for loan evaluation although it had been initially developed for publicly held manufacturing firms featuring assets of more than $1 million.
According to calculations, on September 30, 2013, the Z-score equaled –5.0 for the Postal Service, a slight setback from the prior year score of -4.7. Such a poor value indicates that there is a high probability that a business entity with the financial attributes of the Postal Service could fall into bankruptcy. Despite the results obtained, it should be mentioned that the Altman Z-score as a predictor of the entity’s bankruptcy probability is only relative, the structure of the Postal Service’s ratios may be atypical, and interpreting the significance of the Z-score would require deeper analysis by Postal Service management.
C. Working Capital Analysis and TrendsWorking capital is the amount by which the value of a company’s current assets exceeds its current liabilities. The Postal Service has no working capital as of September 30, 2013. Postal Service obligations exceed total assets by $32.9 billion. The increase in obligations of $4.2 billion from the start of the fiscal year is largely due to the growth in employee related liabilities, including the statutory accruals for payments into the Retiree Health Benefit Fund.
A high working capital balance would be advantageous as the Postal Service has reached its statutory maximum borrowing capacity. Working capital serves as a liquid reserve and indicates the short-term solvency of a company and determines if a company can pay its current liabilities when due.
The chart below highlights the deficit starting in FY 2007 and growing to its current cumulative balance of $42.95 billion. Available liquidity is calculated as a combination of working capital and remaining borrowing capacity.
Figure 15Postal Service Liquidity and Retained Deficit Trends
Source - PRC derived from USPS Forms 10-K and USPS Annual Reports

POSTAL REGULATORY COMMISSION 41
The Postal Service, under the Postal Reorganization Act breakeven regime, made and accumulated retained earnings, or small profits, from FY 2003 through FY 2006.29 The cumulative net income from the prior years was not sufficient to absorb the large net losses, amounting to $46.2 billion, incurred from FY 2007 through FY 2013. With mounting losses the Postal Service’s debt rose from $2.1 billion at the start of FY 2007 to its statutory debt limit of $15 billion in FY 2012. The financial losses incurred are the result of declining mail volume of high contribution margin First-Class Mail, and the increase in retiree health benefit prefunding costs required by the Postal Accountability and Enhancement Act.
29 Public Law 108-18, enacted in 2003, changed the methodology in which the Postal Service financed CSRS pensions resulting in a savings of almost $11 billion. In addition to other cost reductions and increasing revenues, the Postal Service was able to record net incomes resulting in reversing negative retained earnings of $6 billion at the end of FY 2002 to a positive retained earnings balance of $3.2 billion at the end of FY 2006.

42 2013 FINANCIAL ANALYSIS

POSTAL REGULATORY COMMISSION 43
APPENDIX AFINANCIAL RESULTS UNDER CURRENT CLASSIFICATIONS
This appendix presents Postal Service financial results for FY 2013 using the mail classification system in place since the passage of the PAEA. Prior to the PAEA, mail classes were subdivided into subclasses, and the financial reports reflected that organization. The PAEA uses the term product, defined as “a postal service with a distinct costs or market characteristic for which a rate or rates are, or may reasonably be applied.” 39 U.S.C. 102(6). Within classes, the Postal Service reports data by product, not by subclass.
Volume Revenue Attributable Cost
Contribution toInstitutional
Cost Rev./Pc. Cost/Pc.
Contribution toInstitutional
Cost/Pc. Cost
(000) ($ 000) ($ 000) ($ 000) (Cents) (Cents) (Cents) Coverage
Competitive Market Mail
Priority Mail Express 39,116 794,090 419,667 374,423 2,030.08 1,072.87 957.21 189.2%
Priority Mail 871,366 6,374,320 4,861,058 1,513,262 731.53 557.87 173.67 131.1%
Parcel Select and Parcel Return Service (PRS) 1,345,642 2,125,411 1,643,748 481,663 157.95 122.15 35.79 129.3%
First-Class Package Service 544,334 1,191,739 1,001,675 190,063 218.94 184.02 34.92 119.0%
Standard Post Mail (NEW) 25,193 343,940 340,865 3,075 1,365.22 1,353.01 12.20 100.9%
Competitive International Mail 282,196 2,213,403 1,264,924 948,480 784.35 448.24 336.11 175.0%
Competitive Domestic Services 688,762 343,012 345,750 - - - 200.8%
Competitive International Services 9,056 6,104 2,953 - - - 148.4%
Total Competitive Mail and Services 3,107,848 13,740,721 9,881,053 3,859,668 442.13 317.94 124.19 139.1%
Market Dominant Mail
First-Class Mail
Single-Piece Letters and Cards 22,497,928 10,576,916 6,196,674 4,380,242 47.01 27.54 19.47 170.7%
Presort Letters and Cards 41,144,184 14,934,667 4,800,006 10,134,661 36.30 11.67 24.63 311.1%
Flats 1,894,432 2,519,471 1,685,662 833,808 132.99 88.98 44.01 149.5%
Parcels 247,187 580,383 583,503 (3,119) 234.80 236.06 (1.26) 99.5%
First Class NSAs 213,535 75,504 22,836 52,668 35.36 10.69 24.66 330.6%
Outbound Single-Piece Mail Intl 231,475 457,822 321,532 136,290 197.78 138.91 58.88 142.4%
Inbound Single-Piece Mail Intl 387,712 281,441 375,956 (94,515) 72.59 96.97 (24.38) 74.9%
Total First Class Mail 66,616,454 29,426,204 13,986,169 15,440,035 44.17 21.00 23.18 210.4%
Standard Mail
High Density & Saturation Letters 5,711,635 808,563 341,411 467,152 14.16 5.98 8.18 236.8%
High Density & Saturation Flats & Parcels 11,337,794 1,933,797 842,701 1,091,096 17.06 7.43 9.62 229.5%
Every Door Direct Retail (NEW) 974,774 138,418 38,458 99,960 14.20 3.95 10.25 359.9%
Carrier Route 9,507,627 2,377,902 1,778,661 599,240 25.01 18.71 6.30 133.7%
Letters 46,754,273 9,298,543 4,902,887 4,395,655 19.89 10.49 9.40 189.7%
Flats 5,568,019 2,138,367 2,514,246 (375,878) 38.40 45.16 (6.75) 85.1%
Not Flat-Machinables and Parcels 71,966 74,429 109,645 (35,216) 103.42 152.36 (48.93) 67.9%
Standard Mail NSAs 1,036,466 215,186 93,119 122,067 20.76 8.98 11.78 231.1%
Inbound NSA Mail Intl 119 77 107.5 (31) 64.37 90.06 (25.69) 71.5%
Total Standard Mail 80,962,674 16,985,281 10,621,236 6,364,046 20.98 13.12 7.86 159.9%
Periodicals
Within County 603,254 66,011 86,970 (20,959) 10.94 14.42 (3.47) 75.9%
Outside County 5,755,719 1,592,153 2,092,052 (499,900) 27.66 36.35 (8.69) 76.1%
Total Periodicals Mail 6,358,973 1,658,164 2,179,022 (520,858) 26.08 34.27 (8.19) 76.1%
Package Services
Alaska Bypass 1,295 31,539 10,304 21,235.00 2,436.15 795.88 1,640.27 306.1%
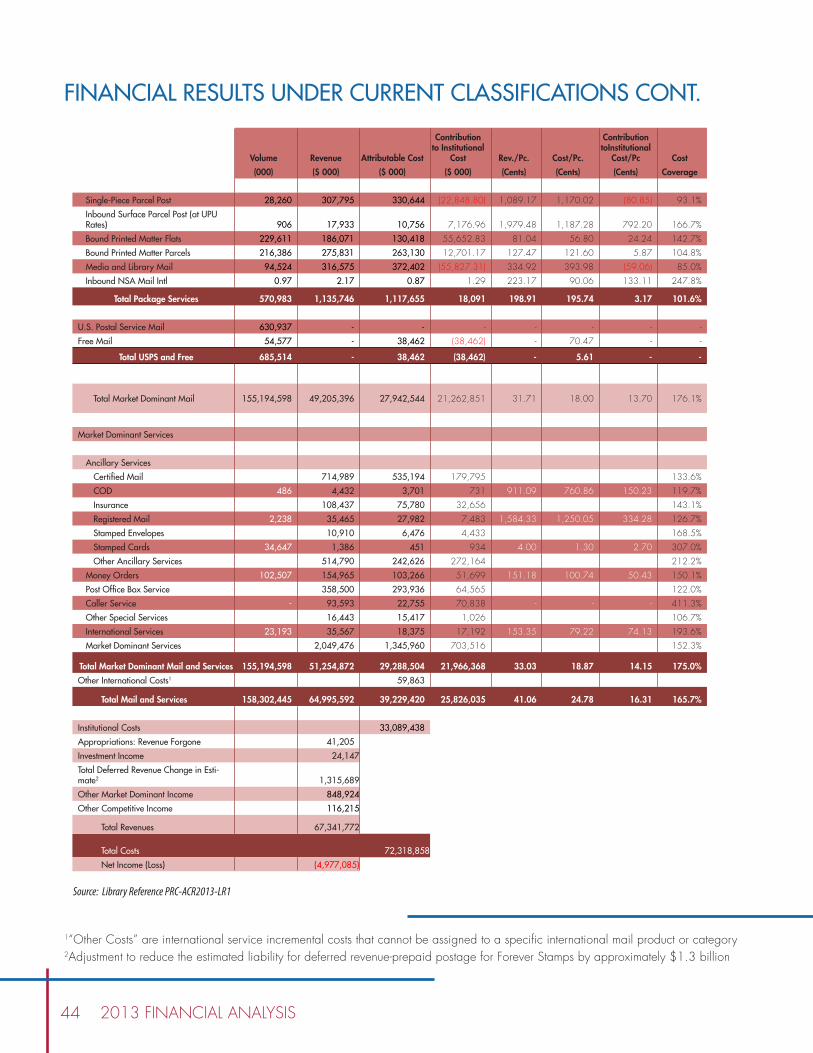
44 2013 FINANCIAL ANALYSIS
Volume Revenue Attributable Cost
Contribution to Institutional
Cost Rev./Pc. Cost/Pc.
Contribution toInstitutional
Cost/Pc Cost
(000) ($ 000) ($ 000) ($ 000) (Cents) (Cents) (Cents) Coverage
Single-Piece Parcel Post 28,260 307,795 330,644 (22,848.80) 1,089.17 1,170.02 (80.85) 93.1%
Inbound Surface Parcel Post (at UPU Rates) 906 17,933 10,756 7,176.96 1,979.48 1,187.28 792.20 166.7%
Bound Printed Matter Flats 229,611 186,071 130,418 55,652.83 81.04 56.80 24.24 142.7%
Bound Printed Matter Parcels 216,386 275,831 263,130 12,701.17 127.47 121.60 5.87 104.8%
Media and Library Mail 94,524 316,575 372,402 (55,827.31) 334.92 393.98 (59.06) 85.0%
Inbound NSA Mail Intl 0.97 2.17 0.87 1.29 223.17 90.06 133.11 247.8%
Total Package Services 570,983 1,135,746 1,117,655 18,091 198.91 195.74 3.17 101.6%
U.S. Postal Service Mail 630,937 - - - - - - -
Free Mail 54,577 - 38,462 (38,462) - 70.47 - -
Total USPS and Free 685,514 - 38,462 (38,462) - 5.61 - -
Total Market Dominant Mail 155,194,598 49,205,396 27,942,544 21,262,851 31.71 18.00 13.70 176.1%
Market Dominant Services
Ancillary Services
Certified Mail 233,945 714,989 535,194 179,795 305.62 228.77 76.85 133.6%
COD 486 4,432 3,701 731 911.09 760.86 150.23 119.7%
Insurance 28,080 108,437 75,780 32,656 386.18 269.88 116.30 143.1%
Registered Mail 2,238 35,465 27,982 7,483 1,584.33 1,250.05 334.28 126.7%
Stamped Envelopes - 10,910 6,476 4,433 - - - 168.5%
Stamped Cards 34,647 1,386 451 934 4.00 1.30 2.70 307.0%
Other Ancillary Services 2,545,872 514,790 242,626 272,164 20.22 9.53 10.69 212.2%
Money Orders 102,507 154,965 103,266 51,699 151.18 100.74 50.43 150.1%
Post Office Box Service - 358,500 293,936 64,565 - - - 122.0%
Caller Service - 93,593 22,755 70,838 - - - 411.3%
Other Special Services 1,970 16,443 15,417 1,026 834.85 782.76 52.09 106.7%
International Services 23,193 35,567 18,375 17,192 153.35 79.22 74.13 193.6%
Market Dominant Services 2,049,476 1,345,960 703,516 - - - 152.3%
Total Market Dominant Mail and Services 155,194,598 51,254,872 29,288,504 21,966,368 33.03 18.87 14.15 175.0%
Other International Costs1 59,863
Total Mail and Services 158,302,445 64,995,592 39,229,420 25,826,035 41.06 24.78 16.31 165.7%
Institutional Costs 33,089,438
Appropriations: Revenue Forgone 41,205
Investment Income 24,147
Total Deferred Revenue Change in Esti-mate2 1,315,689
Other Market Dominant Income 848,924
Other Competitive Income 116,215
Total Revenues 67,341,772
Total Costs 72,318,858
Net Income (Loss) (4,977,085)
1“Other Costs” are international service incremental costs that cannot be assigned to a specific international mail product or category2Adjustment to reduce the estimated liability for deferred revenue-prepaid postage for Forever Stamps by approximately $1.3 billion
Source: Library Reference PRC-ACR2013-LR1
FINANCIAL RESULTS UNDER CURRENT CLASSIFICATIONS CONT.

Organization EmblemPostal Regulatory Commission
901 New York Avenue NW, Suite 200 • Washington, DC 20268-0001 (202) 789-6800 • www.prc.gov
Ruth Y. Goldway, ChairmanMark Acton, Vice Chairman
Robert G. Taub, Commissioner