poster-mabchem-ppt file
TRANSCRIPT
Bioconjugation Chemistries for ADC Preparation Rongliang Lou, Dev Sharma, Daniel Wang, Ping Ge
mAbChem Lab LLC 23 Business Park Drive, Branford, CT 06405
World ADC Summit, San Diego, Oct 26-29th, 2014
Introduction Antibody drug conjugates (ADCs) represent novel structure-modified monoclonal antibodies designed to
deliver cytotoxic drugs selectively to antigen expressing tumor cells. Attaching a toxin or payload to an
antibody can be accomplished through a variety of approaches, conventionally via lysine residues utilizing
amide bonds (as in Kadcyla) or cysteine residues utilizing thiother bonds (as in Adcetris). More recently a
number of site directed approaches have been employed, however, the clinical evaluation of these remain
to be seen.
ADCs are typically characterized by the following techniques:
(i) UV spectrophotometry for protein concentration & Drug Antibody Ratio (DAR)
(ii) Hydrophobic interaction chromatography (HIC) for DAR, amount of unconjugated antibody (UmAb%)
and distribution of various loaded species (0, 2, 4, 6, 8)
(iii) Size exclusion chromatography (SEC) for amount of higher molecular mass species (Agg%)
(iv) Reversed phase chromatography (RP-HPLC) for DAR, amount of residual linker payload and related
species
(v) Mass spectrometry for DAR, residual linker payload and related species and generally more in depth
characterization (peptide mapping, sequence variations, etc)
Different conjugation chemistries pose different challenges from a development perspective in terms of
targeting desired product profile. In this poster, we would like to share our experience in different
bioconjugation chemistries (lysine & cysteine mediated) using IgG1, IgG4 mAbs and NHS ester containing
linker payload (NHS-LP) or non-cleavable maleimide containing LP (mc-LP). We would also share some
initial results using site directed conjugation involving mutant cysteine residues.
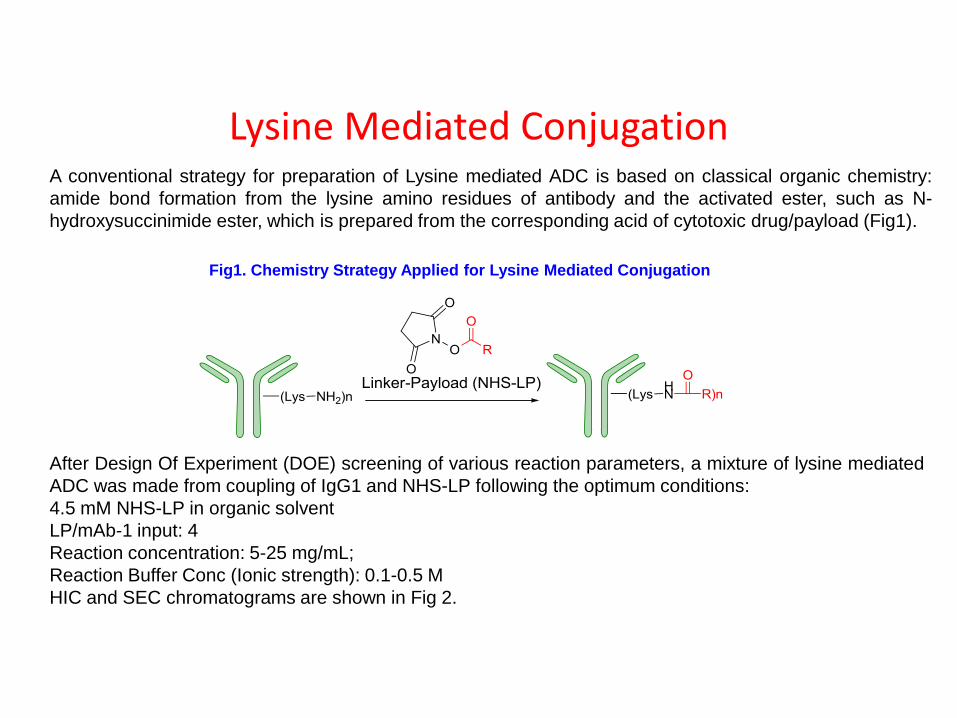
Lysine Mediated Conjugation A conventional strategy for preparation of Lysine mediated ADC is based on classical organic chemistry:
amide bond formation from the lysine amino residues of antibody and the activated ester, such as N-
hydroxysuccinimide ester, which is prepared from the corresponding acid of cytotoxic drug/payload (Fig1).
Fig1. Chemistry Strategy Applied for Lysine Mediated Conjugation
After Design Of Experiment (DOE) screening of various reaction parameters, a mixture of lysine mediated
ADC was made from coupling of IgG1 and NHS-LP following the optimum conditions:
4.5 mM NHS-LP in organic solvent
LP/mAb-1 input: 4
Reaction concentration: 5-25 mg/mL;
Reaction Buffer Conc (Ionic strength): 0.1-0.5 M
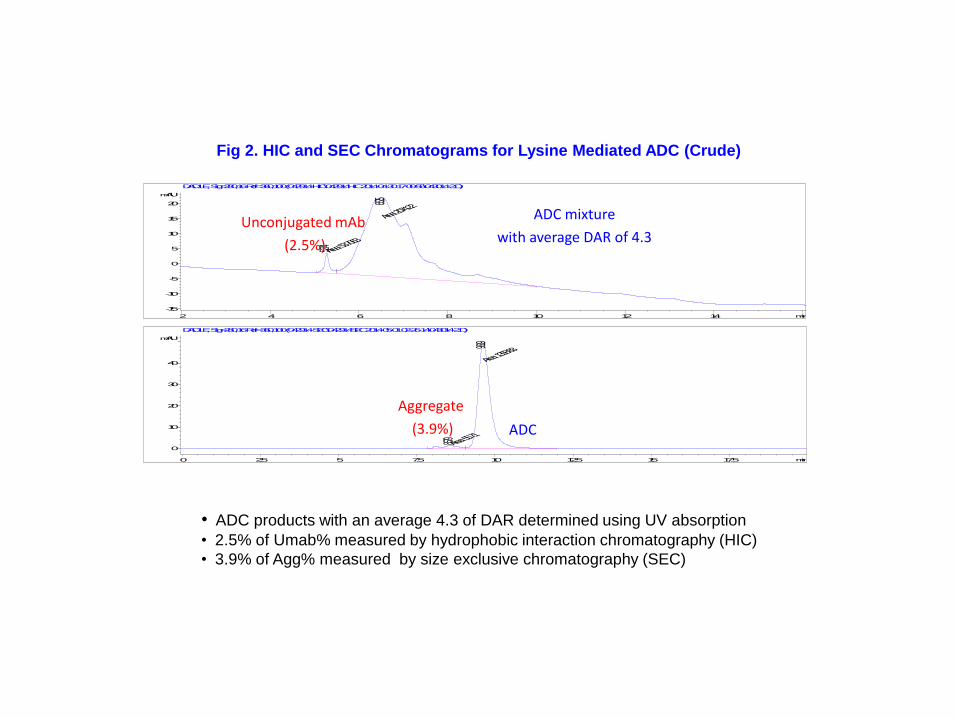
HIC and SEC chromatograms are shown in Fig 2.
min0 2.5 5 7.5 10 12.5 15 17.5
mAU
0
10
20
30
40
DAD1 E, Sig=280,16 Ref=360,100 (042914-SEC\042914SEC 2014-05-01 02-26-14\043014-2.D)
Area: 55.71 8.579
Area: 1358
.83 9.619
ADC
Aggregate
(3.9%)
Fig 2. HIC and SEC Chromatograms for Lysine Mediated ADC (Crude)
• ADC products with an average 4.3 of DAR determined using UV absorption
• 2.5% of Umab% measured by hydrophobic interaction chromatography (HIC)
• 3.9% of Agg% measured by size exclusive chromatography (SEC)
min2 4 6 8 10 12 14
mAU
-15
-10
-5
0
5
10
15
20
DAD1 E, Sig=280,16 Ref=360,100 (042914-HIC\042914HIC 2014-04-30 17-00-56\043014-2.D)
Area: 53.70
63
5.274
Area: 2074
.22 6.525
Unconjugated mAb
(2.5%)
ADC mixture
with average DAR of 4.3
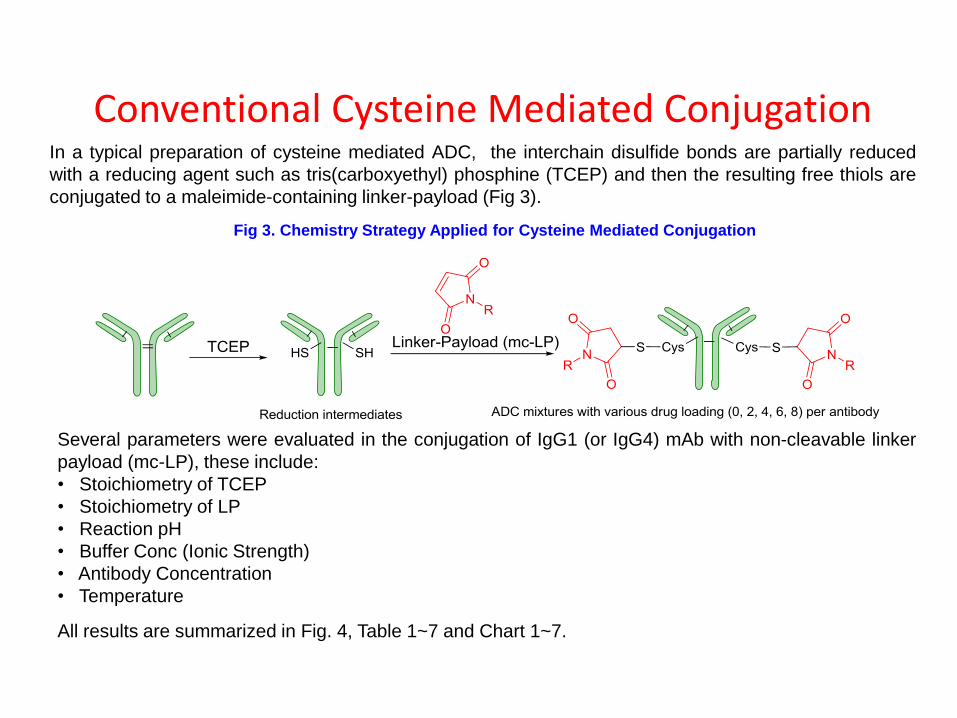
In a typical preparation of cysteine mediated ADC, the interchain disulfide bonds are partially reduced
with a reducing agent such as tris(carboxyethyl) phosphine (TCEP) and then the resulting free thiols are
conjugated to a maleimide-containing linker-payload (Fig 3).
Conventional Cysteine Mediated Conjugation
Fig 3. Chemistry Strategy Applied for Cysteine Mediated Conjugation
Several parameters were evaluated in the conjugation of IgG1 (or IgG4) mAb with non-cleavable linker
payload (mc-LP), these include:
• Stoichiometry of TCEP
• Stoichiometry of LP
• Reaction pH
• Buffer Conc (Ionic Strength)
• Antibody Concentration
• Temperature
All results are summarized in Fig. 4, Table 1~7 and Chart 1~7.
min2 4 6 8 10 12 14
mAU
0
10
20
30
40
50
DAD1 E, Sig=280,16 Ref=360,100 (060914-HIC\060914-MABHIC 2014-06-09 18-47-51\MAB-1-RE.D)
5.994
min2 4 6 8 10 12 14
mAU
-15
-10
-5
0
5
10
DAD1 E, Sig=280,16 Ref=360,100 (122713-HIC\122713HIC 2013-12-27 14-13-15\1-2.D)
5.887 6.571
7.427
min2 4 6 8 10 12 14
mAU
-15
-10
-5
0
5
DAD1 E, Sig=280,16 Ref=360,100 (122713-HIC\122713HIC 2013-12-27 14-13-15\1-4.D)
5.924
6.604 7.452 7.811
min2 4 6 8 10 12 14
mAU
-18
-16
-14
-12
-10
-8
-6
-4
-2
0
DAD1 E, Sig=280,16 Ref=360,100 (122713-HIC\122713HIC 2013-12-27 14-13-15\1-6.D)
6.608 7.463 7.816 8.782
9.599
min2 4 6 8 10 12 14
mAU
-18
-16
-14
-12
-10
-8
-6
-4
-2
0
DAD1 E, Sig=280,16 Ref=360,100 (122713-HIC\122713HIC 2013-12-27 14-13-15\1-8.D)
7.500 8.827 9.653min2 4 6 8 10 12 14
mAU
-17.5
-15
-12.5
-10
-7.5
-5
-2.5
0
2.5
DAD1 E, Sig=280,16 Ref=360,100 (122713-HIC\122713HIC 2013-12-27 14-13-15\1-10.D)
9.688
min2 4 6 8 10 12 14
mAU
-17.5
-15
-12.5
-10
-7.5
-5
-2.5
0
2.5
DAD1 E, Sig=280,16 Ref=360,100 (122713-HIC\122713HIC 2013-12-27 14-13-15\1-12.D)
9.754
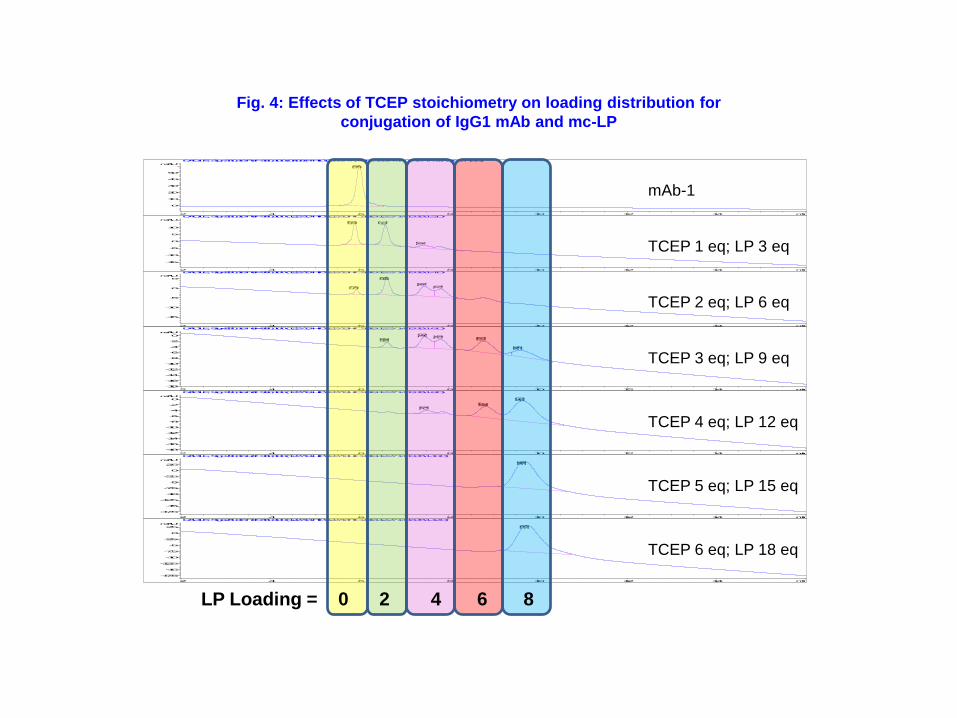
LP Loading = 0 2 4 6 8
mAb-1
TCEP 1 eq; LP 3 eq
TCEP 2 eq; LP 6 eq
TCEP 3 eq; LP 9 eq
TCEP 4 eq; LP 12 eq
TCEP 5 eq; LP 15 eq
TCEP 6 eq; LP 18 eq
Fig. 4: Effects of TCEP stoichiometry on loading distribution for
conjugation of IgG1 mAb and mc-LP
TCEP
equiv DAR
HIC
(UmAb%)
SEC
(Agg%)
1 1.77 34.2 0.52
2 3.78 7.0 0.64
3 5.31 1.5 0.68
4 6.82 0 0.75
5 7.83 0 0.77
6 8.00 0 0.78
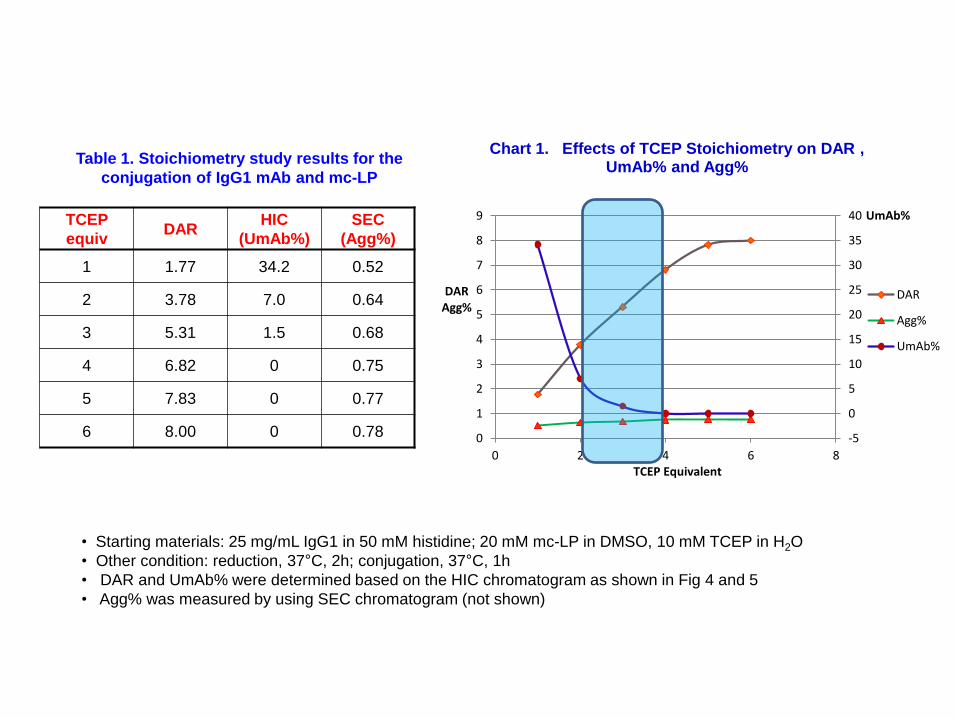
Table 1. Stoichiometry study results for the
conjugation of IgG1 mAb and mc-LP
• Starting materials: 25 mg/mL IgG1 in 50 mM histidine; 20 mM mc-LP in DMSO, 10 mM TCEP in H2O
• Other condition: reduction, 37°C, 2h; conjugation, 37°C, 1h
• DAR and UmAb% were determined based on the HIC chromatogram as shown in Fig 4 and 5
• Agg% was measured by using SEC chromatogram (not shown)
-5
0
5
10
15
20
25
30
35
40
0
1
2
3
4
5
6
7
8
9
0 2 4 6 8
UmAb%
DAR Agg%
TCEP Equivalent
Chart 1. Effects of TCEP Stoichiometry on DAR , UmAb% and Agg%
DAR
Agg%
UmAb%
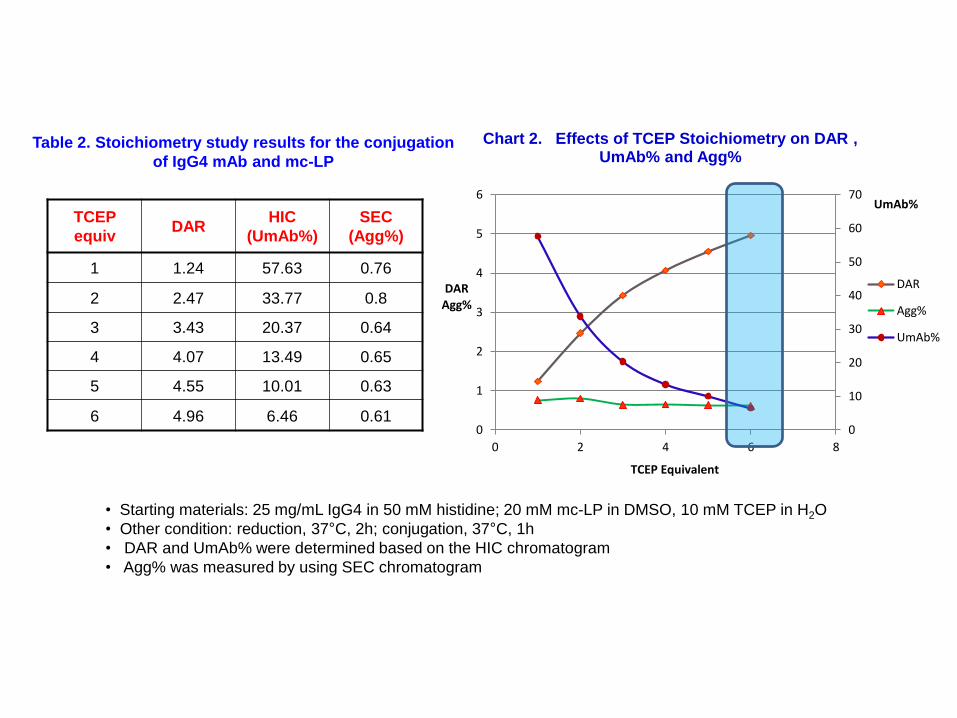
Table 2. Stoichiometry study results for the conjugation
of IgG4 mAb and mc-LP
• Starting materials: 25 mg/mL IgG4 in 50 mM histidine; 20 mM mc-LP in DMSO, 10 mM TCEP in H2O
• Other condition: reduction, 37°C, 2h; conjugation, 37°C, 1h
• DAR and UmAb% were determined based on the HIC chromatogram
• Agg% was measured by using SEC chromatogram
TCEP
equiv DAR
HIC
(UmAb%)
SEC
(Agg%)
1 1.24 57.63 0.76
2 2.47 33.77 0.8
3 3.43 20.37 0.64
4 4.07 13.49 0.65
5 4.55 10.01 0.63
6 4.96 6.46 0.61 0
10
20
30
40
50
60
70
0
1
2
3
4
5
6
0 2 4 6 8
UmAb%
DAR Agg%
TCEP Equivalent
Chart 2. Effects of TCEP Stoichiometry on DAR , UmAb% and Agg%
DAR
Agg%
UmAb%
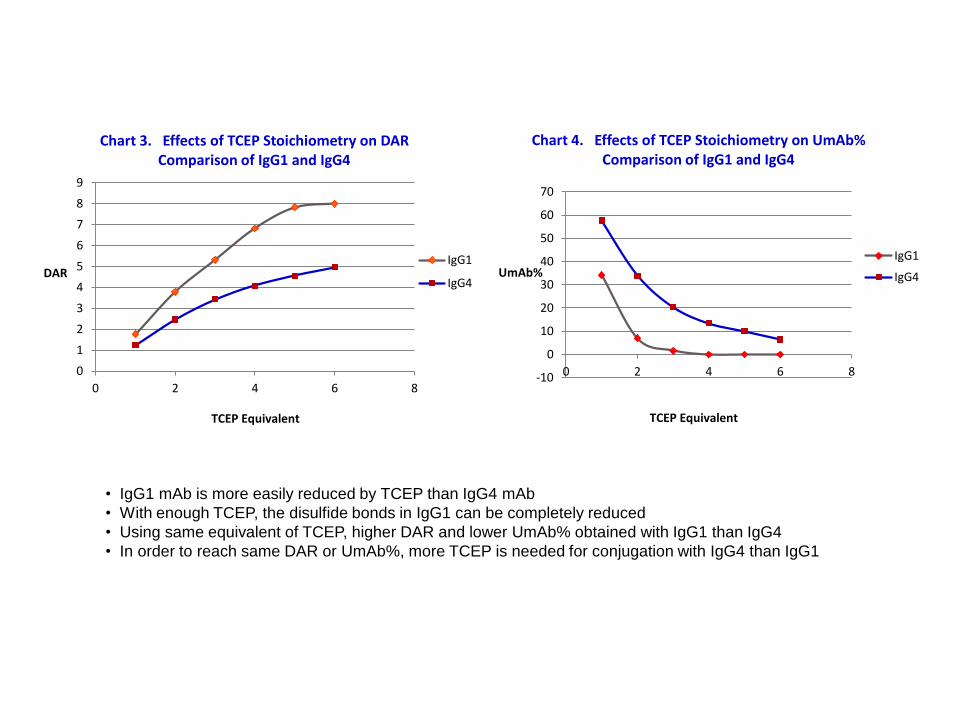
• IgG1 mAb is more easily reduced by TCEP than IgG4 mAb
• With enough TCEP, the disulfide bonds in IgG1 can be completely reduced
• Using same equivalent of TCEP, higher DAR and lower UmAb% obtained with IgG1 than IgG4
• In order to reach same DAR or UmAb%, more TCEP is needed for conjugation with IgG4 than IgG1
0
1
2
3
4
5
6
7
8
9
0 2 4 6 8
DAR
TCEP Equivalent
Chart 3. Effects of TCEP Stoichiometry on DAR Comparison of IgG1 and IgG4
IgG1
IgG4
-10
0
10
20
30
40
50
60
70
0 2 4 6 8
UmAb%
TCEP Equivalent
Chart 4. Effects of TCEP Stoichiometry on UmAb% Comparison of IgG1 and IgG4
IgG1
IgG4
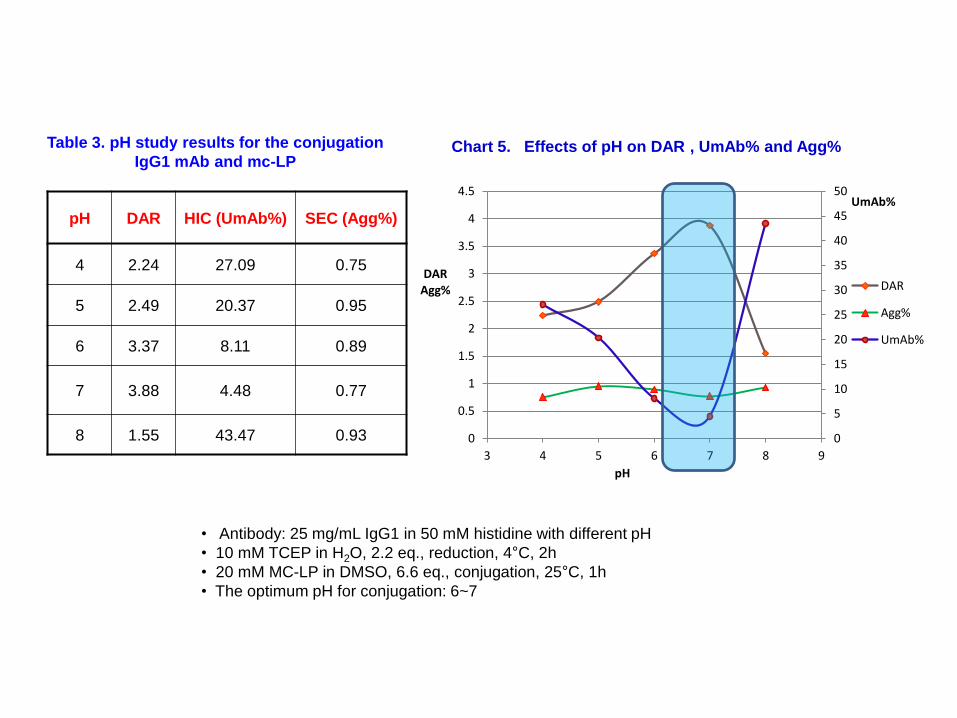
pH DAR HIC (UmAb%) SEC (Agg%)
4 2.24 27.09 0.75
5 2.49 20.37 0.95
6 3.37 8.11 0.89
7 3.88 4.48 0.77
8 1.55 43.47 0.93
Table 3. pH study results for the conjugation
IgG1 mAb and mc-LP
• Antibody: 25 mg/mL IgG1 in 50 mM histidine with different pH
• 10 mM TCEP in H2O, 2.2 eq., reduction, 4°C, 2h
• 20 mM MC-LP in DMSO, 6.6 eq., conjugation, 25°C, 1h
• The optimum pH for conjugation: 6~7
0
5
10
15
20
25
30
35
40
45
50
0
0.5
1
1.5
2
2.5
3
3.5
4
4.5
3 4 5 6 7 8 9
UmAb%
DAR Agg%
pH
Chart 5. Effects of pH on DAR , UmAb% and Agg%
DAR
Agg%
UmAb%
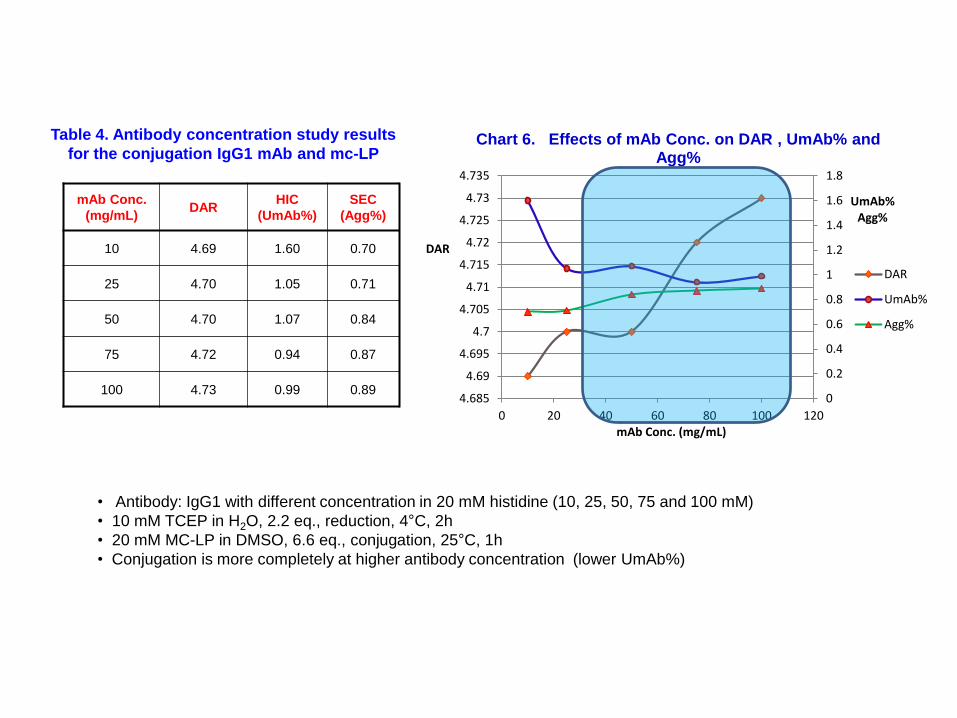
• Antibody: IgG1 with different concentration in 20 mM histidine (10, 25, 50, 75 and 100 mM)
• 10 mM TCEP in H2O, 2.2 eq., reduction, 4°C, 2h
• 20 mM MC-LP in DMSO, 6.6 eq., conjugation, 25°C, 1h
• Conjugation is more completely at higher antibody concentration (lower UmAb%)
Table 4. Antibody concentration study results
for the conjugation IgG1 mAb and mc-LP
mAb Conc.
(mg/mL) DAR
HIC
(UmAb%)
SEC
(Agg%)
10 4.69 1.60 0.70
25 4.70 1.05 0.71
50 4.70 1.07 0.84
75 4.72 0.94 0.87
100 4.73 0.99 0.89 0
0.2
0.4
0.6
0.8
1
1.2
1.4
1.6
1.8
4.685
4.69
4.695
4.7
4.705
4.71
4.715
4.72
4.725
4.73
4.735
0 20 40 60 80 100 120
UmAb% Agg%
DAR
mAb Conc. (mg/mL)
Chart 6. Effects of mAb Conc. on DAR , UmAb% and Agg%
DAR
UmAb%
Agg%
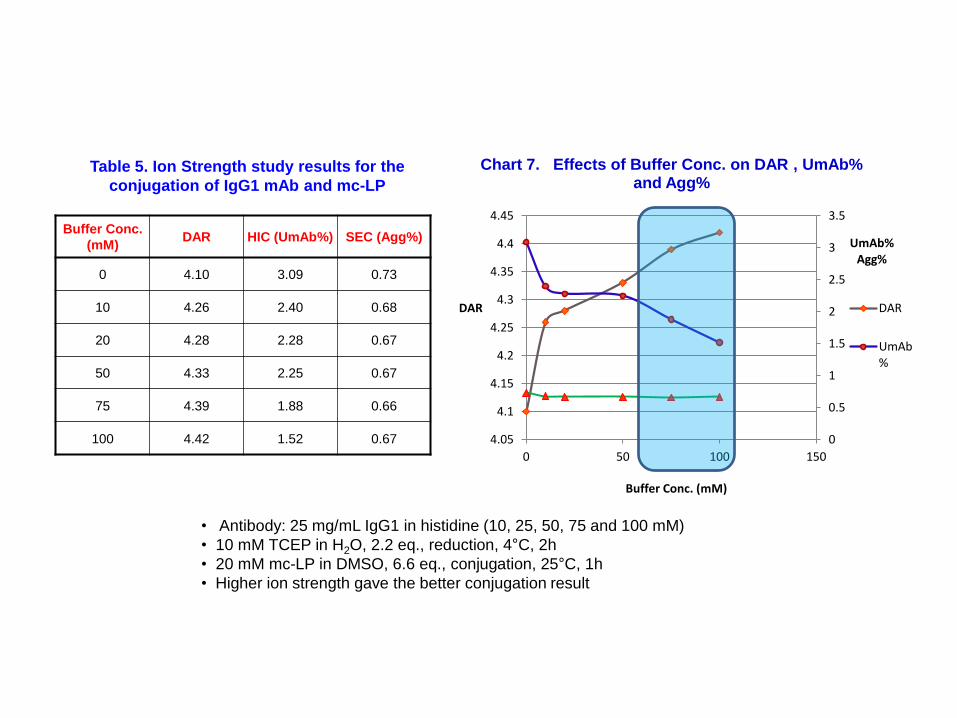
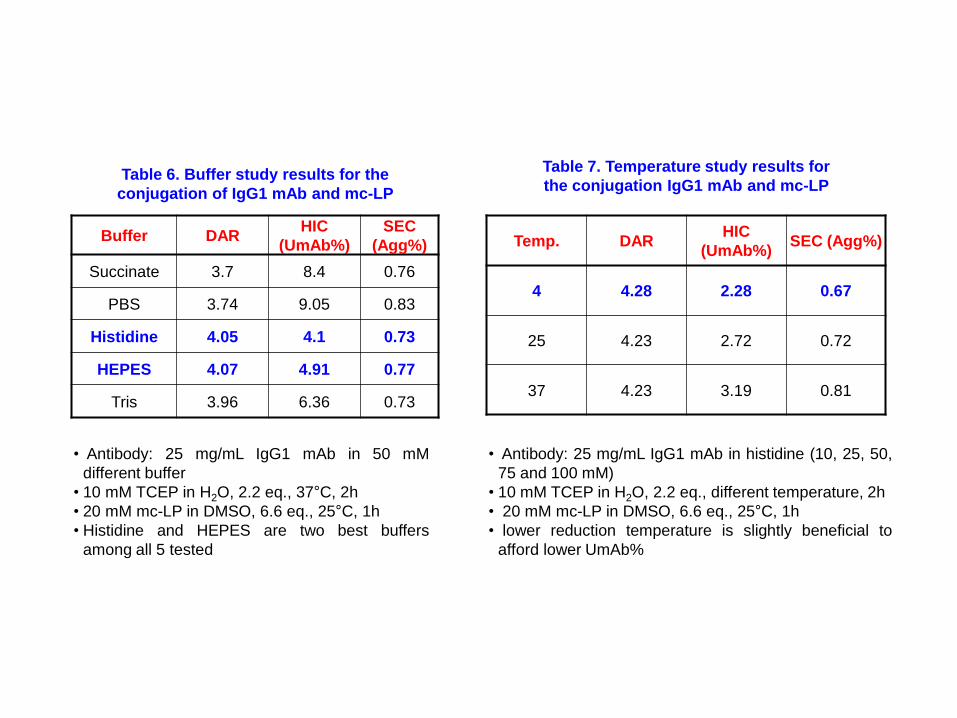
• Antibody: 25 mg/mL IgG1 in histidine (10, 25, 50, 75 and 100 mM)
• 10 mM TCEP in H2O, 2.2 eq., reduction, 4°C, 2h
• 20 mM mc-LP in DMSO, 6.6 eq., conjugation, 25°C, 1h
• Higher ion strength gave the better conjugation result
Table 5. Ion Strength study results for the
conjugation of IgG1 mAb and mc-LP
Buffer Conc.
(mM) DAR HIC (UmAb%) SEC (Agg%)
0 4.10 3.09 0.73
10 4.26 2.40 0.68
20 4.28 2.28 0.67
50 4.33 2.25 0.67
75 4.39 1.88 0.66
100 4.42 1.52 0.67 0
0.5
1
1.5
2
2.5
3
3.5
4.05
4.1
4.15
4.2
4.25
4.3
4.35
4.4
4.45
0 50 100 150
UmAb% Agg%
DAR
Buffer Conc. (mM)
Chart 7. Effects of Buffer Conc. on DAR , UmAb% and Agg%
DAR
UmAb%
Buffer DAR HIC
(UmAb%)
SEC
(Agg%)
Succinate 3.7 8.4 0.76
PBS 3.74 9.05 0.83
Histidine 4.05 4.1 0.73
HEPES 4.07 4.91 0.77
Tris 3.96 6.36 0.73
• Antibody: 25 mg/mL IgG1 mAb in 50 mM
different buffer
• 10 mM TCEP in H2O, 2.2 eq., 37°C, 2h
• 20 mM mc-LP in DMSO, 6.6 eq., 25°C, 1h
• Histidine and HEPES are two best buffers
among all 5 tested
Table 6. Buffer study results for the
conjugation of IgG1 mAb and mc-LP
Temp. DAR HIC
(UmAb%) SEC (Agg%)
4 4.28 2.28 0.67
25 4.23 2.72 0.72
37 4.23 3.19 0.81
Table 7. Temperature study results for
the conjugation IgG1 mAb and mc-LP
• Antibody: 25 mg/mL IgG1 mAb in histidine (10, 25, 50,
75 and 100 mM)
• 10 mM TCEP in H2O, 2.2 eq., different temperature, 2h
• 20 mM mc-LP in DMSO, 6.6 eq., 25°C, 1h
• lower reduction temperature is slightly beneficial to
afford lower UmAb%
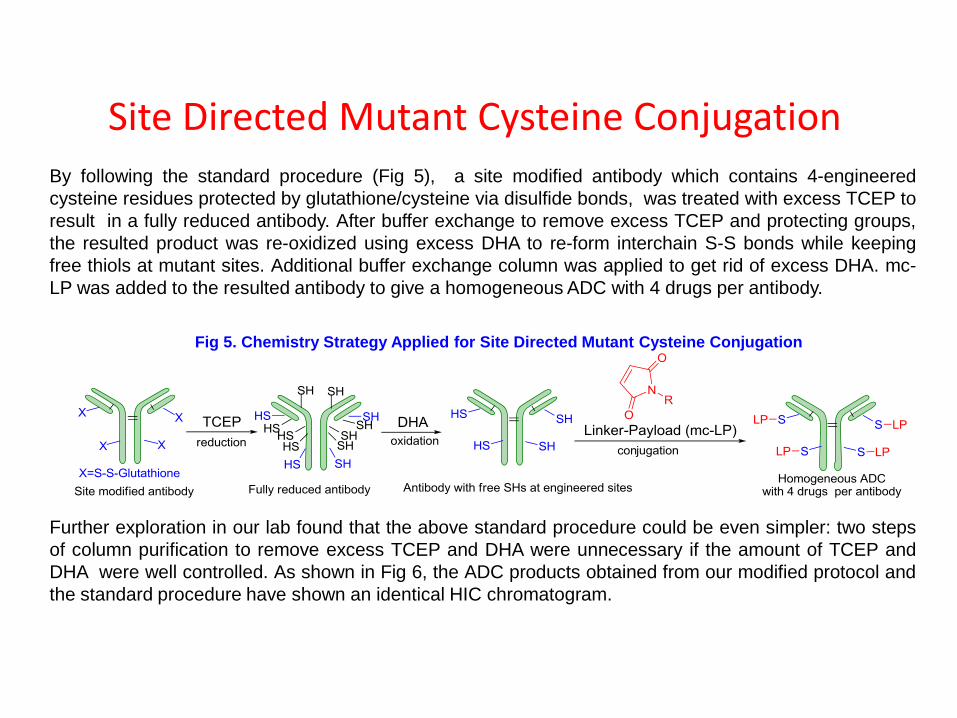
By following the standard procedure (Fig 5), a site modified antibody which contains 4-engineered
cysteine residues protected by glutathione/cysteine via disulfide bonds, was treated with excess TCEP to
result in a fully reduced antibody. After buffer exchange to remove excess TCEP and protecting groups,
the resulted product was re-oxidized using excess DHA to re-form interchain S-S bonds while keeping
free thiols at mutant sites. Additional buffer exchange column was applied to get rid of excess DHA. mc-
LP was added to the resulted antibody to give a homogeneous ADC with 4 drugs per antibody.
Site Directed Mutant Cysteine Conjugation
Fig 5. Chemistry Strategy Applied for Site Directed Mutant Cysteine Conjugation
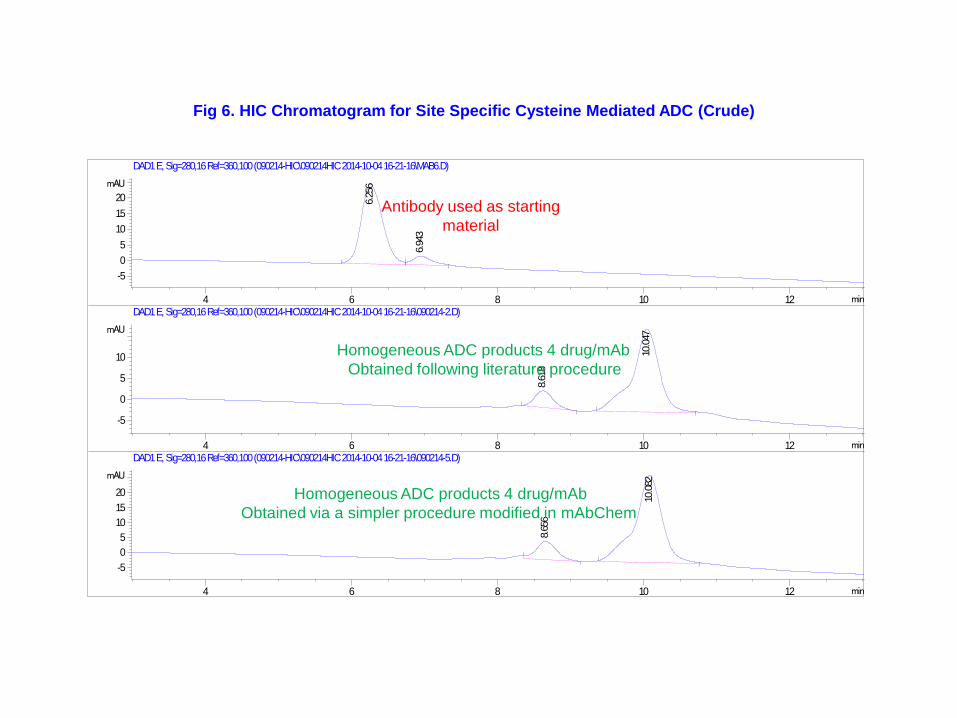
Further exploration in our lab found that the above standard procedure could be even simpler: two steps
of column purification to remove excess TCEP and DHA were unnecessary if the amount of TCEP and
DHA were well controlled. As shown in Fig 6, the ADC products obtained from our modified protocol and
the standard procedure have shown an identical HIC chromatogram.
min4 6 8 10 12
mAU
-5
0
5
10
15
20
DAD1 E, Sig=280,16 Ref=360,100 (090214-HIC\090214HIC 2014-10-04 16-21-16\MAB6.D)
6.2
56
6.9
43
min4 6 8 10 12
mAU
-5
0
5
10
DAD1 E, Sig=280,16 Ref=360,100 (090214-HIC\090214HIC 2014-10-04 16-21-16\090214-2.D)
8.6
18
10.
047
min4 6 8 10 12
mAU
-5
0
5
10
15
20
DAD1 E, Sig=280,16 Ref=360,100 (090214-HIC\090214HIC 2014-10-04 16-21-16\090214-5.D)
8.6
56
10.
082
Fig 6. HIC Chromatogram for Site Specific Cysteine Mediated ADC (Crude)
Antibody used as starting
material
Homogeneous ADC products 4 drug/mAb
Obtained following literature procedure
Homogeneous ADC products 4 drug/mAb
Obtained via a simpler procedure modified in mAbChem
Discussion
• Both lysine mediated conjugation and conventional cysteine mediated conjugation result in ADCs that
have a heterogeneous mixture of drugs per antibody.
• Site directed mutant cysteine conjugation proved to be a good solution to produce an ADC with a
homogeneous number of drugs per antibody.
• In cysteine mediated conjugation, IgG1 mAb was more easily reduced/conjugated with mc-LP than
IgG4 mAb. Using same equivalents of TCEP and mc-LP, ADC products with higher DAR and lower
UmAb% were obtained in IgG1 than IgG4.
• Cysteine and lysine mediated conjugations are highly sensitive to the pH of conjugation buffer, in the
circumstance with pH range of 6~7 (histidine), best conjugation results were obtained.
• Other factors such as buffer, ionic strength, antibody concentration and temperature have smaller
effects on cysteine mediated conjugation.
• The procedure for site directed mutant cysteine conjugation could be simplified by omitting two
column steps to remove the excess reagents for reduction or re-oxidation.
Conclusion
Several reliable and reproducible protocols using a variety of bioconjugation chemistries to make
ADCs were successfully developed. A facile process for site specific mutant cysteine conjugation was
identified. We believe that this modification will be beneficial to the preparation of homogeneous
ADCs, especially in clinical manufacture. Development of new conjugation technologies, such as
enzyme based conjugation and solid phase conjugation, as well as practical application of these
technologies to the conjugation of other antibodies and linker-payloads are under way.