postnord q3 2020
TRANSCRIPT

PostNord Year−end report 2020

POSTNORD
POSTNORD YEAR-END REPORT 2020 2
Overview
Operating income in the fourth quarter was the strongest for a single quarter since Post-Nord was formed in 2009. The transformation program continued to perform well and com-bined with high parcel volumes to produce an improvement in income. E-commerce rose to new record levels as a result of the Corona pandemic, while letter volumes continued to de-cline as a result of the ongoing trend of digitalization. Overall, net sales rose by 11 percent like-for-like. Delivery quality in the mail business remained high, whereas delivery quality in the parcels business was under pressure from very high volumes.
Fourth quarter 2020* Effects of the Corona pan-demic*
• Strong demand, especially for parcels
• Record-breaking income
• Good progress in the transformation program
• Robust growth in e-commerce
• Home deliveries of parcels without phys-
ical contact becomes new standard
• Increased number of Christmas cards
sent
October-December January-December SEKm 2020 2019 2020 2019
Net sales 10,978 10,267 38,729 38,278 Operating income (EBIT) 843 35 2,421 184 Adjusted operating income (EBIT) 833 181 2,071 541 Income before tax 794 -34 2,153 -111 Net income for the period 606 -73 1,711 -239 Earnings per share (SEK) 0.30 -0.04 0.85 -0.12 Cash flow from operating activities 877 1,205 4,151 2,132 Net debt ratio (net debt/equity)** 38% 102% 38% 102% Return on operating capital (ROCE) 18.6% 1.6% 18.6% 1.6% *The report comments on developments in October–December 2020 compared to the same period in 2019 unless otherwise indicated. The term like-for-like refers to the change in fixed currency for compa-rable units. **Net debt ratio, including pensions but excluding lease liabilities.

POSTNORD
POSTNORD YEAR-END REPORT 2020 3
Comments by the President and Group CEO
The Corona pandemic continued to affect us all during the last quarter
of the year. At PostNord, we have focused strongly on reducing the risk
of infection for both employees and customers, who these days are extra
dependent on safe and secure deliveries. Our ability to quickly make ad-
justments to respond to new patterns of behavior in society, combined
with a continued focus on our improvement programs, has paid off. I am
pleased to be able to confirm, that we are reporting both the best interim
result and the best annual result since PostNord was founded in 2009.
Like-for-like sales totaled SEK 10,978m, an increase of 11 percent.
The relative shares of our various businesses continued to shift. Parcel
volumes rose by as much as 27 percent, while mail volumes fell by 11 per-
cent over the quarter overall.
Operating income improved considerably, to SEK 843m (35).
The improvement was driven by several factors; strong demand for
packages was one, of course, but at the same time we maintained very
high productivity and made good progress in our internal improvement
programs. The extra costs incurred through the pandemic were offset by
government compensation to mitigate the effects of the pandemic.
Despite the many challenges that ensued from the Corona pan-
demic, we maintained high delivery quality. In both Sweden and Den-
mark, we are at a level above the legal requirements for letters. As the
spread of infection in society increased – leading to more and more strin-
gent restrictions – e-commerce rose to new record levels. There were
more of us than ever before staying at home, buying Christmas presents
digitally instead of in physical stores. Due to very high parcel volumes,
delivery quality in parcels decreased, but still amounted to 93.5 percent
for the Group overall in the quarter. We have our meticulous prepara-
tions for Black Friday in November and for Christmas shopping in De-
cember to thank for that.
At a time when people have been unable to meet physically, Christ-
mas cards became extra important and for the first time in a very long
time, the volume of Christmas cards increased in Sweden.
Our trial of alternate-day mail deliveries in the Swedish market was
carried out in the autumn, with good results. On 1 February this year, we
introduced the new distribution model in the South region and will sub-
sequently roll it out in the rest of the country in 2021 and 2022.
Dialogue with politicians concerning a long-term financially sus-
tainable mail business continues. In Denmark, the temporary agreement
with the Danish State on compensation for our extra costs incurred in
provision of the universal postal service was extended. In Sweden, the
government appointed an inquiry to examine the conditions for newspa-
per distribution. The government also produced a proposal for easing of
service requirements. These are welcome measures.
In the fourth quarter and for the full year of 2020, we also achieved
our target to reduce Group's total emissions by 40 percent relative to the
2009 level. Work has already begun to achieve the ambition to be fossil-
free by 2030.
In a time of global struggle against the pandemic, and with the
changed behaviors it carries, PostNord has fulfilled an important role in
the society. Much worked out well for PostNord and our financial results
are evidence thereof. This makes us equipped to continue our journey to
become the favorite supplier in the Nordic region, with our customers,
our partners and our highly professional employees.
Annemarie Gardshol
President & Group CEO
“We are reporting both the best interim result and the best annual
result since PostNord was founded in 2009.”

POSTNORD
POSTNORD YEAR-END REPORT 2020 4
Net sales and income
Net sales
Net sales totaled SEK 10,978m (10,267) in the year’s last quarter, +11.1 per-
cent in fixed currency for like-for-like units.
During the quarter, mail volumes decreased by the equivalent of
11 percent (7) as a result of increased digitalization. However, the de-
crease was limited by the fact that in December an increase in volume
was recorded as a result of increased demand for Christmas cards, for
example.
Parcel volumes rose very sharply, above all as a result of changing
consumption behaviors in the wake of the Corona pandemic. A total of
62 million parcels were handled during the seasonally strongest quarter
of the year, an increase of 27 percent (2). Volumes to B2C customers
showed particularly robust growth of 37 percent (5), while volumes to
B2B customers rose 4 percent (-6).
Other operating income increased to SEK 243m (79), mainly due to
compensation for the universal postal service in Denmark, and exchange
rate gains.
Net sales
Income
Operating income totaled SEK 843m (35) in the fourth quarter, an oper-
ating margin of 7.7 percent (0.3). Income benefited from very buoyant
demand in the parcels business, high productivity and measures in ac-
cordance with the ongoing efficiency program. Government compensa-
tion in connection with the Corona pandemic amounted to around
SEK 38m in relation to sick leave costs. Capital gains from property sales
in Denmark contributed SEK 11m. Adjusted operating income therefore
totaled SEK 833m (181). Net financial items amounted to SEK -50m (-68),
mainly consisting of interest expense in connection with leases, pensions
and loans. Tax for the period totaled SEK -188m (-39) and income for the
period SEK 606m (-73).
Return on capital employed (ROCE) improved sharply to 18.6 percent
(1.6), above all as a result of the significant improvement in income over
the year.
Operating income
30 000
32 000
34 000
36 000
38 000
40 000
6 000
7 000
8 000
9 000
10 000
11 000
Q4 Q1 Q2 Q3 Q4
SEKmSEKm
Quarter Rolling 12 months
55%
22%
10%
3%4% 6%
Net sales per segment
Sweden DenmarkNorway FinlandStrålfors Other business activities
36%
64%
Net sales per service category
Communication Services
eCommerce & Logistics
0%
2%
4%
6%
8%
0
200
400
600
800
Q4 Q1 Q2 Q3 Q4
SEKm
Operating income, MSEK
Adjusted operating margin, %
Operating margin, %
2019 2020
2019 2020

POSTNORD
POSTNORD YEAR-END REPORT 2020 5
Cash flow and financial position
Cash flow
Cash flows from operating activities before changes in working capital
totaled SEK 762m (599). The change is mainly attributable to the in-
come earned, revaluation of pension liabilities in accordance with IAS 19
and an increase in paid tax. Working capital rose SEK 115m (606) during
the quarter, mainly in the form of increased trade payables and interim
liabilities, offset by decreased trade receivables. Cash flow from operat-
ing activities totaled SEK 877m (1,205).
Cash flow from investing activities totaled SEK -332m (-485). Invest-
ments in property, plant and equipment and in non-current intangible
assets during the period totaled SEK 392m (506). The investments fo-
cused mainly on vehicles, sorting machines, equipment for third-party
logistics, land and build-up of distribution hubs and IT development.
Cash flow from financing activities totaled SEK -349m (-230). The
change is mainly attributable to amortization totaling
SEK -345 (-240) million of lease liabilities.
Net debt
The Group's net debt, including pensions and lease liabilities, decreased
by SEK 1,415 million during the fourth quarter, mainly due to lower pen-
sion liabilities, lower lease liabilities, higher cash and cash equivalents,
offset by higher short-term interest-bearing debt. The pension liability
decreased during the quarter by SEK 1,330 million, mainly due to a posi-
tive return in Postens Pensionsstiftelse and positive revaluation effects.
The net debt ratio including pensions and lease liabilities was 164 percent
(259). The Group's net debt/equity ratio excluding leasing liabilities was
38 percent (102). The interest-bearing net debt excluding lease liabilities
amounted to SEK 4,100m (3,872).
Financial preparedness at the end of the quarter amounted to SEK
8,229m (5,398), of which cash and cash equivalents totaled SEK 6,229m
(3,398) and unutilized credit facilities SEK 2,000m (2,000). During the
quarter, the credit facility was reduced by SEK 1,000 million, on the basis
of good financial preparedness.
Equity
The Group’s equity increased to SEK 4,906m from SEK 3,331m on Sep-
tember 30, 2020. The change in the quarter was attributable to the in-
come of SEK 606m for the period, a change of SEK 1,103m net after tax in
the pension commitment and translation differences of SEK -134m.
Cash flow from operating activities Net debt and net debt ratio
0
500
1 000
1 500
2 000
2 500
3 000
3 500
4 000
4 500
0
300
600
900
1 200
1 500
Q4 Q1 Q2 Q3 Q4
SEKmSEKm
Quarter Rolling 12 months
0%
100%
200%
300%
400%
0500
1 0001 500
2 0002 5003 0003 5004 0004 5005 000
Q4 Q1 Q2 Q3 Q4
SEKm
Net debt incl. Pensions and lease liabilities,SEKmNet debt ratio incl. pensions and leaseliabilities, %Net debt ratio incl. lensions but excl. leaseliabilities, %
2019 2020 2019 2020

POSTNORD
POSTNORD YEAR-END REPORT 2020 6
Net debt Dec. 31 Sep. 30 June 30 Mar. 31 Dec. 31
SEKm 2020 2020 2020 2020 2019
Interest-bearing liabilities 10,267 10,169 9,524 9,830 9,550
Pensions and disability pension plans 4,318 5,656 5,532 3,346 3,500
Long- and short-term investments -292 -293 -297 -309 -198
Cash and cash equivalents -6,229 -6,053 -4,377 -3,764 -3,398
Net debt incl. pensions and lease liabilities 8,064 9,479 10,382 9,103 9,454
Net debt ratio incl. pensions and lease liabilities 164% 285% 370% 231% 259%
Net debt incl. pensions but excl. lease liabilities 2,001 3,201 4,753 3,187 3,776
Net debt ratio incl. pensions but excl. lease liabilities 38% 87% 164% 79% 102%
Net debt excl. pensions and leases -2,318 -2,455 -779 -159 276
Net debt ratio excl. pensions and lease liabilities -44% -67% -27% -4% 7%
Sustainability information
Delivery quality
Delivery quality in Sweden is still above the legal requirement of 95 per-
cent for stamped letters that must be delivered to the intended recipient
within two working days and has maintained a level of 98.1 percent (97.7)
over the past 12 months. In Denmark, quality also exceeded the legal re-
quirement. Over the past 12-month period, delivery quality for the Brevet
service was 95.4 percent (95.4), compared with the legal requirement
that 93 percent of letters must be delivered to the intended recipient
within five working days.
Overall delivery quality for parcels in the PostNord Group was
95.2 percent (95.9) over the past 12-month period.
Personnel
The average number of employees (FTE) was 28,597, an increase com-
pared with the corresponding period last year (28,156), but a marginal
decrease compared with the previous quarter (28,655).
Sick leave averaged 6.2 percent (5.3) on a trailing 12-month basis,
where the impact in each individual month is limited.
At the end of the quarter, the proportion of women at management
levels 1-3 was 38 percent (35). At levels 4-6, the figure was 32 percent (31).
Sustainable supply chain
The target for a sustainable supply chain in 2020 was that 80 percent of
purchase volumes from significant suppliers should be from those who
accept and comply with PostNord’s Supplier Code of Conduct. The result
for the fourth quarter was 80 percent (76), and so the target was
achieved. During the quarter, 21 suppliers were requested to carry out a
self-assessment and two audits were performed. The ongoing Corona
pandemic meant that most audits that would have been carried out in
the fourth quarter have been deferred until 2021.
Climate impact
Emissions for the fourth quarter amounted to 73,935 tonnes of carbon
dioxide, -5 percent compared with the fourth quarter of 2019 and -40 per-
cent compared with the base year 2009, in like-for-like units. The goal of
-40 percent by the end of 2020 compared to the base year 2009 was
therefore also met in the fourth quarter.
Parent Company
The Parent Company conducted limited operations, in the form of intra-
Group services. No external net sales were recognized during this or the
corresponding quarter last year.
Net income for the period totaled SEK 117m (192).

POSTNORD
POSTNORD YEAR-END REPORT 2020 7
PostNord Sweden
Net sales totaled SEK 6,735m (6,281), an increase of 10 percent (-1) for like-for-
like units. Parcel volumes increased by 23 percent (-5), partly due to the sharp
increase in e-commerce. Mail volumes fell by 11 percent (5).
Operating income totaled SEK 756m (341). The ongoing efficiency programs,
the increase in postal rates on January 1 and the growth in demand for parcel
deliveries all contributed to the strongest quarterly result since the segment
was established in 2015.
Delivery quality for letters was 98.1 percent (97.7). Delivery quality for parcels
was recorded at 94.2 percent (96.3) for the quarter. The sharp increase in the
number of parcels and higher short-term absences brought challenges for pro-
duction.
Net sales and adjusted operating margin
98.1% Delivery quality, mail. Legal requirement 95%
Refers to period January–December 2020
October-December Like−for−like January-December Like−for−like SEKm 2020 2019 Change 2020 2019 Change
Net sales 6,735 6,281 10% 23,694 23,253 4%
— Communication Services (external) 2,702 2,699 0% 9,734 10,116 -4%
— eCommerce & Logistics (external) 3,361 3,142 13% 11,968 11,723 6%
— Internal 672 440 53% 1,992 1,414 41%
Operating income (EBIT) 756 341 122% 2,240 1,092 105%
Operating margin 11.2% 5.4% 107% 9.5% 4.7% 101%
Items affecting comparability - -20 202 -20
Adjusted operating income (adjusted EBIT) 756 361 109% 2,038 1,112 83%
Adjusted operating margin 11.2% 5.7% 96% 8.6% 4.8% 79%
45%55%
Net sales
0%
2%
4%
6%
8%
10%
12%
0
1 000
2 000
3 000
4 000
5 000
6 000
7 000
Q4 Q1 Q2 Q3 Q4 Q1 Q2 Q3 Q4
SEKm
Net sales, SEKm Adjusted operating margin, %
2018 2019
eCommerce & Logistics
Communication Services
2020

POSTNORD
POSTNORD YEAR-END REPORT 2020 8
PostNord Denmark
Net sales totaled SEK 2,729m (2,389), an increase of 18 percent (-2) in fixed cur-
rency for like-for-like units. Mail volumes fell by 12 percent (13). Parcel volumes
increased by 37 (20) percent, primarily driven by strong demand from B2C cus-
tomers.
Operating income totaled SEK 48m (-39). The ongoing transformation pro-
gram was one factor in the improvement in income. Income was also positively
impacted by compensation from the Danish government for the cost of mail
deliveries, as well as by a capital gain of SEK 11 million on a property sale.
Delivery quality for the Brevet service surpassed the legal requirement at
95.4 (95.4) percent. Delivery quality for parcels was under pressure from very
high parcel volumes, ending the quarter at 91.6 (96.5) percent. However, cus-
tomer satisfaction was good thanks to extensive preparations and proactive
communication. Overall delivery quality for parcels was 94.7 percent (96.6)
over the past 12-month period.
Net sales and adjusted operating margin
95.4% Delivery quality, Brevet. Legal requirement 93%
Refers to period January–December 2020
October-December Like−for−like January-December Like−for−like SEKm 2020 2019 Change 2020 2019 Change
Net sales 2,729 2,389 18% 9,305 8,839 6%
— Communication Services (external) 758 896 -14% 2,841 3,439 -16%
— eCommerce & Logistics (external) 1,753 1,319 35% 5,757 4,823 21%
— Internal 218 174 25% 707 577 23%
Operating income (EBIT) 48 -39 120 -155 -
Operating margin 1.8% -1.6% 1.3% -1.8%
Items affecting comparability 11 -64 149 -64
Adjusted operating income (adjusted EBIT) 37 25 48% -29 -91 -
Adjusted operating margin 1.4% 1.0% 30% -0.3% -1.0%
30%
70%
Net sales
-10%
-8%
-6%
-4%
-2%
0%
2%
0
500
1 000
1 500
2 000
2 500
3 000
Q4 Q1 Q2 Q3 Q4 Q1 Q2 Q3 Q4
SEKm
Net sales, SEKm Adjusted operating margin, %
2018 2019
eCommerce & Logistics
Communication Services
2020

POSTNORD
POSTNORD YEAR-END REPORT 2020 9
PostNord Norway
Net sales increased by 14 percent (7) in fixed currency for like-for-like units, to
SEK 1,246m (1,206). Volumes to B2B customers were unchanged with 0 per-
cent (-5) growth during the quarter. Volumes to B2C customers rose
39 percent (16).
Operating income totaled SEK 59m (35). The extra costs incurred as a result
of the changes in the demand situation were offset by price increases.
Delivery quality declined to 93.4 percent (96.4) during the quarter and to
95.3 percent (95.9) over the past 12-month period.
Net sales and adjusted operating margin
October-December Like−for−like January-December Like−for−like SEKm 2020 2019 Change 2020 2019 Change Net sales 1,246 1,206 14% 4,481 4,526 9% — Communication Services (external) 24 17 39% 83 66 33% — eCommerce & Logistics (external) 969 958 13% 3,592 3,683 7% — Internal 253 231 13% 807 777 12% Operating income (EBIT) 59 35 69% 128 62 106% Operating margin 4.7% 2.9% 63% 2.8% 1.4% 108% Items affecting comparability - -12 - -12 Adjusted operating income (adjusted EBIT) 59 47 26% 128 74 73% Adjusted operating margin 4.7% 3.9% 22% 2.8% 1.6% 74%
PostNord Finland
Net sales totaled SEK 366m (334), an increase of 14 percent (0) in fixed cur-
rency for like-for-like units. Sales in logistics operations rose sharply, mainly as
a result of deliveries to the healthcare sector. Parcel volumes to B2B customers
decreased overall by 4 percent (6), while volumes to B2C customers increased
by 7 percent (2).
Operating income totaled SEK 2m (-9). The improvement is mainly due to a
weak result last year in connection with costs for adjustment and effects of a
strike.
Delivery quality increased to 96.1 percent (94.5) during the quarter and
95.6 percent (95.7) over the past 12-month period.
Net sales and adjusted operating margin
October-December Like−for−like January-December Like−for−like SEKm 2020 2019 Change 2020 2019 Change Net sales 366 334 14% 1,371 1,301 6% — Communication Services (external) 0 0 0 8 — eCommerce & Logistics (external) 247 207 19% 922 808 14% — Internal 119 126 -4% 449 484 -7% Operating income (EBIT) 2 -9 10 2 400% Operating margin 0.5% -2.7% 0.7% 0.2% 374% Items affecting comparability - -2 - -2 Adjusted operating income (adjusted EBIT) 2 -7 10 4 150% Adjusted operating margin 0.5% -2.1% 0.7% 0.3% 137%
-2%
0%
2%
4%
6%
750
1 000
1 250
Q4 Q1 Q2 Q3 Q4 Q1 Q2 Q3 Q4
SEKm
Net sales, SEKmAdjusted operating margin, %
2018 2019
-3%
-2%
-1%
0%
1%
2%
3%
200
300
400
Q4 Q1 Q2 Q3 Q4 Q1 Q2 Q3 Q4
SEKm
Net sales, SEKmAdjusted operating margin, %
2018 2019
2020
2020
POSTNORD
POSTNORD YEAR-END REPORT 2020 10
PostNord Strålfors
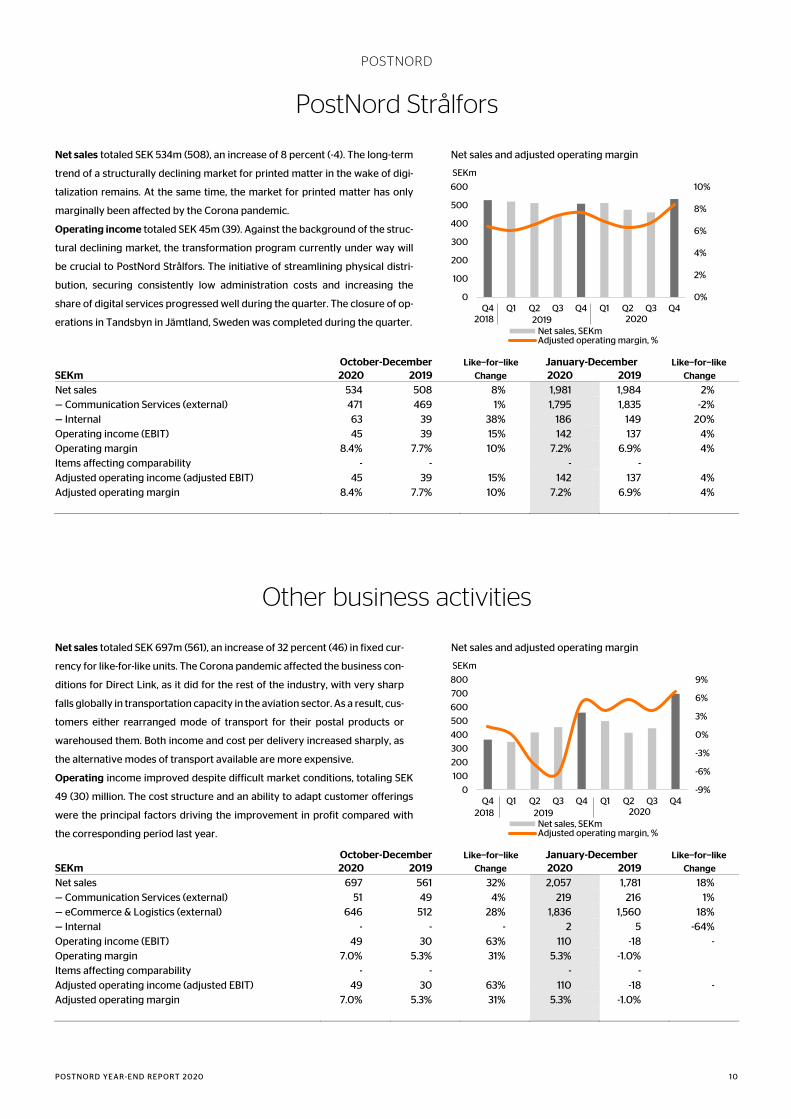
Net sales totaled SEK 534m (508), an increase of 8 percent (-4). The long-term
trend of a structurally declining market for printed matter in the wake of digi-
talization remains. At the same time, the market for printed matter has only
marginally been affected by the Corona pandemic.
Operating income totaled SEK 45m (39). Against the background of the struc-
tural declining market, the transformation program currently under way will
be crucial to PostNord Strålfors. The initiative of streamlining physical distri-
bution, securing consistently low administration costs and increasing the
share of digital services progressed well during the quarter. The closure of op-
erations in Tandsbyn in Jämtland, Sweden was completed during the quarter.
Net sales and adjusted operating margin
October-December Like−for−like January-December Like−for−like SEKm 2020 2019 Change 2020 2019 Change Net sales 534 508 8% 1,981 1,984 2% — Communication Services (external) 471 469 1% 1,795 1,835 -2% — Internal 63 39 38% 186 149 20% Operating income (EBIT) 45 39 15% 142 137 4% Operating margin 8.4% 7.7% 10% 7.2% 6.9% 4% Items affecting comparability - - - - Adjusted operating income (adjusted EBIT) 45 39 15% 142 137 4% Adjusted operating margin 8.4% 7.7% 10% 7.2% 6.9% 4%
Other business activities
Net sales totaled SEK 697m (561), an increase of 32 percent (46) in fixed cur-
rency for like-for-like units. The Corona pandemic affected the business con-
ditions for Direct Link, as it did for the rest of the industry, with very sharp
falls globally in transportation capacity in the aviation sector. As a result, cus-
tomers either rearranged mode of transport for their postal products or
warehoused them. Both income and cost per delivery increased sharply, as
the alternative modes of transport available are more expensive.
Operating income improved despite difficult market conditions, totaling SEK
49 (30) million. The cost structure and an ability to adapt customer offerings
were the principal factors driving the improvement in profit compared with
the corresponding period last year.
Net sales and adjusted operating margin
October-December Like−for−like January-December Like−for−like SEKm 2020 2019 Change 2020 2019 Change Net sales 697 561 32% 2,057 1,781 18% — Communication Services (external) 51 49 4% 219 216 1% — eCommerce & Logistics (external) 646 512 28% 1,836 1,560 18% — Internal - - - 2 5 -64% Operating income (EBIT) 49 30 63% 110 -18 - Operating margin 7.0% 5.3% 31% 5.3% -1.0% Items affecting comparability - - - - Adjusted operating income (adjusted EBIT) 49 30 63% 110 -18 - Adjusted operating margin 7.0% 5.3% 31% 5.3% -1.0%
0%
2%
4%
6%
8%
10%
0
100
200
300
400
500
600
Q4 Q1 Q2 Q3 Q4 Q1 Q2 Q3 Q4
SEKm
Net sales, SEKmAdjusted operating margin, %
2018 2019
-9%
-6%
-3%
0%
3%
6%
9%
0100200300400500600700800
Q4 Q1 Q2 Q3 Q4 Q1 Q2 Q3 Q4
SEKm
Net sales, SEKmAdjusted operating margin, %
2018 2019
2020
2020

POSTNORD
POSTNORD YEAR-END REPORT 2020 11
Major events in October–December 2020
PostNord Denmark’s Universal Service Obligation (USO)
In December, the agreement between Post Danmark A/S and the Danish government regarding the universal service obligation was extended. The
agreement runs until August 31, 2021 and is subject to approval by the European Commission. Compensation for the second half of the year had not
been received at year-end. However, the judgement is that the compensation does not offset PostNord’s costs in Denmark for its universal service
obligation. In Denmark, dialogue with politicians concerning a long-term financially sustainable mail business continues with a view to bringing about
a long-term agreement.
Mathias Krümmel new head of PostNord Sweden
In December, Mathias Krümmel was appointed head of PostNord Sweden. He stepped into his new role on January 1, 2021, when he took over the
position Annemarie Gardshol had held since February 2018, in parallel with her responsibilities as President and CEO of the PostNord Group.
Mathias Krümmel has been employed by the Group since 2000 and has held a number of executive positions at PostNord Sweden over the years.
These included Head of the Solutions business area in 2018, and VP Sales in the period 2014–2017. Most recently, he worked as Head of Production, a
role he held since June 2018.
Mathias Krümmel was born in 1970. He was trained in the Swedish Armed Forces. He will be a part of the Group Leadership Team, GLT, and will
report to President and CEO Annemarie Gardshol.
For information regarding major events in the period January-September 2020, see the interim reports for the first, second and third quarters.
Major events after the reporting period
Alternate-day distribution of letters introduced in the South region of Sweden
Digitalization continues to influence the behaviors of Swedes. The volume of letters has been going down for many years and the need to receive
physical documents has been falling every day. Against that background, PostNord intends to introduce a new delivery model where parcels and
Varubrev continue to be delivered every day and letters on alternate days.
The new model has been tested, evaluated and adjusted during the autumn of 2020. As of February 1 this year, all recipients with postal codes
starting at 2 receive their letters, newspapers and direct mail every other day. Parcel and Varubrev deliveries are not affected by the change. The new
delivery model is an adaptation to a reality that already exists, and many recipients will not notice any major difference. Mail carriers will continue to
hand out letters every weekday, but will go on different rounds depending on what day it is. The service will be the same throughout the country
when the model is fully implemented, and the rural mail carrier will of course continue to deliver. For those needing to send something quickly,
express services will continue to be available. Parcel deliveries will not be affected by the change in mail deliveries, but will be delivered to the recip-
ient's mailbox, as a home delivery or to an agent, just as before. Deliveries to companies with mailboxes will also continue as before.
The introduction of alternate-day delivery is planned for the West region and the Stockholm regions in 2021, and for the rest of the country in
2022.
Annual General Meeting 2021
The Annual General Meeting will take place at 2.00 p.m. on April 27, 2021. Information about the AGM will be published on the website
www.postnord.com.
Dividend proposal
In view of the Company’s continued restructuring requirements, the Board of Directors proposes that no dividend be paid in respect of the 2020
financial year.

POSTNORD
POSTNORD YEAR-END REPORT 2020 12
Full year 2020
Net sales totaled SEK 38,729m (38,278) during the year, an increase of 3.7 percent (-0.4) percent in fixed currency for like-for-like units.
Mail volumes fell by 13 percent (8) as a result of digitalization. A total of 1,379 million (1,584) letters were delivered during the year. Parcel volumes
increased by 14 percent (2) and a total of 198 million (174) parcels were handled during the year. The number of parcels shopped online has increased
significantly because of the Corona pandemic. It had a great impact on our parcel business and resulted in volumes at levels we had anticipated in a
couple of years from now. Net sales for Strålfors were adversely impacted by the long-term trend of a structurally declining market for printed matter.
Direct Link recorded a strong sales growth.
Operating income totaled SEK 2,421m (184) for the year, with an operating margin of 6.3 percent (0.5). The improvement in earnings was mainly
attributable to improved internal efficiency, price increases in the ongoing improvement programs and strong growth in the parcel business. The
ever-lower mail volumes impacted income through lower revenues while the business has a high proportion of fixed costs. An increase in postal rates
in Sweden on January 1, 2020 and government compensation for the universal service obligation in Denmark made a positive contribution. Income
for Strålfors was negatively impacted by lower sales levels for printed material, which was offset by good productivity and a higher proportion of
digital services. Direct Link recorded significantly improved results.
Cash flow from operating activities totaled SEK 4,151m (2,132). The significantly improved income and the sale of properties in Norrköping, Sweden
were the single largest factors behind the more robust cash flow.
Financial preparedness was strengthened during the second and third quarters via the signing of an increased credit facility. The good financial
preparedness built up during the year justified resetting the facility to SEK 2,000 million, which was unutilized at year-end.
Impact of the Corona pandemic
Like society at large, PostNord is impacted by the Corona pandemic. Suppliers and customers risk getting into difficulties. Neither customer losses
nor bad debts have changed significantly since the pandemic broke out in March, but the judgement remains that this may become a risk at the point
in time in the future when the State aid measures are scaled down. In addition, PostNord’s own capacity to delivery is being examined. It is therefore
particularly important:
• To take responsibility. The universal postal service something that we care about. Many people depend on us being able to deliver our
services and in an extraordinary situation, this dependence becomes especially acute. Against that background, it is important to maintain
good delivery capacity and quality, even under difficult conditions. We are working hard to ensure secure deliveries for our customers and
recipients, while looking after our employees at all times.
• To maintain financial preparedness. We are reviewing costs, investment plans and financing options in order to meet the increased uncer-
tainty that the pandemic is causing.
• To see beyond the pandemic. Sound judgements will be needed to equip ourselves properly for life after the pandemic. Customer behaviors
that have changed during the pandemic will not necessarily return to what they were before the outbreak.
In March, sick leave in all segments increased as a result of the Corona pandemic, to 8.7 (5.8) percent. Sick leave gradually returned to more normal
levels in the succeeding months. Short-term absence, for child care and illness, at times had major impact locally, above all at small workplaces where
the effect of a sudden fall in employee numbers is noticeable, as it affects a higher proportion of capacity.
PostNord has received SEK 142m in government compensation directly related to the Corona pandemic. Of the total, SEK 38m was received in the
fourth quarter. The major share of the compensation related to sick leave.
A review of future investment needs has been carried out and a number of investments have been postponed to the future. Investments for full-
year 2020 totaled SEK 1,074m, SEK 282m lower than in 2019.
Solna, February 2, 2021
PostNord AB (publ), CIN 556771–2640
Annemarie Gardshol
President & Group CEO

POSTNORD
POSTNORD YEAR-END REPORT 2020 13
Group Income statement October-December January-December SEKm Note 2020 2019 2020 2019
1
Net sales 10,978 10,267 38,729 38,278
Other operating income 243 79 1,427 351
Operating revenue 3 11,221 10,346 40,156 38,629
Personnel expenses -4,181 -4,176 -15,704 -16,018
Transportation expenses -2,725 -2,924 -10,410 -11,300
Other operating expenses -2,772 -2,495 -8,985 -8,537
Depreciation and impairments -700 -718 -2,636 -2,591
Operating expenses -10,378 -10,313 -37,735 -38,446
OPERATING INCOME 3 843 35 2,421 184
Financial income 11 7 48 23
Financial expenses -62 -75 -317 -318
Net financial items -50 -68 -268 -295
Income before tax 794 -34 2,153 -111
Tax -188 -39 -442 -128
NET INCOME 606 -73 1,711 -239
Attributable to
Parent Company shareholders 607 -73 1,709 -241
Non-controlling interests -1 0 2 2
Earnings per share, SEK 0.30 -0.04 0.85 -0.12
Group Statement of comprehensive income
October-December January-December SEKm 2020 2019 2020 2019
NET INCOME 606 -73 1,711 -239
OTHER COMPREHENSIVE INCOME
Items that cannot be transferred to net income
Revaluation of pension liabilities 1,390 1,433 -182 -1,716
Change in deferred tax -287 -281 37 367
Total 1,103 1,152 -145 -1,349
Items that have been or may be transferred to net income
Cash flow hedges after tax 0 2 -1 0
Translation differences -134 -155 -311 102
Total -134 -153 -312 102
TOTAL OTHER COMPREHENSIVE INCOME 969 999 -457 -1,247
COMPREHENSIVE INCOME 1,575 926 1,254 -1,486
Attributable to
Parent Company shareholders 1,576 926 1,252 -1,488
Non-controlling interests -1 0 2 2

POSTNORD
POSTNORD YEAR-END REPORT 2020 14
Group Statement of financial position
Dec. 31 Dec. 31 SEKm Note 2020 2019
1
ASSETS
Goodwill 2,510 2,619
Other non-current intangible assets 439 608
Property, plant and equipment 6,992 8,113
Right-of-use assets 5,954 5,813
Participations in associated companies 134 111
Non-current interest-bearing receivables 6 280 198
Other non-current receivables 6 411 874
Deferred tax assets 627 491
Total non-current assets 17,350 18,826
Inventories 90 105
Tax assets 299 222
Trade receivables 6 4,967 4,928
Prepaid expenses and accrued income 878 823
Other current receivables 6 600 464
Current interest-bearing receivables 6 11 0
Cash and cash equivalents 6 6,229 3,398
Assets held for sale 65 126
Total current assets 13,139 10,064
TOTAL ASSETS 30,489 28,891
EQUITY AND LIABILITIES
EQUITY 4,906 3,654
LIABILITIES
Non-current interest-bearing liabilities 6 3,243 3,872
Long−term lease liabilities 4,849 4,476
Other non-current liabilities 42 180
Pensions 4,395 4,211
Other provisions 5 1,685 2,548
Deferred tax liabilities 120 142
Total non-current liabilities 14,334 15,428
Current interest−bearing liabilities 6 857 -
Current lease liabilities 1,318 1,202
Trade payables 6 2,877 2,811
Tax liabilities 313 80
Other current liabilities 6 1,503 1,099
Accrued expenses and deferred income 3,643 3,439
Other provisions 5 737 1,083
Liabilities categorized as assets held for sale - 95
Total current liabilities 11,249 9,809
TOTAL LIABILITIES 25,582 25,237
TOTAL EQUITY AND LIABILITIES 30,489 28,891

POSTNORD
POSTNORD YEAR-END REPORT 2020 15
Group Statement of cash flows
October-December January-December SEKm Note 2020 2019 2020 2019
OPERATING ACTIVITIES
Income before tax 794 -34 2,153 -111
Adjustments for non-cash items1 196 696 903 1,958
Income tax paid -228 -63 -362 -188
Cash flows from operating activities before changes in working capital 762 599 2,694 1,659
Cash flow from changes in working capital
Increase(−)/decrease(+) in inventories 6 6 15 -5
Increase(−)/decrease(+) in other operating receivables -1,038 -576 553 8
Increase(+)/decrease(−) in other operating liabilities 1,147 1,176 889 470
Changes in working capital 115 606 1,457 473
Cash flow from operating activities 877 1,205 4,151 2,132
INVESTING ACTIVITIES
Purchase of property, plant and equipment -349 -488 -999 -1,178
Sale of property, plant and equipment 3 43 28 55
Acquisitions of non-current intangible assets -43 -18 -75 -178
Sale of subsidiary, effect on cash and cash equivalents 4 60 - 1,148 -
Acquisition of financial assets -3 -20 -10 -24
Sale of financial assets 0 -2 11 101
Cash flows from investing activities -332 -485 103 -1,224
FINANCING ACTIVITIES
Amortized loans -2 - -86 -1,615
New loans - - - 2,095
Amortized lease liabilities -345 -240 -1,307 -1,086
Dividend paid - - -2 -2
Increase(+)/decrease(−) in other interest−bearing liabilities -2 10 -2 6
Cash flows from financing activities -349 -230 -1,397 -602
CASH FLOWS FOR THE PERIOD 196 490 2,857 306
Cash and cash equivalents, at beginning of period 6,053 2,914 3,398 3,088
Translation difference in cash and cash equivalents -20 -6 -26 4
Cash and cash equivalents, closing balance 6,229 3,398 6,229 3,398
1Adjustments for non−cash items:
Depreciation and impairments 700 717 2,636 2,591
Change in pension liability -273 308 -294 462
Other provisions -139 -327 -879 -1,111
Capital gain, property, plant and equipment sold -9 - -153 -
Capital gain, sale of subsidiaries -6 - -228 -
Other -77 -2 -179 16
Total 196 696 903 1,958

POSTNORD
POSTNORD YEAR-END REPORT 2020 16
Group Statement of changes in equity
January–December 2019 Equity attributable to the Parent Company's shareholders
SEKm Capital stock1
Other con-
tributed
capital
Translation
reserve
Hedging re-
serve
Retained
earnings
Non-control-
ling interests
Total equity
Opening balance Jan. 1, 2019 2,000 10,621 -1,611 0 -5,870 2 5,142
Comprehensive income for the pe-
riod
Net income for the period - - - - -241 2 -239
Other comprehensive income for the
period - - 102 0 -1,349 - -1,247
Total comprehensive income for
the period - - 102 0 -1,590 2 -1,486
Dividend - - - - - -2 -2
Shareholders’ equity, closing bal-
ance Dec. 31, 2019 2,000 10,621 -1,509 0 -7,460 2 3,654
January–December 2020 Equity attributable to the Parent Company's shareholders
SEKm Capital stock1
Other con-
tributed
capital
Translation
reserve
Hedging re-
serve
Retained
earnings
Non-control-
ling interests
Total equity
Opening balance Jan. 1, 2020 2,000 10,621 -1,509 0 -7,460 2 3,654
Comprehensive income for the pe-
riod
Net income for the period - - - - 1,709 2 1,711
Other comprehensive income for the
period - - -311 -1 -145 - -457
Total comprehensive income for
the period - - -311 -1 1,564 2 1,254
Dividend - - - - - -2 -2
Shareholders’ equity, closing bal-
ance Dec. 31, 2020 2,000 10,621 -1,820 -1 -5,896 2 4,906
1 Number of shares is 2,000,000,001: 1,524,905,971 ordinary shares and 475,094,030 series B shares.

POSTNORD
POSTNORD YEAR-END REPORT 2020 17
Income statement Parent Company
October-December January-December SEKm Note 2020 2019 2020 2019
1
Other operating income 5 4 16 27
Operating revenue 5 4 16 27
Personnel expenses -3 -2 -14 -43
Other expenses -7 -16 -21 -76
Operating expenses -10 -18 -35 -119
OPERATING INCOME -6 -14 -20 -92
Interest income and similar income items 6 - 12 -
Interest expenses and similar items -15 -2 -62 -39
Financial items -9 -2 -50 -39
Income after financial items -15 -16 -70 -131
Appropriations 150 230 150 230
Income before tax 135 214 80 99
Tax -18 -22 -18 -22
NET INCOME 117 192 62 77
Statement of comprehensive income Parent Company
October-December January-December SEKm 2020 2019 2020 2019
Net income for the period 117 192 62 77
Other comprehensive income for the period - - - -
COMPREHENSIVE INCOME 117 192 62 77
Summary Parent Company balance sheet
SEKm Note Dec. 31
2020 Dec. 31
2019
1
ASSETS
Financial assets 10,894 10,893
Total non-current assets 10,894 10,893
Current receivables 8,339 8,288
Total current assets 8,339 8,288
TOTAL ASSETS 19,233 19,181
EQUITY AND LIABILITIES
Equity 15,752 15,690
Non-current liabilities 2,938 3,434
Current liabilities 543 57
TOTAL EQUITY AND LIABILITIES 19,233 19,181
POSTNORD
POSTNORD YEAR-END REPORT 2020 18
Notes to the financial statements
Note 1 – Accounting principles
The consolidated accounts have been prepared in accordance with the EU-approved International Financial Reporting Standards (IFRS). The interim
report has been prepared in accordance with IAS 34 Interim Financial Reporting and supplementary rules in the Swedish Annual Accounts Act. The
provisions of Chapter 9 of the Swedish Annual Accounts are applied in the Parent Company. Other disclosures in accordance with IAS 34.16A are
presented both in the financial statements and other parts of the interim report.
New and revised accounting principles
The new or revised IFRS that entered into force in 2020 have not had any impact on the consolidated financial statements. A number of new or revised
IFRS that will come into effect in the financial years ahead have not been adopted early in the preparation of these financial statements. They are not
expected to have a material impact on the Group's or the Parent Company's forthcoming financial reports.
Significant assessments and estimates
The Group continuously monitors credit risk, including payment information regarding trade receivables. The Group’s trade receivables are spread
over various customers, sectors and regions in which the Group operates. Collective provision for expected credit losses based on historical propor-
tion of losses is supplemented by case-by-case assessment of trade receivables. The levels of historical credit losses and proportion of losses are low.
In general, the Group monitors and assesses, on a case-by-case basis, trade receivables that have been due for payment for more than 60 days. In
addition, it assesses on a case-by-case basis major trade receivables where there are indications of increased credit risk. As a consequence of the
Corona pandemic, the assessment remains that the risk of credit losses is increased, especially for customers in the retail sector. Against that back-
ground, the provision for expected credit losses has been increased. The increase is based partly on an adjustment of the historical proportion of
losses and partly on a case-by-case increase of individual provisions.
Note 2 – Risks
The Parent Company and the Group are exposed to strategic, operational and financial risks. In common with society at large, PostNord has been
affected by the Corona pandemic. Thanks to continuity planning, PostNord has been able to maintain our delivery capacity at an acceptable level and
PostNord continues to plan on an ongoing basis to enable deliveries to continue. In addition to increased sick leave among its own personnel, Post-
Nord is also sensitive to a lack of available transportation capacity as a result of increased sick leave at sub-contractors. The current pandemic is also
affecting activities throughout the sector and the markets in which PostNord operates, which is affecting sales and the product mix. The long-term
impact will be determined by the duration of the pandemic and the restrictions ordered by the government concerned, which is affecting trade and
industry as a whole. PostNord is actively using the means at its disposal to adapt its operations to the prevailing situation.
Note 3 – Operating segments
The Group's division into segments is primarily based on the companies' geographical domicile, plus the segments PostNord Strålfors and Other
business activities, which are coordinated according to the nature of the operations. Market pricing is applied to legal transactions between
PostNord’s segments. PostNord has reviewed the Group’s internal pricing for cross-border parcel and pallet services and has adjusted its prices, with
effect from January 1, 2020. The pricing structure has been adjusted in response to changes in conditions within the Group and the changes in
PostNord’s market and product mix in recent years. The operating segments reflect the operational structure.
PostNord Sweden operates in mail, logistics and e-commerce in the Swedish market.
PostNord Denmark operates in letters, logistics and e-commerce in the Danish market and is responsible for PostNord’s e-commerce and logistics
operations in Germany.
PostNord Norway and PostNord Finland operate in logistics and e-commerce in the Norwegian and Finnish markets, respectively.
PostNord Strålfors operates in information logistics. The company develops and offers communications solutions for companies with a large cus-
tomer base. Other business activities incorporates other business activities and Direct Link. Direct Link operates in global distribution of marketing
communications and lightweight goods, mainly for e-retailers. The business is conducted in the USA, the UK, Germany, Poland, Singapore, Hong Kong
and Australia. The Other and eliminations segment consists of shared services and corporate functions including the Parent Company and Group
adjustments. Group adjustments consist of IFRS measurement for pensions under IAS 19 Employee Benefits and IAS 16 Leases. An operational alloca-
tion of the cost of earning defined-benefit pensions is made between Other and eliminations and PostNord Sweden so that each segment carries its
share of the earned entitlement. Eliminations consists of the elimination of internal transactions.

POSTNORD
POSTNORD YEAR-END REPORT 2020 19
Notes to the financial statements
Net sales per segment Q1 Q2 Q3 Q4 Q1 Q2 Q3 Q4 SEKm 2019 2019 2019 2019 2020 2020 2020 2020
PostNord Sweden 5,783 5,757 5,433 6,281 5,824 5,708 5,428 6,735 - of which internal 290 329 355 441 458 418 443 672
PostNord Denmark 2,147 2,228 2,075 2,389 2,187 2,265 2,123 2,729 - of which internal 130 155 118 174 161 171 157 218
PostNord Norway 1,099 1,116 1,105 1,206 1,100 1,066 1,082 1,246 - of which internal 171 192 182 231 174 196 198 253
PostNord Finland 309 324 334 333 314 349 342 366 - of which internal 107 123 128 126 101 116 113 118
PostNord Strålfors 520 511 445 508 512 475 461 534 - of which internal 34 39 37 39 34 44 46 62
Other business activities 348 417 455 561 499 414 447 697 - of which internal 2 2 1 0 1 0 0 0
Other and eliminations -735 -839 -822 -1,011 -932 -949 -964 -1,328
Group 9,471 9,514 9,026 10,267 9,504 9,328 8,919 10,978 Operating income per segment Q1 Q2 Q3 Q4 Q1 Q2 Q3 Q4
SEKm, unless otherwise indicated 2019 2019 2019 2019 2020 2020 2020 2020
PostNord Sweden 283 245 223 341 338 446 701 756 - Operating margin, % 4.9 4.3 4.1 5.4 6.0 7.8 12.9 11.2
PostNord Denmark -54 -10 -51 -39 2 53 17 48 - Operating margin, % -2.5 -0.4 -2.5 -1.6 0.0 2.3 0.8 1.8
PostNord Norway 22 15 -10 35 24 30 14 59 - Operating margin, % 2.0 1.3 -0.9 2.9 2.0 2.8 1.3 4.8
PostNord Finland 2 3 6 -9 -5 6 6 2 - Operating margin, % 0.6 0.9 1.8 -2.7 -1.6 1.7 1.8 0.6
PostNord Strålfors 31 34 33 39 35 30 31 45 - Operating margin, % 6.0 6.6 7.4 7.7 6.8 6.3 6.7 8.4
Other business activities 0 -20 -28 30 19 24 18 49 - Operating margin, % 0.0 -4.8 -6.2 5.3 3.8 5.8 4.0 7.0
Other and eliminations -122 -337 -116 -362 -99 -72 -40 -115
Operating income 162 -70 57 35 314 517 747 843
- Operating margin, % 1.7 -0.7 0.6 0.3 3.3 5.5 8.4 7.7
POSTNORD
POSTNORD YEAR-END REPORT 2020 20
Notes to the financial statements
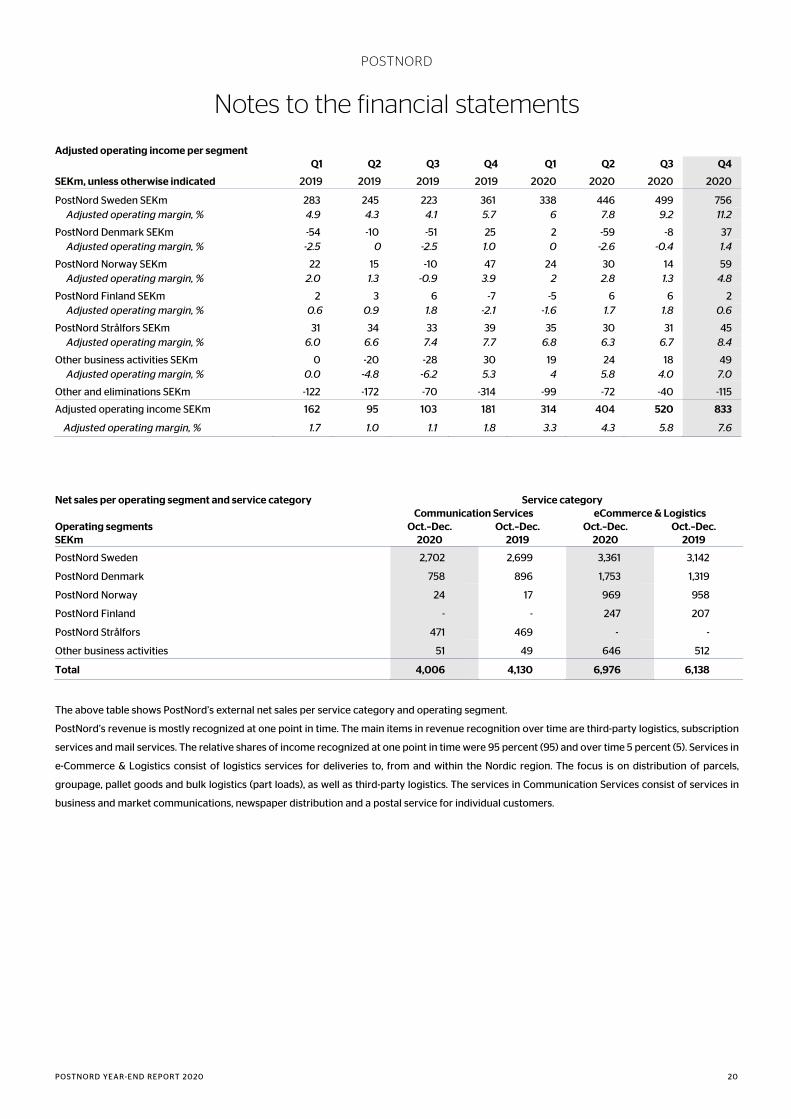
Adjusted operating income per segment Q1 Q2 Q3 Q4 Q1 Q2 Q3 Q4
SEKm, unless otherwise indicated 2019 2019 2019 2019 2020 2020 2020 2020
PostNord Sweden SEKm 283 245 223 361 338 446 499 756 Adjusted operating margin, % 4.9 4.3 4.1 5.7 6 7.8 9.2 11.2
PostNord Denmark SEKm -54 -10 -51 25 2 -59 -8 37 Adjusted operating margin, % -2.5 0 -2.5 1.0 0 -2.6 -0.4 1.4
PostNord Norway SEKm 22 15 -10 47 24 30 14 59 Adjusted operating margin, % 2.0 1.3 -0.9 3.9 2 2.8 1.3 4.8
PostNord Finland SEKm 2 3 6 -7 -5 6 6 2 Adjusted operating margin, % 0.6 0.9 1.8 -2.1 -1.6 1.7 1.8 0.6
PostNord Strålfors SEKm 31 34 33 39 35 30 31 45 Adjusted operating margin, % 6.0 6.6 7.4 7.7 6.8 6.3 6.7 8.4
Other business activities SEKm 0 -20 -28 30 19 24 18 49 Adjusted operating margin, % 0.0 -4.8 -6.2 5.3 4 5.8 4.0 7.0
Other and eliminations SEKm -122 -172 -70 -314 -99 -72 -40 -115
Adjusted operating income SEKm 162 95 103 181 314 404 520 833
Adjusted operating margin, % 1.7 1.0 1.1 1.8 3.3 4.3 5.8 7.6
Net sales per operating segment and service category Service category Communication Services eCommerce & Logistics Operating segments Oct.–Dec. Oct.–Dec. Oct.–Dec. Oct.–Dec. SEKm 2020 2019 2020 2019
PostNord Sweden 2,702 2,699 3,361 3,142
PostNord Denmark 758 896 1,753 1,319
PostNord Norway 24 17 969 958
PostNord Finland - - 247 207
PostNord Strålfors 471 469 - -
Other business activities 51 49 646 512
Total 4,006 4,130 6,976 6,138
The above table shows PostNord’s external net sales per service category and operating segment.
PostNord’s revenue is mostly recognized at one point in time. The main items in revenue recognition over time are third-party logistics, subscription
services and mail services. The relative shares of income recognized at one point in time were 95 percent (95) and over time 5 percent (5). Services in
e-Commerce & Logistics consist of logistics services for deliveries to, from and within the Nordic region. The focus is on distribution of parcels,
groupage, pallet goods and bulk logistics (part loads), as well as third-party logistics. The services in Communication Services consist of services in
business and market communications, newspaper distribution and a postal service for individual customers.

POSTNORD
POSTNORD YEAR-END REPORT 2020 21
Notes to the financial statements
Note 4 – Acquisitions and disposals
No acquisitions were made in 2020 and 2019. Effects of disposals on assets and liabilities, SEKm Jan.-Dec.
2020 Jan.-Dec.
2019
Property, plant and equipment 655 -
Current assets 108 -
Total assets 763 -
Other current liabilities -105 -
Total liabilities -105 -
Net asset 658 -
Purchase consideration received 1,157 -
Less deposit -9 -
Net effect on cash and cash equivalents 1,148 -
Sales of subsidiaries
In the first quarter of 2020, PostNord Group AB sold all shares in property companies Lokesvej 18 ApS and Kometvej 15 ApS in Denmark.
In the second quarter of 2020, PostNord Group AB sold all shares in PostNord Termo AB.
In the third quarter of 2020, PostNord Group AB sold all shares and participations in property companies Kardinalmärket 1 AB och KB Sveterm.
In the fourth quarter of 2020, PostNord Group AB sold all shares in property company M. P. Allerupsvej 61 ApS. The consideration received was SEK
60m. An agreement has been entered into to lease back the property, as a result of which an additional right-of-use asset and lease liability have been
recognized. The sale-and-leaseback transactions have provided the Group with increased cash and cash equivalents while enabling the Group to
continue using the premises. In accordance with IFRS 16, PostNord has recognized income from the transaction that corresponds to the rights trans-
ferred to the buyer. The income from the asset sold is, in accordance with IFRS 16, recognized in the amount of SEK 7m. The remaining portion of the
capital gain is recognized as accrued over the term of the lease.
Note 5 – Other provisions
January–December 2020, SEKm Opening balance Provisions Reversals Utilization Other1
Closing balance
Transformation measures 2,371 100 -22 -1,008 -30 1,411
Non−vested pension commitments 1,191 38 - -272 -11 946
Other 69 1 - -4 -2 65
Total 3,631 139 -22 -1,284 -43 2,422
Of which, current 1,083 737
Of which, Non-current 2,548 1,685
January–December 2019, SEKm Opening balance Provisions Reversals Utilization Other1
Closing balance
Transformation measures 3,147 252 -5 -1,133 110 2,371
Non−vested pension commitments 1,157 47 - -277 264 1,191
Other 68 1 - -3 3 69
Total 4,372 300 -5 -1,413 377 3,631
Of which, current 980 1,083
Of which, Non-current 3,392 2,548
1 Miscellaneous includes translation effect of currency fluctuations, revaluation effect in pensions, discounting effect in provisions and reclassifica-
tions.
POSTNORD
POSTNORD YEAR-END REPORT 2020 22
Notes to the financial statements
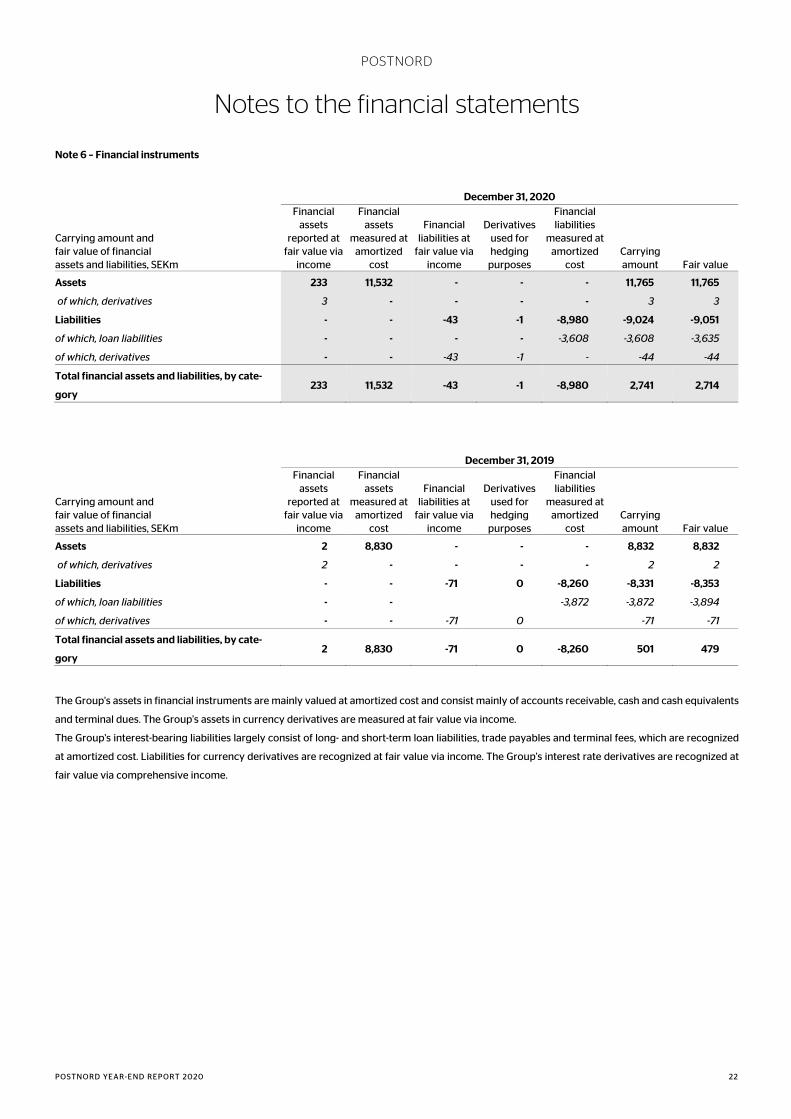
Note 6 – Financial instruments
December 31, 2020
Carrying amount and fair value of financial assets and liabilities, SEKm
Financial assets
reported at fair value via
income
Financial assets
measured at amortized
cost
Financial liabilities at
fair value via income
Derivatives used for hedging
purposes
Financial liabilities
measured at amortized
cost Carrying amount Fair value
Assets 233 11,532 - - - 11,765 11,765
of which, derivatives 3 - - - - 3 3
Liabilities - - -43 -1 -8,980 -9,024 -9,051
of which, loan liabilities - - - - -3,608 -3,608 -3,635
of which, derivatives - - -43 -1 - -44 -44
Total financial assets and liabilities, by cate-
gory 233 11,532 -43 -1 -8,980 2,741 2,714
December 31, 2019
Carrying amount and fair value of financial assets and liabilities, SEKm
Financial assets
reported at fair value via
income
Financial assets
measured at amortized
cost
Financial liabilities at
fair value via income
Derivatives used for hedging
purposes
Financial liabilities
measured at amortized
cost Carrying amount Fair value
Assets 2 8,830 - - - 8,832 8,832
of which, derivatives 2 - - - - 2 2
Liabilities - - -71 0 -8,260 -8,331 -8,353
of which, loan liabilities - - -3,872 -3,872 -3,894
of which, derivatives - - -71 0 -71 -71
Total financial assets and liabilities, by cate-
gory 2 8,830 -71 0 -8,260 501 479
The Group's assets in financial instruments are mainly valued at amortized cost and consist mainly of accounts receivable, cash and cash equivalents
and terminal dues. The Group's assets in currency derivatives are measured at fair value via income.
The Group's interest-bearing liabilities largely consist of long- and short-term loan liabilities, trade payables and terminal fees, which are recognized
at amortized cost. Liabilities for currency derivatives are recognized at fair value via income. The Group's interest rate derivatives are recognized at
fair value via comprehensive income.
POSTNORD
POSTNORD YEAR-END REPORT 2020 23
Notes to the financial statements
Note 7 – Related parties
In the first quarter 2020, Post Danmark A/S received compensation of DKK 112m from the Danish government for maintaining the universal postal
service in Denmark in the period January-June 2020.
At the end of June, the agreement with the Danish government was extended until December 31. The agreement requires approval from the EU
Commission, and the compensation had not yet been received on December 31. Compensation pertaining to the second half-year is recognized, since
the judgement in accordance with IAS 20 Accounting for Government Grants and Disclosure of Government Assistance is that the conditions of the
agreement will be fulfilled and that Post Danmark A/S will receive the compensation.
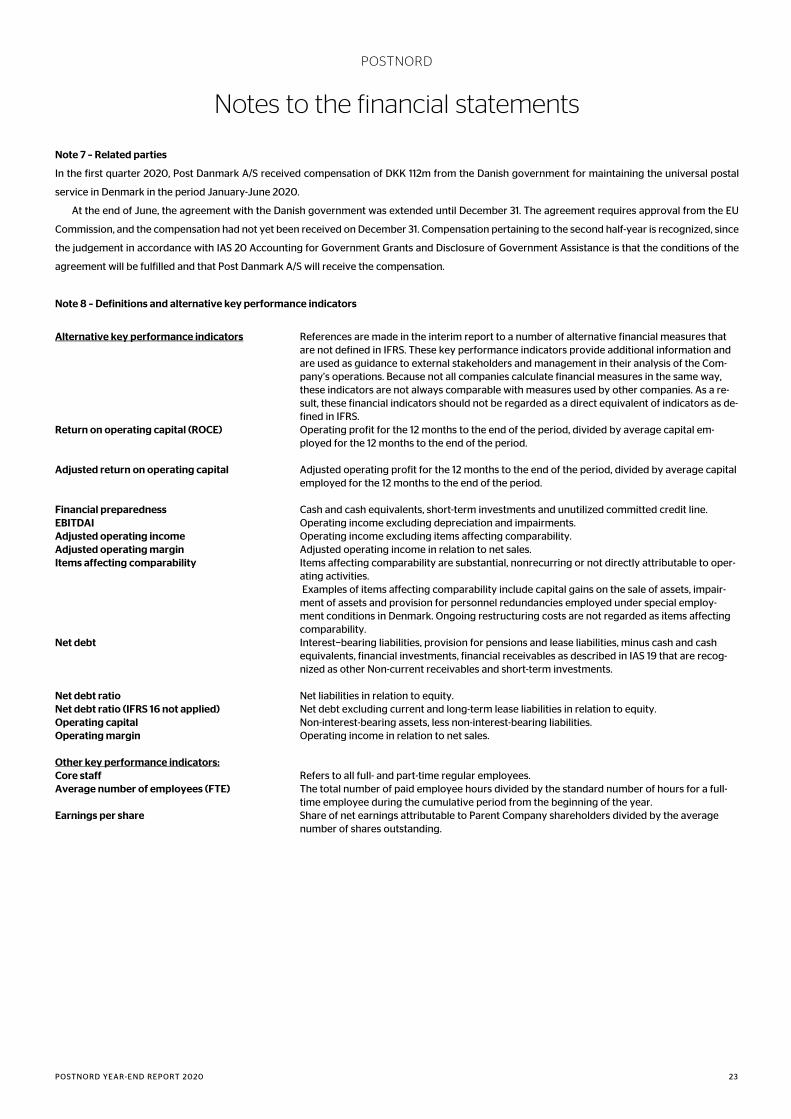
Note 8 – Definitions and alternative key performance indicators
Alternative key performance indicators References are made in the interim report to a number of alternative financial measures that
are not defined in IFRS. These key performance indicators provide additional information and are used as guidance to external stakeholders and management in their analysis of the Com-pany’s operations. Because not all companies calculate financial measures in the same way, these indicators are not always comparable with measures used by other companies. As a re-sult, these financial indicators should not be regarded as a direct equivalent of indicators as de-fined in IFRS.
Return on operating capital (ROCE) Operating profit for the 12 months to the end of the period, divided by average capital em-ployed for the 12 months to the end of the period.
Adjusted return on operating capital Adjusted operating profit for the 12 months to the end of the period, divided by average capital employed for the 12 months to the end of the period.
Financial preparedness Cash and cash equivalents, short-term investments and unutilized committed credit line. EBITDAI Operating income excluding depreciation and impairments. Adjusted operating income Operating income excluding items affecting comparability. Adjusted operating margin Adjusted operating income in relation to net sales. Items affecting comparability Items affecting comparability are substantial, nonrecurring or not directly attributable to oper-
ating activities. Examples of items affecting comparability include capital gains on the sale of assets, impair-ment of assets and provision for personnel redundancies employed under special employ-ment conditions in Denmark. Ongoing restructuring costs are not regarded as items affecting comparability.
Net debt Interest−bearing liabilities, provision for pensions and lease liabilities, minus cash and cash equivalents, financial investments, financial receivables as described in IAS 19 that are recog-nized as other Non-current receivables and short-term investments.
Net debt ratio Net liabilities in relation to equity. Net debt ratio (IFRS 16 not applied) Net debt excluding current and long-term lease liabilities in relation to equity. Operating capital Non-interest-bearing assets, less non-interest-bearing liabilities. Operating margin Operating income in relation to net sales. Other key performance indicators: Core staff Refers to all full- and part-time regular employees. Average number of employees (FTE) The total number of paid employee hours divided by the standard number of hours for a full-
time employee during the cumulative period from the beginning of the year. Earnings per share Share of net earnings attributable to Parent Company shareholders divided by the average
number of shares outstanding.

POSTNORD
POSTNORD YEAR-END REPORT 2020 24
Notes to the financial statements
Note 8 – Definitions and alternative key performance indicators (cont.)
Reconciliation with financial statements Dec. 31 Sep. 30 June 30 Mar. 31 Dec. 31 SEKm 2020 2020 2020 2020 2019 Current interest−bearing liabilities 857 506 5 0 0
Current lease liabilities 1,318 1,342 1,265 1,246 1,202
Non-current interest−bearing liabilities 3,243 3,281 3,784 3,804 3,872
Long−term lease liabilities 4,849 5,040 4,470 4,780 4,476
Pensions1 4,395 5,725 5,601 4,111 4,211
Non-current interest-bearing receivables -188 -189 -190 -199 -198
Non-current interest-bearing receivables,
leases -93 -92 -95 -98 -
Other non-current receivables2 -77 -69 -69 -765 -711
Current interest-bearing receivables - - - - 0
Current interest-bearing receivables, leases -11 -11 -11 -11 -
Cash and cash equivalents -6,229 -6,053 -4,377 -3,764 -3,398
Net debt 8,064 9,479 10,382 9,103 9,454 1Including assets under management. When the assets under management exceed the estimated present value of the pension commitments, they
are recognized under the heading of Non-current receivables. 2 This amount is the portion of non-current receivables that is attributable to funded defined−benefit disability pension plans and defined−benefit
pension plans measured in accordance with IAS 19.
POSTNORD
POSTNORD YEAR-END REPORT 2020 25
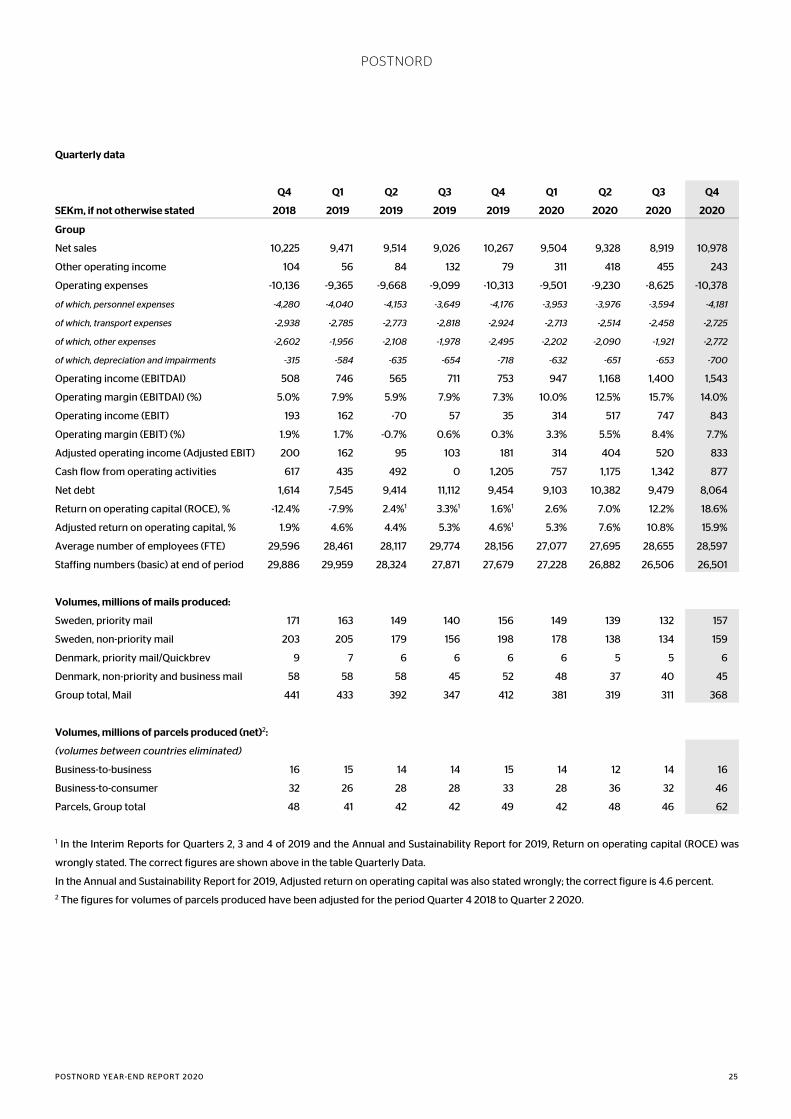
Quarterly data
Q4 Q1 Q2 Q3 Q4 Q1 Q2 Q3 Q4
SEKm, if not otherwise stated 2018 2019 2019 2019 2019 2020 2020 2020 2020
Group
Net sales 10,225 9,471 9,514 9,026 10,267 9,504 9,328 8,919 10,978
Other operating income 104 56 84 132 79 311 418 455 243
Operating expenses -10,136 -9,365 -9,668 -9,099 -10,313 -9,501 -9,230 -8,625 -10,378
of which, personnel expenses -4,280 -4,040 -4,153 -3,649 -4,176 -3,953 -3,976 -3,594 -4,181
of which, transport expenses -2,938 -2,785 -2,773 -2,818 -2,924 -2,713 -2,514 -2,458 -2,725
of which, other expenses -2,602 -1,956 -2,108 -1,978 -2,495 -2,202 -2,090 -1,921 -2,772
of which, depreciation and impairments -315 -584 -635 -654 -718 -632 -651 -653 -700
Operating income (EBITDAI) 508 746 565 711 753 947 1,168 1,400 1,543
Operating margin (EBITDAI) (%) 5.0% 7.9% 5.9% 7.9% 7.3% 10.0% 12.5% 15.7% 14.0%
Operating income (EBIT) 193 162 -70 57 35 314 517 747 843
Operating margin (EBIT) (%) 1.9% 1.7% -0.7% 0.6% 0.3% 3.3% 5.5% 8.4% 7.7%
Adjusted operating income (Adjusted EBIT) 200 162 95 103 181 314 404 520 833
Cash flow from operating activities 617 435 492 0 1,205 757 1,175 1,342 877
Net debt 1,614 7,545 9,414 11,112 9,454 9,103 10,382 9,479 8,064
Return on operating capital (ROCE), % -12.4% -7.9% 2.4%1 3.3%1 1.6%1 2.6% 7.0% 12.2% 18.6%
Adjusted return on operating capital, % 1.9% 4.6% 4.4% 5.3% 4.6%1 5.3% 7.6% 10.8% 15.9%
Average number of employees (FTE) 29,596 28,461 28,117 29,774 28,156 27,077 27,695 28,655 28,597
Staffing numbers (basic) at end of period 29,886 29,959 28,324 27,871 27,679 27,228 26,882 26,506 26,501
Volumes, millions of mails produced:
Sweden, priority mail 171 163 149 140 156 149 139 132 157
Sweden, non-priority mail 203 205 179 156 198 178 138 134 159
Denmark, priority mail/Quickbrev 9 7 6 6 6 6 5 5 6
Denmark, non-priority and business mail 58 58 58 45 52 48 37 40 45
Group total, Mail 441 433 392 347 412 381 319 311 368
Volumes, millions of parcels produced (net)2:
(volumes between countries eliminated)
Business-to-business 16 15 14 14 15 14 12 14 16
Business-to-consumer 32 26 28 28 33 28 36 32 46
Parcels, Group total 48 41 42 42 49 42 48 46 62
1 In the Interim Reports for Quarters 2, 3 and 4 of 2019 and the Annual and Sustainability Report for 2019, Return on operating capital (ROCE) was
wrongly stated. The correct figures are shown above in the table Quarterly Data.
In the Annual and Sustainability Report for 2019, Adjusted return on operating capital was also stated wrongly; the correct figure is 4.6 percent. 2 The figures for volumes of parcels produced have been adjusted for the period Quarter 4 2018 to Quarter 2 2020.
Financial calendar
Contact details
• Annual and Sustainability Report 2020 March 2021
• Annual General Meeting April 27, 2021
• Interim report January– March 2021 April 27, 2021
• Interim report January–June 2021 July 16, 2021
• Interim report January-September 2021 October 28, 2021
Malin Nordén
Head of Communications
Tel.: +46 10 436 00 00
Magnus Larsson
Head of Investor Relations
+46 70 581 55 87
Contact: [email protected]
Sweden
Mailing address: SE−105 00 Stockholm
Visiting address: Terminalvägen 24, Solna
Tel.: +46 10 436 00 00
www.postnord.com
Denmark
Mailing and visiting address:
Hedegaardsvej 88
DK−2300 Copenhagen S
Tel.: +45 (0)70 70 70 30
www.postnord.com
This report has not been reviewed by the auditors.
This information is such that PostNord AB (publ) is obliged to make public pursuant to the EU Market Abuse Regulation and the Securities Markets
Act. The information was submitted for publication, through the agency of the contact person indicated above, at 8.00 a.m. CET on February 2.