potamopyrgus antipodarum in idaho: implications for temperature
TRANSCRIPT

INVESTIGATIONS OF THE INVASIVE NEW ZEALAND MUDSNAIL
POTAMOPYRGUS ANTIPODARUM IN IDAHO: IMPLICATIONS FOR
TEMPERATURE LIMITATIONS
A Thesis
Presented in Partial Fulfillment of the Requirements for the
Master of Science
With a
Major in Fisheries Resources
In the
College of Graduate Studies
University of Idaho
By
Christopher A. James
22 January 2007
Major Professor: Christine M. Moffitt, Ph.D.

ii
AUTHORIZATION TO SUBMIT THESIS
The thesis of Christopher A. James, submitted for the degree of Master of Science
with a major in Fisheries Resources and titled “Investigations of the invasive New
Zealand Mudsnail Potamopyrgus antipodarum in Idaho: Implications for temperature
limitations” has been reviewed in final form, as indicated by the signatures and dates
given below. Permission is now granted to submit final copies to the College of Graduate
Studies for approval.
Major Professor ________________________________ Date__________ Christine M. Moffitt
Committee Members ________________________________ Date__________ James B. Johnson
________________________________ Date__________ Stephanie E. Hampton
Department Administrator________________________________ Date__________ Kerry Paul Reese
Discipline’s College Dean ________________________________ Date__________ Steven B. Daley Laursen
Final Approval and Acceptance by the College of Graduate Studies
_________________________________________ Date_______________ Margrit Von Braun

iii
ABSTRACT
New Zealand mudsnails Potamopyrgus antipodarum (Gray) (family Hydrobidae)
have invaded many streams in the western United States over the past 20 years, including
Idaho waterways. New Zealand mudsnails have been observed in the Silver Creek
drainage, Blaine County, Idaho for at least five years, but their abundance has remained
low and their range appears somewhat restricted. On the other hand, New Zealand
mudsnails occur widely in Riley Creek, Gooding County, Idaho, and at high densities.
This thesis provides the results of surveys for New Zealand mudsnails and monitoring of
temperatures and other abiotic parameters throughout the Silver Creek drainage, and
within a small reach of Riley Creek in 2004 and 2005. These studies confirmed that the
distribution of New Zealand mudsnails in the Silver Creek drainage was limited and
correlated with areas of the drainage where winter water temperatures remained above
0°C in Loving and Silver Creeks. In Riley Creek, the New Zealand mudsnail populations
were robust and abundant, and water temperatures were nearly constant at 15°C
throughout the year. Laboratory trials were conducted to assess the survival of mudsnails
exposed to constant or dynamic cold water temperatures. The laboratory tests confirmed
that exposure of New Zealand mudsnails to temperatures of 0°C for more than 72 h
resulted in 100% mortality. The size at maturation of the two populations of New
Zealand mudsnails sampled from Silver Creek and Riley Creek was different.
Populations from Riley Creek were observed with developing embryos at a smaller size
(>2.5 mm) than snails from Loving Creek (>3.0 mm). This research provides empirical
evidence that winter water temperatures are likely to limit New Zealand mudsnail

iv
invasions. Using this information, managers will be able to prioritize drainages that are
at high risk of invasion by New Zealand mudsnails.

v
ACKNOWLEDGEMENTS
First and foremost, I would like to acknowledge those agencies that financially
supported this research: the Idaho Department of Fish and Game and the Nature
Conservancy of Idaho. Hayspur State Fish Hatchery and Brad Dredge, Hagerman State
Fish Hatchery and Joe Chapman, Silver Creek Preserve staff, and Hagerman National
Fish Hatchery and Bryan Kenworthy graciously provided housing while in the field. In
addition, the Idaho Chapter of the American Fisheries Society, Kelley Creek Flycasters,
and Henry P. Adams Scholarship supported additional incurred academic costs.
Behind the scenes, several individuals made sampling and data collection
possible. In the field, Cassie Rohrbacher, Rachel Record, and especially Josh Gable
worked through sub-zero temperatures to collect samples during the winter. In the lab,
Zach Lockyer, Gabe Madel, Erik Stancik, Josh Flowers, Casey Smith, Lisa Johnstone,
and Charlee Capaul counted too many snails and embryos. I will always be indebted to
my fellow office mates Louise Bruce, Mike Colvin, Jeff Yanke, Kara Anlauf, and John
Cassinelli and the many graduate students for their support, friendship, and last minute
assistance with this project. I would also like to recognize Boling Sun, who I am
especially greatly to, for all her assistance in the lab and her persistent good nature.
I am obliged for the support and incite provided to me by my graduate committee.
I am especially grateful to Dr. Christine M. Moffitt, my major professor, for allowing me
the opportunity to conduct this research. Both Drs. James “Ding” Johnson and Stephanie
Hampton provided intelligent direction on this research. Dr. Christopher Williams was
also instrumental in providing statistical advice for my data analysis.

vi
Finally, I want to recognize the support and love of my family who always
supported me to achieve my goals, whatever they were, and never lost hope when I struck
out to explore life and the world.

vii
DEDICATION
This work is dedicated to my late Grandma Gail, who provided me my fondest
childhood fishing memories and who always put others first. I miss you.
viii
TABLE OF CONTENTS
AUTHORIZATION TO SUBMIT THESIS....................................................................... ii ABSTRACT....................................................................................................................... iii ACKNOWLEDGEMENTS.................................................................................................v DEDICATION.................................................................................................................. vii TABLE OF CONTENTS................................................................................................. viii LIST OF TABLES............................................................................................................. ix LIST OF FIGURES .......................................................................................................... xii LIST OF APPENDICES....................................................................................................xv CHAPTER I: DISTRIBUTION OF NEW ZEALAND MUDSNAILS
POTAMOPYRGUS ANTIPODARUM IN THE SILVER CREEK DRAINAGE, BLAINE COUNTY, IDAHO .........................................................................................1
Abstract ................................................................................................................1 Introduction..........................................................................................................2 Methods................................................................................................................4 Results................................................................................................................11 Discussion..........................................................................................................15 References..........................................................................................................21
CHAPTER II: RELATIONSHIP OF LOWER LETHAL TEMPERATURES AND DURATION OF EXPOSURES ON MORTALITY OF NEW ZEALAND MUDSNAILS POTAMOPYRGUS ANTIPODARUM ..................................................54
Abstract ..............................................................................................................54 Introduction........................................................................................................55 Methods..............................................................................................................58 Results................................................................................................................61 Discussion..........................................................................................................63 References..........................................................................................................68
CHAPTER III: POPULATION DYNAMICS OF NEW ZEALAND MUDSNAILS POTAMOPYRGUS ANTIPODARUM IN SPRING FED STREAMS BELOW TWO FISH HATCHERIES ....................................................................................................84
Abstract ..............................................................................................................84 Introduction........................................................................................................85 Methods..............................................................................................................87 Results................................................................................................................93 Discussion..........................................................................................................99 References........................................................................................................106

ix
LIST OF TABLES
Table 1. Location, sampling date, site number, and relative abundance (per 30 sec kick net) at sites where New Zealand mudsnails were collected in the Silver Creek drainage, 2004. Site numbers correlate to site numbers labeled in Figure 7..................................................................................................................................25
Table 2. Average ±1-SD substrate size and water velocity at sites with and without New Zealand mudsnails from the overall distribution survey in the summer of 2004............................................................................................................................26
Table 3: Results of t-test assessing differences in water velocity and substrate size between New Zealand mudsnail positive and negative sites in the overall distribution survey in the summer of 2004. ...............................................................27
Table 4. Cumulative New Zealand mudsnail positive and negative sites from monitoring sites during the Winter 2004-2005, Summer 2005, Winter 2005-2006 sampling periods. .......................................................................................................28
Table 5. Total New Zealand mudsnails (# of snails/10 s sampling) collected from each site in Reach 1 during the seasonal distribution survey. Site number corresponds to site numbers from Figure 3................................................................29
Table 6. Total New Zealand mudsnails (# of snails/10 s sampling) collected from each site during the seasonal distribution survey in Reach 2. Site number corresponds to site numbers from Figure 4................................................................30
Table 7. Mean (SE) water chemistry parameters recorded at each site (n=40) during all sampling periods for the seasonal distribution survey. NA indicates measurement was not recorded. .................................................................................31
Table 8. Summary of two-way ANOVA testing the effects of Area and Season on differences in log(density) of New Zealand mudsnails from positive sites (3-4, 3-5, 3-6, 3-7, 3-8, and 3-9) in the longitudinal density survey. Sites 3-1, 3-2, and 3-3 were omitted from the analysis because New Zealand mudsnails were not detected at those sites.................................................................................................32
Table 9. Mean and (SE) for water chemistry parameters recorded at each sampling site (n=3) during summer and winter sampling periods for the longitudinal density objective. No data were collected for dissolved oxygen in winter due to equipment failure. ......................................................................................................33
Table 10. Monthly average and (range) of water temperatures °C at longitudinal density sites between sampling periods. NA indicates data were not collected. ......34
Table 11. Average and (range) for water temperatures (°C) recorded throughout the Silver Creek drainage at specified locations by month from June 2004 to February 2006. Site numbers are referenced in Figure 6. NA indicates sites where data were not available....................................................................................35
Table 12. Percent mortality observed in New Zealand mudsnails held in constant temperature trials during October 2005. Snails (N=640) >2.0mm from Riley Creek were evenly distributed into 64 replicate incubation cups and 16 cups placed into individual temperature treatments (0°C, 2°C, and 4°C). At the specified time intervals (1, 2, 4, 8, 24, 48, 72, and 96h) 2 cups were removed

x
from each temperature to assess mortalities. As a control, snails were maintained at maintained at 15°C, comparable Riley Creek temperatures. ..............71
Table 13. Parameter estimates for the probit model of New Zealand mudsnails from Riley Creek tested in constant temperature trials during October 2005. No confidence intervals were estimated because of the large standard error (SE)..........72
Table 14. Mean and (range) of target and observed temperatures (˚C) during constant and dynamic temperature trials of New Zealand mudsnails. ∆(Target-Observed) is the difference between the target and observed temperature mean for constant and dynamic trials and minimum and maximum for dynamic trials only. Constant trials were conducted during October 2005 and dynamic trials during January 2006............................................................................................................................73
Table 15. Percent mortality observed in New Zealand mudsnails collected from Riley Creek (Riley) and Loving Creek (Loving) during January 2006 held in dynamic temperature trials. Snails (N=640 from each source population) were evenly distributed between 128 and cups and 16 cups from each population were placed into all temperature treatments (0±2°C, 2±2°C, 4±2°C, 8°C for Riley control, and 15°C for Loving). At each time intervals (1, 2, 4, 8, 24, 48, 72, and 96h) four cups (2 from each source population) were removed to assess mortality. For controls, only snails from the respective streams were placed into those control temperatures. Loving Creek snails were maintained at 8°C and Riley Creek snails were maintained at 15°C as controls. ....................................................74
Table 16. Parameter estimates for probit models for New Zealand mudsnails collected from Riley Creek and Loving Creek for dynamic temperature trials conducted during January 2006. ................................................................................75
Table 17. Wald’s Chi-square analysis for testing differences between parameter estimates for Riley and Loving Creek snail survival in dynamic temperature regimes during January 2006. Intercept estimates were not testable because of significant differences in the slope estimates.............................................................76
Table 18. Summary of mixed model analysis of variance (ANOVA) testing the differences between mean ranked density (snail·m-2) of NZMS between streams (Riley Creek or Loving Creek), among seasons (winter 2004-2005, summer 2005, or winter. 2005-2006), substrates (gravel, vegetation, or sediment), and all main effect interactions............................................................................................110
Table 19. Summary of P values from multiple comparisons using Tukey’s LS means of the mean ranked density Hatchery*Season interactions from the mixed model ANOVA. ..................................................................................................................111
Table 20. Summary of P values from Tukey’s LS means multiple comparisons test for differences in mean ranked density scores between the substrate main effects.112
Table 21. Mean and (SE) for chemical and physical water parameters recorded during sampling events in Riley Creek and Loving Creek during winter 2004-2005, summer 2005, and winter 2005-2006. ...........................................................113
Table 22. Summary of maximum likelihood analysis for size class distribution using categorical data modeling among seasons (winter 2004-2005, summer 2005, or winter 2005-2006), substrate (gravel, vegetation, or sediment), size (small, medium, and large) and all main effect interactions................................................114

xi
Table 23. Results of individual contrasts of select three-way interactions from categorical data modeling in Riley Creek between season, substrate, and size.......115
Table 24. Parameter estimates and (SE) of simple linear regression analysis for brood sizes based on shell length from Riley Creek and Loving Creek during all three sampling periods. .....................................................................................................116
Table 25. Summary of analysis of covariance (ANCOVA) testing differences in slope for the number of embryos per shell length unit (mm) by season, using shell length as a covariate. .......................................................................................117
Table 26. Summary of analysis of covariance (ANCOVA) testing differences in slope for the number of embryos per shell length unit (mm) by Stream, using shell length as a covariate. .......................................................................................118

xii
LIST OF FIGURES
Figure 1. Map of the Silver Creek drainage from its headwaters to its confluence with the Little Wood River. Dotted lines depict irrigation diversions from the drainage. The location of Silver Creek Preserve, the Nature Conservancy is indicated by a diagonal striped polygon. A cross-hatched polygon represents Idaho Department of Fish and Game’s Sportsmen’s Access and the location of the Idaho Department of Fish and Game’s Hayspur State Fish Hatchery is shown by a gray polygon.......................................................................................................38
Figure 2 Locations of Reach-1 and Reach-2 sampling areas on Silver Creek Preserve (diagonally striped polygon)for the seasonal distribution survey. Open circles denote approximate locations of thermograph recorders...........................................39
Figure 3. Location of 40-randomly selected sample sites in Reach-1 for the seasonal distribution survey. Site numbers correspond to site numbers listed in Table 5. .....40
Figure 4. Location of 40-randomly selected sample sites in Reach-2 for the seasonal distribution survey. Site numbers correspond to site numbers listed in Table 6. .....41
Figure 5. Sampling site locations selected for inclusion in the longitudinal density survey. Gray circles depict sites negative for New Zealand mudsnails while black circles depict sites positive for New Zealand mudsnails. Silver Creek Preserve is depicted with a diagonally striped polygon. Idaho Fish and Game’s Sportsmen’s Access is depicted by the stippled polygon. Hayspur State Fish Hatchery (IDFG) is depicted by the cross-hatched polygon......................................42
Figure 6. Location of temperature recorders deployed in the Silver Creek drainage. Numbered locations correspond to site numbers listed in Table 4. The diagonally striped polygon represents Silver Creek Preserve, the Nature Conservancy, and the cross-hatched polygon represents the Sportsmen’s Access, Idaho Department of Fish and Game. The gray polygon represents Hayspur Hatchery, Idaho Department of Fish and Game. .......................................................43
Figure 7. Map of sites sampled in the Silver Creek Drainage, June - August 2004. Dotted open-circles represent locations with New Zealand mudsnails and site numbers are detailed in Table 1. Closed circles indicate sites with no New Zealand mudsnails detected. Sites 36 and 52 were in the vicinity of previous detections of New Zealand mudsnails but none were found in 2004. The boundary of Silver Creek Preserve, The Nature Conservancy is indicated by a stippled polygon and Hayspur Hatchery (on Butte Creek) and Silver Creek Sportsman’s Access (on Silver Creek), Idaho Department of Fish and Game, are shown with diagonally striped polygons....................................................................44
Figure 8. Spatial distribution of New Zealand mudsnail positive (closed circles) and negative (open circles) sites in Reach-1 collected during the seasonal distribution survey. ........................................................................................................................45
Figure 9. Abundance of New Zealand mudsnails along the stream gradient, upstream to downstream, for the Silver Creek portion of Reach-1. Stippled vertical line represents the confluence with Loving Creek............................................................46

xiii
Figure 10. Spatial distribution of New Zealand mudsnail positive (closed circles) and negative (open circles) sites in Reach-2 collected during the seasonal distribution survey. ........................................................................................................................47
Figure 11. Abundance of New Zealand mudsnails along the upstream to downstream gradient of Reach-2. Stippled vertical line represents the inflow of Sullivan Lake............................................................................................................................48
Figure 12. Thermal regimes observed in Reach-1 and Reach-2 during sampling events for the Seasonal Distribution Survey. Three thermograph data loggers were deployed in each reach and temperatures were recorded every 2 hours. ..........49
Figure 13. Mean log(density) of New Zealand mudsnails from positive sites in the large-scale density survey. Error bars represent 1-S.E. ............................................50
Figure 14. Multiple comparison of mean log(density) results for each site in the large-scale density survey using Fisher’s protected least significant differences. Sites with common horizontal lines are not statistically significant (P>0.05). .........51
Figure 15. Multiple comparison results using Fisher’s protected least significant differences of season effect on mean log(density) for the large-scale density survey. Points with different letters are significantly different from each other (P≤0.05). ....................................................................................................................52
Figure 16. Water temperatures recorded on Loving Creek and Silver Creek (Silver Creek Foot Bridge) and air temperatures on Silver Creek, between 14 June and 19 June, 2004. ............................................................................................................53
Figure 17. Percent mortality of New Zealand mudsnails exposed to constant 0°C at different time intervals during October 2005.............................................................77
Figure 18. Probit model plots for mortality response of New Zealand mudsnails from Riley Creek exposed to constant 0˚C in October 2005. Dashed lines represent calculated LT50...........................................................................................................78
Figure 19. Temperatures in incubation chambers during constant temperature trials of New Zealand mudsnails in October 2005. .................................................................79
Figure 20. Percent mortality of New Zealand mudsnails from Riley Creek (closed circles) and Loving Creek (open circles) exposed to –2 to 2 ˚C in temperature trials during January 2006..........................................................................................80
Figure 21. Probit model plots for mean (solid line) ±95% CI (dashed line) mortality response of New Zealand mudsnails from Riley Cr. and Loving Cr. exposed to fluctuating temperature of 0±2˚C in January 2006. The slopes of the two lines are significantly different (Wald’s χ2 = 5.8821, P=0.0153). Dotted lines represent the calculated LT50. ....................................................................................81
Figure 22. Temperature profiles for recovery/control treatments experienced by New Zealand mudsnails during January 2006, dynamic temperature tests........................82
Figure 23. Temperature deviations from the mean temperature experienced by New Zealand mudsnails in three different treatment regime. ............................................83
Figure 24. Map of the Riley Creek drainage in the Hagerman valley from its headwaters to its confluence with the Snake River. HSFH is the Idaho Department of Fish and Game’s Hagerman State Fish Hatchery. HNFH is the U.S. Fish and Wildlife Service’s Hagerman National Fish Hatchery......................119

xiv
Figure 25. Map of the entire Silver Creek drainage from its headwaters to its confluence with the Little Wood River. Irrigation diversions are noted by grey lines. Silver Creek Preserve, the Nature Conservancy, is indicated by the gray polygon. The black polygons represent Idaho Department of Fish and Game properties: Hayspur Fish Hatchery on Butte/Loving Creek and the Silver Creek Sportsman’s Access Site on Silver Creek. ...............................................................120
Figure 26. Mean ranked density scores of NZMS observed in Loving Creek and Riley Creek from winter 2004-2005 to winter 2005-2006 in different substrate types. Error bars represent 1-Standard Error. .........................................................121
Figure 27. Least square means comparison of mean ranked density scores of New Zealand mudsnails between Riley Creek and Loving creek across three different seasons. Error bars depict ±1 SE.............................................................................122
Figure 28. Least square means comparison of mean ranked density scores for New Zealand mudsnails from both Riley Creek and Loving Creek, combined, across three different substrates. Error bars depict ±1 SE. ................................................123
Figure 29. Average daily temperatures recorded every two hours areas of where New Zealand mudsnails were collected from Riley Creek (dash dotted line) and Loving Creek (solid line) between January 2005 to March 2006............................124
Figure 30. Distribution of the proportion of snails in individual size classes from Loving Creek during three sampling periods from winter 2004-2005 to winter 2005-2006 in different substrates.............................................................................125
Figure 31. Distribution of the proportion of snails in individual size classes from Riley Creek during three sampling periods from winter 2004-2005 to winter 2005-2006 in different substrates. The right y-axis in the winter 2004-2005 pane is scaled for large snails only. ..................................................................................126
Figure 32. Simple linear regression and 95% C.I. of the number of embryos per brood vs. shell length for snails from Riley and Loving Creek during the winter of 2004-2005. ...........................................................................................................127
Figure 33. Simple linear regression and 95% C.I. of the number of embryos per brood vs. shell length for snails from Riley and Loving Creek during the summer of 2005. ....................................................................................................................128
Figure 34. Simple linear regression and 95% C.I. of the number of embryos per brood vs. shell length for snails from Riley and Loving Creek during the winter of 2005-2006. ...........................................................................................................129

xv
LIST OF APPENDICES
Appendix A. Nutrient levels recorded in Riley Creek below Hagerman National Fish Hatchery (HNFH) and throughout the Silver Creek drainage by various resource agencies. Nr denotes measurements not recorded. .................................................130

1
CHAPTER I: DISTRIBUTION OF NEW ZEALAND MUDSNAILS
POTAMOPYRGUS ANTIPODARUM IN THE SILVER CREEK DRAINAGE,
BLAINE COUNTY, IDAHO
Abstract
In 2004 and 2005, the Silver Creek drainage was sampled extensively for New
Zealand mudsnails Potamopyrgus antipodarum (Gray) (family Hydrobiidae). Sampling
sites were selected from digital maps at 1 km intervals to conduct an overall distribution
survey throughout the Silver Creek drainage between June and August 2004. New
Zealand mudsnails were identified at 5 of the 56 sites visited, and the relative abundance
of snails from a 30 sec kick net sampling effort ranged from 2 to 2,220 snails. Water
temperatures were monitored throughout the drainage with an array of temperature
loggers from June 2004 to February 2006 and ranged from a high of 26.3°C in July 2005
to a low of –2.0°C in December 2005 fluctuating daily with air temperatures. Seasonal
distributions of New Zealand mudsnails were constricted during the winter sampling
periods (December 2004 and 2005) when compared to summer sampling events (June
2005) on Silver Creek Preserve. Winter densities throughout Butte/Loving Creek and
Silver Creek were lower during winter sampling than during summer sampling and
showed a strong longitudinal pattern. Densities were generally greater at upstream sites
than sites located further downstream. New Zealand mudsnails appear to be limited in
their distribution within the Silver Creek drainage and winter water temperatures may
play a significant role in this limitation.

2
Introduction
New Zealand mudsnails Potamopyrgus antipodarum (Gray) (family Hydrobiidae)
were first detected in North America in 1987 in the Middle Snake River near Hagerman,
Idaho (Bowler 1991). In less than 20 years, they have spread throughout the Middle
Snake River drainage and to other waterways in Idaho, Montana, Wyoming, Utah,
Oregon, and California (Richards et al. 2004a) and have recently been found in the Great
Lakes (Zaranko et al. 1997). During the summer of 2001, New Zealand mudsnails were
detected during sampling on Silver Creek Preserve, Blaine County, Idaho ,a property
managed by the Nature Conservancy, hereafter referred to as Silver Creek Preserve. A
more detailed survey of Silver Creek Preserve and neighboring public access sites was
conducted in October of 2003 (Richards and Lester 2003). Snails were found at six sites
located between Butte Creek and Loving Creek near Hayspur Hatchery operated by Idaho
Department of Fish and Game, and on Silver Creek near the Silver Creek Preserve
Visitor Center, hereafter referred to as Visitor Center.
Several modes of passive and active dispersal have been speculated to account for
the rapid expansion of the New Zealand mudsnail. Active modes of dispersal including
volitional upstream and downstream movements as well as drifting downstream
(Richards et al. 2001) should limit New Zealand mudsnail expansion to within a drainage
system. On the other hand, passive dispersal modes are most likely responsible for
introduction into new water systems. Human activities related to aquaculture and sport-
fishing are most often criticized as major vectors resulting in the spread between
drainages (Bowler 1991, Frest and Bowler 1993, Richards and Lester 2003, Richards et
al. 2004b). However, passive dispersal may also be mediated by more natural

3
mechanisms, such as waterfowl and fish migration patterns. Although none of these
dispersal modes has been specifically documented, both waterfowl and fish are known to
prey on New Zealand mudsnails (Graynoth et al. 1986, Sagar and Glova 1995, Levri and
Lively 1996, Levri 1998, Graynoth and Taylor 2004) and tend to be abundant in areas
where New Zealand mudsnails occur at in Idaho (i.e. the Hagerman Valley and the Silver
Creek drainage). Researchers have shown that New Zealand mudsnails can survive the
passage through the digestive system of a fish (Aarnio and Bonsdorff 1997, Bruce 2006).
Also, Malone (1965) noted that birds are primary dispersal agents for fresh water
molluscs and that individual snails of the species Lymnea obrussa (Say) were able to
survive more than 14 h out of water on the amputated leg of a killdeer Chardrius
vociferous (Linnaeus). Knowing that New Zealand mudsnails can survive desiccation for
periods longer than 60 h (Richards et al. 2004b), it is easy to recognize the dispersal
potential of waterfowl and other migratory birds for New Zealand mudsnails.
Because the New Zealand mudsnail is asexual and ovoviviparous, it possesses a
distinct reproductive advantage over many aquatic organisms in invaded habitats in
addition to predator release from the castrating parasite Microphallus spp present in its
native range which renders the snail infertile (Jokela and Lively 1995, Levri and Lively
1996, Levri 1998, Jokela et al. 1999). A female mudsnail can brood between 20-100
embryos at a time (Winterbourn 1970b, Schreiber et al. 1998, Richards and Lester 2000,
Richards 2004). The salient implication of this strategy is that only one snail would be
required for reproduction and initiation of a population in a new habitat. Given the
extensive spatial scale of human recreational activities (i.e. fishing, water-fowl hunting,
and boating) in addition to fish and wildlife migration patterns, New Zealand mudsnails
4
appear highly adapted for invading naïve habitats. Indeed, Silver Creek possesses many
potential invasion routes and should be a prime area for expansion of New Zealand
mudsnails.
When New Zealand mudsnails reach high densities, they may affect the invaded
ecosystems by altering the community structure of the primary producers and limiting the
food and habitat available for aquatic insects that are important prey for fish (Hall et al.
2003, Cada and Kerans, in preparation, in Cada 2004, Hall et al. 2006). Reduced food
availability for fish and altered trophic dynamics on Silver Creek may affect the
resources of this important recreational area, with the potential to further disrupt the
trophic level interactions beyond the aquatic environment. As of yet, little knowledge
exists on the limitations for New Zealand mudsnail populations, and they appear to have
the potential to expand unimpeded. The objectives of this study were to 1) better
delineate the distribution of New Zealand mudsnails in the Silver Creek watershed and 2)
determine if the population appears to be expanding beyond the initial reported
distribution and density.
Methods
Study Area
Silver Creek is a high-desert, spring-fed stream system located in central Idaho
approximately 170 km east of Boise, Idaho and 44 km south of Sun Valley, Idaho (Figure
1). Ground-water springs in the Silver Creek drainage are supplied by the Big Wood
River watershed draining approximately 2,280 km2 (Brown 2000). Annual discharge
within Silver Creek averages 100 to 123 million m3 per year (Brown 2000) with little
intra-annual variability (Francis and Bjornn 1979). Silver Creek, and its tributaries, flow
5
for approximately 110 km to a confluence with the Little Wood River. The uppermost
tributary, Stalker Creek, is formed by the confluence of the southerly flowing Patton
Creek and Buhler Drain. As Stalker Creek flows east, Cain Creek and Mud Creek
contribute as tributaries from the north. Silver Creek originates when Grove Creek and
Stalker Creek combine on Silver Creek Preserve. Silver Creek is fed by Loving Creek,
just before it flows out of the Silver Creek Preserve. From the preserve, Silver Creek
flows in an easterly direction until it turns and flows south at State Highway 20 just east
of the town of Picabo, Idaho. At this junction, Silver Creek flows into a confined canyon
with increased gradient and water velocity until its confluence with the Little Wood
River.
Overall Distribution Survey
To determine the overall distribution of New Zealand mudsnails in the Silver
Creek drainage, sites for sampling were projected from digital-orthophoto quadrangle
maps (1:24,000 scale). Points were generated for sites at one km distances along the
drainage and corresponding Universal Transverse Mercator (NAD-27) coordinates were
extracted using ArcView/GIS v3.2 (Environmental Systems Research Institute 1999).
Through this process, 117 sites were identified, but only 56 were sampled due to access
restrictions on private lands.
Sites were located in the field using an e-Trex GPS unit (Garmin International,
Inc., Olathe, Kansas). At each site, three separate 10-second kick-net samples were
collected from the nearest gravel substrates using a D-framed kicknet with a 500 µm
mesh collection net. Samples were collected by vigorously kicking the substrate to
suspend the macro-invertebrates into the water column then allowing them to drift

6
downstream into the net. The single most dominant substrate was visually classified
following the Wentworth classification scale (McMahon et al. 1996): small gravel =2-
4mm, medium gravel=4-8mm, large gravel=8-16mm, small pebble=16-32mm, and large
pebble=32-64mm. Each invertebrate sample was processed through a series of three
sieves (4.75 mm, 2.36 mm and 1.70 mm) to remove large debris. The contents of the
sieves were placed on a sorting tray and sorted to determine the presence of New Zealand
mudsnails with the aid of a 10-X OptiVISOR® (Donnegan Optical Company, Lenexa,
Kansas) for magnification. If New Zealand mudsnails were present, the sample was
placed in a container, labeled and taken back to the field-lab for further sorting and
enumeration. After final sorting, New Zealand mudsnail specimens were preserved in
10% formalin solution overnight, rinsed, and transferred to 70% ethanol for storage at the
University of Idaho.
Seasonal Distribution
Samples were collected to assess the seasonal distribution of New Zealand
mudsnails at the upstream and downstream boundaries of their distribution on Silver
Creek Preserve. The downstream boundary, defined as Reach-1, was located at the
confluence of Loving Creek and Silver Creek and extended 100 m upstream on both
waterways and 100 m downstream from their confluence (Figure 2). The upstream
boundary, Reach-2, was located on Silver Creek near the outflow of Sullivan Lake and
extended 250 m upstream and downstream (Figure 2). Within each reach, forty points
were randomly selected (Figures 3 & 4) using a Sampling Generator Extension for
ArcView v.3.2 (Environmental Systems Research Institute 1999) available from the
Minnesota Department of Natural Resources (http://www.dnr.state.mn.us). Each point

7
was constrained to a one meter diameter with a five meter buffer zone, ensuring that no
two points were located within less than six meters of one another.
We located each point during sampling with a Garmin e-Trex GPS unit (Garmin
International, Olathe, KS) and a hardcopy of maps from the digital projection.
Invertebrate samples were collected by using the same D-framed kick-net and methods
used in the overall distribution survey, except that vegetation and sediment substrates
were included in this sampling regime. Following collection, the samples were processed
through a series of three sieves (2 mm, 1 mm, and 500 µm) to remove larger pieces of
debris and fine sediments. Samples were then be placed into a labeled container,
preserved in 10% formalin solution overnight and then transferred to 70% ETOH for
further processing and storage. Sampling was performed during the winter of 2004-2005,
the summer of 2005, and the winter of 2005-2006 within each reach.
After collection and preservation, the samples were returned to the University of
Idaho and hand sorted in the lab. The samples were sub-sampled on a sectioned sorting
tray consisting of 32 equal sized cells. The sub-sampling area was contained by 4
plexiglass retaining walls ~10 cm high. Individual samples were placed into the center of
the sub-sampling tray and standard tap water was added to make the sample more fluid.
Samples were then swirled with a metal chemical spatula to strive for a relatively uniform
distribution of all organisms. Four cells were randomly selected for removal using a
random numbers generator program in SAS 9.2. Sub-samples were removed using two
metal chemical spatulas for larger substances and a small pipette for smaller substances.
Once collected, sub-samples were then placed into a small glass jar and filled with 70%

8
ETOH. Samples were then hand sorted at a later date to identify and enumerate New
Zealand mudsnails.
Longitudinal Densities
From the overall distribution survey, we selected 9 sites (6 positive and 3 negative
for NZMS) to assess densities of New Zealand mudsnails between winter and summer
along a temperature gradient (Figure 5). The farthest upstream sites had more stable
temperatures and, in general, were cooler during the summer months and warmer during
the winter months in comparison to downstream sites.
At each site, a modified Hess sampler was used to collect New Zealand
mudsnails. The Hess sampler (sampling area=0.086 m2, 500 µm mesh) was modified
with a 91.4 cm long, 35.6 cm diameter tube of sheet metal. The tube was further
modified with a 35.6 cm to 30.5 cm reducer on the bottom that allowed it to be inserted
into the top of the Hess sampler when water levels were higher than the Hess sampler
itself. A stable fork, with its width and tongs trimmed to approximately 20 cm, was used
to manipulate gravel substrate confined inside of the modified Hess sampler at each site.
Gravel was selected as the sampling substrate because of the ease of processing the
samples both in the field and in the lab and to reduce any variation involved with
sampling multiple substrate habitats. Once collected, samples were processed and
preserved in identical fashion as those previously outlined in the seasonal distribution
survey.
Water Quality and Temperature Monitoring
Water quality was monitored during both the seasonal distribution survey and the
longitudinal density sampling. A YSI Multi-probe 556 (Yellow Springs, OH) was used

9
to measure conductivity (mS/cm), total dissolved solids (TDS), dissolved oxygen (mg/L),
salinity (ppt), and pH at all of the respective sampling sites when sampling was
preformed. Water velocities were recorded at each site during sampling, including sites
sampled for the overall distribution survey. A Marsh-McBirney Flow-Mate® Model
2000 was utilized to measure velocities at 60% of depth.
Water temperatures in the drainage were recorded electronically with HOBO8
Data loggers (Onset Corporation, Pocasset, Massachusetts). For the Seasonal
Distribution survey, three loggers were placed within each reach near the upper, middle,
and lower bounds of each reach (Figure 2). Loggers were also placed to monitor
temperatures at sampling sites for the longitudinal density experiment. Additional
loggers were placed near areas of known New Zealand mudsnail locations as well as near
areas where New Zealand mudsnails had not been detected (Figure 6). Water
temperatures were monitored between June 2004 and February 2006, although not all
sites were monitored throughout the entirety of the period. Temperature loggers were set
to record temperatures at two-hour intervals and checked periodically to recover data and
provide any necessary maintenance.
Data Analysis
Overall Distribution ─ Samples of P. antipodarum from the three kick net
samples at each site were combined for a total count of snails in a combined 30 sec
sampling effort and water velocities averaged for each site. Substrate particle sizes were
converted from categorical data to numerical data with small gravel equal to one and each
consecutive class increasing by an increment of one up to large pebble equal to five.
Substrate data were then averaged for each site. Differences in average water velocities

10
and substrate particle sizes between positive and negative sites were tested using two-
sample t-tests with the models water_velocity = snail_presence and substrate_size =
snail_presence.
Seasonal Distribution ─ Abundances at each site (snails/10 s kick-net sampling)
were graphed in an x, y coordinate plane to assess any potential linear relationships.
Because of the two-dimensional aspect of the sampling reach, all points were snapped to
a linear line that followed the contour of the reach. The distance downstream of each site
from the upper most site were plotted on the x-axis and New Zealand mudsnail
abundances per 10 s kick-net sampling was plotted on the y-axis. A locally weighted
regression smoother (LOESS, SigmaPlot 9.0, Systat Software, Inc.) was fit to the data to
assess any linear dependencies of downstream distance and New Zealand mudsnail
abundances. Because of different distance intervals between sites, a nearest neighbor
distance was used for the bandwidth. Sites located within the Loving Creek portion of
the Reach 1 were omitted from this assessment. Tributary inflows within each reach
were also plotted on the graph to assess any potential New Zealand mudsnail sources
supplied to the sampling reach.
Longitudinal Density ─ An analysis of variance model was used to test for
differences in densities of New Zealand mudsnails between each site and season and
possible interaction effects of these two sources. Prior to testing the model, density data
were log transformed to meet the model assumptions of normality and equal variance.
The model log(density) = site+season+site*season was fit to the data after
transformation. After testing the model, differences between significant factors were
tested using Fisher’s protected least significant difference. Physical parameters of water

11
chemistry (conductivity, TDS, salinity, dissolved oxygen, and pH) were averaged for
each reach between the two sampling seasons.
All statistical tests were performed using SAS v9.2 Software (SAS Institute Inc.
2003) and results with a P of <0.05 were considered significant.
Results
Overall Distribution
New Zealand mudsnails were found at five of 56 sites (Figure 7). The
abundances ranged from 2 - 2,220 snails per 30 sec sampling effort (Table 1). The
highest relative abundance was in Loving Creek and abundances decreased downstream
to the confluence with Silver Creek (Figure 7, Table 1). The lowest abundance was just
upstream of the Visitors Center at Site 5 (Figure 7, Table 1). New Zealand mudsnails
were not detected upstream of Hayspur State Fish Hatchery in Butte or Loving Creek or
in the old brood ponds receiving hatchery effluent (Figure 7). New Zealand mudsnails
also were not detected downstream of Kilpatrick Bridge or upstream of the confluence of
Stalker and Grove Creek (Figure 7). Besides Loving and Butte Creek, no other Silver
Creek tributaries were positive for New Zealand mudsnails during the survey (Figure 7).
Substrate particle size and water velocities at positive sites averaged 2.60±1.30
and 0.386±0.154 m/s, respectively (Table 2). At negative sites, substrate particle size
averaged 2.80±1.23 and water velocities averaged 0.330±0.178 m/s (Table 2). There was
no significant difference between either substrate particle size or water velocity at
positive and negative sites (P>0.05, Table 3)

12
Seasonal Distribution
New Zealand mudsnails were detected at fewer sites during winter sampling
periods compared with summer sampling in both reaches in the seasonal distribution
survey (Table 4). As a result, there was a greater abundance of snails collected during the
summer (Tables 5 and 6). However, Reach-2 consistently had the greatest abundance
during all sampling periods (Table 6) when compared with Reach-1 (Table 5).
The distribution pattern of New Zealand mudsnails in Reach-1 was concentrated
just upstream of the confluence of Loving and Silver Creek and at a few locales in
Loving Creek itself (Figure 8). During the summer of 2005, New Zealand mudsnails had
distributed themselves throughout the Silver Creek portion of Reach-1 with the greatest
abundance occurring upstream of the Loving Creek confluence while only one positive
site occurred in Loving Creek itself (Figure 8). New Zealand mudsnails were detected at
two sites (Sites 30 and 31) in Reach-1 during the final sampling period of the winter of
2005-2006 (Figure 8, Table 5); an area that was consistently positive at all sampling
periods. There was no consistent linear upstream to downstream trend apparent in the
abundances of New Zealand mudsnails in the Silver Creek portion of Reach-1 although
positive sites were generally clustered together (Figure 9).
Fewer positive sites were detected in Reach-2 during the winter sampling seasons,
however positive sites were detected throughout the reach during all sampling periods
(Figure 10). During the final sampling period of the winter of 2005-2006, the distribution
of New Zealand mudsnails became more constricted towards the middle of the reach near
the outflow of Sullivan Lake (Figure 10). There was no apparent linear trend in
abundance of New Zealand mudsnails from upstream to downstream in Reach-2 during

13
any sampling period (Figure 11). However the greatest abundances during any given
sampling period occurred in close proximity (<100 m) to the outflow of Sullivan Lake
(Table 6, Figure 11), suggesting that Sullivan Lake may support an abundant population
of New Zealand mudsnails throughout the year.
Except for conductivity, all other chemical water parameters measured (salinity,
total dissolved solids [TDS], Dissolved Oxygen [DO], and pH) were consistent between
the winter of 2004-2005 and the summer of 2005 (Table 7). Conductivity measures were
greatest during the summer of 2005 sampling periods (Table 7). However, during the
winter of 2005-2006 all water chemical parameters had dropped below the previous
summer and winter levels (Table 7). This decrease in chemical parameters may well be
attributable to an extended drop in water temperatures throughout December 2005
(Figure 12).
Longitudinal Densities
The longitudinal densities showed a similar distributional pattern as that observed
in the overall distribution during the summer of 2004 (Figure 6). New Zealand mudsnails
were not detected in Silver Creek from Kilpatrick Bridge downstream but were found
throughout Loving Creek during both sampling periods (Summer 2005 and Winter 2005-
2006; Figure 6). Densities decreased downstream from below Hayspur State Fish
Hatchery to the confluence of Loving and Silver Creek (Figure 13). No snails were
detected at Site 3-5 during the winter 2005-2006 sampling period.
Statistical analysis using a two-way ANOVA model resulted in no significant
interaction effect of season*site on log-densities of New Zealand mudsnails (Table 8).
However, both season and site had significant main effects on the resulting log-densities

14
(P<0.05; Table 8). Site 3-5 was the only site at which abundances differed significantly
from all other sites (Figure 14), most likely because no snails were detected there during
the winter sampling period. Sites 3-4, 3-6, 3-7, and 3-8 were statistically similar to each
other while site 3-9 was similar only to sites 3-7 and 3-8 (Figure 14). Post hoc analysis
of the season main effect showed summer densities to be significantly greater than winter
(Figure 15).
Chemical water parameters (Conductivity, Total Dissolved Solids [TDS],
Salinity, and pH) were greatest during the summer sampling period (Table 9). Water
temperatures again appeared to play an important role in the seasonal changes to these
parameters (Table 10).
Water Temperature Monitoring
Water temperature regimes in the Silver Creek drainage follow both diurnal
(Figure 16) and seasonal (Table 11) temperature fluctuations. Daily temperatures in
Silver Creek fluctuated nearly 10°C between 14 and 19 June 2004, and were highly
correlated with ambient air temperatures (Figure 16). Similar water temperature
fluctuations were observed at all monitoring sites, although the magnitude of the
fluctuations varied slightly. Average monthly temperatures were lowest in the middle
portions of Silver Creek Preserve and directly downstream of Hayspur Fish Hatchery on
Butte/Loving Creek during the summer months of June through September while the
upper and lower stretches of Silver Creek were warmer (Table 11). During the winter
months of November through April, the upper and lower stretches of Silver Creek were
colder while the middle portions of Silver Creek Preserve and downstream of Hayspur

15
State Fish Hatchery remained warmer (Table 11), possibly as a result of ground water
inflow to these areas.
Mean monthly temperatures varied from a high of 20.27°C in July 2005 at the
Idaho Fish and Game’s Sportsmen’s Access (Site 8, Figure 6) to a low of 1.0°C at Picabo
Road Bridge (Site 10, Figure 6). The overall maximum temperature recorded during this
research was 26.3°C recorded at Picabo Road Bridge during July 2005 (Site 10, Table
11). The lowest overall temperature of –2.4°C occurred at Picabo Road Bridge in
January 2005 (Site 10, Table 11)
Discussion
New Zealand mudsnails in the Silver Creek drainage from the summer of 2004 to
the winter of 2005-2006 were limited to two areas: 1) Silver Creek itself on the lower
portion of Silver Creek Preserve and 2) Butte/Loving Creek downstream of Hayspur
State Fish Hatchery. It is impossible to be entirely certain that this is the definitive
distribution of New Zealand mudsnails in Silver Creek because all stream habitats were
not sampled throughout these surveys. While it may be likely that New Zealand
mudsnails were not detected in areas of low density, the current results are consistent
with the distribution of New Zealand mudsnails in the Silver Creek drainage reported by
Richards and Lester (2003). However, snails were observed at Site 53 on Loving Creek
during the overall distribution survey approximately 500 meters upstream of a site that
Richards and Lester (2003) reported as negative for New Zealand mudsnails in 2003.
Abundances at Site 53 were low, both during the overall distribution survey (8 snails/ 30
sec.) and in terms of longitudinal densities (155 – 248 snails/m2). The observation of
New Zealand mudsnail presence in close proximity to a site so recently reported as free

16
may indicate that the population is expanding its range. Results from the seasonal
distribution survey and longitudinal density data, suggest that this expansion occurs on a
seasonal basis during the summer and the population boundary retreats upstream during
the winter in Loving Creek.
The populations of New Zealand mudsnails on Silver Creek Preserve appear
independent of those below Hayspur State Fish Hatchery. The low abundances and
multiple negative sites of New Zealand mudsnails in that portion of Loving Creek
contained within Reach-1 of the seasonal distribution survey support this hypothesis.
Also, the perpetuation of New Zealand mudsnails in Reach-1 is most likely influenced by
their persistence upstream in Silver Creek. During the summer of 2005 sampling, the
greatest abundance of New Zealand mudsnails in Reach-1 occurred in the uppermost
portion of that reach on Silver Creek, while no mudsnails were detected during either
winter sampling at those sites. These results suggest that snails further upstream in Silver
Creek support summer abundances in Reach-1 of Silver Creek Preserve. In addition,
given the disappearance of snails from Site 3-5 in the longitudinal distribution survey
during the winter of 2005-2006, it seems likely that populations in Loving Creek and
Silver Creek are disjunct during the winter.
No New Zealand mudsnails were found at Sites 36 and 52 in the overall
distribution survey, but this area was reported as positive in a previous survey conducted
by Dr. David Herbst, Assistant Research Biologist at the University of California Santa
Barbara in 2003 (Richards et al. 2004a). Site 36 was approximately 20 meters upstream
of where New Zealand mudsnails were detected. After consulting directly with Dr.
Herbst and the local landowner about the location of the previous sampling, samples were

17
taken as near as possible to that location (Site 52). New Zealand mudsnails were not
detected at this site, either. It is possible that the snails may inhabit this area at a density
below detection or were present in 2003 but did not survive over the winter into 2004.
Low water temperatures at this site may have been unsuitable for New Zealand mudsnails
to persist. Average monthly water temperatures recorded upstream and downstream of
this site between December 2004 and January 2005 were the lowest recorded averages
(<2.0°C) in that time period of all areas and often dropped below 0°C.
Prior to this research, little was known regarding the annual water temperature
regimes in the Silver Creek drainage. Previously it was assumed to be more stable than
this research indicates. Richards and Lester (2003) concluded that “…Silver Creek
appears to be very good P. antipodarum habitat, because there are fairly stable flows and
temperatures.” Yet, Francis and Bjornn (1979) reported a water temperature at the Idaho
Department of Fish and Game Sportsman’s Access site of 1.5°C on 6 January 1976 and
Riehle and Griffith (1993) reported a water temperature at an unspecified location in
Silver Creek of 2.0°C on 20 January 1988. This study indicates that temperatures are not
stable in the drainage and the previously reported temperatures are not representative
across sites or seasons. On more than one occasion, heavy ice formation was observed in
the lower portions of Silver Creek from just upstream of the IDFG Sportsmen’s Access
Site downstream several miles.
Aquatic primary productivity has also been noted to be a limiting factor in New
Zealand mudsnail populations (Kerans et al. 2005). While conductivity and total
dissolved solids (TDS) have been used as proxies for nutrient levels, and consequently
productivity, this relationship does not always predict productivity (Prepas 1983). Yet in

18
the Silver Creek drainage, abundances of New Zealand mudsnails show a positive
relationship with conductivity measures. It has been documented, though, that the
conductivities of some ions are less at lower temperatures (Kalff 2002). This relationship
helps explain the rise in conductivity during the summer of 2005 while measures of
salinity and TDS remained nearly equivalent from the winter of 2004-2005 and any
correlation between New Zealand mudsnails and conductivity may be influenced by their
individual interactions with water temperatures. A greater understanding of the
interactions of productivity, nutrient cycling and New Zealand mudsnails at different
temperatures needs to be assessed in future research.
More comprehensive knowledge of site-specific temperature regimes may be
critical to understanding New Zealand mudsnail invasion success. Hylleberg and
Siegismund (1987) found that P. jenkinsi in Denmark survived for only a few hours at
-3°C in freshwater. Potamopyrgus jenkinsi (E.A. Smith, 1869), which is considered to be
synonymous with P. antipodarum (Gray, 1844), invaded Europe in the mid 1800’s from
New Zealand (Winterbourn 1970a, Winterbourn 1970b). Freezing is considered an
effective method for killing the New Zealand mudsnails on contaminated fishing gear
(Richards et al. 2004b). The present data demonstrate that temperatures in certain
reaches of Silver Creek attain 0°C and can drop as low as –2°C at times. Currently, New
Zealand mudsnails are present in areas of the Silver Creek drainage that do not drop
below 0°C and their distributional boundaries coincide with this potential temperature
threshold.
Samples were not collected downstream of the U.S. Highway 20 bridge
approximately 3 km east of Picabo, Idaho, during the overall distribution survey. The

19
high gradient habitat within this area, as a result of the stream being confined by a narrow
rock-wall, is likely unsuitable New Zealand mudsnail habitat. At 90 cm/s, 50% of New
Zealand mudsnails will dislodge from cobble sized substrate (Holomuzki and Biggs
1999). The decision not to sample this portion of stream was further supported by the
absence of New Zealand mudsnails in samples for the previous 13 km upstream of this
bridge.
New Zealand mudsnails in Silver Creek have sufficient dispersal vectors to
promote expansion of the population within the stream. Fish and waterfowl move
extensively within the Silver Creek drainage and could distribute New Zealand mudsnails
widely within the system, as could the anglers and hunters pursuing the fish and
waterfowl. Many boater and canoers utilize Silver Creek for recreational purposes and
can potentially increase the spread of the snail. Also, dense macrophyte beds annually
slough off in large mats and flow downstream. There is a high likelihood that New
Zealand mudsnails could be transported downstream during this annual macrophtye
sloughing event. Given this level of activity, it is surprising that New Zealand mudsnails
have not expanded their distribution in over five years. By comparison, in the tailwaters
of Lower Salmon Falls Dam, Gooding County, ID, New Zealand mudsnails went from
being common to the most dominant mollusk within two years (Bowler 1991). In Box
Canyon Creek, Gooding County, ID, a tributary to the middle Snake River, New Zealand
mudsnails appeared during the summer of 1989 and by fall, were nearly as common as
the native snail Fluminicola hindsi (Langenstein and Bowler 1990). Given the current
limited distribution in the Silver Creek drainage and the disappearance from previously
reported sites, it may be possible that temperature regimes in the Silver Creek drainage

20
limit the snail’s dispersal and therefore present a comparatively minimal impact to the
system. Even though snails were collected near areas where temperatures dropped below
freezing, given the low number of snails in these collections, they may have located
micro-habitats that provided sufficient thermal refugia for their survival. Caution should
still be taken, however, to ensure that New Zealand mudsnails are not dispersed to
headwaters of the Silver Creek drainage, where water temperatures are most likely
constant and productive for New Zealand mudsnails.

21
References
Aarnio, K. and E. Bonsdorff. 1997. Passing the gut of juvenile flounder, Platichthys flesus: differential survival of zoobenthic prey species. Marine Biology 129: 11-14.
Bowler, P. A. 1991. The rapid spread of the freshwater Hydrobiid snail Potamopyrgus antipodarum (Gray) in the Middle Snake River, Southern Idaho. Proceedings of the Desert Fishes Council 21: 173-182.
Brown, A.L.J. 2000. Hydrologic evaluation of the Big Wood River and Silver Creek watersheds: Summary Report. Available through The Nature Conservancy, Hailey, Idaho.
Bruce, R.L. 2006. Methods of fish depurations to control New Zealand mudsnails at fish hatcheries. Masters Thesis. University of Idaho, Moscow, Idaho.
Cada, C. A. 2004. Interactions between the invasive New Zealand mudsnail, Potamopyrgus antipodarum, Baetid mayflies, and fish predators. Masters Thesis. Montana State University, Bozeman, Montana.
Environmental Systems Research Institute. 1999. ArcView GIS 3.2. Environmental Systems Research Institute Redlands, California.
Francis, L.J. and T. C. Bjornn. 1979. Aquatic resources in the Nature Conservancy portion of Silver Creek: Technical report. Idaho Cooperative Fishery Research Unit, University of Idaho, Moscow, Idaho.
Frest, T. J. and P. A. Bowler. 1993. A preliminary checklist of the aquatic and terrestrial mollusks of the Middle Snake River sub-basin. Proceedings of the Desert Fishes Council 24: 53-58.
Graynoth, E., L. C. Bennet, and J. C. Pollard. 1986. Diet of landlocked sockeye salmon (Oncorhynchus nerka) and trout in the Waitaki Lakes, New Zealand. New Zealand Journal of Marine and Freshwater Research 20: 537-549.
Graynoth, E. and M. Taylor. 2004. Growth of juvenile eels (Anguilla spp.) in lowlands streams in New Zealand. Fisheries Research 66: 95-106.
Hall, R. O. Jr., J. L. Tank, and M. F. Dybdahl. 2003. Exotic snails dominate nitrogen and carbon cycling in a highly productive stream. Frontiers in Ecology and the Environment 1: 407-411.
Hall, R. O. Jr., M. F. Dybdahl, and M. C. VanderLoop. 2006. Extremely high secondary production of introduced snails in rivers. Ecological Applications 16: 1121-1131.

22
Holomuzki, J. R. and B. J. F. Biggs. 1999. Distributional response to flow disturbances by a stream dwelling snail. Oikos 87: 36-47.
Hylleberg, J. and H. R. Siegismund. 1987. Niche overlap in mud snails (Hydrobiidae): freezing tolerance. Marine Biology 94: 403-407.
Jokela, J. and C. M. Lively. 1995. Parasites, sex, and early reproduction in a mixed population of freshwater snails. Evolution 49: 1268-1271.
Jokela, J., M. F. Dybdahl, and C. M. Lively. 1999. Habitat-specific variation in life-history traits, clonal population structure and parasitism in a freshwater snail (Potamopyrgus antipodarum). Journal of Evolutionary Biology 12: 350-360.
Kalff, J. 2002. Limnology: Inland Water Ecosystems. Prentice-Hall. Upper Saddle River, NJ.
Kerans, B. L., M. E. Dybdahl, M. M. Gangloff, and J. E. Jannot. 2005. Potamopyrgus antipodarum: distribution, density, and effects on native macroinvertebrate assemblages in the Greater Yellowstone Ecosystem. Journal of the North American Benthological Society 24: 123-138.
Langenstein, S. and P. A. Bowler. 1990. On-going macroinvertebrate analysis using the biotic condition index and the appearance of Potamopyrgus antipodarum (Gray) in Box Canyon Creek, Southern Idaho. Proceedings of the Desert Fishes Council 21: 183-194.
Levri, E. P. and C. M. Lively. 1996. The effects of size, reproductive condition, and parasitism on foraging behavior in a freshwater snail, Potamopyrgus antipodarum. Animal Behavior 51: 891-901.
Levri, E. P. 1998. Perceived predation risk, parasitism, and foraging behavior of a freshwater snail (Potamopyrgus antipodarum). Canadian Journal of Zoology 76: 1878-1884.
Malone, C. R. 1965. Killdeer (Charadrius vociferus Linnaeus) as a means of dispersal for aquatic gastropods. Ecology 46: 551-552.
McMahon, T. E., A. V. Zale, and D. J. Orth. 1996. Aquatic habitat measurements. Pages 83-120. in B.R Murphy and D.W Willis editors. Fisheries Techniques, 2nd edition. American Fisheries Society, Bethesda, Maryland.
Prepas, E. E. 1983. Total dissolved solids as a predictor of lake biomass and productivity. Canadian Journal of Fisheries and Aquatic Sciences 40: 92-95.

23
Reihle, M. D. and J. S. Griffith. 1993. Changes in habitat use and feeding chronology of juvenile rainbow trout (Oncoryhnchus mykiss) in fall and the onset of winter in Silver Creek, Idaho. Canadian Journal of Fisheries and Aquatic Sciences 50: 2119-2128.
Richards, D.C. and G. T. Lester. 2000. Comparison of the number of Potamopyrgus antipodarum (Gray) neonates produced seasonally, between habitats, and in two different freshwater springs, Idaho and Montana: a preliminary investigation. EcoAnalysts Inc., Moscow, Idaho.
Richards, D. C., L.D. Cazier, and G.T. Lester. 2001. Spatial distribution of three snail species including the invader Potamopyrgus antipodarum in a freshwater spring. Western North American Naturalist 61: 375-380.
Richards, D.C. and G. T. Lester. 2003. Survey of the invasive New Zealand mudsnail, Potamopyrgus antipodarum in the Silver Creek drainage in and around the The Nature Conservancy's Silver Creek Preserve, Idaho, USA. EcoAnalyst, Inc. Moscow, Idaho.
Richards, D. C. 2004. Competition between the threatened Bliss Rapids snail, Taylorconcha serpenticola (Hershler et al.) and the invasive aquatic snail, Potamopyrgus antipodarum (Gray). Montana State University, Bozeman, Montana.
Richards, D. C., D. Gustafson, and B. Walch. 2004a. New Zealand Mud Snail in the Western USA. http://www2.montana.edu/nzms/.
Richards, D. C., P. O'Connell, and D.C. Shinn. 2004b. Simple control method to limit spread of New Zealand mudsnail, Potamopyrgus antipodarum. North American Journal of Fisheries Management 24: 114-117.
Sagar, P. M. and G. J. Glova. 1995. Prey availability and diet of juvenile brown trout (Salmo trutta) in relation to riparian willows (Salix spp.) in three New Zealand Streams. New Zealand Journal of Marine and Freshwater Research 29: 527-537.
SAS Institute Inc. 2003. The SAS System for Windows v9.1. SAS Institute Inc. Cary, North Carolina.
Schreiber, E. S. G., A. Glaister, G. P. Quinn, and P. S. Lake. 1998. Life history and population dynamics of the exotic snail Potamopyrgus antipodarum (Prosobranchi:Hydrobiidae) in Lake Purrumbete, Victoria, Australia. Marine and Freshwater Research 49: 73-78.
Winterbourn, M. J. 1970a. The New Zealand species of Potamopyrgus (Gastropoda:Hydrobiidae). Malacologia 10: 283-321.
Winterbourn, M. J. 1970b. Population studies on the New Zealand freshwater gastropod

24
Potamopyrgus antipodarum (Gray). Proceedings of the Malacolgical Society of London 39: 139-149.
Zaranko, D. T., D. G. Farara, and F. G. Thompson. 1997. Another exotic mollusc in the Laurentian Great Lakes: the New Zealand native Potamopyrgus antipodarum (Gray 1843) (Gastropoda, Hydrobiidae). Canadian Journal of Fisheries and Aquatic Sciences 54: 809-814.

25
Table 1. Location, sampling date, site number, and relative abundance (per 30 sec kick net) at sites where New Zealand mudsnails were collected in the Silver Creek drainage, 2004. Site numbers correlate to site numbers labeled in Figure 7.
Site number Date Stream name Number snails/30 sec 5 4 June Silver Cr. 2 7 4 June Silver Cr. 10
11 8 June Loving Cr. 2,220 53 2 July Loving Cr. 8 54 2 July Loving Cr. 231

26
Table 2. Average ±1-SD substrate size and water velocity at sites with and without New Zealand mudsnails from the overall distribution survey in the summer of 2004.
Site description Substrate size Water velocity (m/sec) Without mudsnails (n=51) 2.80 ± 1.34 0.333 ± 0.178
With mudsnails (n=5) 2.60 ± 1.30 0.386 ± 0.154

27
Table 3: Results of t-test assessing differences in water velocity and substrate size between New Zealand mudsnail positive and negative sites in the overall distribution survey in the summer of 2004.
DF t-value P Water Velocity 165 -1.11 0.2684
Substrate Size 164 0.57 0.5716

28
Table 4. Cumulative New Zealand mudsnail positive and negative sites from monitoring sites during the Winter 2004-2005, Summer 2005, Winter 2005-2006 sampling periods. Reach 1 Reach 2 Winter
2004-2005 Summer
2005 Winter
2005-2006 Winter
2004-2005 Summer
2005 Winter
2005-2006 Present 8 21 2 17 29 12 Absent 32 19 38 23 11 28

29
Table 5. Total New Zealand mudsnails (# of snails/10 s sampling) collected from each site in Reach 1 during the seasonal distribution survey. Site number corresponds to site numbers from Figure 3.
Site # Winter 2004-2005 Summer 2005 Winter 2005-2006 1 0 48 0 2 0 8 0 3 0 56 0 4 0 8 0 5 0 0 0 6 0 8 0 7 0 144 0 8 0 8 0 9 0 8 0
10 0 0 0 11 0 0 0 12 8 0 0 13 0 0 0 14 0 0 0 15 0 0 0 16 0 0 0 17 0 0 0 18 0 0 0 19 0 0 0 20 16 0 0 21 0 0 0 22 48 16 0 23 0 0 0 24 0 0 0 25 0 0 0 26 120 48 0 27 0 8 0 28 32 0 0 29 8 48 0 30 16 56 24 31 8 48 8 32 0 40 0 33 0 24 0 34 0 64 0 35 0 0 0 36 0 208 0 37 0 16 0 38 0 0 0 39 0 16 0 40 0 408 0
Total 248 1288 32

30
Table 6. Total New Zealand mudsnails (# of snails/10 s sampling) collected from each site during the seasonal distribution survey in Reach 2. Site number corresponds to site numbers from Figure 4.
Site # Winter 2004-2005 Summer 2005 Winter2005-2006 41 0 32 0 42 48 24 8 43 0 2544 16 44 0 480 8 45 8 40 0 46 0 0 0 47 0 0 16 48 16 184 0 49 0 8 8 50 0 8 0 51 0 200 0 52 24 104 8 53 0 16 0 54 168 24 8 55 0 32 0 56 0 208 0 57 8 8 0 58 24 8 0 59 8 32 0 60 0 16 48 61 48 1080 32 62 0 16 0 63 8 184 168 64 168 8 0 65 0 1048 424 66 32 144 0 67 8 0 0 68 0 8 0 69 16 0 0 70 0 8 0 71 32 0 0 72 8 0 0 73 400 0 0 74 0 0 0 75 0 0 0 76 0 8 0 77 0 0 0 78 0 24 0 79 0 112 8 80 0 0 0
Total 1032 6608 752

31
Table 7. Mean (SE) water chemistry parameters recorded at each site (n=40) during all sampling periods for the seasonal distribution survey. NA indicates measurement was not recorded.
Winter 2004-2005 Summer 2005 Winter 2005-2006 Reach 1 Reach 2 Reach1 Reach 2 Reach 1 Reach 2 Conductivity (mS/cm)
0.229 (0.001)
0.229 (0.002)
0.303 (0.003)
0.278 (0.001)
0.215 (0.002)
0.211 (0.002)
Total Dissolved solids (g/L)
0.240 (0.001)
0.241 (0.002)
0.243 (0.001)
0.238 (0.001)
0.226 (0.002)
0.215 (0.001)
Salinity (ppt) 0.177 (0.001)
0.177 (0.002)
0.180 (0.001)
0.177 (0.001)
0.167 (0.001)
0.159 (0.001)
Dissolved oxygen (mg/L)
12.08 (0.25)
10.01 (0.38)
11.04 (0.44)
9.41 (0.27)
10.08 (0.76)
10.63 (0.19)
pH 6.89 (0.27)
7.33 (0.35) N/A 6.33
(0.26) 7.99
(0.01) 7.77
(0.04)

32
Table 8. Summary of two-way ANOVA testing the effects of Area and Season on differences in log(density) of New Zealand mudsnails from positive sites (3-4, 3-5, 3-6, 3-7, 3-8, and 3-9) in the longitudinal density survey. Sites 3-1, 3-2, and 3-3 were omitted from the analysis because New Zealand mudsnails were not detected at those sites.
Source DF S.S. M.S. F-value P Model 11 188.42 17.13 4.59 0.0009 Area 5 135.11 27.02 7.24 0.0003
Season 1 40.06 40.06 10.73 0.0032 Area*Season 5 13.25 2.65 0.71 0.6219
Error 24 89.61 3.73

33
Table 9. Mean and (SE) for water chemistry parameters recorded at each sampling site (n=3) during summer and winter sampling periods for the longitudinal density objective. No data were collected for dissolved oxygen in winter due to equipment failure.
Conductivity (mS/cm)
Total dissolved solids(g/L)
Salinity (ppt)
Dissolved oxygen(mg/L)
pH Site
Summer Winter Summer Winter Summer Winter Summer Summer Winter
3-1 0.313 (0.001)
0.184 (<0.001)
0.230 (0.001)
0.228 (0.00)
0.170 (0.00)
0.167 (0.003)
7.81 (0.28)
7.92 (0.01)
8.01 (0.02)
3-2 0.313 (0.001)
0.184 (<0.001)
0.230 (0.001)
0.228 (0.00)
0.170 (0.00)
0.167 (0.003)
7.81 (0.28)
7.92 (0.01)
8.01 (0.02)
3-3 0.298 (0.001)
0.200 (<0.001)
0.235 (<0.001)
0.223 (<0.001)
0.170 (0.00)
0.160 (0.00)
10.06 (0.16)
8.15 (0.01)
8.11 (0.3)
3-4 0.308 (0.013)
0.186 (0.005)
0.233 (0.005)
0.229 (0.006)
0.173 (0.003)
0.167 (0.007)
13.74 (0.25)
8.52 (0.05)
7.80 (0.10)
3-5 0.336 (<0.001)
0.208 (0.00)
0.260 (<0.001)
0.245 (<0.001)
0.190 (0.00)
0.173 (0.007)
7.56 (0.24)
8.09 (0.02)
8.02 (0.02)
3-6 0.350 (<0.001)
0.214 (<0.001)
0.266 (<0.001)
0.245 (0.00)
0.200 (0.00)
0.180 (0.00)
6.74 (0.39)
7.93 (0.02)
7.98 (0.04)
3-7 0.339 (<0.001)
0.230 (<0.001)
0.259 (<0.001)
0.242 (0.00)
0.190 (0.00)
0.180 (0.00)
8.23 (0.06)
8.56 (<0.01)
8.03 (0.03)
3-8 0.326 (0.003)
0.235 (0.002)
0.270 (0.001)
0.240 (0.003)
0.200 (0.00)
0.177 (0.003)
8.38 (0.07)
7.94 (0.04)
8.04 (0.02)
3-9 0.321 (0.001)
0.247 (<0.001)
0.263 (<0.001)
0.233 (<0.001)
0.197 (0.003)
0.170 (0.00)
6.64 (0.02)
7.90 (0.02)
8.03 (0.02)

34
Table 10. Monthly average and (range) of water temperatures °C at longitudinal density sites between sampling periods. NA indicates data were not collected.
July 2005 Aug. 2005 Sept. 2005 Oct. 2005 Nov. 2005 Dec. 2005 Jan. 2006
3-1 20.35 (16.3-23.2)
19.09 (14.1-24.0)
14.83 (10.6-20.2)
10.65 (6.2-14.1) N/A N/A 2.1
(-0.6-5.0)
3-2 17.65 (14.1-20.5)
15.90 (10.2-20.5)
11.59 (7.0-17.1)
8.02 (3.7-11.3)
3.68 (-1.0-7.4)
1.17 (-1.4-5.3)
1.5 (-1.4-4.9)
3-3 17.37 (14.1-20.5)
16.06 (10.6-20.9)
12.43 (7.8-17.8)
9.05 (4.9-12.5)
5.06 (0.2-16.3)
2.60 (-0.1-6.6)
3.0 (-0.1-6.6)
3-4 17.60 (13.7-20.9)
16.15 (7.8-21.3)
10.42 (2.4-19.4) N/A N/A 2.12
(-1.9-6.2) 3.7
(0.2-7.8)
3-5 17.28 (14.8-19.8)
15.96 (11.4-19.4)
12.51 (6.83-17.9)
9.35 (5.4-12.6)
6.03 (1.6-22.1)
3.90 (-0.2-8.2)
5.9 (1.6-9.4)
3-6 16.97 (14.8-18.3)
15.38 (11.4-19.0)
12.36 (8.2-16.0)
9.50 (5.8-12.9)
6.33 (2.0-9.8)
4.27 (1.2-7.8)
4.6 (1.2-7.8)
3-7 15.37 (12.2-18.3)
14.25 (9.8-18.3)
11.84 (8.2-16.4)
9.69 (6.2-12.9)
7.05 (3.7-10.6)
5.21 (2.0-8.6)
5.5 (2.5-8.6)
3-8 14.32 (11.7-20.9)
13.53 (10.2-17.4)
11.50 (7.0-16.3)
8.03 (2.8-14.4)
5.74 (1.6-21.3)
6.67 (4.5-9.0)
6.8 (4.5-9.0)
3-9 14.01 (11.7-20.2)
13.32 (10.6-16.7)
11.81 (9.4-15.6)
10.13 (7.8-12.9)
8.18 (5.8-22.4)
6.55 (4.5-9.0)
6.6 (4.5-9.0)

35
Table 11. Average and (range) for water temperatures (°C) recorded throughout the Silver Creek drainage at specified locations by month from June 2004 to February 2006. Site numbers are referenced in Figure 6. NA indicates sites where data were not available.
Site June 2004 July 2004 Aug. 2004 Sept. 2004 Oct. 2004 Nov. 2004 Dec. 2004
1 NA 17.75 (13.7-22.4)
18.04 (15.9-20.5) NA NA NA NA
2 17.38 (13.7-22.4)
15.92 (10.9-20.5)
12.42 (7.4-17.4)
8.55 (3.3-14.4) NA 1.98
(-0.1-5.8)
3 14.90 (9.4-19.8)
15.97 (11.3-21.3)
14.74 (9.4-19.4)
11.85 (7.0-17.1)
8.77 (4.1-14.1)
5.55 (1.1-9.8)
3.17 (-1.9-7.0)
4 17.27 (13.7-21.7)
15.99 (11.3-20.9)
12.62 (9.0-16.7)
9.27 (4.9-13.7)
6.04 (2.4-9.0)
4.34 (2.0-6.6)
5 3.88 (1.1-6.2)
3.59 (0.7-7.0)
6 16.73 (12.1-21.7)
15.69 (10.6-19.4)
12.65 (7.8-17.4)
9.27 (3.7-14.1)
5.35 (0.7-9.4)
2.88 (-1.9-7.0)
7 16.11 (10.6-20.5)
17.51 (12.9-22.8)
15.80 (10.9-20.9)
12.61 (7.8-17.4)
9.10 (4.1-14.1)
5.51 (0.7-9.8)
3.10 (-1.0-7.0)
8 18.83 (14.1-24.8)
17.32 (11.3-21.7)
13.22 (7.8-19.0)
9.07 (3.3-15.2)
4.74 (-0.1-9.4)
2.07 (-0.1-5.80)
9 18.98 (13.7-25.2)
17.40 (11.7-22.1)
13.28 (7.8-19.8)
9.04 (2.8-15.6)
4.39 (-0.1-9.0)
1.61 (-0.1-5.3)
10 19.72 (14.4-25.6)
18.16 (12.1-22.4)
13.70 (8.2-20.5)
8.99 (1.1-20.9)
4.21 (-0.6-13.7)
1.39 (-1.0-5.8)
12 16.15 (11.7-20.5)
17.49 (13.7-22.4)
15.98 (11.7-20.5)
12.40 (5.3-19.4)
NA
7.13 (5.8-8.6)
5.40 (3.3-7.4)
13 14.40 (9.8-19.0)
14.72 (10.9-19.4)
13.73 (9.8-18.2)
12.15 (7.0-17.4) NA 6.47
(4.5-8.6) 6.15
(3.3-9.8)
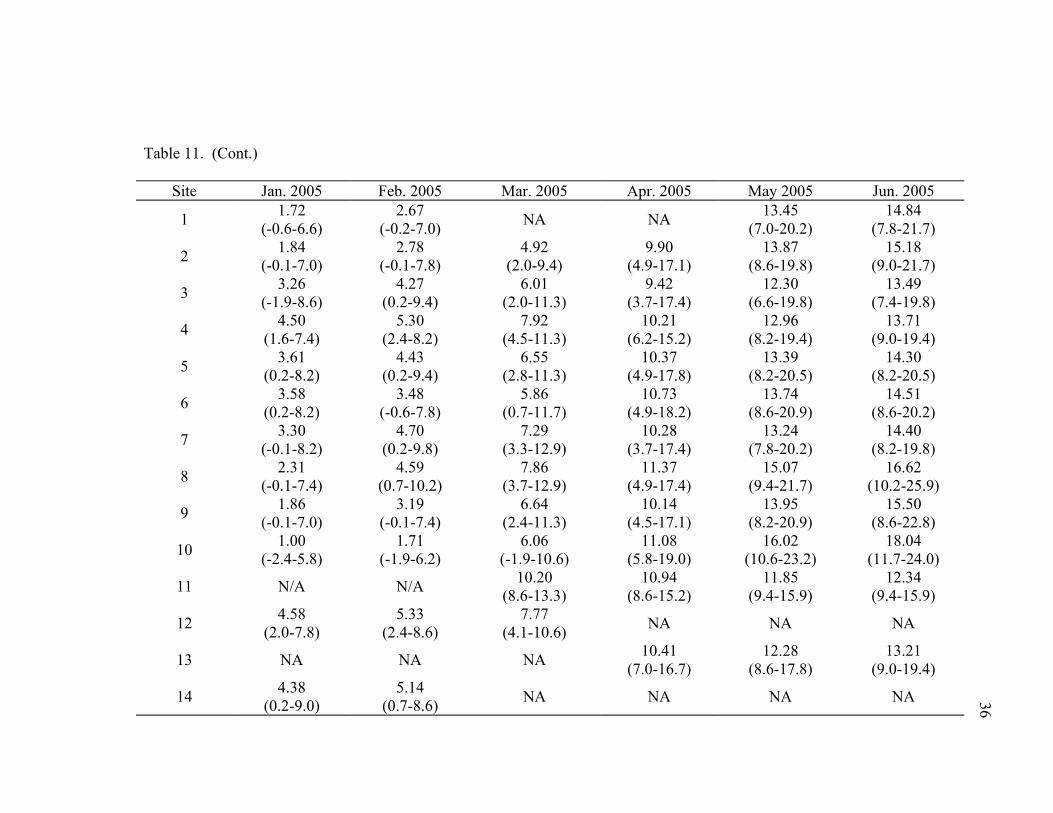
36
Table 11. (Cont.)
Site Jan. 2005 Feb. 2005 Mar. 2005 Apr. 2005 May 2005 Jun. 2005
1 1.72 (-0.6-6.6)
2.67 (-0.2-7.0) NA NA 13.45
(7.0-20.2) 14.84
(7.8-21.7)
2 1.84 (-0.1-7.0)
2.78 (-0.1-7.8)
4.92 (2.0-9.4)
9.90 (4.9-17.1)
13.87 (8.6-19.8)
15.18 (9.0-21.7)
3 3.26 (-1.9-8.6)
4.27 (0.2-9.4)
6.01 (2.0-11.3)
9.42 (3.7-17.4)
12.30 (6.6-19.8)
13.49 (7.4-19.8)
4 4.50 (1.6-7.4)
5.30 (2.4-8.2)
7.92 (4.5-11.3)
10.21 (6.2-15.2)
12.96 (8.2-19.4)
13.71 (9.0-19.4)
5 3.61 (0.2-8.2)
4.43 (0.2-9.4)
6.55 (2.8-11.3)
10.37 (4.9-17.8)
13.39 (8.2-20.5)
14.30 (8.2-20.5)
6 3.58 (0.2-8.2)
3.48 (-0.6-7.8)
5.86 (0.7-11.7)
10.73 (4.9-18.2)
13.74 (8.6-20.9)
14.51 (8.6-20.2)
7 3.30 (-0.1-8.2)
4.70 (0.2-9.8)
7.29 (3.3-12.9)
10.28 (3.7-17.4)
13.24 (7.8-20.2)
14.40 (8.2-19.8)
8 2.31 (-0.1-7.4)
4.59 (0.7-10.2)
7.86 (3.7-12.9)
11.37 (4.9-17.4)
15.07 (9.4-21.7)
16.62 (10.2-25.9)
9 1.86 (-0.1-7.0)
3.19 (-0.1-7.4)
6.64 (2.4-11.3)
10.14 (4.5-17.1)
13.95 (8.2-20.9)
15.50 (8.6-22.8)
10 1.00 (-2.4-5.8)
1.71 (-1.9-6.2)
6.06 (-1.9-10.6)
11.08 (5.8-19.0)
16.02 (10.6-23.2)
18.04 (11.7-24.0)
11 N/A N/A 10.20 (8.6-13.3)
10.94 (8.6-15.2)
11.85 (9.4-15.9)
12.34 (9.4-15.9)
12 4.58 (2.0-7.8)
5.33 (2.4-8.6)
7.77 (4.1-10.6) NA NA NA
13 NA NA NA 10.41 (7.0-16.7)
12.28 (8.6-17.8)
13.21 (9.0-19.4)
14 4.38 (0.2-9.0)
5.14 (0.7-8.6) NA NA NA NA

37
Table 11. (Cont.)
Site July 2005 Aug. 2005 Sept. 2005 Oct. 2005 Nov. 2005 Dec. 2005 Jan. 2006 Feb. 2006
3 16.27 (10.9-21.3)
14.80 (9.0-20.2)
11.61 (7.4-17.1)
8.71 (3.7-14.1)
5.12 (1.1-9.0)
2.67 (-0.1-6.2)
2.95 (0.2-7.0)
3.08 (-0.1-8.6)
4 16.46 (11.7-20.9)
15.33 (10.2-20.9)
12.20 (8.6-17.8)
9.52 (7.0-11.7)
6.20 (1.6-9.0)
4.81 (2.0-7.0)
4.66 (2.4-7.0)
4.67 (2.0-7.8)
5 17.44 (12.1-22.4)
15.42 (9.4-20.5)
12.11 (7.4-17.4)
9.05 (4.9-12.1)
5.27 (1.1-9.0)
3.31 (0.2-7.0)
3.72 (0.7-7.4)
3.78 (0.2-8.6)
6 17.42 (11.7-22.8)
16.16 (10.6-21.0)
12.55 (8.2-18.7)
9.41 (5.4-12.2)
5.73 (1.2-9.4)
3.36 (-0.2-7.4)
3.80 (0.3-7.0)
4.00 (-0.2-9.0)
7 17.65 (12.5-22.1)
16.06 (10.6-20.9)
12.43 (7.8-17.8)
9.05 (4.9-12.5)
5.03 (0.2-8.6)
2.60 (-0.1-6.6)
3.04 (-0.1-6.6)
2.99 (0.7-6.6)
8 20.27 (13.7-25.2) NA NA NA NA 2.61
(0.73-4.6) 2.07
(-0.6-5.0) 2.24
(-0.6-7.4)
9 20.01 (14.8-25.6)
19.09 (14.1-24.0)
14.82 (10.6-20.2)
10.65 (6.2-14.1)
6.34 (3.3-9.4) NA 4.18
(2.4-6.6) 4.29
(2.4-9.4)
10 21.31 (15.9-26.3)
18.06 (12.5-23.6)
13.12 (9.4-17.8)
9.95 (6.6-12.5)
6.71 (4.1-9.4)
4.76 (3.7-8.6) NA NA
11 13.14 (10.2-16.3)
11.90 (10.2-15.2)
11.55 (9.4-15.2)
10.38 (8.2-12.1)
8.53 (6.2-10.6) NA NA NA
12 12.74 (11.0-15.2)
12.26 (10.2-15.2)
11.45 (9.8-14.1)
9.98 (5.8-13.3)
7.80 (3.3-11.8) NA NA NA
13 14.65 (10.6-19.8)
13.48 (9.8-17.8)
11.61 (8.6-16.3)
9.53 (7.0-12.5)
7.70 (5.3-10.2) NA NA NA
14 17.84 (14.8-21.3)
15.96 (11.4-19.4)
12.51 (8.6-17.9)
9.35 (5.4-12.6)
5.87 (1.6-9.4)
3.90 (-0.2-8.2)
5.95 (1.6-9.4)
6.98 (3.31-11.8)

38
Figure 1. Map of the Silver Creek drainage from its headwaters to its confluence with the Little Wood River. Dotted lines depict irrigation diversions from the drainage. The location of Silver Creek Preserve, the Nature Conservancy is indicated by a diagonal striped polygon. A cross-hatched polygon represents Idaho Department of Fish and Game’s Sportsmen’s Access and the location of the Idaho Department of Fish and Game’s Hayspur State Fish Hatchery is shown by a gray polygon.
Little Woo d R ive r
[ !P
BoisePicab o
!P
Picabo
Stalke r Cr.
Silver Creek
Loving Cr.Grove Cr.
Butte Cree k
Mud C
r.
Cain Cr.
Patton Cr.
Buhler Dr.
Little Woo d R ive r
[ !P
BoisePicab o[ !P
BoisePicab o
!P
Picabo
Stalke r Cr.
Silver Creek
Loving Cr.Grove Cr.
Butte Cree k
Mud C
r.
Cain Cr.
Patton Cr.
Buhler Dr.

39
Figure 2 Locations of Reach-1 and Reach-2 sampling areas on Silver Creek Preserve (diagonally striped polygon)for the seasonal distribution survey. Open circles denote approximate locations of thermograph recorders.
Reach 1
Reach 2Sullivan Lk.
Loving Cr.
Silver Cr.
Reach 1
Reach 2Sullivan Lk.
Loving Cr.
Silver Cr.
Reach 1
Reach 2Sullivan Lk.
Loving Cr.
Silver Cr.
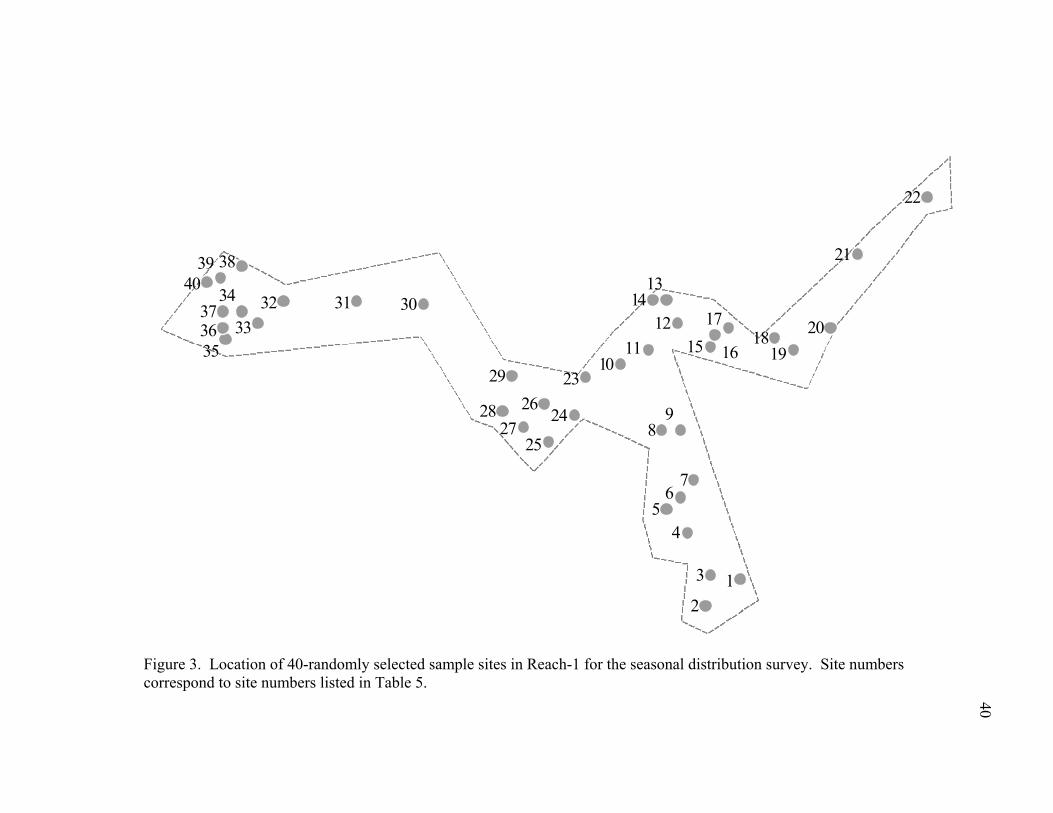
40
Figure 3. Location of 40-randomly selected sample sites in Reach-1 for the seasonal distribution survey. Site numbers correspond to site numbers listed in Table 5.
98
76
54
3 12
30
22
21
2019
1817
1615
14
24
4037
39 38
3635
34
3332 31
13
1211
29
2827
25
2623
10

41
Figure 4. Location of 40-randomly selected sample sites in Reach-2 for the seasonal distribution survey. Site numbers correspond to site numbers listed in Table 6.
59
60
5756
5554 53
52
51 50
79
78
74
7776
7573 72
7170
6968
67
6665
6463
6261
58
4948
4746
45
4443 42
41
80

42
Figure 5. Sampling site locations selected for inclusion in the longitudinal density survey. Gray circles depict sites negative for New Zealand mudsnails while black circles depict sites positive for New Zealand mudsnails. Silver Creek Preserve is depicted with a diagonally striped polygon. Idaho Fish and Game’s Sportsmen’s Access is depicted by the stippled polygon. Hayspur State Fish Hatchery (IDFG) is depicted by the cross-hatched polygon.
3-1
3-2
3-33-4
3-5
3-6
3-7
3-8
3-9
Silver Cr.
Loving Cr.
3-1
3-2
3-33-4
3-5
3-6
3-7
3-8
3-9
3-1
3-2
3-33-4
3-5
3-6
3-7
3-8
3-9
3-1
3-2
3-33-4
3-5
3-6
3-7
3-8
3-9
Silver Cr.
Loving Cr.
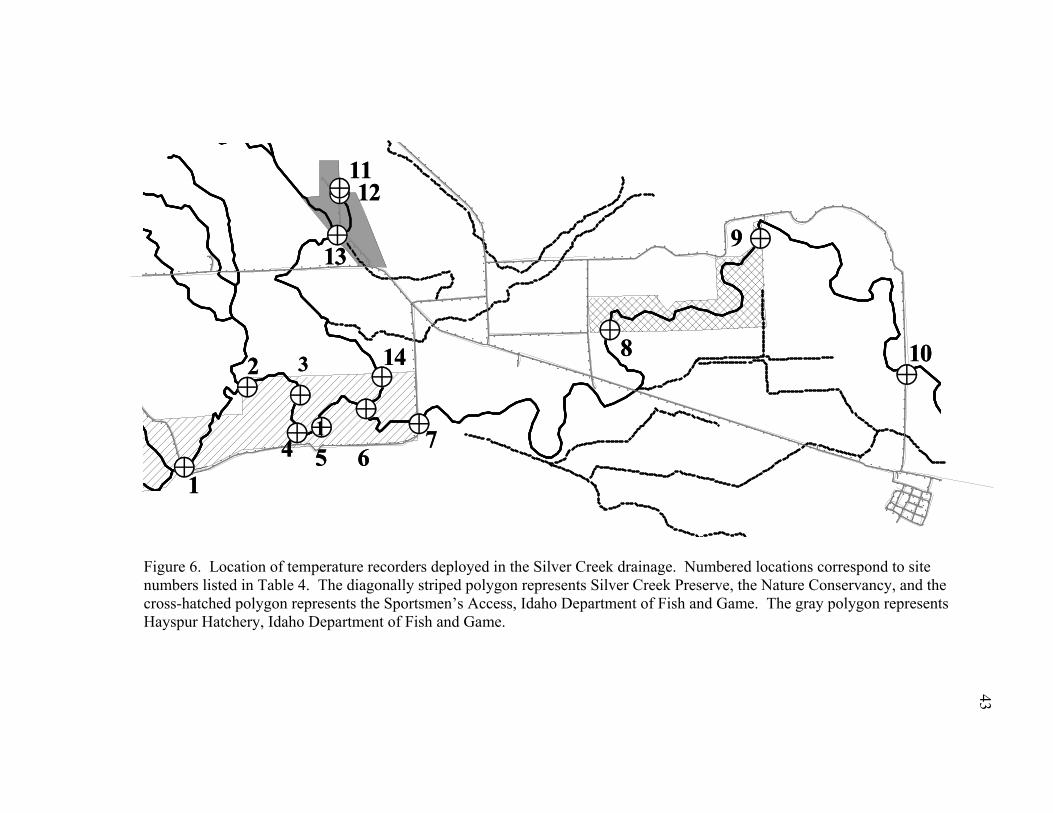
43
Figure 6. Location of temperature recorders deployed in the Silver Creek drainage. Numbered locations correspond to site numbers listed in Table 4. The diagonally striped polygon represents Silver Creek Preserve, the Nature Conservancy, and the cross-hatched polygon represents the Sportsmen’s Access, Idaho Department of Fish and Game. The gray polygon represents Hayspur Hatchery, Idaho Department of Fish and Game.
XY
XY
XY
XY
XY
XY
XY XY
XY
XY XY XY
XY
XY XY XY XY XY
XY XY
XY
XY
XY
XYXYXYXYXY
XY
XY
XY
XY
XY
XY
XY
XY
XY
XY
XY
XY XY XY XY
XY XY
XY XY XY XY XY
XYXY
XY
XY
XY
XY
XY
XY XY
XY
XY
XY XY XY XY
XY XYXY XY XY XY
XY
XY
XY
XY
XY
XY
XY
XY
XY
XY
XY
XY
XY
XY
XY
XY
XY
XY
XY
XY
XY
XY
XY
XY
XY
XY
XY
XY
XY
XY
XY
XY
XY
XY
XYXY
XY
XY
XY
XY
XY
XY
XY
XY
XY
XY
XY
XY
XY
XY
XY
XY
XY
XY XY
XY XY
XY
XY
XY
XY
XY XY
XY XY
XY
XY
XY
XY
XY
XY
XY
XY XY XY
XY
XY
XY
XY
XY
XY
XY
XY
XY
XY
XY
XY
XY
XY
XY
XY
XY
XY
XY
XY
XY
XYXY
XY
XYXY
XY
XY
XY
XY
XY
XY
XY
XY
XY
XY
XY
XY
XY
XY
XY
XY
XY
XY
XY
XY
XY
XYXYXYXYXYXY
XY
XY
XY
XY
XY
XY
XY
XY
XY
XY
XY
XY
XY
XY
XY
XY
XY
XY
XY
XY
XY
XY
XY
XY
XY
XY
XY
XY
XY
XY
XY
XY
XY
XY
XY
XY
XY
XY
XY
XY
XY
XY
XY
XY
XY
XY
XY
XY
XY
XY
XY
XY
XY
XY
XY
XY
XY
XYXY
XYXYXYXYXY
XYXYXY
XYXY
XY
XY
XY
XY
XY
XY
XY
XY
XY
XY
XY
XY
XY
XY
XY XY XY XY XY
XY
XY
XY
XY
XY
XY
XY
XY XY
XY XY
XY
XY
XY
XY
XY
XY
XY
XY
XY
XY
XY
XY
XY
XY
XYXY
XY
XY
XY
XY
XY
XY
XY
XY
XY
XY
XY
XY
XY
XY
XY
XY
XY
XY
XY
XY
XY
XY
XY
XY
XY
XY
!>
!> !>
!>!>
!>
!>
!>
!>
!>
!>
!>
!>
!>
1
2
1
3
4 5 6
8
9
1112
13
7
1014
XY
XY
XY
XY
XY
XY
XY XY
XY
XY XY XY
XY
XY XY XY XY XY
XY XY
XY
XY
XY
XYXYXYXYXY
XY
XY
XY
XY
XY
XY
XY
XY
XY
XY
XY
XY XY XY XY
XY XY
XY XY XY XY XY
XYXY
XY
XY
XY
XY
XY
XY XY
XY
XY
XY XY XY XY
XY XYXY XY XY XY
XY
XY
XY
XY
XY
XY
XY
XY
XY
XY
XY
XY
XY
XY
XY
XY
XY
XY
XY
XY
XY
XY
XY
XY
XY
XY
XY
XY
XY
XY
XY
XY
XY
XY
XYXY
XY
XY
XY
XY
XY
XY
XY
XY
XY
XY
XY
XY
XY
XY
XY
XY
XY
XY XY
XY XY
XY
XY
XY
XY
XY XY
XY XY
XY
XY
XY
XY
XY
XY
XY
XY XY XY
XY
XY
XY
XY
XY
XY
XY
XY
XY
XY
XY
XY
XY
XY
XY
XY
XY
XY
XY
XY
XY
XYXY
XY
XYXY
XY
XY
XY
XY
XY
XY
XY
XY
XY
XY
XY
XY
XY
XY
XY
XY
XY
XY
XY
XY
XY
XYXYXYXYXYXY
XY
XY
XY
XY
XY
XY
XY
XY
XY
XY
XY
XY
XY
XY
XY
XY
XY
XY
XY
XY
XY
XY
XY
XY
XY
XY
XY
XY
XY
XY
XY
XY
XY
XY
XY
XY
XY
XY
XY
XY
XY
XY
XY
XY
XY
XY
XY
XY
XY
XY
XY
XY
XY
XY
XY
XY
XY
XYXY
XYXYXYXYXY
XYXYXY
XYXY
XY
XY
XY
XY
XY
XY
XY
XY
XY
XY
XY
XY
XY
XY
XY XY XY XY XY
XY
XY
XY
XY
XY
XY
XY
XY XY
XY XY
XY
XY
XY
XY
XY
XY
XY
XY
XY
XY
XY
XY
XY
XY
XYXY
XY
XY
XY
XY
XY
XY
XY
XY
XY
XY
XY
XY
XY
XY
XY
XY
XY
XY
XY
XY
XY
XY
XY
XY
XY
XY
!>
!> !>
!>!>
!>
!>
!>
!>
!>
!>
!>
!>
!>
1
2
1
3
4 5 6
8
9
1112
13
7
1014

44
Figure 7. Map of sites sampled in the Silver Creek Drainage, June - August 2004. Dotted open-circles represent locations with New Zealand mudsnails and site numbers are detailed in Table 1. Closed circles indicate sites with no New Zealand mudsnails detected. Sites 36 and 52 were in the vicinity of previous detections of New Zealand mudsnails but none were found in 2004. The boundary of Silver Creek Preserve, The Nature Conservancy is indicated by a stippled polygon and Hayspur Hatchery (on Butte Creek) and Silver Creek Sportsman’s Access (on Silver Creek), Idaho Department of Fish and Game, are shown with diagonally striped polygons.
#
#
#
#
# #
#
#
#
#
#
#
#
#
##
#
#
##
#
###
#
#
#
#
##
#
#
#
#
#
#
#
#
#
#
#
#
#
#
#
# #
#
#
#
#
#Y
#Y
#Y
#Y
#Y
Ú
#
Stalker CreekSilver Creek
Loving Creek
Grove Creek
11
54 537
5
36
52Butte Creek
Cain Cr.
Mud C
r.
Patton Cr.
Buhler D
rain
#
#
#
#
# #
#
#
#
#
#
#
#
#
##
#
#
##
#
###
#
#
#
#
##
#
#
#
#
#
#
#
#
#
#
#
#
#
#
#
# #
#
#
#
#
#Y
#Y
#Y
#Y
#Y
Ú
#
Stalker CreekSilver Creek
Loving Creek
Grove Creek
11
54 537
5
36
52Butte CreekButte Creek
Cain Cr.
Mud C
r.
Patton Cr.
Buhler D
rain

45
Winter ’04 - ’05
Summer ‘05
Winter ’05 - ’06
Winter ’04 - ’05
Summer ‘05
Winter ’05 - ’06
Figure 8. Spatial distribution of New Zealand mudsnail positive (closed circles) and negative (open circles) sites in Reach-1 collected during the seasonal distribution survey.

46
0 50 100 150 200 250 300 3500
100
200
300
400
500
0 50 100 150 200 250 300 3500
100
200
300
400
500
600
0 50 100 150 200 250 300 3500
25
50
500
Wint. ‘04-’05
Summ. ’05
Wint. ‘05-’06
Distance Downstream (m)
New
Zea
land
mud
snai
l Abu
ndan
ce
Loving Cr. Conf.
0 50 100 150 200 250 300 3500
100
200
300
400
500
0 50 100 150 200 250 300 3500
100
200
300
400
500
600
0 50 100 150 200 250 300 3500
25
50
500
Wint. ‘04-’05
Summ. ’05
Wint. ‘05-’06
Distance Downstream (m)
New
Zea
land
mud
snai
l Abu
ndan
ce
Loving Cr. Conf.
Figure 9. Abundance of New Zealand mudsnails along the stream gradient, upstream to downstream, for the Silver Creek portion of Reach-1. Stippled vertical line represents the confluence with Loving Creek.

47
Figure 10. Spatial distribution of New Zealand mudsnail positive (closed circles) and negative (open circles) sites in Reach-2 collected during the seasonal distribution survey.
Winter ‘04-’05 Winter ‘05-’06
Summer ’05
Winter ‘04-’05 Winter ‘05-’06
Summer ’05

48
Figure 11. Abundance of New Zealand mudsnails along the upstream to downstream gradient of Reach-2. Stippled vertical line represents the inflow of Sullivan Lake.
0 100 200 300 400 500 600 7000
100
200
300
400
500
0 100 200 300 400 500 600 7000
100200300400500
1250
2500
0 100 200 300 400 500 600 7000
100
200
300
400
500
Wint. ‘04-’05
Summ. ’05
Wint. ‘05-’06
Distance Downstream (m)
New
Zea
land
mud
snai
l Abu
ndan
ce
Sullivan Lk. Inflow
0 100 200 300 400 500 600 7000
100
200
300
400
500
0 100 200 300 400 500 600 7000
100200300400500
1250
2500
0 100 200 300 400 500 600 7000
100
200
300
400
500
Wint. ‘04-’05
Summ. ’05
Wint. ‘05-’06
Distance Downstream (m)
New
Zea
land
mud
snai
l Abu
ndan
ce
Sullivan Lk. Inflow

49
Nov-04 Feb-05 May-05 Aug-05 Nov-05 Feb-06
Tem
pera
ture
(o C)
0
5
10
15
20Reach 1 Reach 2
Figure 12. Thermal regimes observed in Reach-1 and Reach-2 during sampling events for the Seasonal Distribution Survey. Three thermograph data loggers were deployed in each reach and temperatures were recorded every 2 hours.

50
3-4 3-5 3-6 3-7 3-8 3-9
Log
Den
sity
(sna
ils/m
2 )
0
2
4
6
8
10
Summer 2005Winter 2005-2006
Figure 13. Mean log(density) of New Zealand mudsnails from positive sites in the large-scale density survey. Error bars represent 1-S.E.

51
3-5 3-4 3-6 3-8 3-7 3-9
Mea
n L
og(D
ensi
ty)
0
1
2
3
4
5
6
7
8
Figure 14. Multiple comparison of mean log(density) results for each site in the large-scale density survey using Fisher’s protected least significant differences. Sites with common horizontal lines are not statistically significant (P>0.05).
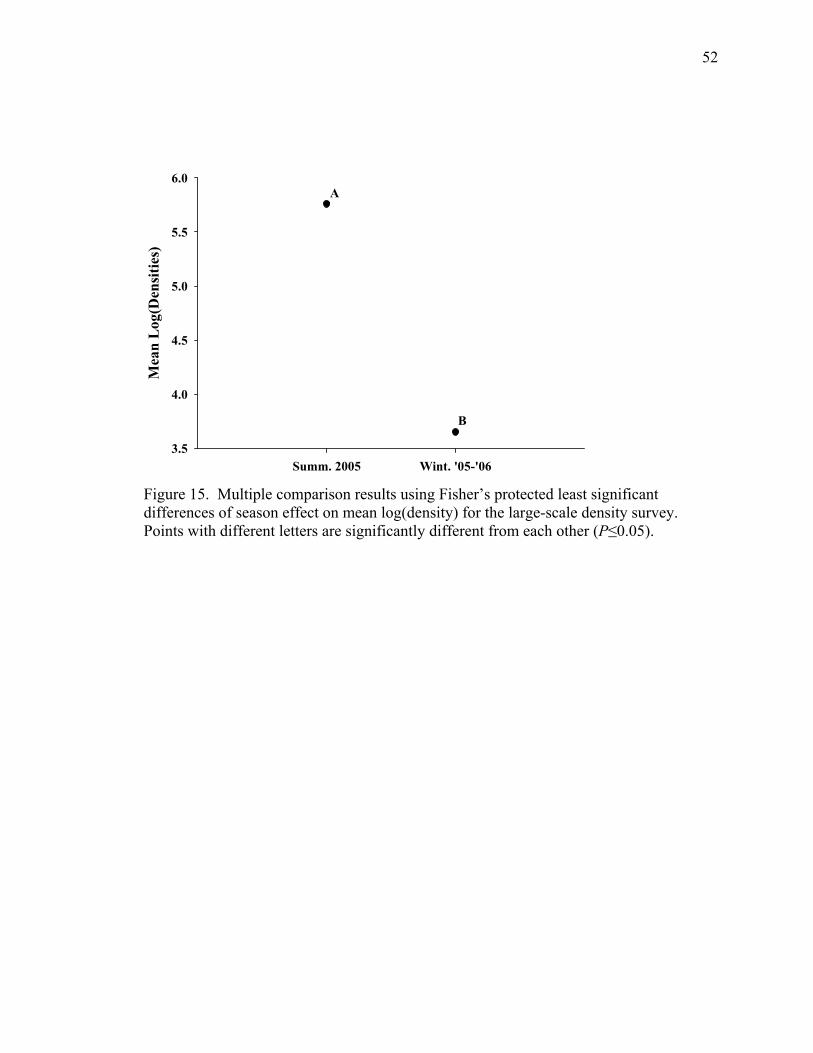
52
Summ. 2005 Wint. '05-'06
Mea
n L
og(D
ensi
ties)
3.5
4.0
4.5
5.0
5.5
6.0A
B
Figure 15. Multiple comparison results using Fisher’s protected least significant differences of season effect on mean log(density) for the large-scale density survey. Points with different letters are significantly different from each other (P≤0.05).

53
0.0
5.0
10.0
15.0
20.0
25.0
30.0
35.0
40.0
14-Jun-04 15-Jun-04 16-Jun-04 17-Jun-04 18-Jun-04 19-Jun-04
Date
Tem
pera
ture
(°C
Loving CrSC Foot BridgeAir Temperature
Figure 16. Water temperatures recorded on Loving Creek and Silver Creek (Silver Creek Foot Bridge) and air temperatures on Silver Creek, between 14 June and 19 June, 2004.

54
CHAPTER II: RELATIONSHIP OF LOWER LETHAL TEMPERATURES AND
DURATION OF EXPOSURES ON MORTALITY OF NEW ZEALAND
MUDSNAILS POTAMOPYRGUS ANTIPODARUM
Abstract
The lower thermal tolerance of New Zealand mudsnails Potamopyrgus
antipodarum (Gray) (family Hydrobidae) was estimated in laboratory experiments, to
evaluate the response of mudsnails to field observed winter water temperatures in a
controlled setting. Snail mortality over time of exposure to constant and dynamic
temperatures was evaluated. Mortality of New Zealand mudsnails occurred only in
treatments where temperatures were maintained at or below 0˚C. The estimated median
lethal time of exposure (LT50) was lower for snails exposed to dynamic temperature
regimes (33-42 h) than for snails exposed to a more constant temperature regime (72 h).
These results suggest that New Zealand mudsnails may be limited in their ability to
disperse into areas where seasonal temperatures drop below 0˚C for longer than 3 to 4
days and that dynamic temperature regimes can cause earlier mortalities.

55
Introduction
Water temperature is an important habitat quality determinant for many aquatic
invertebrates (Saunders 1980, Quinn et al. 1994, Cox and Rutherford 2000, Johnstone
and Rahel 2003). Since temperature can affect all physiological processes growth,
survival, and the distribution of aquatic invertebrates are directly related to water
temperature (Laudien 1973) and are maximized at optimal temperatures (Cheper 1979).
The low body weight and the large ratio of surface area to volume of most invertebrates
allows heat exchange with the environment to occur very rapidly (Jankowsky 1973) and
affect physiological processes. Unless such animals possess behavioral, structural, and/or
physiological adaptations that allow them to withstand such stressors (Irons et al. 1993),
temperatures can be lethal and possibly exclude them from certain reaches of aquatic
habitat. Therefore, identifying these temperature limits is important for managing the
flora and fauna of specific water bodies.
Many researchers have worked to define the temperature limitations of a variety
of aquatic invertebrates (Sweeney 1976, Sweeney and Schnack 1977, Sweeney and
Vannote 1978, Sweeney 1978, Sweeney and Vannote 1986, Quinn et al. 1994, Johnstone
and Rahel 2003). However, data on the thermal tolerances of the invasive New Zealand
mudsnail Potamopyrgus antipodarum (Gray) (family Hydrobiidae) are limited. Quinn et
al. (1994) identified the upper thermal limit for New Zealand mudsnails as ~30˚C in a
laboratory experiment in which the snails were held at constant temperatures. Cox and
Rutherford (2000) observed that diurnally fluctuating temperatures (±5˚C) could lower
the mean upper lethal temperature of the New Zealand mudsnail from a constant
temperature of 30˚C to a mean of 28.5˚C. In New Zealand, P. antipodarum are not

56
observed at temperatures above 28°C (Winterbourn 1969). Potamopyrgus jenkinsi (E.A.
Smith), agreed to be synonymous with P. antipodarum, collected from the river Mattrup
in Denmark, were observed to survive just a few hours at –3°C in freshwater, and low
survival at -2°C in 15 ppt seawater after 7 days (Hylleberg and Siegismund 1987).
Richards et al. (2004) documented total mortality of P. antipodarum within 1 h at –3˚C
on dry substrate under laboratory conditions, identifying the method as a form of
disinfection for wading gear.
The distribution of New Zealand mudsnails P. antipodarum in the Silver Creek
drainage appears limited to ~5 km reach of stream on Loving/Butte Creek and ~2 km on
Silver Creek (Richards and Lester 2003, James and Moffitt 2004). Fluctuating
temperature regimes and lower winter water temperatures in some reaches of this system
(James and Moffitt 2004) may limit the snail’s dispersal and survival. Temperatures
below freezing are lethal to New Zealand mudsnails, but temperatures in the laboratory or
cursory field observations may not be representative of temperatures or conditions
experienced by New Zealand mudsnails in aquatic habitats in the western U.S. Many
streams within the expanding range of New Zealand mudsnails in the western U.S. have
fluctuating temperatures (Johnstone and Rahel 2003) and invertebrates in dynamic
temperature regimes may experience different physiological effects than those held in
constant temperatures (Precht 1973, Sweeney 1976). Consequently, extrapolation of
results from constant lethal temperature trials to organisms occupying streams with
temporally and spatially dynamic temperatures must be interpreted with caution
(Sweeney and Schnack 1977).

57
The cause of mortality of organisms exposed to lower lethal temperatures is
generally a result of cellular damage do to ice formation either intracellularly or
extracellularly (Storey and Storey 1988). Damage can occur as either chill injury of
freeze injury. Chill injury occurs prior to ice nucleation and affects the physical
properties of molecules and the rate of physiological processes, and when severe or
prolonged, lead to irreversible and lethal metabolic imbalances (Storey and Storey 1988).
Freeze injuries occur as a result of physical damage by ice crystals and
structural/metabolic consequences of freeze concentration. Damage can distort or deform
cellular membranes and disrupt cellular osmoregulation capacities (Storey and Storey
1988). In aquatic environments, freezing is a major concern for invertebrates as ice
nucleation in the aquatic habitat can promote internal ice crystal formation of the
organism (Frisbie and Lee 1997). In dynamic temperature regimes, the accrual of
cellular damage is dependent on the length of time an organism is exposed to
temperatures extreme enough to cause damage (Laudien 1973) and the effect of
subsequent freeze-thaw events does more damage than constant low temperatures
(Voelkel 1925 in Laudien 1973).
The objectives of this study were to use laboratory experimentation with field
collected P. antipodarum from Idaho to determine 1) the lower lethal temperature and
corresponding duration of exposure at constant temperatures; and 2) the influence of
fluctuating temperatures on survival of P. antipodarum.

58
Methods
Snail Collections
New Zealand mudsnails were collected from established populations in Riley
Creek, Gooding County, Idaho (October 2005 and January 2006) and from Loving Creek,
Blaine County, Idaho (January 2006). Both locations are characterized as spring fed
systems and collection sites were downstream of the water discharge from fish
hatcheries. Hayspur State Fish Hatchery on Loving Creek is operated by the Idaho
Department of Fish and Game. The U.S. Fish and Wildlife Service operates Hagerman
National Fish Hatchery on Riley Creek. Loving Creek has pronounced diel (~10°C) and
annual (~15°C) temperature fluctuations while Riley Creek maintains fairly constant
temperature of 15°C.
We collected snails using a D-framed kick-net with a 500-micron mesh net, by
placing the net at the streambed surface and kicking the upstream substrate to drift snails
into the net. The samples were transferred into plastic bags and placed in a cooler for
transport to the University of Idaho. Aquatic vegetation (Characaeae spp. and
Ranunculaceae spp.) was collected along with the snails and transported to the University
of Idaho in a separate container to provide periphyton as a food source for snails prior to
initiation of the experiments. Snails and vegetation were delivered to the University of
Idaho’s wet lab within 24 hrs of collection. Snails collected in October 2005 from Riley
Creek were acclimated in the laboratory in water containers (2 L) filled with
dechlorinated and aerated municipal water for five days at a constant 15°C. Snails
collected in January 2006 from both Riley Creek and Loving Creek were tested in trials
within 24 h upon arrival at the University of Idaho.

59
Constant Temperature Trials
Replicated groups of snails were monitored at one of four constant water
temperatures: 0, 2, 4, or 15˚C to determine survival over time. To conduct a trial,
polypropylene specimen cups (120 mL, n=64) were filled with 100 ml of 15˚C
dechlorinated aerated municipal water and 10 New Zealand mudsnails >2 mm were
placed into a “holding” cup approximately 2 h before the trial started, and maintained at
15°C. Similar cups were filled with 100 mL from the same water source and were placed
into incubators set at each of the test temperatures 1 d prior to the trial. At the start of the
trial, the holding cup with snails was inverted over a 100 µm mesh stainless steel screen,
and the snails transferred to their respective test container. Cups with snails were then
returned to individual incubators held at 0°C, 2°C, 4°C, and 15°C. The incubators were
maintained on a continual dark cycle while those snails in the 15°C control incubator,
which doubled as the recovery room, were held on a 10-hr dark, 14-hr light cycle.
At each specified time interval (1, 2, 4, 8, 24, 48, 72, and 96 h), two cups were
removed from each incubator (temperature treatment) and placed into the 15˚C recovery
room. Mortalities were assessed immediately, at 24 h and 48 h after removal. Snails that
had retreated into their shells and did not show activity when prodded with a dissecting
needle were considered dead. At 48 h after removing from test temperature a final
evaluation of survival was made under a dissecting microscope for quality assurance of
the survival estimate.
Dynamic Temperature Trials
Replicate snails from two separate New Zealand mudsnail populations were
exposed to dynamic temperature regimes to assess their differences in ability to withstand

60
fluctuating lower temperatures. Three dynamic temperature regimes were designed to
mimic those observed in Loving Creek during the winter: 1) –2 to 2 ˚C, 2) 0 to 4 ˚C, and
3) 2 to 6 ˚C. Temperatures fluctuated on a 24-hour cycle with 10 hours warm and 14
hours cold. As a control, snails from Riley Creek were held at a constant 15˚C and snails
from Loving Creek were held at a constant 8˚C. Control incubators were also used as
recovery incubators for the respective snail source. All incubators were maintained on a
24 h dark cycle. Snails exposed to dynamic temperature trials were not acclimated in the
lab prior to the start of the trial. All temperature (n=4) by time (n=8) by source (n=2)
were replicated for a total of 164 treatment combinations.
Polypropylene cups (120 mL, n=164) were filled with 100 mL of 15°C or 8°C
dechlorinated aerated municipal water, and ten New Zealand mudsnails (>2 mm) were
placed into each cup 2 hrs before the trial started. Snails from Riley Creek were
maintained at 15°C and snails from Loving Creek were maintained at 8°C. Identical cups
were filled with 100 mL of dechlorinated municipal water that had been chilled to the
designated experimental temperature.
At each specified time interval (1, 2, 4, 8, 24, 48, 72, and 96 h), two cups in each
temperature treatment for each snail source were removed and placed into respective
recovery incubators. Mortality assessments were conducted in the same manner as
previously outlined for constant temperature trials.
Temperature Monitoring
Temperatures were monitored throughout both experiments using HOBO 08
temperature loggers (Onset Corp., Pocasset, Massachusetts) to record temperatures of
exposure. Loggers were deployed to record temperatures at 10-minute intervals

61
throughout the duration of the constant temperature trial. Temperatures were not
recorded during the dynamic temperature trials in the –2 to 2˚C incubator, and instead a
mock trial was conducted with similar methods but without any snails. Temperatures for
the dynamic temperature trials were recorded at 2 h intervals.
Data Analysis
All statistical analyses were conducted with data collected at 48 h assessments,
since earlier mortality assessments were not always accurate because of snails retreating
behavior during the trials. Observations from the immediate and 24 h assessments are
used in interpretation of these results. Median lethal time (h) of exposure at 0˚C was
calculated using a probit model (SAS Institute Inc. 2003). Using the equation Ф-1 (χ) = α
+ βχ, where Ф-1 (χ) is the cumulative distribution of mortality for the standard normal
distribution, α is the estimated parameter for the intercept, β is the estimated parameter
for the slope, and χ is the log10(Time), the normal maximum likelihood estimates of a
median lethal time (LT50) were generated with corresponding 95% CI. Differences in the
slopes and intercepts, when slopes were similar, were tested for the probit models
between Riley Creek and Loving Creek snails exposed to the dynamic temperature
regime using Wald’s Chi-square analysis.
Results
Constant Temperature Trials
New Zealand mudsnails from Riley Creek exposed to constant temperatures
greater than 0˚C showed zero to five percent mortality throughout the duration of the
experiment (Table 12). However, snails exposed to temperatures of 0˚C experienced
high mortality over the course of the experiment (Table 12). After 72 h, 50% of snails

62
held at 0°C were dead and 100% were dead at 96 h (Table 12, Figure 17). The probit
model estimated the LT50 at 72 hours (Figure 18). However, the estimated model
parameters were not statistically robust (P=0.9999; Table 13). Intermediate mortalities
were not observed frequently enough throughout the experiment at 0˚C in order to
calculate 95% CI for this data set.
Temperatures recorded in the incubation chambers were within ~1˚C of target
temperatures throughout the experiment (Table 14; Figure 19).
Dynamic Temperature Trials
Mortality in Riley Creek snails held in treatment temperatures maintained at or
above 0˚C experienced zero to five percent mortality while five to 20% mortality was
observed in the snails held at the control temperature of 15°C (Table 15). Snails held at
–2 to 2˚C showed 66.7% mortality at 48 h and 100% mortality at 72 h and 96 h (Table
15; Figure 20). The LT50 estimated by the probit model for Riley Creek snails held at –2
to 2˚C was 33h (95%C.I. = 24.5-41.5 h; Figure 21).
Loving Creek snails exposed to temperatures at or above 0˚C, showed zero to five
percent mortality during the 96 h experiment (Table 15). Snails in the 0 to 4˚C treatment
group experienced one mortality (5%) at 8h of exposure (Table 15). No mortalities were
observed for snails held at 2 to 6˚C or 8˚CConstant treatment groups (Table 15). Snails held
at –2 to 2˚C began dying at 24h and all were dead at 72 h (Table 15; Figure 20). The
calculated LT50 for Loving Creek snails was 42h (95%C.I. = 35-49 h; Figure 21). The
slope estimates for the Loving Creek and Riley Creek snail data (Table 16) were
significantly different (Walds χ2 = 5.8821, P= 0.0153; Table 17) indicating that snails

63
from Loving Creek showed more rapid and higher mortalities than did snails from Riley
Creek at –2 to 2˚C.
Target and observed temperatures during this study were not equivalent for all
treatments. Mean temperatures in the –2 to 2˚C, 2 to 6˚C, and the constant 8˚C
treatments were similar to target temperatures (Table 14). Temperatures observed in the
constant 15˚C treatment were about 2.5˚C lower than anticipated (Figure 22) and
averaged 12.4˚C (Table 14). Although temperature profiles in the 0 to 4˚C had an
average close to the target temperature (1.36˚C vs. 2.00˚C, respectively; Table 14), the
magnitude and amplitude of the cycle did not mimic the anticipated regime (Figure 23).
Discussion
New Zealand mudsnails were able to survive temperatures less than 2°C for up to
96 h, but temperatures at or below 0˚C were lethal. These results are consistent with the
work of Hylleberg and Siegismund (1987), and also suggest that the rate of the lethal
response is dependent on the degree and duration of the exposure temperatures.
Hylleberg and Siegismund (1987) reported 100% mortality after a few hours at –3˚C in
their study. During the present study at a constant 0˚C, greater than 72 h were needed for
complete mortality of New Zealand mudsnails and greater than 48h were required in
dynamic temperatures of -2 to 2°C.
No mortalities were observed in snails that were exposed to dynamic temperatures
of 0 to 4˚C. Temperatures in this treatment never reached 0˚C, and were generally closer
to 1˚C, only slightly lower than the average 1.6˚C temperature observed in the constant

64
temperature trial (Table 2). The lack of mortality in this treatment group may be
attributable to the failure in reaching the desired target temperatures.
The estimated LT50s for dynamic temperatures were lower than the estimated LT50
for snails held at constant temperatures, although the inability to calculate confidence
intervals prevents statistical comparison. Under fluctuating temperature regimes, 50%
mortality of New Zealand mudsnails was reached in less than 48-h with snails from both
Riley Creek and Loving Creek when temperatures fluctuated between 2˚C and -2˚C under
24 hour cycles. Fifty percent mortality was not achieved in the constant temperature trial
until samples were removed at 72-h.
Size, as well as age and development, can influence the thermal resistance of
animals, both positively and negatively (Precht 1973). This study used snails larger than
2 mm; smaller snails may be less tolerant to cold temperatures. Richards et al. (2004)
determined that New Zealand mudsnails <2 mm held in a dry environment were more
susceptible to freezing when compared to larger snails (>2 mm). Further research on
mortality levels of small snails in an aqueous environment needs to be conducted.
Throughout this experiment snails exposed to both constant and dynamic
temperature regimes <2˚C for more than 4 h retreated into their shells. After a 24 h
recovery period, most snails were active and moving around the cups. This behavioral
trait may be an adaptive response for survival at lower lethal temperatures. It has been
reported that external coverings including chitin exoskeletons, wax coatings, and egg
casings can endure freezing while still protecting interior organs unless the barrier is
weakened by tears or lesions (Precht 1973). In addition to the possible thermal protection
provided by the shell and operculum, retreating into the shell may allow the snail to drift

65
downstream and escape the cold temperature. Richards et al. (2001) noted that New
Zealand mudsnails were the second most abundant macroinvertebrate in 24-hr drift
samples in Banbury Springs, Gooding County, Idaho, indicating that New Zealand
mudsnails may utilize stream currents to aid in dispersal. Furthermore, water
temperatures tend to be more stable in higher (>4th) order streams (Vannote and Sweeney
1980) and drifting downstream would likely provide a greater chance of encountering
suitable thermal habitat. However, the majority of the Silver Creek drainage is only a 3rd
order stream and winter temperatures in the lower reaches fluctuate daily from 4-5˚C,
frequently dropping below 0˚C during the winter (Chapter I, this thesis). Unless the snail
can locate sufficient thermal refugia in the hyporheic zone, it must travel several stream
kilometers (possibly up to 100 rkm to the confluence with the Little Wood River) to
reach an area where temperatures may allow survival. This potential movement is
impeded by several irrigation impoundments throughout the drainage.
Although New Zealand mudsnails may volitionally travel at relatively high rates
of speeds up to one m/h (Richards et al. 2001, Richards and Lester 2003), there must
exist some limit to the distance they could travel in order to locate optimal thermal
refugia, especially at lower environmental temperatures. During this experiment, activity
levels of New Zealand mudsnails were impeded at lower treatment temperatures,
especially those below 4°C. Snails from constant temperature regimes of 2°C and 4°C as
well as snails in the dynamic temperature regime 2±2˚C often appeared lethargic with
slow retreating responses when prodded with the dissecting needle, even at 48h of
recovery. Such slow movements at colder laboratory temperatures imply that colder
66
temperatures in the field may increase the amount of time it takes a snail to travel to
locate thermal refugia.
Because Riley Creek snails were removed from constant, warmer (~14˚C)
temperatures, they should have experienced the greatest stress when tested at
temperatures below acclimation. However, snails from Loving Creek showed more rapid
mortality when tested. It is likely that snails from Loving Creek may have been more
stressed in their natural environment where daily average temperatures in December 2005
had decreased to ~ 6.5˚C. Thus when challenged at average temperatures ~0˚C, already
stressed snails were unable to compensate for increased stress when compared with snails
from Riley Creek that had been acclimatized at temperatures of ~14˚C. In general,
experiments assessing thermal tolerances of organisms are conducted by gradually
decreasing the temperature of the organism from holding temperature to treatment
temperatures in order to minimize the thermal shock experienced (Precht 1973).
However, by immediately exposing New Zealand mudsnails to treatment temperatures,
an assessment of the time to lethal response was not confounded by different acclimation
times. This rapid temperature change may have been a factor in these results, but is
unlikely since significant mortalities were only observed in temperatures less than 0°C.
A large number of embryos were released from the snails in both temperature
experiments. This response may be an evolutionary reproductive strategy for New
Zealand mudsnails during environmental stressors. Mature snails may retain embryos
during stressful events (i.e. low temperature), however, if the environmental stressor is
severe, New Zealand mudsnails may be “programmed” to release their remaining
embryos as a strategy that some may survive long enough after the stress is reduced to

67
locate a more suitable habitat. In addition, New Zealand mudsnail embryos may also
drift well in a streams current increasing the likelihood of escaping the unfavorable
condition. Laboratory trials of mature New Zealand mudsnails force-fed to rainbow trout
Oncorhyncus mykiss observed that embryos were released from the snails removed from
the intestinal tract of the fish (Bruce 2006). Determining what effect severe stress
actually has on New Zealand mudsnail reproduction and eventual survival of offspring
could be an important aspect for potential management options for this invasive species.
The studies reported here support the hypothesis that temperatures may influence
the distribution of New Zealand mudsnails in the Silver Creek drainage. In areas where
New Zealand mudsnails have been identified in the Silver Creek drainage winter water
temperatures are maintained between 4 and 6˚C whereas areas where New Zealand
mudsnails have not been detected drop below 0˚C often throughout the winter. In the
Riley Creek drainage water temperatures rarely drop below 13.5˚C in the wintertime and
New Zealand mudsnails are most likely not limited by colder water temperatures.
Although temperatures are playing an important role in New Zealand mudsnail dynamics
in Silver Creek, nutrition and the chemical composition of the aquatic environment
including pH, salinity, and dissolved oxygen may also affect the thermal resistance
(Precht 1973) of New Zealand mudsnails.

68
References
Bruce, R.L. 2006. Methods of fish depurations to control New Zealand mudsnails at fish hatcheries. Masters Thesis. University of Idaho, Moscow, Idaho.
Cheper, N. J. 1979. Thermal tolerance of the Isopod Lirceus bachyurus (Crustacea:Isopoda). The American Midland Naturalist 104: 312-318.
Cox, T. J. and J. C. Rutherford. 2000. Thermal tolerances of two stream invertebrates exposed to diurnally varying temperatures. New Zealand Journal of Marine and Freshwater Research 34: 203-208.
Frisbie, M. and R. Jr. Lee. 1997. Inoculative freezing and the problem of winter survival for freshwater macroinvertebrates. Journal of the North American Bentholgical Society 16: 635-650.
Hylleberg, J. and H. R. Siegismund. 1987. Niche overlap in mud snails (Hydrobiidae): freezing tolerance. Marine Biology 94: 403-407.
Irons, J. G. I., L. K. Miller, and M. W. Oswood. 1993. Ecological adaptations of aquatic macroinvertebrates to overwintering in interior Alaska (U.S.A) subarctic streams. Canadian Journal of Zoology 71: 98-108.
James, C. A. and C. M. Moffitt. 2004. Studies of the New Zealand mudsnail in Silver Creek drainage: results of 2004 survey.
Jankowsky, H. D. 1973. Body temperature and external temperature. Pages 293-301. in Precht, H., Christopherson, J., Hensel, H., and Larcher, W. editors. Temperature and Life. Springer-Verlang, New York, New York.
Johnstone, H. C. and F. J. Rahel. 2003. Assessing temperature tolerance of Bonneville cutthroat trout based on constant and cycling thermal regimes. Transactions of the American Fisheries Society 132: 92-99.
Laudien, H. 1973. The normal temperature range: changing reaction systems. Pages 355-397. in Precht, H, Christopherson, J., Hensel, H., and Larcher, W. editors. Temperature and Life. Springer-Verlang, New York, New York.
Precht, H. 1973. Limiting temperatures of life functions. Pages 400-441. in Precht, H., Christopherson, J., Hensel, H., and Larcher, W. editors. Temperature and Life. Springer-Verlang, New York, New York.
Quinn, J. M., G. L. Steele, C. W. Hickey, and M. L. Vickers. 1994. Upper thermal tolerances of twelve New Zealand stream invertebrate species. New Zealand Journal of Marine and Freshwater Research 28: 391-397.

69
Richards, D. C., L.D. Cazier, and G.T. Lester. 2001. Spatial distribution of three snail species including the invader Potamopyrgus antipodarum in a freshwater spring. Western North American Naturalist 61: 375-380.
Richards, D. C. and G. T. Lester. 2003. Survey of the invasive New Zealand mudsnail, Potamopyrgus antipodarum in the Silver Creek drainage in and around the The Nature Conservancy's Silver Creek Preserve, Idaho, USA. EcoAnalyst, Inc., Moscow, Idaho.
Richards, D. C., P. O'Connell, and D.C. Shinn. 2004. Simple control method to limit spread of New Zealand mudsnail, Potamopyrgus antipodarum. North American Journal of Fisheries Management 24: 114-117.
SAS Institute Inc. 2003. The SAS System for Windows v9.1. SAS Institute Inc. Cary, North Carolina.
Saunders, G. W. 1980. Habitat selection and factors affecting the distribution and abundance of gastropods in a spring-fed stream. Masters Thesis. University of Idaho, Moscow, ID.
Storey, K. B. and J. M. Storey. 1988. Freeze tolerance in animals. Physiological Reviews 68: 27-84.
Sweeney, B. W. 1976. A diurnally fluctuating thermal system for studying the effect of temperature on aquatic organisms. Limnology and Oceanography 21: 758-763.
Sweeney, B. W. 1978. Bioenergetic and developmental responses of a mayfly to thermal variation. Limnology and Oceanography 23: 461-477.
Sweeney, B. W. and J. A. Schnack. 1977. Egg development, growth, and metabolism of Sigara alternata (Say) (Hemiptera:Corixidae) in fluctuating thermal environments. Ecology 58: 265-277.
Sweeney, B. W. and R. L. Vannote. 1978. Size variation and the distribution of hemimeatbolous aquatic insects: two thermal equilibrium hypotheses. Science 200: 444-446.
Sweeney, B. W. and R. L. Vannote. 1986. Growth and production of a stream stonefly: Influences of diet and temperature. Ecology 67: 1396-1410.
Vannote, R. L. and B. W. Sweeney. 1980. Geographic analysis of thermal equilibria: A conceptual model for evaluating the effect of natural and modified thermal regimes on aquatic insect communities. The American Naturalist 115: 667-695.

70
Winterbourn, M. J. 1969. Water Temperature as a factor limiting the distribution of Potamopyrgus antipodarum (Gastropoda-Prosbranchia) in the New Zealand thermal region. New Zealand Journal of Marine and Freshwater Research 3: 453-458.

71
Table 12. Percent mortality observed in New Zealand mudsnails held in constant temperature trials during October 2005. Snails (N=640) >2.0mm from Riley Creek were evenly distributed into 64 replicate incubation cups and 16 cups placed into individual temperature treatments (0°C, 2°C, and 4°C). At the specified time intervals (1, 2, 4, 8, 24, 48, 72, and 96h) 2 cups were removed from each temperature to assess mortalities. As a control, snails were maintained at maintained at 15°C, comparable Riley Creek temperatures.
Time (h) 0°C 2°C 4°C 15°C 1 0.0 0.0 5.0 0.0 2 0.0 0.0 0.0 0.0 4 0.0 0.0 0.0 0.0 8 0.0 0.0 0.0 0.0
24 0.0 0.0 0.0 0.0 48 0.0 0.0 0.0 0.0 72 50.0 5.0 0.0 0.0 96 100.0 5.0 0.0 0.0

72
Table 13. Parameter estimates for the probit model of New Zealand mudsnails from Riley Creek tested in constant temperature trials during October 2005. No confidence intervals were estimated because of the large standard error (SE).
Parameter Estimate SE (104) χ2 P
Intercept -104.82 63.2678 0.00 0.9999 Log10(Time) 56.47 34.0638 0.00 0.9999

73
Table 14. Mean and (range) of target and observed temperatures (˚C) during constant and dynamic temperature trials of New Zealand mudsnails. ∆(Target-Observed) is the difference between the target and observed temperature mean for constant and dynamic trials and minimum and maximum for dynamic trials only. Constant trials were conducted during October 2005 and dynamic trials during January 2006.
Target Mean Temperature (Min.-Max)
Observed Mean Temperature (Min.-Max.) ∆(Target-Observed)
Constant
0˚C -0.42 (-0.61 — -0.16) -0.42
2˚C 1.63 (1.60 — 2.03) -0.37
4˚C 2.47 (2.46 — 2.89) -1.53
15˚C 16.35 (14.47 — 17.14) 1.35
Dynamic 0˚C
(-2 — 2) -0.27
(-1.51 — 0.73) -0.27
(0.49 — -1.27) 2˚C
(0 — 4) 1.36
(0.30 — 3.47) -0.64
(0.30 — -.53) 4˚C
(2 — 6) 3.38
(2.46 — 4.99) -0.62
(0.46 — -1.01)
8˚C 6.40 (6.22 — 8.63) -1.60
15˚C 12.43 (12.16 — 15.62) -2.57

74
Table 15. Percent mortality observed in New Zealand mudsnails collected from Riley Creek (Riley) and Loving Creek (Loving) during January 2006 held in dynamic temperature trials. Snails (N=640 from each source population) were evenly distributed between 128 and cups and 16 cups from each population were placed into all temperature treatments (0±2°C, 2±2°C, 4±2°C, 8°C for Riley control, and 15°C for Loving). At each time intervals (1, 2, 4, 8, 24, 48, 72, and 96h) four cups (2 from each source population) were removed to assess mortality. For controls, only snails from the respective streams were placed into those control temperatures. Loving Creek snails were maintained at 8°C and Riley Creek snails were maintained at 15°C as controls.
0±2°C 2±2°C 4±2°C Controls Time (h) Riley Loving Riley Loving Riley Loving Riley (8°C) Loving (15°C) 1 5.0 0.0 0.0 0.0 0.0 0.0 0.0 0.0 2 0.0 0.0 0.0 0.0 5.0 0.0 0.0 0.0 4 0.0 0.0 0.0 0.0 0.0 0.0 0.0 0.0 8 0.0 0.0 0.0 5.0 5.0 0.0 0.0 0.0
24 0.0 20.0 0.0 0.0 0.0 0.0 0.0 15.0 48 66.7 30.0 0.0 0.0 0.0 0.0 0.0 0.0 72 100.0 100.0 0.0 0.0 0.0 0.0 0.0 5.0 96 100.0 100.0 5.0 0.0 0.0 0.0 0.0 20.0

75
Table 16. Parameter estimates for probit models for New Zealand mudsnails collected from Riley Creek and Loving Creek for dynamic temperature trials conducted during January 2006.
Parameter Estimate SE χ2 P
Riley Creek Intercept -4.2463 0.6100 48.45 <0.0001 Log10(Time) 2.8016 0.3787 54.73 <0.0001 Loving Creek Intercept -8.5380 1.5526 30.24 <0.0001 Log10(Time) 5.2420 0.9248 32.13 <0.0001
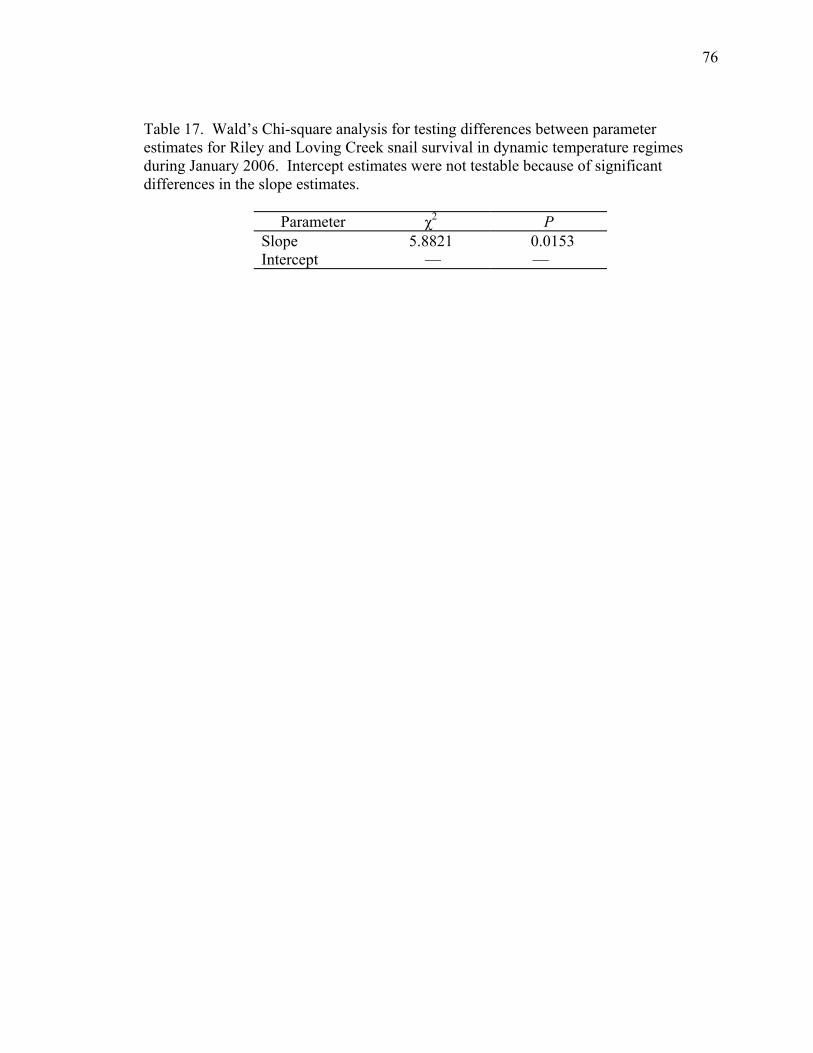
76
Table 17. Wald’s Chi-square analysis for testing differences between parameter estimates for Riley and Loving Creek snail survival in dynamic temperature regimes during January 2006. Intercept estimates were not testable because of significant differences in the slope estimates.
Parameter χ2 P
Slope 5.8821 0.0153 Intercept — —

77
Time (hrs.)
0 20 40 60 80 100 120
% M
orta
lity
020
4060
8010
0
Figure 17. Percent mortality of New Zealand mudsnails exposed to constant 0°C at different time intervals during October 2005.

78
log10(TimeHours)
1.80 1.82 1.84 1.86 1.88 1.90 1.92
Mor
talit
y (p
robi
t uni
ts)
3
4
5
6
7
Figure 18. Probit model plots for mortality response of New Zealand mudsnails from Riley Creek exposed to constant 0˚C in October 2005. Dashed lines represent calculated LT50.

79
T im e ( h )
0 2 0 4 0 6 0 8 0 1 0 0 1 2 0
Tem
p. (o C
)
- 2
0
2
4
1 2
1 4
1 6
1 8
2 0
0 o C2 o C3 o C1 5 o C
Figure 19. Temperatures in incubation chambers during constant temperature trials of New Zealand mudsnails in October 2005.

80
Time (h)
0 20 40 60 80 100 120
% M
orta
lity
0
20
40
60
80
100
Riley Cr. Loving Cr.
Figure 20. Percent mortality of New Zealand mudsnails from Riley Creek (closed circles) and Loving Creek (open circles) exposed to –2 to 2 ˚C in temperature trials during January 2006.

81
0.0 0.5 1.0 1.5 2.0 2.5 3.0
Mor
talit
y (p
robi
t uni
ts) 3
4
5
6
7
Log10(TimeHours)
0.0 0.5 1.0 1.5 2.0 2.5 3.0
3
4
5
6
7
Riley Cr.
Loving Cr.
Figure 21. Probit model plots for mean (solid line) ±95% CI (dashed line) mortality response of New Zealand mudsnails from Riley Cr. and Loving Cr. exposed to fluctuating temperature of 0±2˚C in January 2006. The slopes of the two lines are significantly different (Wald’s χ2 = 5.8821, P=0.0153). Dotted lines represent the calculated LT50.

82
Figure 22. Temperature profiles for recovery/control treatments experienced by New Zealand mudsnails during January 2006, dynamic temperature tests.
C o n t r o l T e m p e r a t u r e s
T im e ( m in . )
0 1 0 0 0 2 0 0 0 3 0 0 0 4 0 0 0 5 0 0 0 6 0 0 0 7 0 0 0
Mea
n Te
mp.
(o C)
4
6
8
1 0
1 2
1 4
1 6
1 8
8 0 C1 5 o C

83
∆ M
ean
(o C)
-2oC to 2oC
0 20 40 60 80 100 120-2
-1
0
1
2
0oC to 4oC
0 20 40 60 80 100 120-2
-1
0
1
2
2oC to 6oC
T im e (h )
0 20 40 60 80 100 120-2
-1
0
1
2
Figure 23. Temperature deviations from the mean temperature experienced by New Zealand mudsnails in three different treatment regime.

84
CHAPTER III: POPULATION DYNAMICS OF NEW ZEALAND MUDSNAILS
POTAMOPYRGUS ANTIPODARUM IN SPRING FED STREAMS BELOW TWO
FISH HATCHERIES
Abstract
Differences in densities, population dynamics, and brood sizes of New Zealand
mudsnails Potamopyrgus antipodarum (Gray) (family Hydrobidae) were examined in
two spring fed streams in southern Idaho. Both study locations were downstream of fish
hatcheries and had similar water quality parameters. However, one site, Riley Creek, had
year round constant temperature and one, Loving Creek, had fluctuating temperatures.
The environment with more stable temperature, Riley Creek, supported significantly
higher densities of New Zealand mudsnails, but brood sizes relative to shell length in
Loving Creek appear to be significantly greater than that of Riley Creek. Snails in Riley
Creek matured at a smaller size (<3.00 mm) than snails from Loving Creek. Despite the
large brood sizes in Loving Creek, the population does not appear to be expanding and
future effects of trophic disruption from invasive New Zealand mudsnails will most likely
not occur. These conclusions are consistent with laboratory findings that New Zealand
mudsnails are limited by fluctuating cold water temperatures.

85
Introduction
Since their introduction in 1987, New Zealand mudsnails Potamopyrgus
antipodarum (Gray) (family Hydrobidae) have spread throughout the western United
States and are found in waterways in nearly every western state (Bowler 1991, Cada
2004, Richards and Shinn 2004, Richards 2004, Richards et al. 2004a, Kerans et al.
2005). Populations of P. antipodarum can reach densities of 750,000/m2 in streams and
dominate carbon and nitrogen cycling (Hall et al. 2003) as well as secondary production
(Hall et al. 2006). It is hypothesized that at these densities, populations of New Zealand
mudsnails will disrupt ecosystem dynamics (Richards et al. 2001, Richards and Lester
2003, Cada 2004, Richards and Shinn 2004, Richards 2004, Richards et al. 2004b,
Kerans et al. 2005). New Zealand mudsnails dominated the secondary production of
invaded streams within the Greater Yellowstone Area (Hall et al. 2006); however, no
significant effects on the individual or pooled family density or biomass of co-occurring
Baetidae mayflies (Baetis tricaudatus, Diphetor hageni, and Acerpenna pygmaea) were
detected in Darlinton Spring Ditch, Montana (Cada 2004).
Several factors can influence the density and dynamics of invertebrate populations
including predator abundance (Lafontaine and McQueen 1991, Osman and Whitlatch
1996, Hamels et al. 2001, Bohn et al. 2004, Purcell and Decker 2005), food resources
(Crenshaw et al. 2002), and habitat quality (Death 1989). In aquatic environments, food
quality/quantity and water temperature are of primary importance (Precht 1973, Death
1989, Irons et al. 1993, Kerans et al. 2005). Many aquatic organisms lack the
physiological capabilities to thermoregulate and must therefore use behavioral
adaptations to ensure survival in suboptimal conditions (Precht 1973, Jankowsky 1973,

86
Irons et al. 1993). Behavioral thermoregulation is easily accomplished for motile aquatic
organisms such as fish, which can readily migrate many kilometers in search of thermally
optimal environments. However, for obligate aquatic invertebrates, migration may not be
the most efficient behavioral response to thermal stressors especially during winter.
Aquatic invertebrates that are not oviparous and that are not able to locate thermal refugia
may be affected by extreme temperature regimes (Irons et al. 1993).
Since its initial observation in Silver Creek, Blaine County, Idaho in 2001,
concerns have been raised about the impact that New Zealand mudsnails could have on
the food web and how local hatchery management practices might promote its expansion
(Richards and Lester 2003). In the intervening time, little to no expansion of the P.
antipodarum populations have occurred within Silver Creek even in areas receiving
hatchery effluents (James and Moffitt 2004). Hatchery wastewater often includes
increased nitrogen and phosphorous, in addition to other suspended solids, that can
influence the production of aquatic systems (Michael 2003). These added nutrients can
increase the primary productivity of the receiving system, resulting in additional food
resources for primary consumers like the New Zealand mudsnail, which tend to thrive in
streams with high productivity (Kerans et al. 2005). Although New Zealand mudsnails
appear well established within the Silver Creek drainage (Richards and Lester 2003,
James and Moffitt 2004), they have not reached high densities, or expanded throughout
the drainage to the extent that is typical for this invasive species (Bowler 1991, Richards
et al. 2004b).
Research on the life history and population dynamics of New Zealand mudsnails
is increasing our ability to understand mudsnail invasions and ecological impacts

87
(Richards and Lester 2000, Richards et al. 2001, Cada 2004, Richards and Shinn 2004,
Richards 2004, Kerans et al. 2005). Conflicting conclusions have arisen, though, as to
the potential factors limiting New Zealand mudsnail distribution in these streams. Most
notably, the debate centers around two main factors: temperature and food resources.
The focus of the present research was a comparative examination of New Zealand
mudsnail population dynamics in two springs-fed stream systems receiving effluent from
fish hatchery facilities. The objectives were 1) to determine whether densities of New
Zealand mudsnails differed between sites during winter and summer and 2) to assess how
the size-class distribution and brood sizes of these two sites may influence any detectable
differences in densities.
Methods
Field Sites
The areas below both Hagerman National Fish Hatchery on Riley Creek, Gooding
County (Figure 24) and Hayspur State Fish Hatchery on Loving/Butte Creek, Blaine
County, Idaho (Figure 25) receive hatchery wastewater effluents. In addition, hatchery
production water sources are ground water springs or wells, which maintain fairly
constant temperatures. However, the temperature regimes downstream of Hayspur State
Fish Hatchery are more variable (James and Moffitt 2004) than below Hagerman
National Fish Hatchery (HNFH 2004) and may affect populations of New Zealand
mudsnails differently.
The United States Fish and Wildlife Service operates Hagerman National Fish
Hatchery (HNFH). Water is supplied to HNFH by several springs surfacing near the
hatchery, which then eventually flow into Riley Creek. The water source maintains a

88
fairly constant temperature of ~15˚C year round at 1,892 L/s. As part of the Lower Snake
River Compensation Plan, HNFH rears ~1.2 million spring run steelhead trout
Oncorhynchus mykiss as mitigation for the four lower Snake River Hydro-electric
facilities. In addition to rearing steelhead smolts, HNFH also rears catchable rainbow
trout O. mykiss (~130,000 annually) for Dworshak Reservoir mitigation program.
Of the ~1,892 L/s supplied from the surrounding springs, the hatchery’s water
needs for steelhead production vary from about 566 L/s during the summer to 1,892 L/s
during the winter. Before entering Riley Creek, hatchery production waste water passes
through two concrete settling ponds (1,900 m3 each) before being discharged into Riley
Creek.
Hayspur State Fish Hatchery (Loving/Butte Creek) — Hayspur State Fish
Hatchery (HSFH) is operated by the Idaho Department of Fish and Game as a broodstock
facility supplying Hayspur strain and Kamloops strain rainbow trout, along with
westslope cutthroat trout O. clarki broodstocks. As a broodstock facility, fish are kept
year round on station with little annual fluctuation in the 9,000 kg of brood fish present.
During the summer months, HSFH has higher production levels, as it holds catchable
rainbow trout from other hatcheries for redistribution into the Little Wood and Big Wood
River drainages. Approximately 20,500 kg of catchable rainbow trout are distributed
from HSFS between April and September.
Water is supplied to HSFH via two sources: three artesian pumped wells and one
covered spring. Ground water from these sources maintains temperatures of
approximately 10-12˚Cin the hatchery and together supply 226 L/s of water for

89
production purposes. Abandoned brood ponds, located in the Butte Creek channel are
utilized as settling ponds for wastewater.
Field Collections
Three 100 m sampling areas were established downstream from the outflows of
both HSFH and HNFH. The area closest to each hatchery outflow was located
approximately 80 m downstream of the outflow and each of the areas was spatially
separated from the next by 100 m. Nine sites within each area were randomly selected
using a random points generator (Minnesota Department of Natural Resources Sampling
Generator Extension) and corresponding Universal Transverse Mercator (NAD-27)
coordinates identified within each area in ArcView 3.2. Each sampling point was
constrained with a 1 m diameter sampling area and a 5 m buffer zone, ensuring that no
two points were located within less than 6 m of each other in order to minimize the
potential for disturbing one site while sampling at another. Each point was located in the
field using both a Garmin eTrex GPS unit and a hardcopy of maps from the digital
projections in ArcView.
A modified Hess sampler was used to collect New Zealand mudsnails at each site.
The Hess sampler (sampling area=0.086 m2, 500 µm mesh) was modified with a 91.4 cm
long, 35.6 cm diameter tube of sheet metal. The tube was further modified with a 35.6
cm to 30.5 cm reducer on the bottom that allowed it to be inserted into the top of the Hess
sampler when water levels were higher than the Hess sampler itself. A stable fork, with
its width and tongs trimmed to approximately 20 cm, was used to manipulate the
substrate confined inside of the modified Hess sampler at each site. Substrates were
manipulated to a depth of 8-10 cm by vigorously raking them in a crosshatched pattern.

90
Vegetation was collected in the net and shaken vigorously to remove as many
invertebrates as possible. The samples were then passed through a series of three sieves
(2 mm, 1 mm, and 500 µm) to remove larger debris. After sieving, the residue on both
the 1 mm and 500 µm sieve were retained and transferred to a labeled plastic jar and
preserved in 10% formalin solution.
Directly after sampling, water temperature (˚C), dissolved oxygen (mg/L),
conductivity (mS/s), total dissolved solids (TDS), and pH were measured using a YSI
Multi-probe meter. Water velocity was also determined using a Marsh-McBirney Flow-
Mate® Model 2000 at each site. Water temperature was monitored within each sampling
area with HOBO8 Data loggers.
Lab Processing
Field samples were sub-sampled in the lab on a sectioned sorting tray with 32
numbered and equally sized 4 x 5 cm cells. The 32-cells were contained by 4 plexiglass
retaining walls ~ 10 cm high. Individual samples were placed into the center of the sub-
sampling tray and standard tap water was added to make the sample more fluid. The
samples were then swirled with a metal spatula to achieve a heterogeneous distribution of
all organisms and then four of the 32 cells were selected randomly for removal. The
selected portions of each sub-sample were removed and placed into a small glass jar and
filled with 70% ETOH until they were finally processed.
These selected sub-samples were examined and New Zealand mudsnails were
removed and counted. One-third of the sub-samples from each stream was recounted for
quality assurance. If the difference between the counts was greater then 10%, the sample
was resorted.

91
Size-Class Distribution
Snails were separated into size categories large (>2.5 mm), medium (>1.5 mm
and <2.5 mm), and small (<1.5 mm) based on shell lengths, using a series of three sieves:
16 ASTM (large), 35 ASTM (medium), and 270 ASTM (small). After placing snails on
the sieves, the sieves were moved into a bucket with enough water to come within 5 cm
of the lip of the top sieve. The sieves were then rapidly pulled out of the water and
shaken vigorously to allow the snails to be sorted out on the sieve screens. This process
was repeated 15-20 times to ensure that snails separated out adequately.
The contents of each sieve were placed on a paper-towel and allowed to air dry
for ~5 minutes. Snails were then placed in a weighing boat and weighed (0.001g; or
0.0001g if the sample weight was less then 0.01g). After the preserved wet weight was
recorded, approximately 10% of the snails were counted and the proportion of snails in
each size class estimated based on sample weights.
Brood Sizes
At least 30 snails >2.5 mm from each sample were dissected to determine the
number of embryos per snail. Snails >2.0mm were examined, but only snails >2.5mm
were sexually mature and contained embryos. Dissections were done by slicing the snail
in half directly behind the second whirl from the aperture. The remaining portion
containing the head and operculum was further dissected from the shell until all that
remained was the periostracum. Once isolated, the brood pouch was easily accessible
and embryos removed and enumerated.

92
Data Analysis
Because the density data were not normal the data were ranked and analyzed
using a mixed-effects general linear model: y = stream + season + substrate + error.
Substrate was considered a random effect because sampling sites were selected randomly
within each polygon and because the habitat structure of Loving Creek changes between
winter and summer. When samples were obtained from the same locations over the
seasons, it was unlikely to be the same habitat type (i.e. gravel, sediment, or vegetation)
that was present during sampling events. All two and three-way interactions were
included in the model. A post-hoc multiple comparisons test was performed after model
fitting on the highest order effects that were significant. Tukey’s pairwise comparison
adjustment was utilized for these multiple comparisons in order to protect against Type I
error.
The potential differences between size-classes were analyzed using a categorical
data modeling procedure. The modeling procedure used a maximum-likelihood analysis
represented with a two-dimensional contingency table. A log-linear model analysis was
used to test for differences in the proportion of snails within each size class between
streams, season, and substrate. In the event that a higher order interaction was non-
significant at α = 0.05, a reduced model was fit that did not include the non-significant
interaction. The process was repeated until no further interaction terms were non-
significant.
Simple linear regression was used to model the response of brood sizes. The
model, y = shell-length + error, where y is the number of embryos in the brood, was fit to
the data for each season and stream. To test for differences in slopes of these models, we

93
modeled the data by hatchery using the analysis of covariance model y = season +
shell_length + error, where y is the number of embryos in a brood and shell size was
considered the covariate factor. The slopes were considered significantly different if the
interaction (season*shell_length) was significant (P<0.05. Tukey’s multiple comparison
test was used after fitting the model to assess which slopes were significantly different
from each other. All data analyses were conducted using the SAS software (SAS
Institute Inc. 2003)
Results
New Zealand Mudsnail Densities
Mixed model analysis of ranked mudsnail densities identified the substrate main
effect and the interaction of stream*season as significant (P<0.05; Table 18). Ranked
densities of mudsnails were higher in the Riley Creek drainage compared to Loving
Creek across all sampling periods (P<0.05; Table 19; Figures 26 and 27). Both gravel
and vegetation had significantly greater ranked densities of New Zealand mudsnails then
sediment (P<0.05; Table 20; Figure 28).
During the winter 2004-2005 sampling period, the mean rank score of New
Zealand mudsnails was higher for Riley Creek than for Loving Creek (P<0.01; Table 19;
Figure 27). Snails were most likely to be found in vegetation in both systems while
presence on gravel was also high relative to sediment substrates during this sampling
period (Figure 26). Average ranks for Riley Creek were 133.8 (110,207 snails/m²) and
128.5 (54,271 snails/m²) in vegetation and gravel, respectively (Figure 26). In Loving
Creek the average ranks were 69.7 (5,281 snails/m²) and 57.3 (1,600 snails/m²) in

94
vegetation and gravel, respectively (Figure 26). Sediment substrate had the fewest New
Zealand mudsnails in both Loving Creek and Riley Creek (Figure 26).
During the summer of 2005, New Zealand mudsnail densities were significantly
higher in Riley Creek than in Loving Creek, (P<0.05; Table 19; Figure 27). However,
summer densities in Riley Creek were lower than those observed in winter 2004-2005 in
the same stream (P=0.0314; Table 19). Densities of snails in Loving Creek were
comparable between summer 2005 and winter 2004-2005 (P=0.8596; Table 19). In Riley
Creek, New Zealand mudsnails achieved similar densities on all three substrate types
(Figure 26). In Loving Creek, New Zealand mudsnails were most abundant on gravel
substrates with vegetation and sediment having lower, although similar abundances
(Figure 26).
During the final sampling period (Winter 2005-2006), New Zealand mudsnail
densities were higher in Riley Creek and increased from levels observed during the
summer of 2005 (P=0.0496; Table 19). Mudsnails were most abundant on vegetation
and gravel substrates during this sampling period in Riley Creek (Figure 26). Densities
in Loving Creek during the winter 2005-2006 sampling period were the lowest of all
observed (Figure 27), however they were not significantly different from either the winter
2004-2005 (P=0.8596) or the summer 2005 (P=0.4727) samplings events in Loving
Creek (Table 19). Density of snails in Loving Creek sampled in sediments during the
winter 2005-2006 were similar to densities observed during other collection times at that
location (Figure 26). Densities in vegetation were comparable to levels observed during
95
the previous summer, but winter samples in gravel substrate taken in the winter 2005-
2006 season were almost 50% lower (Figure 26).
Water physico-chemical parameters varied between streams, with Loving Creek
generally having higher levels of conductivity (mS/s), total dissolved solids (TDS; g/L)
and salinity (ppt; Table 21). These same parameters also varied across seasons with
summer levels generally greater than winter levels (Table 21). Dissolved oxygen (mg/L)
and pH were fairly consistent between streams and across seasons (Table 21). Water
temperatures measured during sampling events varied between streams during all
sampling periods and temperatures in Loving Creek also varied across seasons (Table
21). However, year round temperature monitoring showed even greater variation in
Loving Creek both diurnally and seasonally (Figure 29) than was evident from
temperatures recorded during sampling.
Size-Class Distribution
Log-linear categorical modeling of the size class distribution resulted in a
significant three-way interaction of Sample_Period*Substrate*Size_Class for both
Loving and Riley Creek data sets (P<0.05; Table 22). Because of the low densities of
New Zealand mudsnails in Loving Creek, some data points were highly influential on the
results and a priori hypothesis were not tested with these data. For instance, during the
winter 2004-2005 sampling period, ~80% of the population were small (<1.5 mm) snails
(Figure 30). This variation was from one sample with over 300 small snails while the
next highest count in any size class was only 35 snails. Therefore, only general

96
observations of the Loving Creek data will be made here, while linear contrasts of the
Riley Creek data will be used to test a priori hypotheses.
Nearly all snails from the winter 2004-2005 sampling in Loving Creek were small
snails while medium and large snails constituted 4.5% and 7.3%, respectively (Figure
30). Small snails were most abundant in vegetative substrates, followed by gravel and
sediment (Figure 30). Although snails were found on all substrate types, no large (>2.5
mm) snails were collected from the soft sedimentary substrate during this sampling
period. There were nearly equal proportions of large and small snails from Loving Creek
during the summer 2005 while medium snails composed 20% of the population (Figure
30). Of all available substrates, snails were most prevalent on gravel substrates during
the summer 2005 sampling season (Figure 30). During the winter 2005-2006 sampling
period, the size class distribution was the inverse of that observed for Loving Creek
during the winter 2004-2005 sampling. Large snails comprised the majority of the
samples while small snails were least abundant.
During the initial sampling period of the winter 2004-2005 in Riley Creek, a
significantly large proportion of the snails collected were small snails across all substrate
types (P<0.05; Table 23). Vegetative substrates had the largest proportion of snails in all
size classes during this sampling period (Figure 31). Approximately 30% of snails
collected were from gravel substrate with the majority being small snails (Figure 31).
Sediment appeared to be the least inhabited substrate sampled with ~20% of the
population occurring within that substrate (Figure 31).
Large snails were the dominant size class (50%) of snails sampled from Riley
Creek during the summer of 2005 with 38% medium and 12% small snails (Figure 31).

97
Snails from all size classes were most prevalent on vegetative substrate in Riley Creek
followed by gravel and sediment substrates, respectively (Figure 31). Large snails made
up a significantly larger portion of the samples in vegetation (Table 23). In gravel
substrates there were no detectable differences between the proportion of medium and
small snails. Small snails were the most abundant size class found on sediment substrates
(Table 23).
In the winter 2005-2006 samples from Riley Creek, small snails constituted more
than half of the snails collected (Figure 31). Almost 40% of all small snails were
observed in vegetative substrate, which was significantly greater than the proportions of
medium and large snails within that substrate (P<0.001; Table 23). Within the sediment
substrate, small snails again made up the largest portion of snails in this substrate (Table
23). Approximately 40% of the snails collected were observed on gravel substrate with
small snails constituting the greatest portion and large snails the smallest portion (Figure
31).
A distinct seasonal pattern appears evident in the population dynamics of New
Zealand mudsnails in Riley Creek. During the summer 2005 sampling, small snails were
the least abundant size class followed by medium and large snails, which were most
prolific. This size-class structure, however, is influenced extensively by the proportion of
snails detected on vegetative substrates (~90%; Figure 31). During both winter sampling
periods, there was a complete reversal of this structure. Small snails were most prevalent
in winter while large snails were least abundant. The only detectable difference between
large snails collected in either winter sampling period was in snails collected from
vegetation (Table 23).

98
Snail and Brood Size Relationship
Regression modeling to determine the number of embryos brooded by snail shell
length produced variable results between streams and season. All models had positive
slopes, but regression coefficients were not consistent across all models. This model fit
snails from Loving Creek better than Riley Creek. The model explained between 12-52%
of the variation in Loving Creek but only 5-18% of the variability in Riley Creek (Table
24).
During the winter of 2004-2005 sampling period, the parameter estimate for the
slopes of the regression models for Loving and Riley Creek were not significantly
different (P=0.1776; Table 25; Figure 32). In the summer of 2005 and winter of 2005-
2006, mature snails from Loving Creek had significantly more embryos per millimeter
shell length than Riley Creek snails (P<0.0001, Table 25; Figures 33 and 34). Embryos
were found in snails from Riley Creek as small as 2.5 mm, while no snails less than 3.0
mm in Loving Creek had embryos during all three sampling periods. During the summer
2005 sampling period, snails from Loving Creek had the greatest number of embryos per
shell length of all streams in any given sampling period with a slope of 3.19 (Table 24).
This response was significantly greater than the estimate for Riley Creek snails during the
same sampling period (P<0.0001; Table 25) or for Loving Creek in either of the winter
sampling periods (P<0.0001; Table 26). In the winter 2005-2006 sampling period,
reproductive potential fell from the levels observed during summer 2005. Loving Creek
again had a greater parameter estimate compared with Riley Creek and this difference
was significant (P=0.0006; Table 25). Although reproductive levels had fallen during
this winter sampling, the estimate for Riley Creek was the only one that had dropped to

99
levels observed during the winter of 2004-2005 (Table 24). The estimate for Loving
Creek during the winter 2005-2006 was significantly greater than the estimate for Winter
2004-2005.
Discussion
New Zealand mudsnail densities were strikingly different between Riley Creek
and Loving Creek. Densities of New Zealand mudsnails in Riley Creek were similar to
most other densities reported at locations in the western United States (Richards et al.
2001, Richards 2004, Richards and Shinn 2004, Kerans et al. 2005) while only Cada
(2004) reported densities that were similar to those observed in Loving Creek. Cada
(2004) reported densities of New Zealand mudsnails from Darlinton Spring Ditch,
Montana ranging from zero snails/m2 in a low density reach during November 2002 to
24,750 snails/m2 in a high density reach during July 2002. Densities of New Zealand
mudsnails in Loving Creek were also similar to those reported for locations in their native
range by Scott et al. (1994) and lower than densities in Pupa Springs, New Zealand
(Michaelis 1977).
In the time since New Zealand mudsnails were first detected in the Silver Creek
drainage, there has been relatively little expansion or growth of the population (Richards
and Lester 2003, James and Moffitt 2004, Chapter I, this thesis), which seems surprising
for a species that generally expands rapidly in waterways after introduction (Bowler
1991). Some factor, or a suite of factors, is likely limiting the population. Several factors
have been described that affect population abundance, distribution, and dynamics. These
factors include hydrological processes (Death 2002), predator abundance (Lodge et al.
1987, Lafontaine and McQueen 1991), habitat stability (Death 1996a), water chemistry

100
(Russel-Hunter 1978; Lodge et al. 1987), and macrophyte presence (Lodge et al. 1987).
Two other common limiting factors for aquatic invertebrates are temperature (Precht
1973, Vannote and Sweeney 1980, Saunders 1980, Sweeney and Vannote 1986) and food
resources (Sweeney and Vannote 1986, Crenshaw et al. 2002) especially for New
Zealand mudsnails (Richards et al. 2001, Cada 2004, Cada 2004, Kerans et al. 2005).
While New Zealand mudsnail densities generally peak during summer months
(Cada 2004, Richards 2004, Hall et al. 2006), the maximum density of New Zealand
mudsnails in Riley Creek occurred during the winter, coinciding with peak fish
production at Hagerman National Fish Hatchery. Although Hagerman National Fish
Hatchery has off-line settling ponds to reduce nutrient inputs into Riley Creek, effluents
from fish production facilities can provide additional nutrients for primary production
(Selong and Helfrich 1998) which likely helps support high densities of New Zealand
mudsnails. Production at HNFH ranged from 1,944 kg of fish/cms in May 2005 to
131,577 kg of fish/cms in March 2005. This same trend in New Zealand mudsnail
densities was not observed in Loving Creek, below Hayspur State Fish Hatchery when
fish production doubled from a base level of 9,000kg to ~18,000kg of fish (39,729 kg of
fish/cms of flow to 79,458 kg of fish/ cms of flow) between April and September (B.
Dredge, HSFH Manager, personal communication). Hayspur State Fish Hatchery
effluents are also diverted into Loving Creek where vacant brood ponds act as settling
ponds, and a greater proportion of the resulting nutrient-enriched effluents are probably
entering directly into Loving Creek and into the food-web.
In addition to increased fish production at Hayspur State Fish Hatchery during the
summer, there is an increase in water temperatures that should provide an even more

101
suitable environment for New Zealand mudsnail growth. Growth rates of New Zealand
mudsnails were maximized at temperatures of 20°C to 22°C in a laboratory with a
significant increase in growth rates of snails reared at 15°C (~0.0090mm/day) compared
with snails reared at 6°C (0.0035mm/day) (Richards 2004). Average monthly
temperatures in Loving Creek were 13.1°C, 14.6°C, and 13.7°C in June, July and August
2005, respectively, with daily highs reaching 16°C. These temperatures are much higher
than winter averages of 6 to 8°C (December 2005 and January 2006, respectively) in the
same reach (Figure 34).
Taken together, both nutrient and temperature increases should promote NZMS
population growth during the summer months, however such increases were not observed
during this research. Brood sizes in Loving Creek, as measured by embryo counts per
mm of shell length, are higher compared those observed in Riley Creek, but this
difference does not appear to result in increased population abundance in Loving Creek.
It is possible that our sampling intervals were too broad (December 2004, 2005, and July
2005) to detect differences in densities of New Zealand mudsnails in Loving and
therefore future efforts should incorporate more temporal sampling intensity.
Physicochemical parameters have been used as surrogates for stream nutrient and
productivity levels (Prepas 1983), including conductivity and total dissolved solids
(TDS). At all sampling times, Loving Creek had greater responses for both conductivity
and TDS. Nitrogen and phosphorous, known to be limiting factors in primary production
of lentic and lotic systems (Kalff 2002), have been collected in these streams by various
agencies and were also collected during both winter sampling periods of the present work
(Appendix A). Phosphorous appears to have the greatest seasonal variation in both

102
stream systems while nitrogen is fairly consistent, although it was quite high in Loving
Creek when assessed during this project (1.4 mg/L). Differences in these nutrient levels
could be related to differences in fish production cycles at each hatchery, but also to
differences in nutrient cycling by primary producers in each stream. If phosphorous is
the major limiting factor for primary production in Loving and Riley Creek, it could
explain the difference between population dynamics of New Zealand mudsnails.
However, New Zealand mudsnails are known to limit periphyton accrual even in nutrient
enriched streams (Hill et al. 1992). The samples collected in this study were grab
samples, and perhaps a flow integrated diel sample would have provided better validation
of these trends. Further understanding on the dynamics of primary production in each
stream and nutrient cycling within the stream will be useful in discerning its affect on
New Zealand mudsnail populations.
During this study, mats of vegetation were observed sloughing off and drifting
downstream in the Silver Creek drainage. Other researchers have noted this event
occurring (Francis and Bjornn 1979). Disturbance regimes have been recognized as
influencing the structure and distribution of invertebrates in aquatic systems (White and
Pickett 1985, Death and Winterbourn 1995, Death 1996b, Holomuzki and Biggs 2000,
Death 2002) and losses of submerged macrophytes can reduce the local densities of
various pulmonate and prosobranch snails inhabiting them (Lodge et al. 1987).
Macrophyte beds are known to maintain temperatures 2-5˚C warmer than the open
flowing channel (Saunders 1980) and their reduction would decrease the available
thermal refugia for New Zealand mudsnails in Loving Creek. During the winter in
Loving Creek a larger proportion of New Zealand mudsnails were detected on the

103
remaining vegetative substrates, while during the summer the greatest proportion of New
Zealand mudsnails were detected on gravel substrate. The combined effect of the loss of
macrophyte beds and decreased temperatures together during the winter can result in
multiple disturbance events which may overall impact New Zealand mudsnail
populations. Diel fluctuation in oxygen that likely occurs in the macrophyte beds during
summer conditions could also affect the survival of snails.
Kerans et al. (2005) proposed that chemical water parameters and algal
production, rather than temperature, are more important factors limiting New Zealand
mudsnails, especially in the Madison River. The results of my study suggest that water
temperature plays a significant role in limiting the explosive nature of New Zealand
mudsnails as well. Recent studies by Hall et al. (2006) support a temperature association
with and density. They observed lower and less seasonal variability in the abundance of
New Zealand mudsnails in the colder Gibbon River, Greater Yellowstone Area, when
compared with warmer streams in the same area. In Darlinton Spring Ditch, Montana,
Cada (2004) reported New Zealand mudsnail densities similar to those of Loving Creek
and similar annual temperature regimes (range = 4˚C in February to 23˚C in August).
The multiple effects of variable and seasonally cooler temperatures, along with
macrophyte sloughing, has probably limited the ability of New Zealand mudsnails to
become extremely dense and prolific in the Silver Creek drainage.
Most authors concludes that 3.00 mm is the minimum size that New Zealand
mudsnails begin sexual maturation (Winterbourn 1970a, Winterbourn 1970b, Richards
and Lester 2000, Richards 2004). However, in my study embryos were common in snails
less than 3.0 mm shell length from Riley Creek and maximum shell length rarely
104
exceeded 4.0mm. Within the invertebrate community, early maturation is often observed
in populations that are at extremely high densities (Van Buskirk 1993, Lee and Ban
1999). The results for the Riley Creek population may indicate that those snails are
responding to density dependent factors as a result of high densities. While it has been
noted that New Zealand mudsnails reared at higher densities had a lower growth rates
(Richards 2004), it has not been determined what effect this may have on overall
maximum size or early maturation. In Loving Creek, embryos were only observed in a
single snail smaller than 3.0 mm in shell length during the summer of 2005, and
maximum shell length consistently approached 5.00 mm. It was suspected that warm,
constant water temperatures and high densities were major factors in the early maturation
of New Zealand mudsnails in Riley Creek. However, (Cada 2004) reported the presence
of embryos in snails less than 3.0 mm from Darlinton Spring Ditch, Montana where
maximum densities of New Zealand mudsnails averaged 24,750 m-2 during July, while
stream temperatures ranged from a high of 21˚C August to a low of 4˚C in February .
Intraspecific competition may be a plausible explanation for early maturation of New
Zealand mudsnails in Riley Creek, yet it does not appear to explain the presence of early
maturation in Darlinton Spring Ditch. However, other factors could be driving early
maturation in a select few areas including genetic differences. Recently, a second clonal
variation has been documented to occur in the Hagerman Valley, Idaho near the Riley
Creek population. The ability of this snail to reach maturation at a smaller size in two
streams with strikingly different physical characteristics begs further investigation.
While hatchery management practices can influence downstream food-web
dynamics (Michael 2003), anthropogenic inputs into Loving Creek, mostly from Hayspur

105
State Fish hatchery, do not appear to be enhancing New Zealand populations. In fact,
density independent factors such as temperature regimes and habitat loss through
macrophyte bed die-offs are likely affecting the abundance and dynamics of New
Zealand mudsnails in Loving Creek. The decreased maximum size of New Zealand
mudsnails in Riley Creek may be a result of density dependent factors and the resulting
intraspecific competition and inputs from Hagerman National Fish Hatchery effluents
may be promoting New Zealand mudsnail production especially during the wintertime.
Other factors that were not considered during this research could be influencing
these two populations. While conductivity was utilized as a proxy for stream
productivity, it does not necessarily give an accurate representation for true primary
production and therefore differences may actually exist between both streams in primary
production. Considerations must be made, though, to determine what factors may affect
primary production in these streams including nutrient loads, abundance and diversity of
primary consumers, as well as the effects of temperature and light on periphyton growth.
Likewise, differences in predator abundance may influence differences in population
dynamics. Both fish and waterfowl are known to prey on New Zealand mudsnails and
are common in both streams, but to what extent they utilize New Zealand mudsnails in
either stream is unknown. Leaches are also prevalent in Riley and Loving Creek and
could be predating on New Zealand mudsnails.

106
References
Bohn, T., O. T. Sandlund, P. Amundsen, and R. Primicerio. 2004. Rapidly changing life history during invasion. Oikos 106: 138-150.
Bowler, P. A. 1991. The rapid spread of the freshwater Hydrobiid snail Potamopyrgus antipodarum (Gray) in the Middle Snake River, Southern Idaho. Proceedings of the Desert Fishes Council 21: 173-182.
Cada, C. A. 2004. Interactions between the invasive New Zealand mudsnail, Potamopyrgus antipodarum, Baetid mayflies, and fish predators. Masters Thesis. Montana State University, Bozeman, Montana.
Crenshaw, C., H. Valett, and J. Tank. 2002. Effects of coarse particulate organic matter on fungal biomass and invertebrate density in the subsurface of a headwater stream. Journal of the North American Benthological Society 21: 28-42.
Death, R. G. 1989. Effect of a cave on benthic invertebrate communities in a South Island stream. New Zealand Natural Sciences 16: 67-78.
Death, R. G. 1996a. The effect of patch disturbance on stream invertebrate community structure: the influence of disturbance history. Oecologia 108: 567-576.
Death, R. G. 1996b. The effect of habitat stability on benthic invertebrate communities: the utility of species abundance distribution. Hydrobiologia 317: 97-107.
Death, R. G. 2002. Predicting invertebrate diversity from disturbance regimes in forest streams. Oikos 97: 18-30.
Death, R. G. and M. J. Winterbourn. 1995. Diversity patterns in stream benthic invertebrate communities: the influence of habitat stability. Ecology 76: 1446-1460.
Francis, L.J. and T. C. Bjornn. 1979. Aquatic resources in the Nature Conservancy portion of Silver Creek: Technical report. Idaho Cooperative Fishery Research Unit, University of Idaho, Moscow, Idaho.
Hall, R. O. Jr., M. F. Dybdahl, and M. C. VanderLoop. 2006. Extremely high secondary production of introduced snails in rivers. Ecological Applications 16: 1121-1131.
Hall, R. O. Jr., J. L. Tank, and M. F. Dybdahl. 2003. Exotic snails dominate nitrogen and carbon cycling in a highly productive stream. Frontiers in Ecology and the Environment 1: 407-411.
Hamels, I., T. Moens, K. Mylaert, and W. Vyverman. 2001. Trophic interactions between ciliates and nematodes from an intertidal flat. Aquatic Microbial Ecology 26: 71-72.

107
Hill, W. R., H. L. Boston, and A. D. Steinmann. 1992. Grazers and nutrients simultaneously limit lotic primary production. Canadian Journal of Fisheries and Aquatic Sciences 49: 504-512.
HNFH. 2004. Hagerman National Fish Hatchery Fiscal Year 2004: summary of operations and expenditures. Hagerman National Fish Hatchery, U.S. Fish and Wildlife Service.
Holomuzki, J. R. and B. J. F. Biggs. 2000. Taxon-specific responses to high-flow disturbance in streams: implications for population persistence. Journal of North American Benthological Society 19: 670-679.
Irons, J. G. I., L. K. Miller, and M. W. Oswood. 1993. Ecological adaptations of aquatic macroinvertebrates to overwintering in interior Alaska (U.S.A) subarctic streams. Canadian Journal of Zoology 71: 98-108.
James, C.A. and C. M. Moffitt. 2004. Studies of the New Zealand mudsnail in Silver Creek drainage: results of 2004 survey.
Jankowsky, H. D. 1973. Body temperature and external temperature. Pages 293-301. in Precht, H., Christopherson, J., Hensel, H, and Larcher, W editors. Temperature and Life. Springer-Verlang, New York, New York.
Kalff, J. 2002. Limnology: Inland Water Ecosystems. Prentice-Hall. Upper Saddle River, NJ.
Kerans, B. L., M. E. Dybdahl, M. M. Gangloff, and J. E. Jannot. 2005. Potamopyrgus antipodarum: distribution, density, and effects on native macroinvertebrate assemblages in the Greater Yellowstone Ecosystem. Journal of the North American Benthological Society 24: 123-138.
Lafontaine, N. and D. J. McQueen. 1991. Contrasting trophic level interactions in Lake St. George and Haynes Lake (Ontario, Canada). Canadian Journal of Fisheries and Aquatic Sciences 48: 356-383.
Lee, H. and S. Ban. 1999. Effect of crowding on growth and reproduction of Simocephalus vetulus O.F. Muller. Hydrobiologia 391: 135-145.
Lodge, D. M., K. M. Brown, S. P. Klosiewski, R. A. Stein, A. P. Covich, B. K. Leathers, and C. Bronmark. 1987. Distribution of freshwater snails: Spatial scale and the relative importance of physiochemical and biotic factors. American Malacological Bulletin 5: 73-84.
Michael, J. H. Jr. 2003. Nutrients in salmon hatchery wastewater and its removal through the use of a wetland constructed to treat off-line settling pod effluent. Aquaculture 226: 213-225.
108
Michaelis, F. B. 1977. Biological features of Pupu Springs. New Zealand Journal of Marine and Freshwater Research 11: 357-373.
Osman, R. W. and R. B. Whitlatch. 1996. Processes affecting newly-settled juveniles and the consequences to subsequent community development. Invertebrate reproduction and development 30: 217-225.
Prepas, E. E. 1983. Total dissolved solids as a predictor of lake biomass and productivity. Canadian Journal of Fisheries and Aquatic Sciences 40: 92-95.
Precht, H. 1973. Limiting temperatures of life functions. Pages 400-441. in Precht, H., Christopherson, J., Hensel, H., and Larcher, W. editors. Temperature and Life. Springer-Verlang, New York, New York.
Purcell, J. E. and M. B. Decker. 2005. Effects of climate on relative predation by scyphomedusae and ctenophores on copepods in Chesapeake Bay during 1987-2000. Limnology and Oceanography 50: 376-387.
Richards, D. C. 2004. Competition between the threatened Bliss Rapids snail, Taylorconcha serpenticola (Hershler et al.) and the invasive aquatic snail, Potamopyrgus antipodarum (Gray). Doctoral dissertation. Montana State University, Bozeman, Montana.
Richards, D. C., D. Gustafson, and B. Walch. 2004a. New Zealand Mud Snail in the Western USA. http://www2.montana.edu/nzms/.
Richards, D. C., L.D. Cazier, and G.T. Lester. 2001. Spatial distribution of three snail species including the invader Potamopyrgus antipodarum in a freshwater spring. Western North American Naturalist 61: 375-380.
Richards, D.C. and G. T. Lester. 2000. Comparison of the number of Potamopyrgus antipodarum (Gray) neonates produced seasonally, between habitats, and in two different freshwater springs, Idaho and Montana: a preliminary investigation. EcoAnalysts, Inc., Moscow, Idaho.
Richards, D.C. and G. T. Lester. 2003. Survey of the invasive New Zealand mudsnail, Potamopyrgus antipodarum in the Silver Creek drainage in and around the The Nature Conservancy's Silver Creek Preserve, Idaho, USA. EcoAnalysts, Inc., Moscow, Idaho.
Richards, D. C., P. O'Connell, and D.C. Shinn. 2004b. Simple control method to limit spread of New Zealand mudsnail, Potamopyrgus antipodarum. North American Journal of Fisheries Management 24: 114-117.

109
Richards, D. C. and D. C. Shinn. 2004. Intraspecific competition and development of size structure in the invasive snail Potamopyrgus antipodarum (Gray, 1853). American Malacolgical Bulletin 19: 33-37.
Russell-Hunter, W. D., R. A. Browne, and D. W. Aldridge. 1984. Overwinter tissue degrowth in natural populations of freshwater pulmonate snails (Helisoma trivovis and Lymnaea palustris). Ecology 65: 223-229.
SAS Institute Inc. 2003. The SAS System for Windows v9.1. SAS Institute Inc. Cary, North Carolina.
Saunders, G. W. 1980. Habitat selection and factors affecting the distribution and abundance of gastropods in a spring-fed stream. Masters Thesis. University of Idaho, Moscow, ID.
Scott, D., J. W. White, and D. S. Rhodes. 1994. Invertebrate fauna of three streams in relation to land use in Southland, New Zealand. New Zealand Journal of Marine and Freshwater Research 28: 277-290.
Selong, J. H. and L. A. Helfrich. 1998. Impacts of trout culture effluent on water quality and biotic communities in Virginia headwater streams. The Progressive Fish-Culturist 60: 247-262.
Sweeney, B. W. and R. L. Vannote. 1986. Growth and production of a stream stonefly: Influences of diet and temperature. Ecology 67: 1396-1410.
Van Buskirk, J. 1993. Population consequences of larval crowding in the dragonfly Aeshna juncea. Ecology 74: 1950-1958.
Vannote, R. L. and B. W. Sweeney. 1980. Geographic analysis of thermal equilibria: A conceptual model for evaluating the effect of natural and modified thermal regimes on aquatic insect communities. The American Naturalist 115: 667-695.
White, P. S. and S. T. A. Pickett. 1985. Natural disturbance and patch dynamics: An introduction. Pages 3-13. in Pickett, S. T. A. and White, P. S. editors. The ecology of natural disturbance and patch dynamics. Academic Press, Orlando, FL.
Winterbourn, M. J. 1970a. The New Zealand species of Potamopyrgus (Gastropoda:Hydrobiidae). Malacologia 10: 283-321.
Winterbourn, M. J. 1970b . Population studies on the New Zealand freshwater gastropod Potamopyrgus antipodarum (Gray). Proceedings of the Malacolgical Society of London 39: 139-149.

110
Table 18. Summary of mixed model analysis of variance (ANOVA) testing the differences between mean ranked density (snail·m-2) of NZMS between streams (Riley Creek or Loving Creek), among seasons (winter 2004-2005, summer 2005, or winter. 2005-2006), substrates (gravel, vegetation, or sediment), and all main effect interactions.
Source DF SS MSE F-value P Stream 1 172937.34 172937.34 209.29 <0.0001 Season 2 5497.34 2748.67 3.33 0.0387 Substrate 2 10938.61 5469.30 6.62 0.0018 Stream*Season 2 24602.00 12301.00 14.89 <0.0001 Stream*Substrate 2 4048.97 2024.49 2.45 0.0899 Season*Substrate 4 6965.36 1741.34 2.11 0.0829 Stream*Season*Substrate 4 5634.52 1408.63 1.70 0.1521
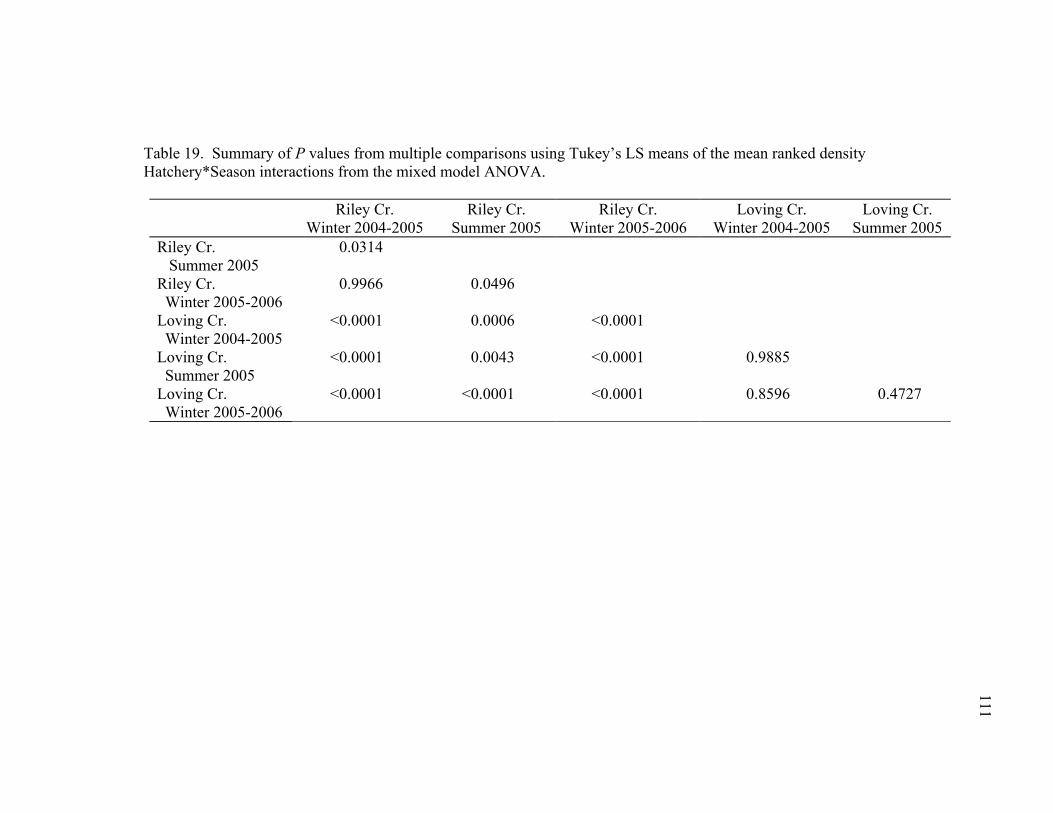
111
Table 19. Summary of P values from multiple comparisons using Tukey’s LS means of the mean ranked density Hatchery*Season interactions from the mixed model ANOVA.
Riley Cr. Winter 2004-2005
Riley Cr. Summer 2005
Riley Cr. Winter 2005-2006
Loving Cr. Winter 2004-2005
Loving Cr. Summer 2005
Riley Cr. Summer 2005
0.0314
Riley Cr. Winter 2005-2006
0.9966 0.0496
Loving Cr. Winter 2004-2005
<0.0001 0.0006 <0.0001
Loving Cr. Summer 2005
<0.0001 0.0043 <0.0001 0.9885
Loving Cr. Winter 2005-2006
<0.0001 <0.0001 <0.0001 0.8596 0.4727

112
Table 20. Summary of P values from Tukey’s LS means multiple comparisons test for differences in mean ranked density scores between the substrate main effects.
Gravel Sediment
Sediment <0.0001
Vegetation 0.4432 0.0003

113
Table 21. Mean and (SE) for chemical and physical water parameters recorded during sampling events in Riley Creek and Loving Creek during winter 2004-2005, summer 2005, and winter 2005-2006.
Winter 2004-2005
Summer 2005
Winter 2005-2006
Riley Loving Riley Loving Riley Loving
Conductivity (mS/s)
0.259 (0.001)
0.281 (0.001)
0.275 (0.001)
0.321 (0.001)
0.226 (0.002)
0.250 (0.001)
Total
dissolved solids (g/L)
0.211 (0.001)
0.273 (0.001)
0.212 (0.000)
0.269 (0.001)
0.183 (0.001)
0.239 (0.001)
Salinity (ppt) 0.158 (0.001)
0.202 (0.001)
0.160 (0.000)
0.201 (0.001)
0.136 (0.001)
0.176 (0.001)
Dissolved
oxygen (mg/L) N/A N/A 9.78 (0.15)
9.75 (0.30)
10.12 (0.14)
10.68 (0.10)
pH 7.78 (0.13)
7.22 (0.12)
8.31 (0.04)
7.97 (0.03)
7.92 (0.01)
7.76 (0.02)
Temperature
(˚C) 14.44 (0.04)
7.69 (0.20)
16.81 (0.08)
13.22 (0.15)
14.57 (0.01)
8.20 (0.07)
Velocity (m/s) 0.424 (0.05)
0.107 (0.02)
0.139 (0.03)
0.090 (0.01)
0.394 (0.04)
0.138 (0.02)

114
Table 22. Summary of maximum likelihood analysis for size class distribution using categorical data modeling among seasons (winter 2004-2005, summer 2005, or winter 2005-2006), substrate (gravel, vegetation, or sediment), size (small, medium, and large) and all main effect interactions.
Source DF χ2 P
Riley Creek
Season 2 1144.02 <0.0001 Substrate 2 1741.65 <0.0001
Size 2 1038.29 <0.0001
Season*Substrate 4 895.79 <0.0001
Season*Size 4 1192.29 <0.0001
Substrate*Size 4 173.82 <0.0001
Season*Substrate*Size 8 460.68 <0.0001
Loving Creek
Season 2 36.97 <0.0001
Substrate 2 0.45 0.7969
Size 2 3.77 0.1519
Season*Substrate 4 208.57 <0.0001
Season*Size 4 35.80 <0.0001
Substrate*Size 4 14.79 0.0052
Season*Substrate*Size 8 47.93 <0.0001

115
Table 23. Results of individual contrasts of select three-way interactions from categorical data modeling in Riley Creek between season, substrate, and size.
Season Substrate Size Class DF χ2 P Gravel Large 1 0.42 0.5166 Sediment Large 1 0.55 0.4571
Winter 2004-2005 vs.
Winter 2005-2006 Vegetation Large 1 3.96 0.0467 Gravel Medium 1 8.04 0.0046 Sediment Medium 1 1.15 0.2846 Vegetation Medium 1 1.45 0.2283 Gravel Small 1 17.21 <0.0001 Sediment Small 1 0.14 0.7111 Vegetation Small 1 26.00 <0.0001 Winter 2004-2005 Gravel Large vs. Medium 1 0.20 0.6510 Medium vs. Small 1 33.69 <.0001 Large vs. Small 1 6.08 0.0137 Vegetation Large vs. Medium 1 5.89 0.0152 Medium vs. Small 1 15.12 0.0001 Large vs. Small. 1 15.12 0.2646 Sediment Medium vs. Small 1 75.34 <0.0001 Large vs. Small 1 0.59 0.4424 Summer 2005 Gravel Large vs. Medium 1 5.74 0.0166 Medium vs. Small 1 0.51 0.4732 Vegetation Large vs. Medium 1 26.74 <0.0001 Medium vs. Small 1 122.22 <0.0001 Sediment Large vs. Medium 1 1.85 0.1733 Medium vs. Small 1 73.44 <0.0001 Large vs. Small 1 14.36 0.0002 Winter 2005-2006 Gravel Large vs. Medium 1 4.28 0.0386 Medium vs. Small 1 17.73 <0.0001 Large vs. Small 1 0.19 0.6635 Vegetation Large vs. Medium 1 2.93 0.0872 Medium vs. Small 1 209.83 <0.0001 Sediment Large vs. Medium 1 0.10 0.7552 Medium vs. Small 1 37.44 <0.0001

116
Table 24. Parameter estimates and (SE) of simple linear regression analysis for brood sizes based on shell length from Riley Creek and Loving Creek during all three sampling periods.
Source Intercept Slope R2
Riley Creek Winter 2004-2005 0.62 (0.355) 0.66 (0.112) 0.043 Summer 2005 -1.89 (0.401) 1.56 (0.127) 0.187 Winter 2005-2006 0.71 (0.639) 0.71 (0.204) 0.038 Loving Creek Winter 2004-2005 0.77 (0.602) 0.900 (0.142) 0.118 Summer 2005 -7.87 (1.05) 3.19 (0.256) 0.546 Winter 2005-2006 -3.20 (1.09) 1.78 (0.257) 0.357

117
Table 25. Summary of analysis of covariance (ANCOVA) testing differences in slope for the number of embryos per shell length unit (mm) by season, using shell length as a covariate.
Source DF SS MSE F-value P Winter 2004-2005 Stream 1 0.051 0.051 0.04 0.8338 Length 1 85.779 85.779 73.65 <0.0001 Stream*Length 1 2.120 2.120 1.82 0.1776 Summer 2005 Stream 1 48.912 48.913 43.70 <0.0001 Length 1 447.158 447.158 399.46 <0.0001 Stream*Length 1 52.209 52.209 46.64 <0.0001 Winter 2005-2006 Stream 1 13.520 13.520 11.92 0.0006 Length 1 71.944 71.944 63.42 <0.0001 Stream*Length 1 13.418 13.418 11.83 0.0006
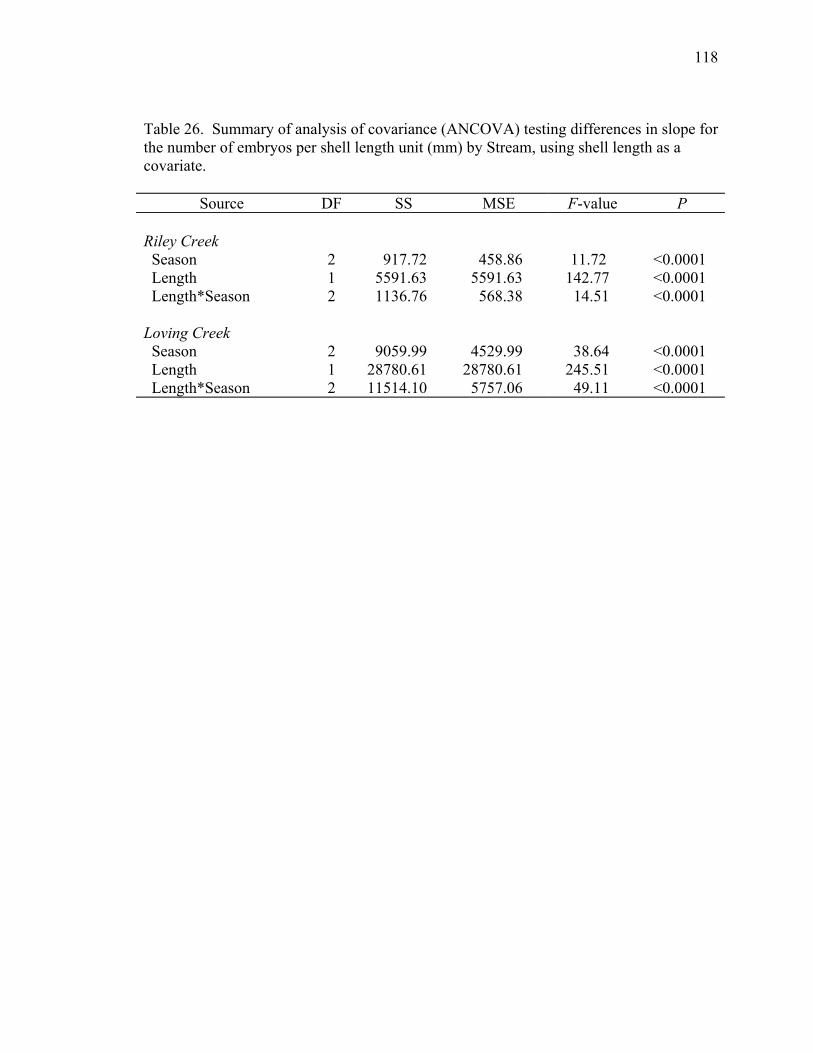
118
Table 26. Summary of analysis of covariance (ANCOVA) testing differences in slope for the number of embryos per shell length unit (mm) by Stream, using shell length as a covariate.
Source DF SS MSE F-value P Riley Creek Season 2 917.72 458.86 11.72 <0.0001 Length 1 5591.63 5591.63 142.77 <0.0001 Length*Season 2 1136.76 568.38 14.51 <0.0001 Loving Creek Season 2 9059.99 4529.99 38.64 <0.0001 Length 1 28780.61 28780.61 245.51 <0.0001 Length*Season 2 11514.10 5757.06 49.11 <0.0001

119
Figure 24. Map of the Riley Creek drainage in the Hagerman valley from its headwaters to its confluence with the Snake River. HSFH is the Idaho Department of Fish and Game’s Hagerman State Fish Hatchery. HNFH is the U.S. Fish and Wildlife Service’s Hagerman National Fish Hatchery
HSFHHNFH
Riley Creek
Snake River
ÊÚ
#
#Boise
Sun Valley
Twin Falls
HSFHHNFH
Riley Creek
Snake River
ÊÚ
#
#Boise
Sun Valley
Twin Falls
ÊÚ
#
#Boise
Sun Valley
Twin Falls
ÊÚ
#
#Boise
Sun Valley
Twin Falls

120
Figure 25. Map of the entire Silver Creek drainage from its headwaters to its confluence with the Little Wood River.
Irrigation diversions are noted by grey lines. Silver Creek Preserve, the Nature Conservancy, is indicated by the gray polygon. The black polygons represent Idaho Department of Fish and Game properties: Hayspur Fish Hatchery on Butte/Loving Creek and the Silver Creek Sportsman’s Access Site on Silver Creek.
Stalke r C r.
ÊÚ
#
Buhler D
rain
Patton Cr.
N
Cain C
r.
Mud C
r.
Grove Cr.
Loving Cr. B utte C r.
S ilve r C r.
Little Wood R
iver
Pica bo
Bo is e Su n Valley
Snake R iver
Stalke r C r.
ÊÚ
#
Buhler D
rain
Patton Cr.
NN
Cain C
r.
Mud C
r.
Grove Cr.
Loving Cr. B utte C r.
S ilve r C r.
Little Wood R
iver
Pica bo
Bo is e Su n Valley
Snake R iver

121
W inter 2004-2005 Sum m er 2005 W inter 2005-20060
20
40
60
80
100
120
140
1600
20
40
60
80
100
120
140
160V egeta tion G ravel Sed im ent
L oving C reek
R iley C reek
Mea
n R
ank
Scor
e
Figure 26. Mean ranked density scores of NZMS observed in Loving Creek and Riley Creek from winter 2004-2005 to winter 2005-2006 in different substrate types. Error bars represent 1-Standard Error.
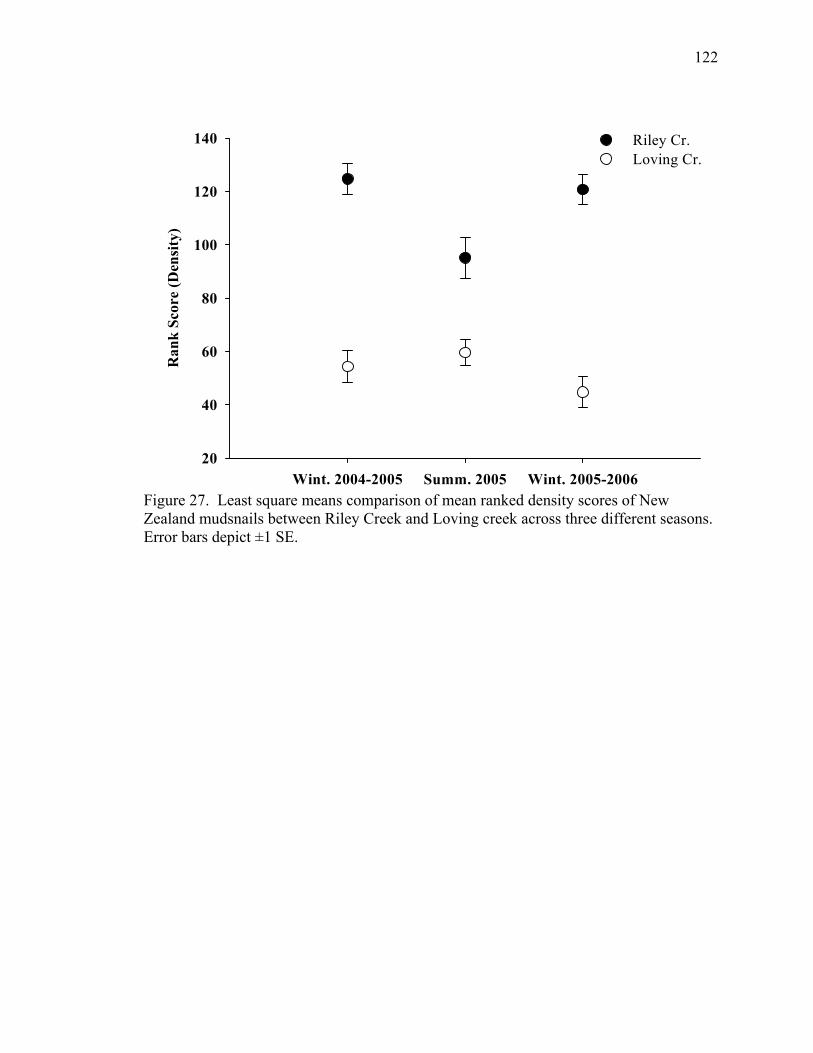
122
Wint. 2004-2005 Summ. 2005 Wint. 2005-2006
Ran
k Sc
ore
(Den
sity
)
20
40
60
80
100
120
140 Riley Cr. Loving Cr.
Figure 27. Least square means comparison of mean ranked density scores of New Zealand mudsnails between Riley Creek and Loving creek across three different seasons. Error bars depict ±1 SE.

123
Gravel Sediment Vegetation
Ran
k Sc
ore(
Den
sity
)
50
60
70
80
90
100
110
Figure 28. Least square means comparison of mean ranked density scores for New Zealand mudsnails from both Riley Creek and Loving Creek, combined, across three different substrates. Error bars depict ±1 SE.

124
D a t e
J a n - 0 5 M a r - 0 5 M a y - 0 5 J u l - 0 5 S e p - 0 5 N o v - 0 5 J a n - 0 6 M a r - 0 6
Tem
pera
ture
(o C)
4
6
8
1 0
1 2
1 4
1 6
1 8 L o v i n g C r . R i l e y C r .
Figure 29. Average daily temperatures recorded every two hours areas of where New Zealand mudsnails were collected from Riley Creek (dash dotted line) and Loving Creek (solid line) between January 2005 to March 2006.
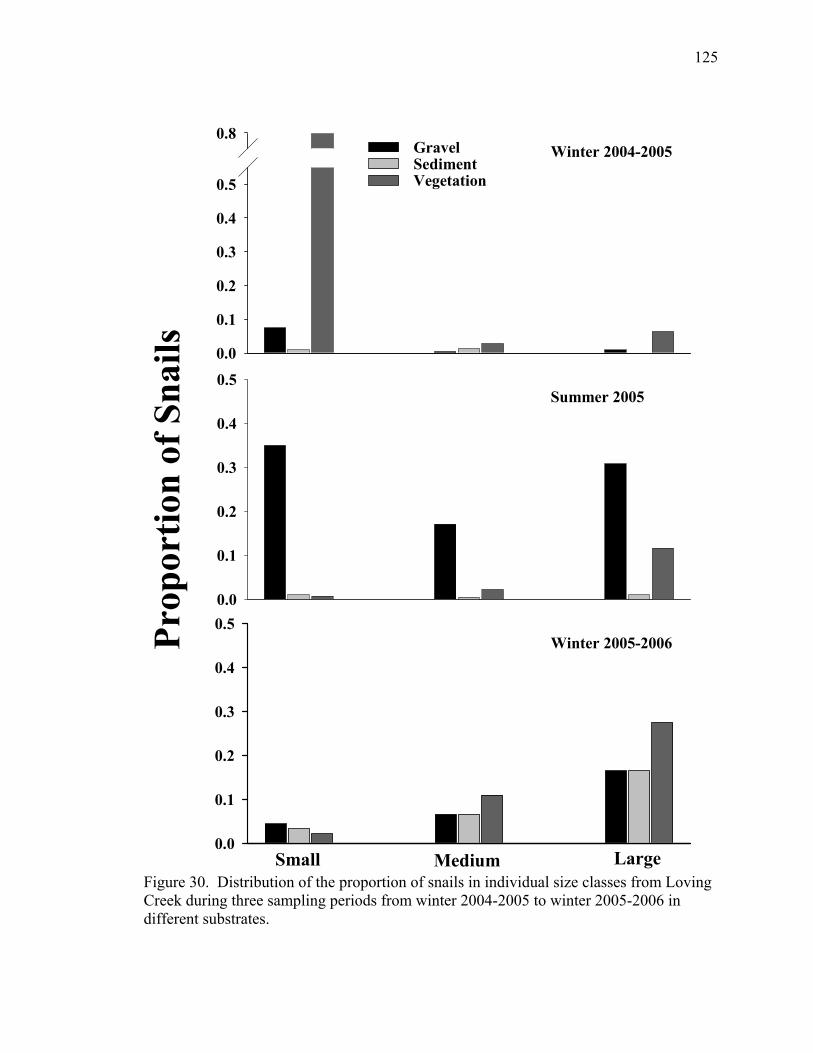
125
0.0
0.1
0.2
0.3
0.4
0.5
0.8
0.0
0.1
0.2
0.3
0.4
0.5
0.0
0.1
0.2
0.3
0.4
0.5
GravelSedimentVegetation
Prop
ortio
n of
Sna
ils
Small Medium Large
Winter 2004-2005
Summer 2005
Winter 2005-2006
Figure 30. Distribution of the proportion of snails in individual size classes from Loving Creek during three sampling periods from winter 2004-2005 to winter 2005-2006 in different substrates.

126
0.0
0.1
0.2
0.3
0.4
0.5
0.0
0.1
0.2
0.3
0.4
0.5
0.0
0.1
0.2
0.3
0.4
0.5
Prop
ortio
n of
Sna
ils
Small Medium Large
GravelSedimentVegetation
0.000
0.002
0.004
Winter 2004-2005
Summer 2005
Winter 2005-2006
Figure 31. Distribution of the proportion of snails in individual size classes from Riley Creek during three sampling periods from winter 2004-2005 to winter 2005-2006 in different substrates. The right y-axis in the winter 2004-2005 pane is scaled for large snails only.

127
Shell Length (mm)
1.5 2.0 2.5 3.0 3.5 4.0 4.5 5.0 5.5
# of
Em
bryo
s^(1/
2)
0
1
2
3
4
5
6
7Riley Cr.Loving Cr.
Figure 32. Simple linear regression and 95% C.I. of the number of embryos per brood vs.
shell length for snails from Riley and Loving Creek during the winter of 2004-2005.

128
Shell Length (mm)
2.0 2.5 3.0 3.5 4.0 4.5 5.0 5.5
# of
Em
bryo
s^(1/
2)
0
2
4
6
8
10
Riley Cr.Loving Cr.
Figure 33. Simple linear regression and 95% C.I. of the number of embryos per brood vs. shell length for snails from Riley and Loving Creek during the summer of 2005.

129
Shell Length (mm)
2.0 2.5 3.0 3.5 4.0 4.5 5.0 5.5
# of
Em
bryo
s^(1/
2)
0
2
4
6
8
10
Riley Cr.Loving Cr.
Figure 34. Simple linear regression and 95% C.I. of the number of embryos per brood vs. shell length for snails from Riley and Loving Creek during the winter of 2005-2006.

130
Appendix A. Nutrient levels recorded in Riley Creek below Hagerman National Fish Hatchery (HNFH) and throughout the Silver Creek drainage by various resource agencies. Nr denotes measurements not recorded.
Location Date Collector Total Phosphate
(mg/L) Ortho-phosphate
(mg/L) Nitrate (mg/L)
Riley Cr. (HNFH) Sep-1975 IDEQ 0.06 0.00326 0.77 Dec-1975 IDEQ 0.18 0.04238 0.69 Mar-1976 IDEQ 0.14 0.0163 0.60 Jun-1976 IDEQ 0.11 0.02282 0.65 May-1991 HNFH 0.11 Nr 0.63 Sep-1991 HNFH 0.08 Nr 0.68 Dec-1991 HNFH 0.24 Nr 0.92 Mar-1992 HNFH 0.45 Nr 0.83 Jan-2005 UofI Nr 0.025 0.83 Jan-2006 UofI Nr 0.0345 0.945 Thomson Cr. (Silver Cr. tributary) May-1975 IDEQ 0.02 0.02282 0.66 Oct-1975 IDEQ 0.14 0.00652 0.76 Silver Creek Sportsmen’s Access Jan-1976 IDHW 0.17 Nr 0.90 May-1976 IDHW 0.03 Nr Nr Oct-1976 IDHW 0.00 Nr 0.55 May-1977 IDHW 0.02 Nr 0.36 Loving Creek (HSFH) Jan-2005 UofI Nr 0.018 1.4 Jan-2006 UofI Nr 0.016 1.4