potassium management in virginia cotton · studies evaluating potassium response in cotton 1)...
TRANSCRIPT
Potassium Management in Virginia Cotton
DR. HUNTER FRAME
MARCH 16,2017
VA TECH T IDEWATER AREC
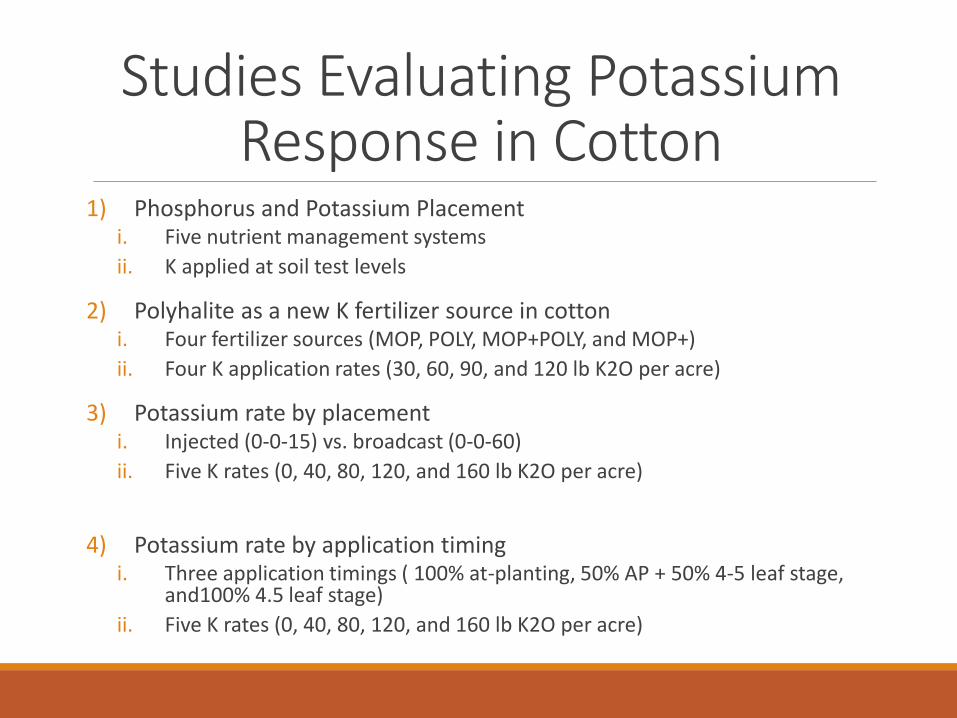
Studies Evaluating Potassium Response in Cotton
1) Phosphorus and Potassium Placementi. Five nutrient management systems
ii. K applied at soil test levels
2) Polyhalite as a new K fertilizer source in cottoni. Four fertilizer sources (MOP, POLY, MOP+POLY, and MOP+)
ii. Four K application rates (30, 60, 90, and 120 lb K2O per acre)
3) Potassium rate by placementi. Injected (0-0-15) vs. broadcast (0-0-60)
ii. Five K rates (0, 40, 80, 120, and 160 lb K2O per acre)
4) Potassium rate by application timingi. Three application timings ( 100% at-planting, 50% AP + 50% 4-5 leaf stage,
and100% 4.5 leaf stage)
ii. Five K rates (0, 40, 80, 120, and 160 lb K2O per acre)
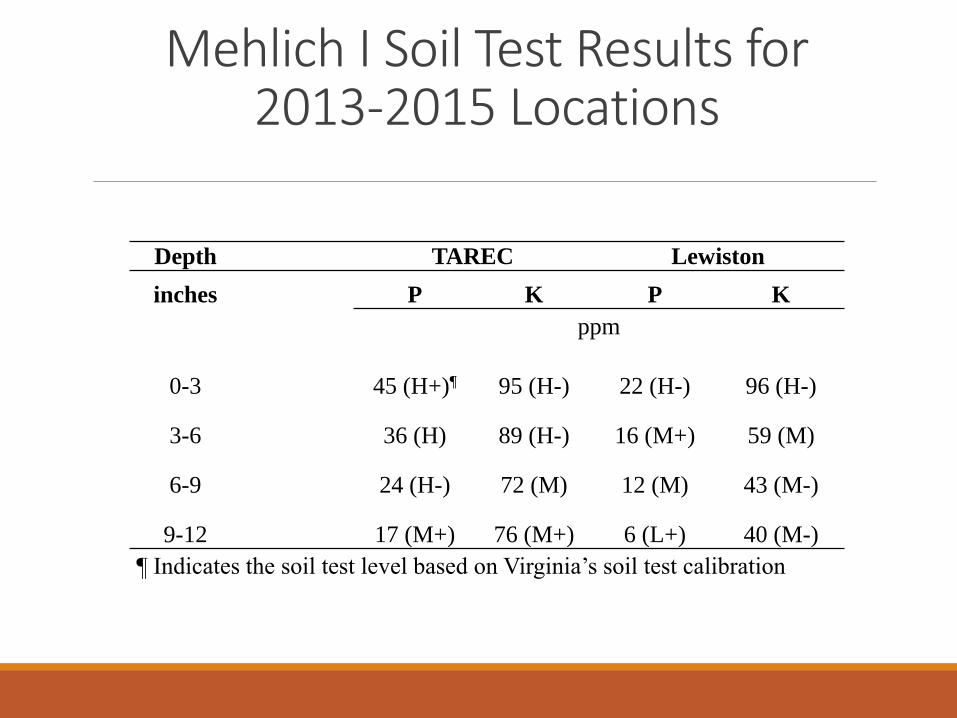
Mehlich I Soil Test Results for 2013-2015 Locations
Depth TAREC Lewiston
inches P K P K
ppm
0-3 45 (H+)¶ 95 (H-) 22 (H-) 96 (H-)
3-6 36 (H) 89 (H-) 16 (M+) 59 (M)
6-9 24 (H-) 72 (M) 12 (M) 43 (M-)
9-12 17 (M+) 76 (M+) 6 (L+) 40 (M-)
¶ Indicates the soil test level based on Virginia’s soil test calibration
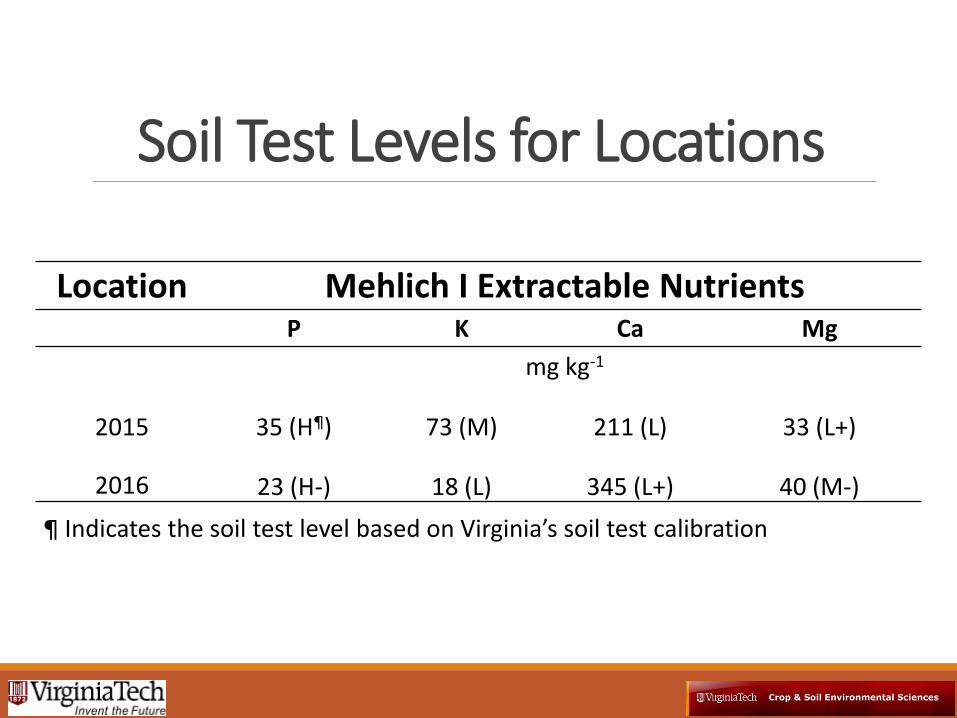
Soil Test Levels for Locations
Location Mehlich I Extractable NutrientsP K Ca Mg
mg kg-1
2015 35 (H¶) 73 (M) 211 (L) 33 (L+)
2016 23 (H-) 18 (L) 345 (L+) 40 (M-)
¶ Indicates the soil test level based on Virginia’s soil test calibration

2015 Change in Soil Test Potassium
Potassium Application Rate (lb K2O ac
-1)
0 30 60 90 120
Meh
lich
I Ext
ract
able
Pot
assiu
m (l
b K 2O
ac-1
)
-40
-30
-20
-10
0
10
20
30MOP
Polyhalite
50% MOP / 50% Polyhalite
MOP +
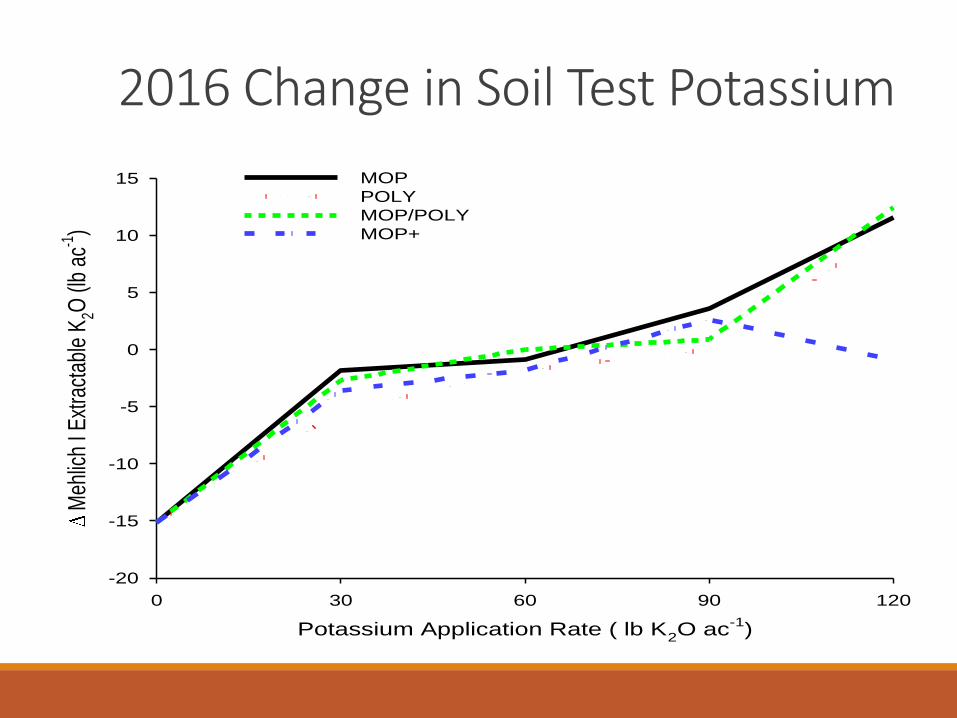
2016 Change in Soil Test Potassium
Potassium Application Rate ( lb K2O ac
-1)
0 30 60 90 120
Meh
lich
I Ext
ract
able
K2O
(lb
ac-1
)
-20
-15
-10
-5
0
5
10
15 MOP
POLY
MOP/POLY
MOP+
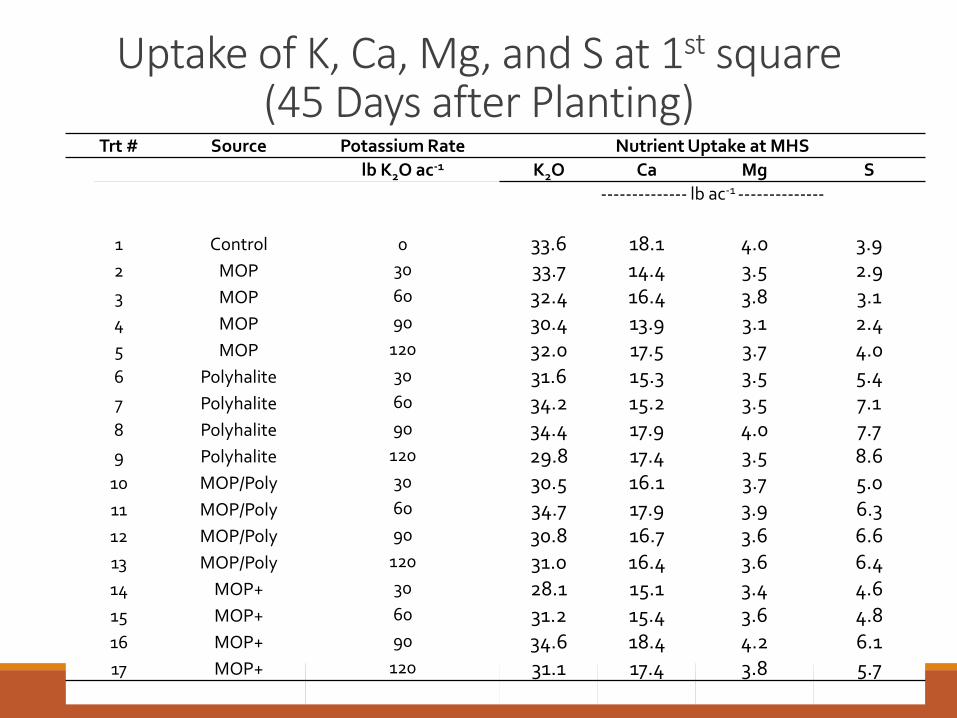
Uptake of K, Ca, Mg, and S at 1st square(45 Days after Planting)
Trt # Source Potassium Rate Nutrient Uptake at MHS
lb K2O ac-1 K2O Ca Mg S
-------------- lb ac-1 --------------
1 Control 0 33.6 18.1 4.0 3.92 MOP 30 33.7 14.4 3.5 2.93 MOP 60 32.4 16.4 3.8 3.14 MOP 90 30.4 13.9 3.1 2.45 MOP 120 32.0 17.5 3.7 4.06 Polyhalite 30 31.6 15.3 3.5 5.47 Polyhalite 60 34.2 15.2 3.5 7.18 Polyhalite 90 34.4 17.9 4.0 7.79 Polyhalite 120 29.8 17.4 3.5 8.6
10 MOP/Poly 30 30.5 16.1 3.7 5.011 MOP/Poly 60 34.7 17.9 3.9 6.312 MOP/Poly 90 30.8 16.7 3.6 6.613 MOP/Poly 120 31.0 16.4 3.6 6.414 MOP+ 30 28.1 15.1 3.4 4.615 MOP+ 60 31.2 15.4 3.6 4.816 MOP+ 90 34.6 18.4 4.2 6.117 MOP+ 120 31.1 17.4 3.8 5.7
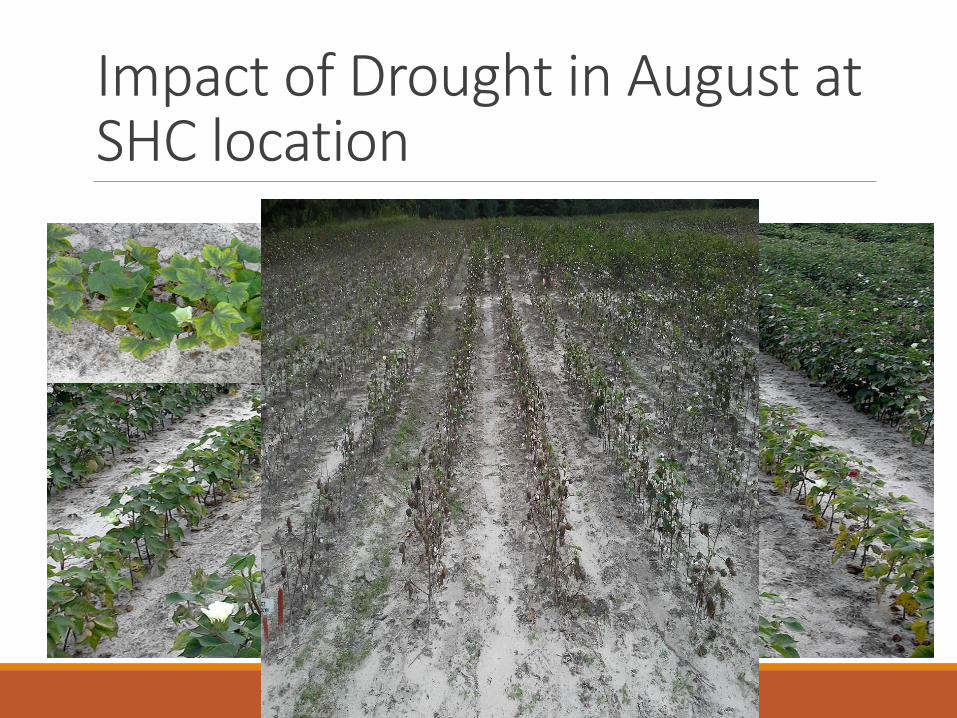
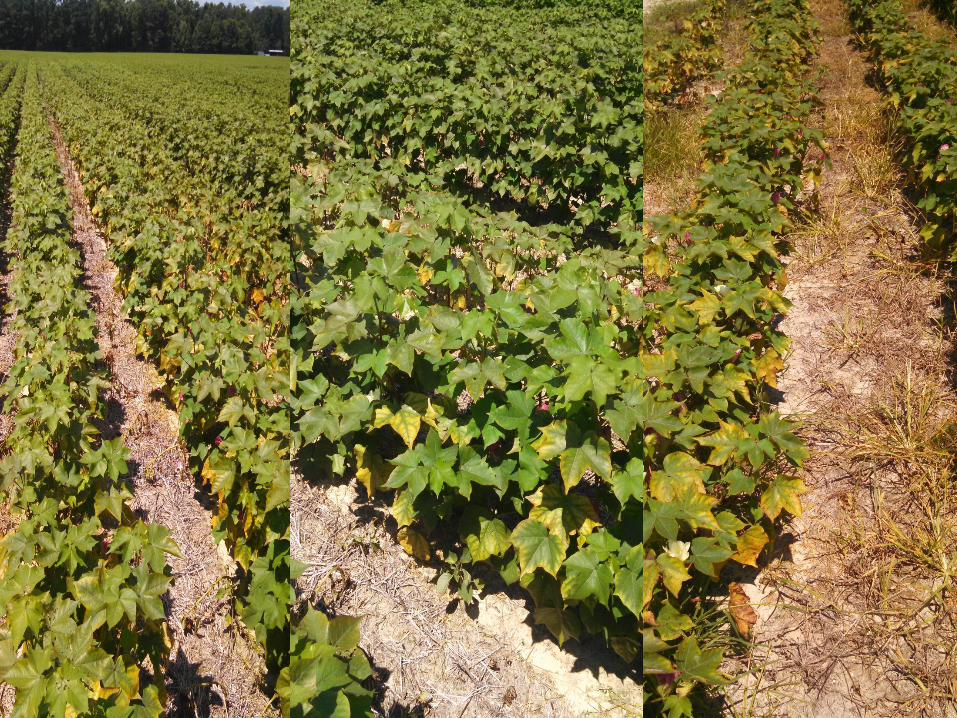
Impact of Drought in August at SHC location
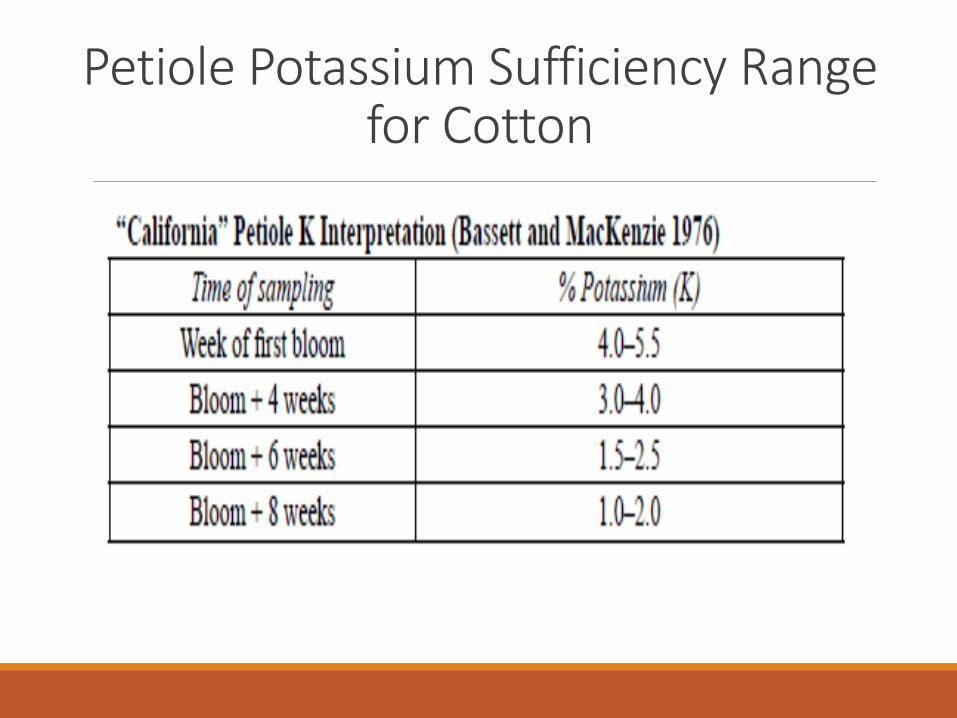
Petiole Potassium Sufficiency Range for Cotton
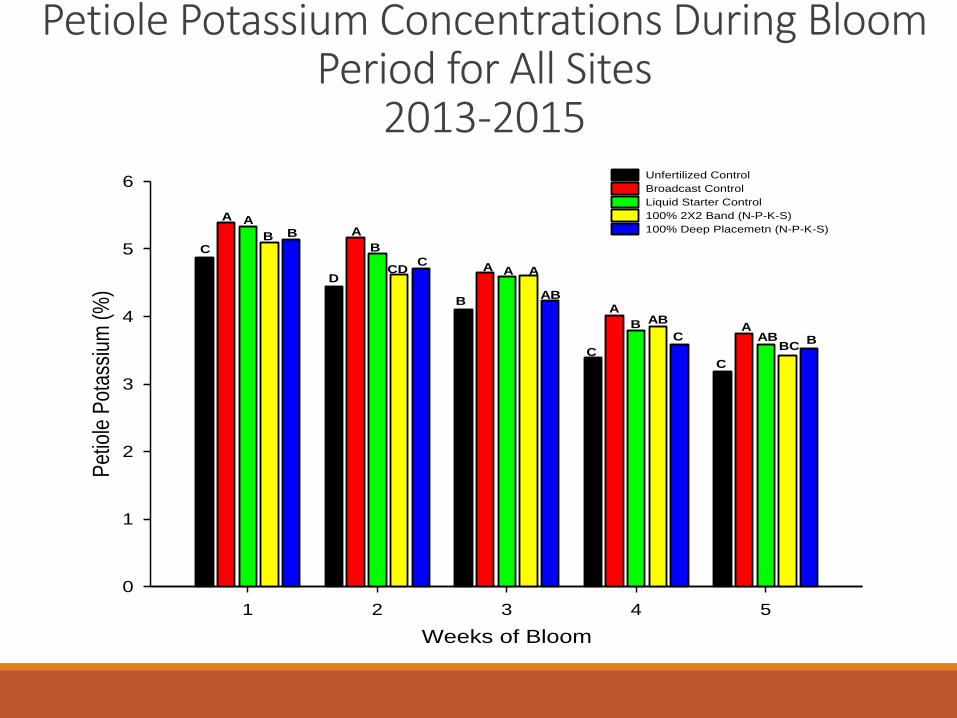
Petiole Potassium Concentrations During Bloom Period for All Sites
2013-2015
Weeks of Bloom
1 2 3 4 5
Pet
iole
Pot
assi
um (
%)
0
1
2
3
4
5
6Unfertilized Control
Broadcast Control
Liquid Starter Control
100% 2X2 Band (N-P-K-S)
100% Deep Placemetn (N-P-K-S)
A
B B
C
A
B
CDC
D
A
B
AAA
AB
A
BC
C
AB
C
AAB
BCB
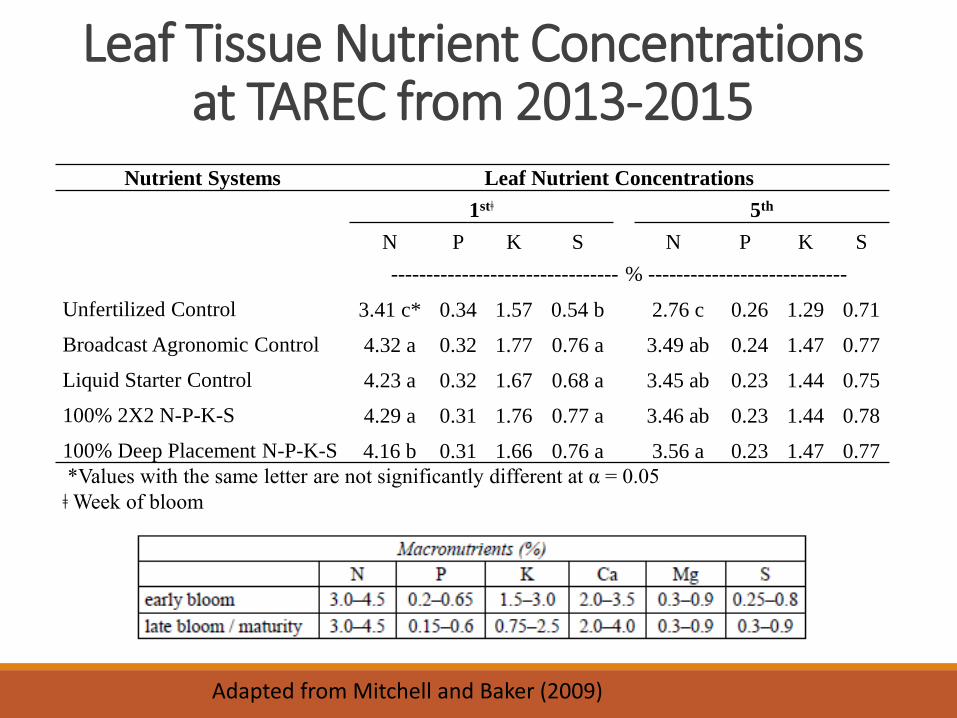
Leaf Tissue Nutrient Concentrations at TAREC from 2013-2015
Nutrient Systems Leaf Nutrient Concentrations
1stǂ 5th
N P K S N P K S
-------------------------------- % ----------------------------
Unfertilized Control 3.41 c* 0.34 1.57 0.54 b 2.76 c 0.26 1.29 0.71
Broadcast Agronomic Control 4.32 a 0.32 1.77 0.76 a 3.49 ab 0.24 1.47 0.77
Liquid Starter Control 4.23 a 0.32 1.67 0.68 a 3.45 ab 0.23 1.44 0.75
100% 2X2 N-P-K-S 4.29 a 0.31 1.76 0.77 a 3.46 ab 0.23 1.44 0.78
100% Deep Placement N-P-K-S 4.16 b 0.31 1.66 0.76 a 3.56 a 0.23 1.47 0.77
*Values with the same letter are not significantly different at α = 0.05
ǂ Week of bloom
Adapted from Mitchell and Baker (2009)
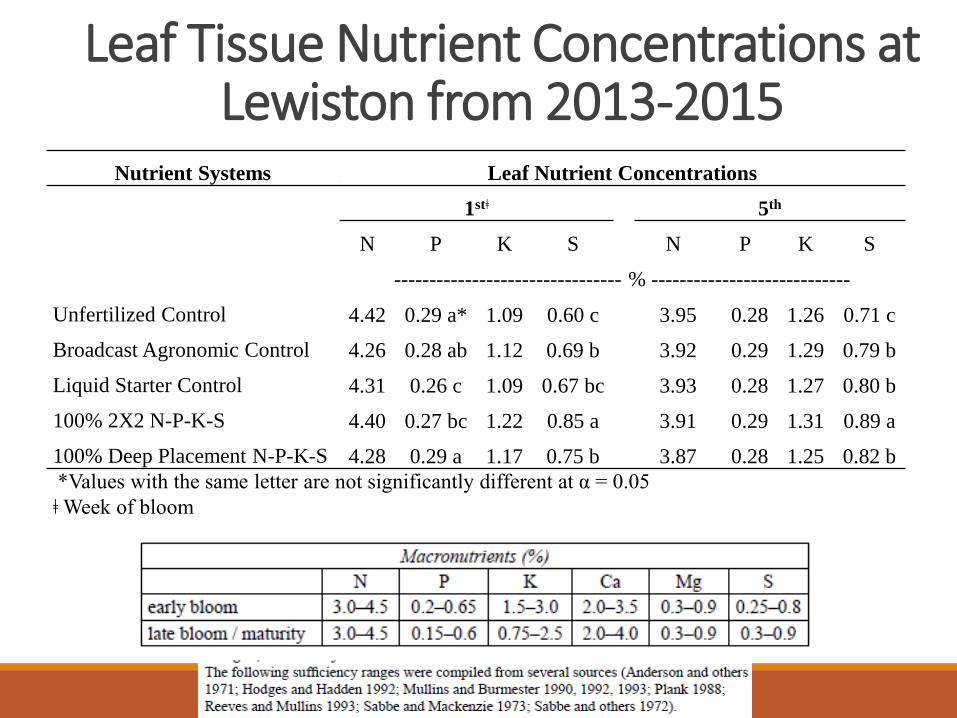
Leaf Tissue Nutrient Concentrations at Lewiston from 2013-2015
Nutrient Systems Leaf Nutrient Concentrations
1stǂ 5th
N P K S N P K S
-------------------------------- % ----------------------------
Unfertilized Control 4.42 0.29 a* 1.09 0.60 c 3.95 0.28 1.26 0.71 c
Broadcast Agronomic Control 4.26 0.28 ab 1.12 0.69 b 3.92 0.29 1.29 0.79 b
Liquid Starter Control 4.31 0.26 c 1.09 0.67 bc 3.93 0.28 1.27 0.80 b
100% 2X2 N-P-K-S 4.40 0.27 bc 1.22 0.85 a 3.91 0.29 1.31 0.89 a
100% Deep Placement N-P-K-S 4.28 0.29 a 1.17 0.75 b 3.87 0.28 1.25 0.82 b
*Values with the same letter are not significantly different at α = 0.05
ǂ Week of bloom
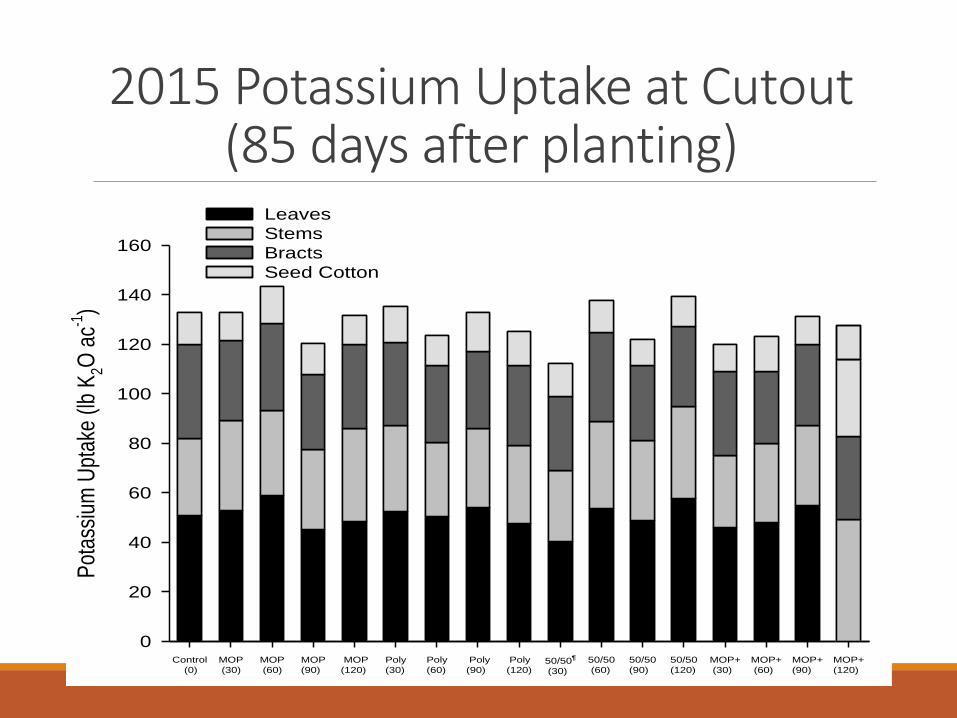
2015 Potassium Uptake at Cutout(85 days after planting)
Control
(0)
MOP
(30)
MOP
(60)
MOP
(90)
MOP
(120)
Poly
(30)
Poly
(60)
Poly
(90)
Poly
(120)50/50
(30)
50/50
(60)
50/50
(90)
50/50
(120)
MOP+
(30)
MOP+
(60)
MOP+
(90)
MOP+
(120)
Pot
assi
um U
ptak
e (lb
K2O
ac-1
)
0
20
40
60
80
100
120
140
160
Leaves
Stems
Bracts
Seed Cotton
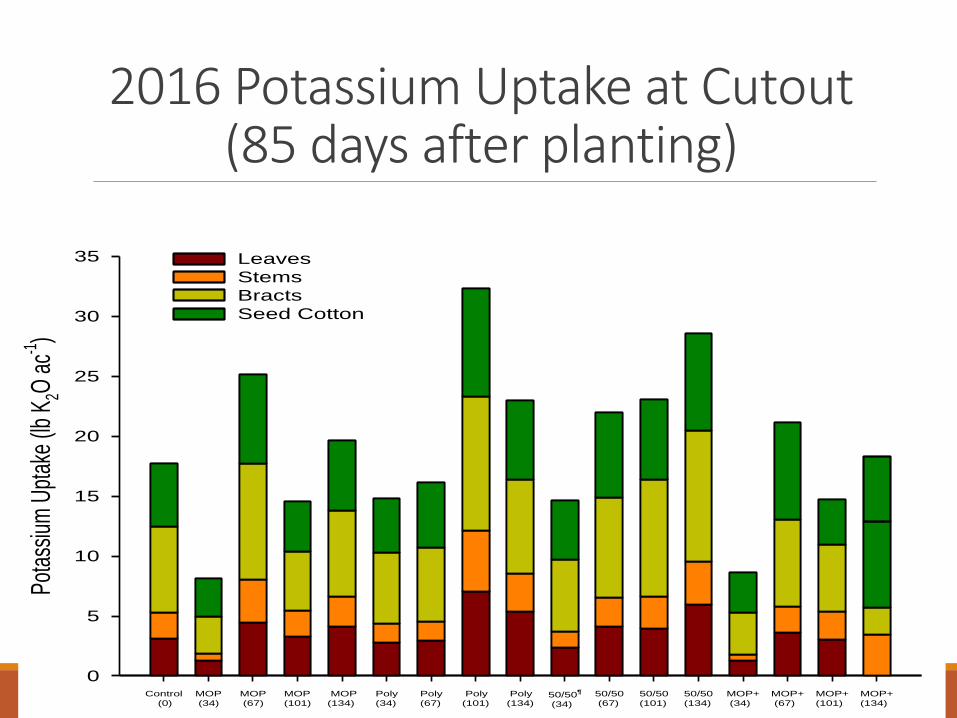
2016 Potassium Uptake at Cutout(85 days after planting)
Control
(0)
MOP
(34)
MOP
(67)
MOP
(101)
MOP
(134)
Poly
(34)
Poly
(67)
Poly
(101)
Poly
(134)50/50
(34)
50/50
(67)
50/50
(101)
50/50
(134)
MOP+
(34)
MOP+
(67)
MOP+
(101)
MOP+
(134)
Pota
ssiu
m U
ptak
e (lb
K2O
ac-1
)
0
5
10
15
20
25
30
35 Leaves
Stems
Bracts
Seed Cotton
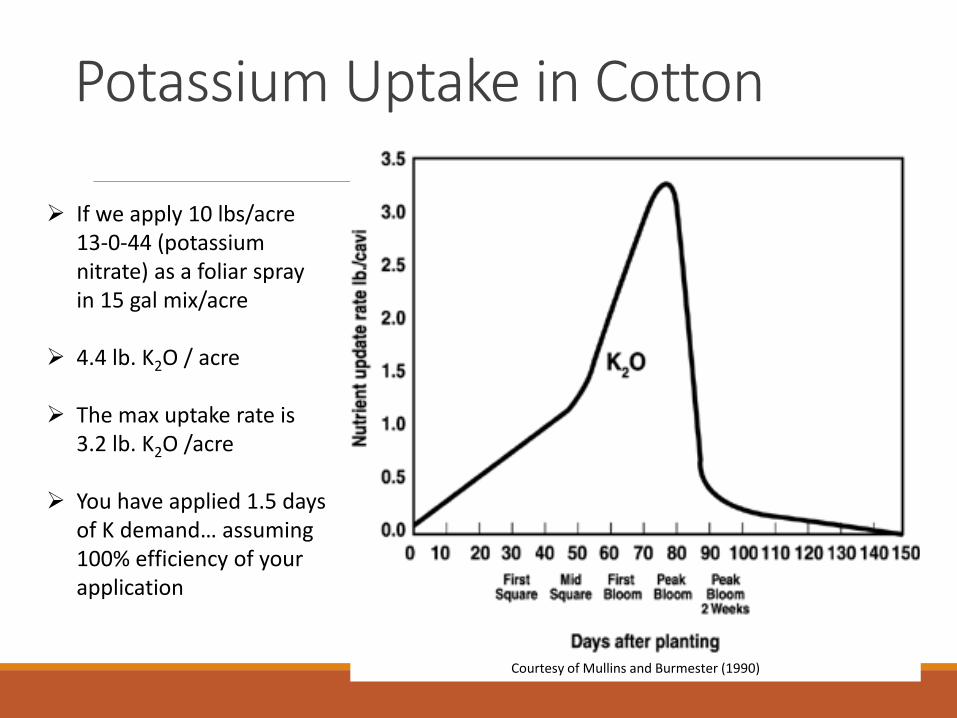
Potassium Uptake in Cotton
Courtesy of Mullins and Burmester (1990)
If we apply 10 lbs/acre 13-0-44 (potassium nitrate) as a foliar spray in 15 gal mix/acre
4.4 lb. K2O / acre
The max uptake rate is 3.2 lb. K2O /acre
You have applied 1.5 days of K demand… assuming 100% efficiency of your application
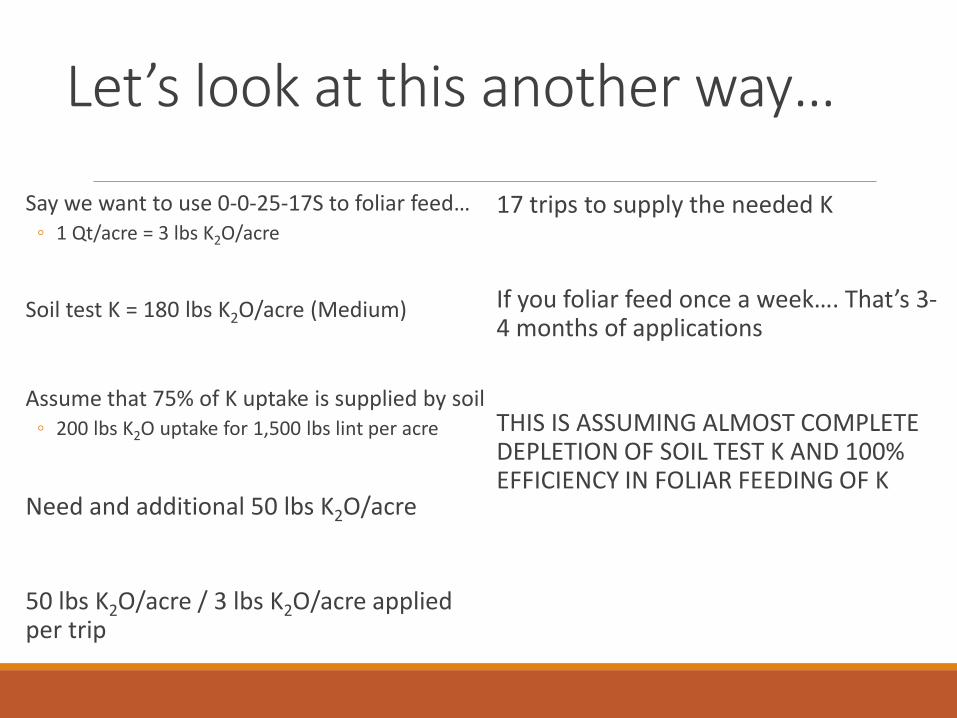
17 trips to supply the needed K
If you foliar feed once a week…. That’s 3-4 months of applications
THIS IS ASSUMING ALMOST COMPLETE DEPLETION OF SOIL TEST K AND 100% EFFICIENCY IN FOLIAR FEEDING OF K
Let’s look at this another way…
Say we want to use 0-0-25-17S to foliar feed…◦ 1 Qt/acre = 3 lbs K2O/acre
Soil test K = 180 lbs K2O/acre (Medium)
Assume that 75% of K uptake is supplied by soil◦ 200 lbs K2O uptake for 1,500 lbs lint per acre
Need and additional 50 lbs K2O/acre
50 lbs K2O/acre / 3 lbs K2O/acre applied per trip
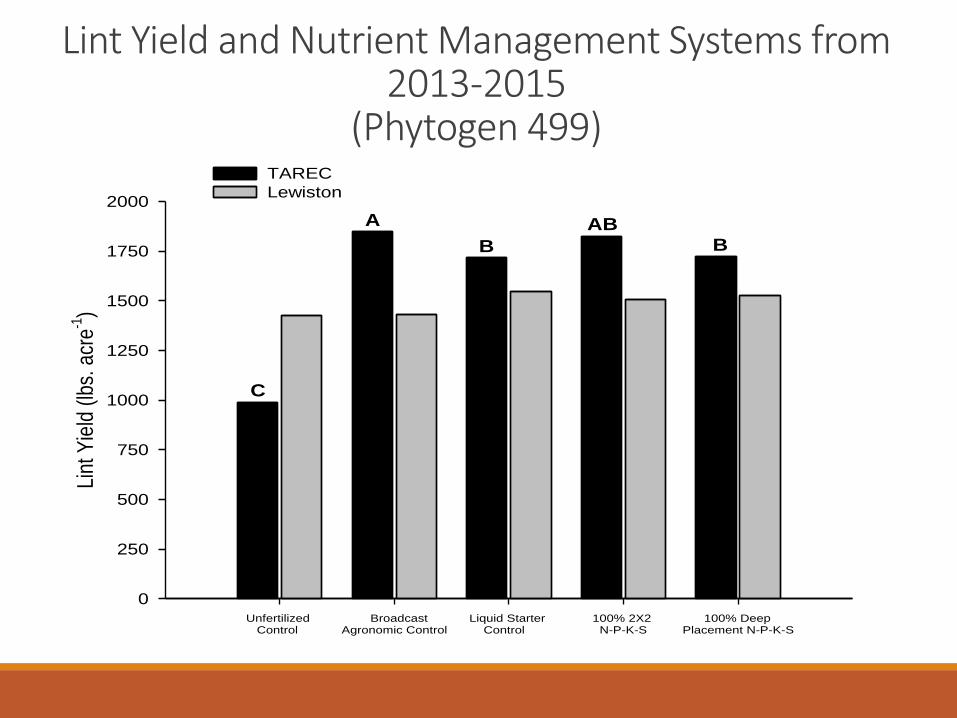
Lint Yield and Nutrient Management Systems from 2013-2015
(Phytogen 499)
Unfertilized Control
Broadcast Agronomic Control
Liquid Starter Control
100% 2X2 N-P-K-S
100% Deep Placement N-P-K-S
Lint
Yie
ld (
lbs.
acr
e-1)
0
250
500
750
1000
1250
1500
1750
2000
TAREC
Lewiston
C
A
B
AB
B
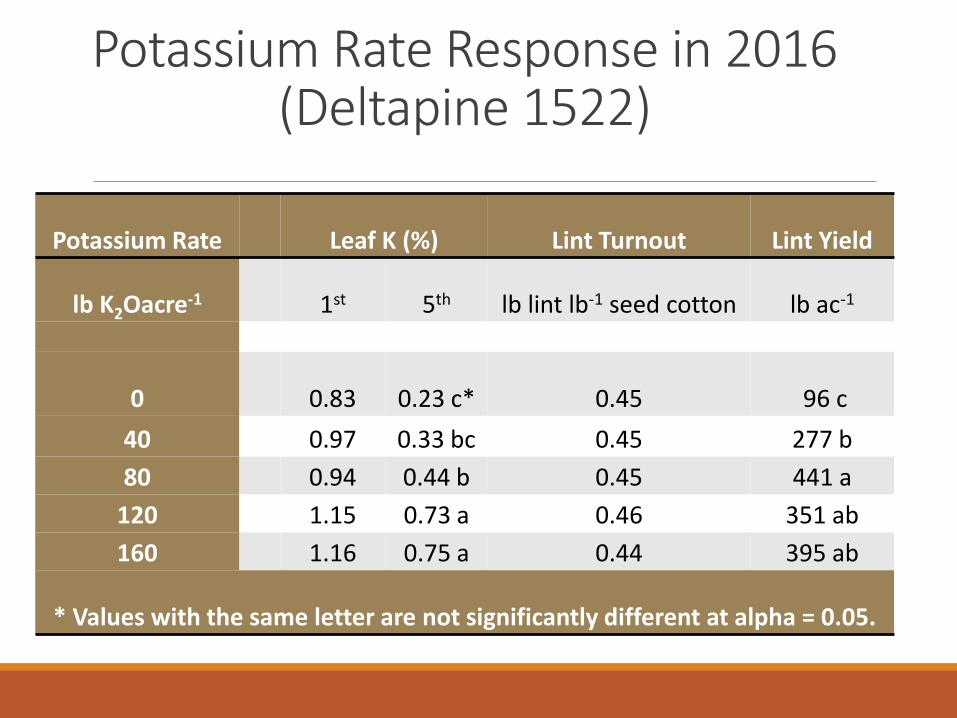
Potassium Rate Response in 2016(Deltapine 1522)
Potassium Rate Leaf K (%) Lint Turnout Lint Yield
lb K2Oacre-1 1st 5th lb lint lb-1 seed cotton lb ac-1
0 0.83 0.23 c* 0.45 96 c
40 0.97 0.33 bc 0.45 277 b
80 0.94 0.44 b 0.45 441 a
120 1.15 0.73 a 0.46 351 ab
160 1.16 0.75 a 0.44 395 ab
* Values with the same letter are not significantly different at alpha = 0.05.
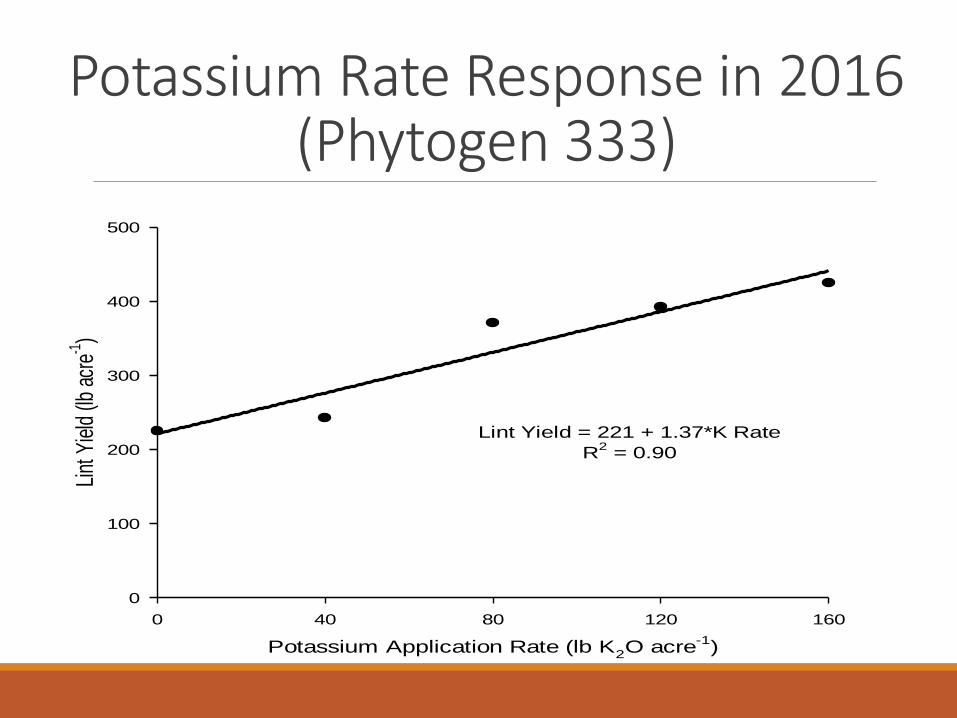
Potassium Rate Response in 2016(Phytogen 333)
Potassium Application Rate (lb K2O acre
-1)
0 40 80 120 160
Lint
Yie
ld (l
b ac
re-1
)
0
100
200
300
400
500
Lint Yield = 221 + 1.37*K Rate
R2 = 0.90
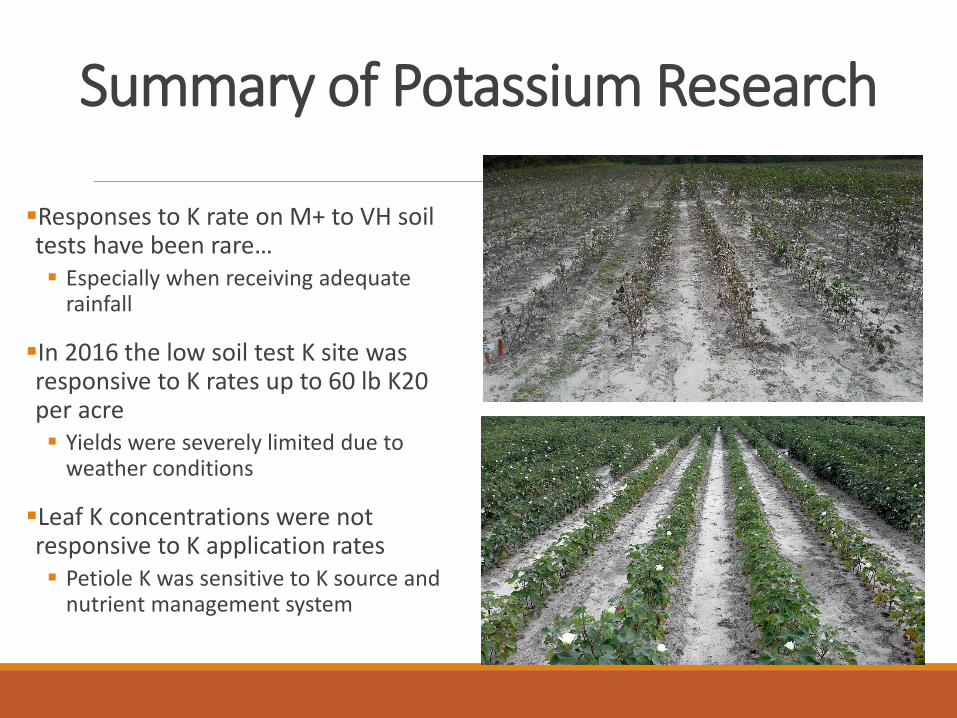
Summary of Potassium Research
Responses to K rate on M+ to VH soil tests have been rare… Especially when receiving adequate
rainfall
In 2016 the low soil test K site was responsive to K rates up to 60 lb K20 per acre Yields were severely limited due to
weather conditions
Leaf K concentrations were not responsive to K application rates Petiole K was sensitive to K source and
nutrient management system
Summary of Potassium Research (cont.)
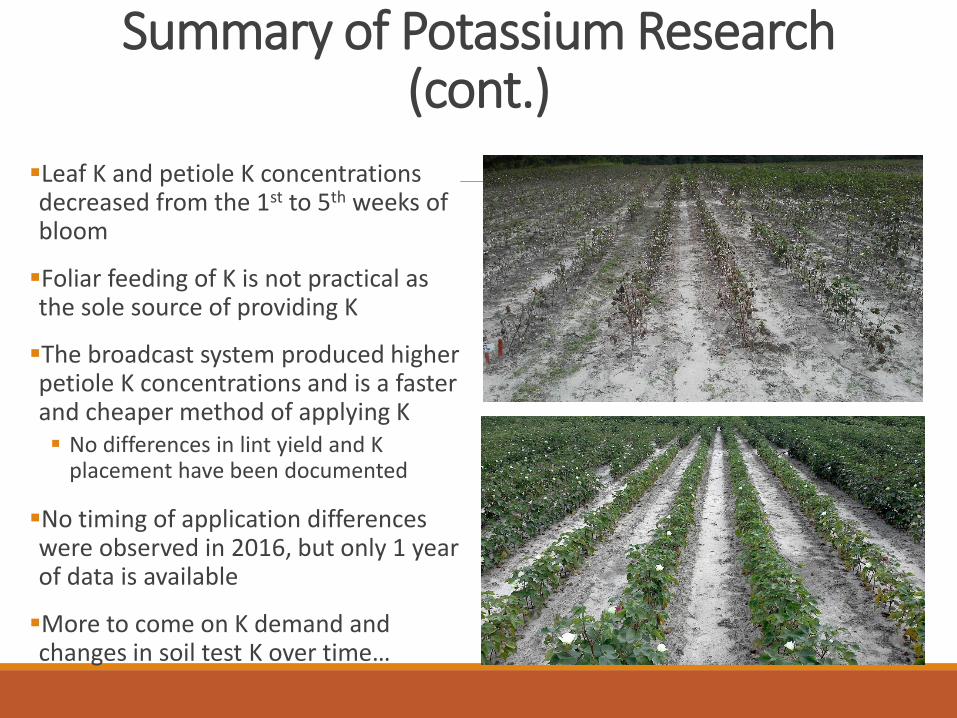
Leaf K and petiole K concentrations decreased from the 1st to 5th weeks of bloom
Foliar feeding of K is not practical as the sole source of providing K
The broadcast system produced higher petiole K concentrations and is a faster and cheaper method of applying K No differences in lint yield and K
placement have been documented
No timing of application differences were observed in 2016, but only 1 year of data is available
More to come on K demand and changes in soil test K over time…