potassium & potassium managementsoils.wisc.edu/extension/materials/k_mgmt.pdf · potassium...
TRANSCRIPT

Potassium &
Potassium Management
Carrie Laboski
Department of Soil Science
UW- Madison

Havlin et al., 2001
Potassium Cycle

K release during mineral
weathering
Recolored from Fig. 6.9 in Havlin et al. (1999)

Exchangeable vs.
Non-exchangeable K
Exchangeable K
Readily buffers
soil solution K
Non-Exchangeable K
Slowly buffers
soil solution KSoil tests measure exchangeable K
Factors Influencing
Exchangeable K
Wetting/drying
Freeze/thaw
Oxidation state of Fe

Wetting/Drying
Exchangeable K can increase or decrease when soil is dried Is dependent upon the clay minerals present
K fixation can occur Soils with high exchangeable K or recent K fertilizer
applications are dried
Fixation is a result of K becoming trapped within clay sheets as they dry and collapse
K release can occur Soils low in exchangeable K are dried
The clay sheets roll back and release K

Wetting/Drying
Net effect depends on whether fixation or
release dominates
Time of soil sampling in relation to field
wetting and drying cycles may influence soil
test K levels
Freeze/Thaw
Fixed K released with freeze/thaw
Soils with considerable amount of mica
K release/fixation not impacted by freeze/thaw
Soils with smaller amounts of mica & greater amounts of
exchangeable K
STK may be different in spring v. fall
Depending on clay minerals present & winter weather
conditions
Oxidation State of Fe
Fe structural component in clay minerals
Fe has different oxidation states Fe3+ - oxidized
Fe2+ - reduced
In smectites, as Fe3+ → Fe2+, K is fixed
In illite, as Fe3+ → Fe2+, K is released
In soils containing both illite & smectite, net effect of fixation/release depends on which clay mineral dominates

Clay Minerals in WI
Composition of clay
minerals varies
Environmental impacts
on STK may vary
differently depending
upon region
C. Stiles, personal communication (2004)
What does a soil test
measure?
Soil test K measures:
K in soil solution
Exchangeable K
Seasonal variation in soil test K is known to
exist
Sample at about same time each year to minimize
this factor

Interpreting soil test K results
Medium & fine soils Course textured soils†
Crop Optimum No response Optimum No response
------------------- Soil Test K (ppm) -------------------
Alfalfa 91 – 120 > 170 81 - 120 > 180
Corn 81 – 100 > 140 66 – 90 > 130
Soybean 81 – 100 > 140 60 – 80 > 120
† Not irrigated

Environmental Factors Affecting K
Availability to a Plant
Soil moisture
Low soil moisture results in more tortuous path for K diffusion – takes longer to get to root
Increasing K levels or soil moisture will increase K diffusion
Increase soil moisture from 10 to 28 % can increase toatl K transport by up to 175 %
Soil Aeration
High moisture results in restricted root growth, low O2 and slowed K absorption by the root
78 % of K
supplied
to root via
diffusion

Environmental Factors Affecting K
Availability to a Plant
Soil temperature
Low temperature restricts plant growth and rate of K
uptake
Providing high K levels will increase K uptake at low
temperatures
Reason for positive response to banded starter
Soil pH
At low pH, K has more competition for CEC sites
As soils are limed, greater amount of K can be held on
CEC and K leaching reduced.

Environmental Factors Affecting K
Availability to a Plant
Leaching
K leaching can occur on course textured or muck
soils particularly if irrigated
Large fall K applications to sandy or muck soils
discouraged

K Sources

K Sources – Inorganic
FertilizerChemical
Formula
Fertilizer
Analysis
Salt
Index
Potassium chloride
(muriate of potash)KCl
0-0-60 to
0-0-62116
Potassium
magnesium sulfateK2SO42MgSO4 0-0-22 43
Potassium nitrate KNO3 13-0-44 74
Potassium sulfate K2SO4 0-0-50 46

Red v. White Potash
Both mined KCl
Red potash produced by floatation, 0-0-60
White potash produced by recrystallization, 0-
0-62
Color due to Fe and Mn impurities
Use white for liquids
No agronomic difference

K Sources - Organic
Break down of crop residue
Manures
Majority of K is soluble
80 % of total K in manure available the year of application
10 % of total K is available 2nd year after application
5 % of total K is available 3nd year after application
Book values
Dairy solid – 9 lb K2O/ton
Dairy liquid – 20 lb K2O/1000 gal
Biosolids

K Management

K Management in WI
Many soils deficient Particularly alfalfa rotation
K important in reduced tillage
More liquid (low K) starter used
Topdress K used as insurance
Excessive K in some forages
Timing relatively unimportant

0
70
140
210
280
350
Average interactions of soil test K levels and topdressed K2O rate on alfalfa yields, Arlington, WI, 1994-1997
Annual K2O Rate
(lb/acre)
Initial soil test K (ppm)
2
2.5
3
4
3.5
69 75 85 126 166
To
tal Y
ield
(to
n/
acre)
Kelling, WI

0
5
10
15
20
25
30
35
< 5 t 19 t
YIE
LD
RE
SP
ON
SE
(b
u/a
)
OPTIMUM
V. HIGH
Response of corn to row-applied K on a silty clay loam soil (3 yr. avg.)
Oshkosh, Wis. (45 lb K20/a)Wolkowski, WI

Broadcast vs. Band
K2O applied Placement Corn Yield
(lb/acre) (bu/acre)
0 - 114
40 Starter (band) 143
100 Broadcast 136
200 Broadcast 141
Soil test (0-6”) = 85 ppm; considered medium (optimum)
Goodhue County, Minnesota
From Rehm & Schmitt, 1997

Tillage and K Placement

Importance of K in Starter
Fertilizers
Response to deep-banded K at high soil tests
Ridge-till and no-till
More frequent starter response at soil test K
< 140 ppm
Offset soil compaction effects
Restricted root volume
Poor aeration – limited K uptake
More consistent starter response

Soil test K (ppm)
Tillage 50-60 100-145 145-190
------- Response, bu/acre -------
Ridge-till 45 12 3
Chisel 13 7 8
Moldbrd. 20 5 7
Moncrief & Schulte; 8-48-12 starter fert.
Arlington, WI
Effect of tillage and soil test K on
corn response to starter fertilizer

Corn yield advantage of deep-
banded K over broadcast or
planter-band K
Tillage System Advantage
bu/acre
Ridge-till 8
No-till 4-5
Chisel-disk 2
Mallarino, Iowa

Initial soil test K was v. high
Wolkowski, WI
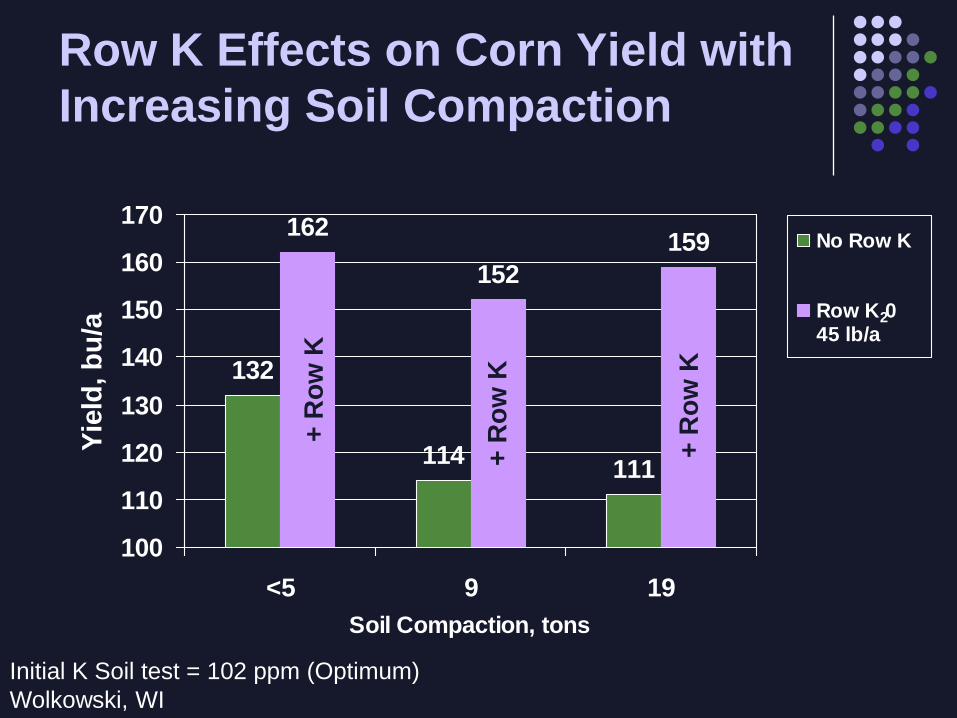
Row K Effects on Corn Yield with
Increasing Soil Compaction
132
114111
162
152
159
100
110
120
130
140
150
160
170
<5 9 19
Soil Compaction, tons
Yie
ld, b
u/a
No Row K
Row K 0 45 lb/a
+ R
ow
K
+ R
ow
K
+ R
ow
K
2
Initial K Soil test = 102 ppm (Optimum)
Wolkowski, WI

Effect of K Source
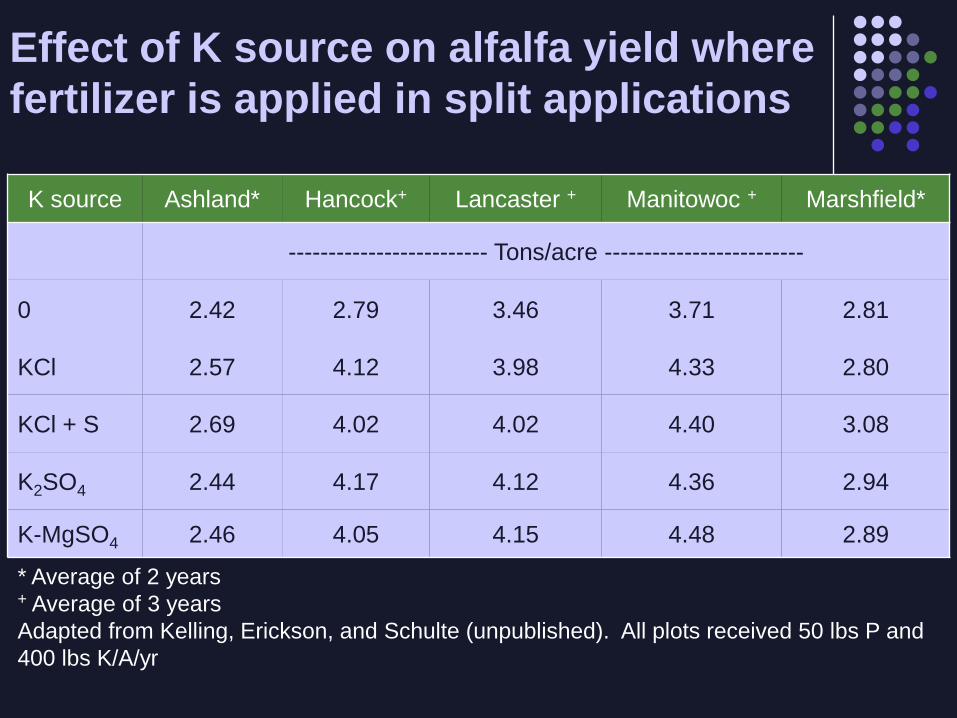
Effect of K source on alfalfa yield where
fertilizer is applied in split applications
K source Ashland* Hancock+ Lancaster + Manitowoc + Marshfield*
------------------------- Tons/acre -------------------------
0 2.42 2.79 3.46 3.71 2.81
KCl 2.57 4.12 3.98 4.33 2.80
KCl + S 2.69 4.02 4.02 4.40 3.08
K2SO4 2.44 4.17 4.12 4.36 2.94
K-MgSO4 2.46 4.05 4.15 4.48 2.89
* Average of 2 years+ Average of 3 years
Adapted from Kelling, Erickson, and Schulte (unpublished). All plots received 50 lbs P and
400 lbs K/A/yr

K Source Conclusions
If difference observed, likely due to associated ions
No difference observed for most uses
Salt or Cl ion problems avoided by splitting applications of rate more than 400-500 lbs/A
Price, availability, & need for associated ion should determine which used

Timing Questions
Preplant versus topdress?
Frequency of topdress?
Time of year to topdress?
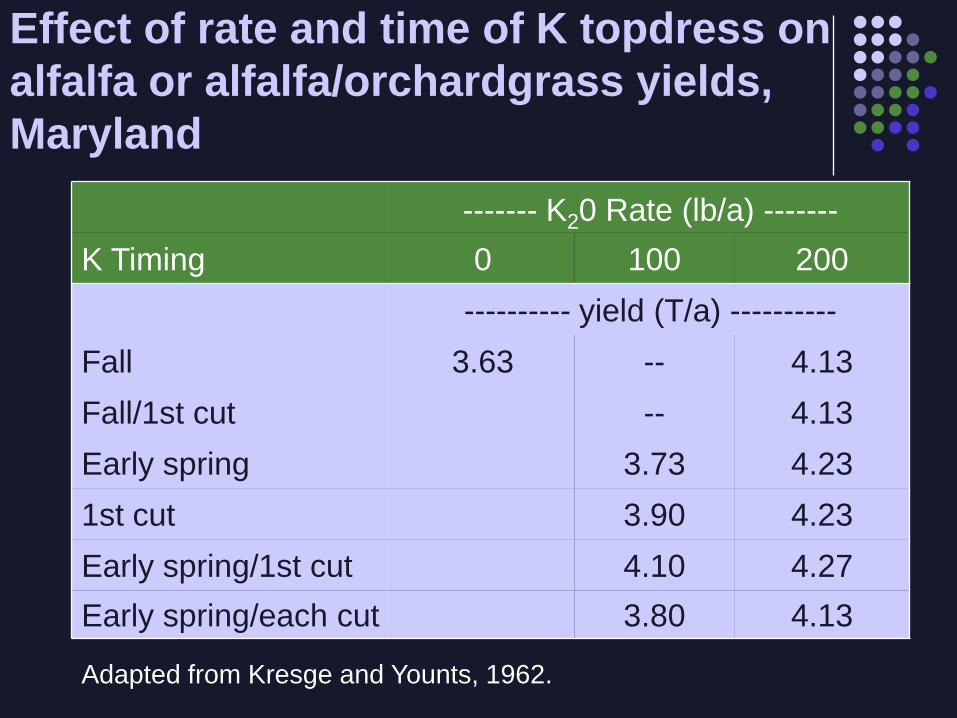
Effect of rate and time of K topdress on
alfalfa or alfalfa/orchardgrass yields,
Maryland
------- K20 Rate (lb/a) -------
K Timing 0 100 200
---------- yield (T/a) ----------
Fall 3.63 -- 4.13
Fall/1st cut -- 4.13
Early spring 3.73 4.23
1st cut 3.90 4.23
Early spring/1st cut 4.10 4.27
Early spring/each cut 3.80 4.13
Adapted from Kresge and Younts, 1962.

Alfalfa response to time of
topdress application
Applic.
Time 1994 1995 1996 1997
--------------- T/a DM ------------------
Greenup 4.33 4.16 3.06 2.53
1st cut 4.46 4.35 3.17 2.65
3rd cut 4.48 4.27 3.06 2.47
1st & 3rd 4.44 4.35 3.08 2.61
Pr>F * 0.20 0.78 0.33
*Interaction between time and source significant at Pr>0.10
Arlington, averaged across 2 soil test K levels and 2 K sources

Interaction between K source and
application time, responsive years
only
Application KCl + S K2SO4
--------- T/a DM -----------
Greenup 4.10 4.34
1st cut 4.31 4.48
3rd cut 4.27 4.48
1st & 3rd 4.44 4.34
Average 1994-1995 across 2 soil K levels, Arlington

Consider the cow
Forage K levels > 3% can cause milk
fever and other anion balance problems
particularly for early-lactation cows

1.4
1.5
1.6
1.7
1.8
The average effect of soil test K and topdressed K2O on third cutting forage cation concentrations, Arlington, WI 1994-1997
Initial soil test K level (ppm)
0.55
69 75 85 126 166
0.50
0.45
0.40
0.35
0.30
2.0
2.5
3.0
3.5
4.0
4.5
Annual K2O rate (lb/a)
Average K rate
0
70
140
210
280
350
Forage K Conc.
(%)
Forage Ca Conc.
(%)
Forage Mg Conc.
(%)
Kelling, WI

Rominger et al., 1975
Stems - fertilized
Stems - unfertilized
Leaves - fertilized
Leaves - unfertilized

Baker and Reid, 1977

Ways to reduce tissue K
Soil test
Apply K only where needed
Credit manure K
Clip low – retain leaves
Cut later
Allow K to drop on some fields
Segregate low K forages for dry cows/heifers

Potassium BMP’s
Use soil test to guide K need
Wisconsin recommendations call for 15 to 25
lb K20 with high K soil
Consider complete starter
Avoid excessive build-up; distribute manure
Avoid fall applications on sands and mucks
Topdress as needed

UW Department of
Soil Science
http://www.soils.wisc.edu/extension