potential cost-effective opportunities for methane ... energy analysis, ... catalytic combustion:...
TRANSCRIPT

The Joint Institute for Strategic Energy Analysis is operated by the Alliance for Sustainable Energy, LLC, on behalf of the U.S. Department of Energy’s National Renewable Energy Laboratory, the University of Colorado-Boulder, the Colorado School of Mines, the Colorado State University, the Massachusetts Institute of Technology, and Stanford University.
Contract No. DE-AC36-08GO28308
Potential Cost-Effective Opportunities for Methane Emission Abatement Ethan Warner1, Daniel Steinberg1, Elke Hodson2, and Garvin Heath1
1 Joint Institute for Strategic Energy Analysis 2 U.S. Department of Energy, Office of Energy Policy and Systems Analysis
Technical Report NREL/TP-6A50-62818 August 2015

The Joint Institute for Strategic Energy Analysis is operated by the Alliance for Sustainable Energy, LLC, on behalf of the U.S. Department of Energy’s National Renewable Energy Laboratory, the University of Colorado-Boulder, the Colorado School of Mines, the Colorado State University, the Massachusetts Institute of Technology, and Stanford University.
JISEA® and all JISEA-based marks are trademarks or registered trademarks of the Alliance for Sustainable Energy, LLC.
The Joint Institute for Strategic Energy Analysis 15013 Denver West Parkway Golden, CO 80401 303-275-3000 • www.jisea.org Contract No. DE-AC36-08GO28308
Potential Cost-Effective Opportunities for Methane Emission Abatement Ethan Warner1, Daniel Steinberg1, Elke Hodson2, and Garvin Heath1
1 Joint Institute for Strategic Energy Analysis 2 U.S. Department of Energy
Prepared under Task No. EPSA.Z410
Technical Report NREL/TP-6A50-62818 August 2015
NOTICE
This report was prepared as an account of work sponsored by an agency of the United States government. Neither the United States government nor any agency thereof, nor any of their employees, makes any warranty, express or implied, or assumes any legal liability or responsibility for the accuracy, completeness, or usefulness of any information, apparatus, product, or process disclosed, or represents that its use would not infringe privately owned rights. Reference herein to any specific commercial product, process, or service by trade name, trademark, manufacturer, or otherwise does not necessarily constitute or imply its endorsement, recommendation, or favoring by the United States government or any agency thereof. The views and opinions of authors expressed herein do not necessarily state or reflect those of the United States government or any agency thereof.
Available electronically at SciTech Connect: http:/www.osti.gov/scitech
Available for a processing fee to U.S. Department of Energy and its contractors, in paper, from:
U.S. Department of Energy Office of Scientific and Technical Information P.O. Box 62 Oak Ridge, TN 37831-0062 OSTI http://www.osti.gov/ Phone: 865.576.8401 Fax: 865.576.5728 Email: [email protected]
Available for sale to the public, in paper, from:
U.S. Department of Commerce National Technical Information Service 5301 Shawnee Road Alexandria, VA 22312 NTIS http://www.ntis.gov Phone: 800.553.6847 or 703.605.6000 Fax: 703.605.6900 Email: [email protected]
Cover Photos: (left to right) NREL 04135, iStock 22779761, NREL 16933, NREL 15648, NREL 08466, NREL 21205.
NREL prints on paper that contains recycled content.

iii
This report is available at no cost from the National Renewable Energy Laboratory (NREL) at www.nrel.gov/publications.
Foreword JISEA advances its mission of guiding the transformation of the global energy economy through conducting seminal analysis and innovative, collaborative research. JISEA papers and publications deliver groundbreaking strategic insights and explain their real-world implications. We look forward to your feedback and thank you for your interest in the work of JISEA.
Doug Arent
Executive Director, Joint Institute for Strategic Energy Analysis

iv
This report is available at no cost from the National Renewable Energy Laboratory (NREL) at www.nrel.gov/publications.
Acknowledgments This work was funded by the U.S. Department of Energy’s (DOE’s) Office of Energy Policy and Systems Analysis (EPSA). The authors acknowledge the support of the Joint Institute for Strategic Energy Analysis, which is operated by the Alliance for Sustainable Energy, LLC, on behalf of the U.S. Department of Energy's National Renewable Energy Laboratory, the University of Colorado-Boulder, the Colorado School of Mines, the Colorado State University, the Massachusetts Institute of Technology, and Stanford University. The authors wish to thank the following individuals for their thoughtful comments, input, or review of the document in its various stages: James Bradbury, Adrian Down and Judi Greenwald (DOE); Jeffrey Logan, Emily Newes, Margaret Mann, and Dave Mooney of the National Renewable Energy Laboratory (NREL); Doug Arent of the Joint Institute for Strategic Energy Analysis; and Joel Bluestein of ICF International. These reviews serve to make this report as technically sound as possible, however, any remaining errors or omissions are those of the authors. Furthermore, the views and opinions of authors expressed herein do not necessarily state or reflect those of the reviewers, their associated institutions, or the United States government or of any institution thereof. We also wish to thank Kendra Palmer and Scott Gossett of NREL for their editorial support.

v
This report is available at no cost from the National Renewable Energy Laboratory (NREL) at www.nrel.gov/publications.
Acronyms and Abbreviations Bcf billion cubic feet CAPEX capital expenditures CH4 methane CO2e carbon dioxide equivalent dist. distribution DOE Department of Energy EAP emissions abatement potential EIA Energy Information Administration EPA Environmental Protection Agency g gram gath & boost gathering and boosting GHG greenhouse gas GHGI greenhouse gas inventory GHGRP greenhouse gas reporting program GWP global warming potential ICF ICF International intermit. intermittent IPCC Intergovernmental Panel on Climate Change JISEA Joint Institute for Strategic Energy Analysis LDAR leak detection and repair LDC local distribution company LNG liquid natural gas MACC marginal abatement cost curve Mcf thousand cubic feet MMt million metric tonnes NG natural gas OPEX operating and maintenance expenditures pneum. pneumatic proc. processing prod. production recip. reciprocating SCC social cost of carbon stor. storage t metric tonnes trans. transmission UNFCCC United Nations Framework Convention on Climate
Change VRU vapor recovery unit VAM ventilation air methane yr year
vi
This report is available at no cost from the National Renewable Energy Laboratory (NREL) at www.nrel.gov/publications.
Glossary Catalytic combustion: Exhaust from natural gas-combusting engines and turbines contain unburned methane; a catalytic convertor is used to facilitate combustion of this methane.
Emission abatement opportunity: An opportunity to reduce emissions from a source type using a specific technology or practice such as capturing gas, repairing leaks, or replacing equipment.
Emissions abatement potential: Estimated potential for a technology or practice to reduce annual emissions from a source or sources of emissions.
Fugitives: Unintentional emissions to the atmosphere.
Full revenue scenario: Assumes revenue can be recovered from all captured natural gas no matter the emitting supply chain segment or current regulatory regime.
Marginal abatement cost curve (MACC): Analyses that show the relative emission reduction magnitude and costs of opportunities to reduce emissions.
Net zero cost: Revenue associated with recovered gas exceeds the cost associated with implementing the measure such that emission abatement opportunities cost less than $0 per t CO2e.
No revenue scenario: Assumes no revenue can be recovered from captured natural gas.
Partial revenue scenario: Assumes revenue can be recovered from a portion of the captured natural gas. Modeled after the ICF MACC analysis, the partial revenue scenario assumes 0% of potential revenue recovered from captured natural gas in the transmission and distribution segments and 100% of revenue recovery in other segments of the natural gas supply chain (ICF 2014).
VAM thermal oxidation: Methane in the exhaust air of underground coal mine shafts is destroyed using thermal oxidation.
Venting: Emissions emitted by design to the atmosphere from routine operations, engine combustion, or other sources.

vii
This report is available at no cost from the National Renewable Energy Laboratory (NREL) at www.nrel.gov/publications.
Executive Summary The energy sector was responsible for approximately 84% of carbon dioxide equivalent (CO2e) greenhouse gas (GHG) emissions in the U.S. in 2012 (EPA 2014a).1 Methane is the second most important GHG, contributing 9% of total U.S. CO2e emissions. A large portion of those methane emissions result from energy production and use; the natural gas, coal, and oil industries produce approximately 39% of anthropogenic methane emissions in the U.S. As a result, fossil-fuel systems have been consistently identified as high priority sectors to contribute to U.S. GHG reduction goals (White House 2015).
Only two studies have recently attempted to quantify the abatement potential and cost associated with the breadth of opportunities to reduce GHG emissions within natural gas, oil, and coal supply chains in the United States, namely the U.S. Environmental Protection Agency (EPA) (2013a) and ICF (2014).2 EPA, in its 2013 analysis, estimated the marginal cost of abatement for non-CO2 GHG emissions from the natural gas, oil, and coal supply chains for multiple regions globally, including the United States. Building on this work, ICF International (ICF) (2014) provided an update and re-analysis of the potential opportunities in U.S. natural gas and oil systems.
In this report we synthesize these previously published estimates as well as incorporate additional data provided by ICF to provide a comprehensive national analysis of methane abatement opportunities and their associated costs across the natural gas, oil, and coal supply chains. Results are presented as a suite of marginal abatement cost curves (MACCs), which depict the total potential and cost of reducing emissions through different abatement measures.3 We report results by sector (natural gas, oil, and coal) and by supply chain segment – production, gathering and boosting, processing, transmission and storage, or distribution – to facilitate identification of which sectors and supply chain segments provide the greatest opportunities for low cost abatement.
Every abatement measure within the fossil fuel supply chains has both a cost associated with its implementation (the capital and labor required to complete and maintain the measure) and most measures have a benefit associated with the recovery of natural gas that would have otherwise been lost.
Depending on the structure of the natural gas market, the recovered gas may or may not represent a revenue stream to the owner of or investor in the improved infrastructure. For
1 The U.S. GHG inventory (GHGI) reports emissions with a two year lag (e.g., the 2014 U.S. GHGI reports emissions through 2012). Until recently, the latest available U.S. GHGI was published in 2014 (EPA, 2014a). 2 Other previous studies have only assessed specific opportunities to abate methane or costs of those opportunities within the natural gas, oil, or coal supply chains (e.g., EPA 2003; EPA 2007; EPA 2011; Carbon Limits 2014). 3 Underlying data used to construct MACCs are inherently variable and uncertain and caution is warranted regarding interpretation of the results in this report given that variability and uncertainty are not represented in the MACCs. The U.S. GHGI, the primary data source for baseline methane emissions in the ICF and EPA studies, is steadily being improved, and considerable new research is being conducted to improve the inventory annually. Also, in practice, costs and methane emissions abatement from actual projects are highly variable and site-specific as well as evolving, so actual abatement costs and benefits will differ by U.S. region. These limitations mean that the precision of the data presented as two significant figures throughout this report does not necessarily represent actual precision, but instead is provided to help readers follow calculations.

viii
This report is available at no cost from the National Renewable Energy Laboratory (NREL) at www.nrel.gov/publications.
example, for a natural gas producer, every unit of saved gas represents additional gas that can be sold, and thus the value of the saved gas can be recovered. However, owners of natural gas transmission, as a result of how transmission owners recover costs and earn revenue, may not be able to recoup the value of saved gas resulting from transmission infrastructure improvements. Inability to recover the value of saved gas increases the cost of the abatement measures. In order to account for this, we present MACC results using two different assumptions about revenue associated with recovered gas: 4,5
1) Partial revenue – natural gas supply chain participants can recover revenue in all natural gas sectors except natural gas transmission and distribution (ICF 2014).
2) Full revenue – all natural gas supply chain participants can recover revenue from captured natural gas. This represents a scenario in which existing policy and market barriers are addressed.
Table 1 summarizes the approximately 120 million metric metric tonnes (MMt) CO2e/yr of potential abatement of methane emissions from natural gas, oil, and coal systems identified in this report. 6 All of the natural gas and oil abatement opportunities (86 MMt CO2e/yr) analyzed are cost-effective when compared to the social cost of emitting an equivalent amount of CO2 into the atmosphere.7 Across natural gas, oil, and coal, approximately 33 MMt CO2e/yr can be achieved at net zero cost8 or lower under the partial revenue scenario. Given the potential difficulty in recouping the value of recovered gas in the transmission segment, there are no opportunities less than or equal to net zero cost under the partial revenue scenario. However, under the full revenue scenario, many transmission measures become cost-effective, and thus the total abatement potential for net zero cost or lower increases to 49 MMt CO2e/yr. The large majority (84%) of the abatement opportunities available at net zero cost or lower in the fossil fuel sector is found in the natural gas supply chain.
Within the natural gas supply chain we identify 67 MMt CO2e/yr of cost-effective9 methane abatement potential. The majority of the potential, approximately 70%, is found downstream of production. This finding is due to the fact that many lower-cost measures have already been implemented in the production segment of the natural gas supply chain (EPA 2014a).
4 We assume revenue to be $4/thousand cubic feet (Mcf) of natural gas (ICF 2014; EPA 2013b). 5 A third no revenue scenario is defined and discussed in the body of this report. 6 We present our results assuming a global warming potential (GWP) for methane of 25 grams (g) CO2e per g methane following its use in EPA’s GHG Reporting Program as well as its recently published 2015 U.S. GHGI (EPA 2015a; EPA 2014b; Federal Register 2014). Starting in 2015, the UNFCCC reporting requires the use of a methane GWP of 25 (UNFCCC 2014; IPCC 2007). It should be noted, however, that latest international assessment of scientific evidence (IPCC 2013) reports that the 100-year GWP for methane of fossil origin is 36 g CO2e per g methane when including climate-carbon feedbacks (IPCC 2013). If this GWP were used, all instances of GHG emissions in CO2e in this report would increase by about 45% and reported costs of emissions would decrease by 45%. 7 The Interagency Working Group (2015) on the SCC estimated that, in 2018, the damage of emitting one ton of carbon dioxide would be $45/t CO2 in 2013 dollars. 8 We define a measure as net zero cost if the revenue associated with recovered gas exceeds the cost associated with implementing the measure. 9 Assuming the SCC applies to methane at $45/t CO2.
ix
This report is available at no cost from the National Renewable Energy Laboratory (NREL) at www.nrel.gov/publications.
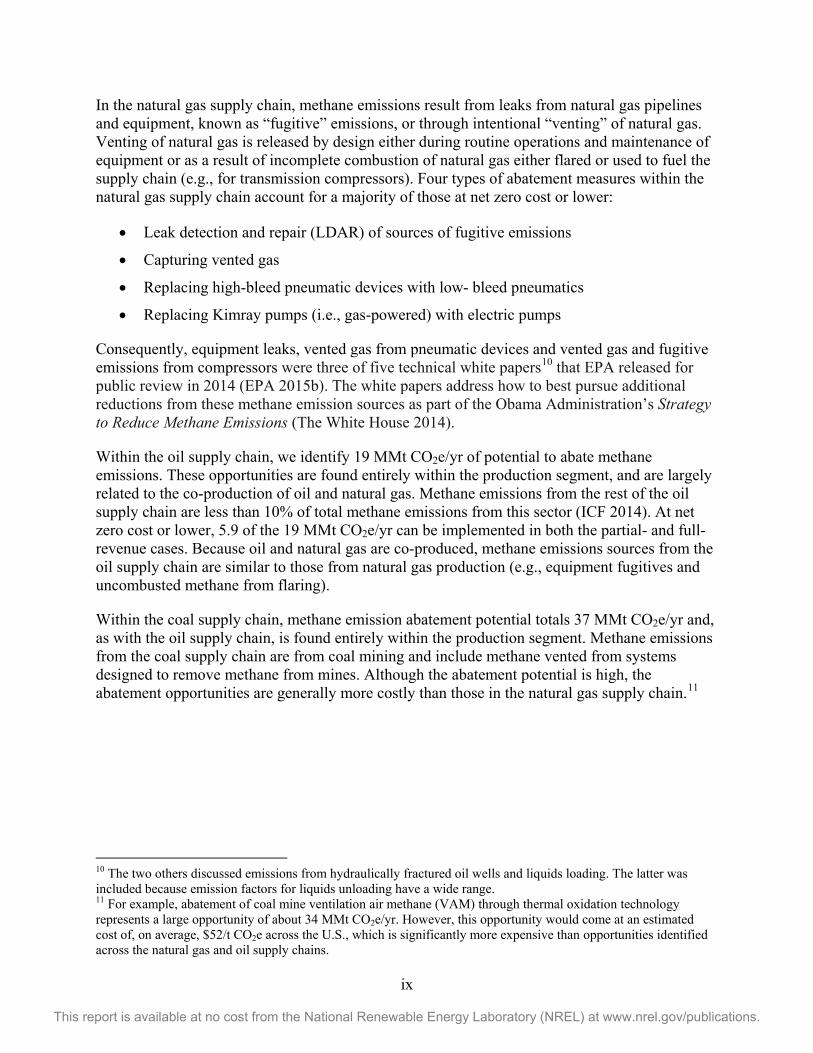
In the natural gas supply chain, methane emissions result from leaks from natural gas pipelines and equipment, known as “fugitive” emissions, or through intentional “venting” of natural gas. Venting of natural gas is released by design either during routine operations and maintenance of equipment or as a result of incomplete combustion of natural gas either flared or used to fuel the supply chain (e.g., for transmission compressors). Four types of abatement measures within the natural gas supply chain account for a majority of those at net zero cost or lower:
• Leak detection and repair (LDAR) of sources of fugitive emissions
• Capturing vented gas
• Replacing high-bleed pneumatic devices with low- bleed pneumatics
• Replacing Kimray pumps (i.e., gas-powered) with electric pumps
Consequently, equipment leaks, vented gas from pneumatic devices and vented gas and fugitive emissions from compressors were three of five technical white papers10 that EPA released for public review in 2014 (EPA 2015b). The white papers address how to best pursue additional reductions from these methane emission sources as part of the Obama Administration’s Strategy to Reduce Methane Emissions (The White House 2014).
Within the oil supply chain, we identify 19 MMt CO2e/yr of potential to abate methane emissions. These opportunities are found entirely within the production segment, and are largely related to the co-production of oil and natural gas. Methane emissions from the rest of the oil supply chain are less than 10% of total methane emissions from this sector (ICF 2014). At net zero cost or lower, 5.9 of the 19 MMt CO2e/yr can be implemented in both the partial- and full-revenue cases. Because oil and natural gas are co-produced, methane emissions sources from the oil supply chain are similar to those from natural gas production (e.g., equipment fugitives and uncombusted methane from flaring).
Within the coal supply chain, methane emission abatement potential totals 37 MMt CO2e/yr and, as with the oil supply chain, is found entirely within the production segment. Methane emissions from the coal supply chain are from coal mining and include methane vented from systems designed to remove methane from mines. Although the abatement potential is high, the abatement opportunities are generally more costly than those in the natural gas supply chain.11
10 The two others discussed emissions from hydraulically fractured oil wells and liquids loading. The latter was included because emission factors for liquids unloading have a wide range. 11 For example, abatement of coal mine ventilation air methane (VAM) through thermal oxidation technology represents a large opportunity of about 34 MMt CO2e/yr. However, this opportunity would come at an estimated cost of, on average, $52/t CO2e across the U.S., which is significantly more expensive than opportunities identified across the natural gas and oil supply chains.
x
This report is available at no cost from the National Renewable Energy Laboratory (NREL) at www.nrel.gov/publications.
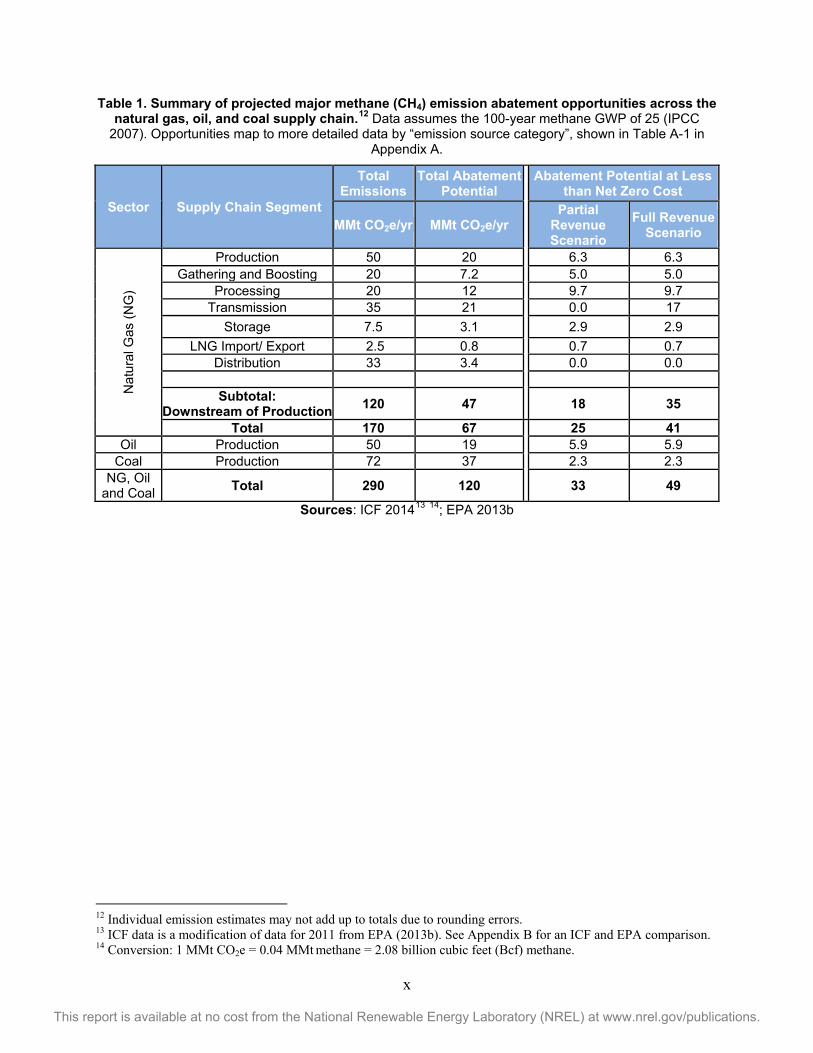
Table 1. Summary of projected major methane (CH4) emission abatement opportunities across the natural gas, oil, and coal supply chain.12 Data assumes the 100-year methane GWP of 25 (IPCC
2007). Opportunities map to more detailed data by “emission source category”, shown in Table A-1 in Appendix A.
Sector Supply Chain Segment
Total Emissions
Total Abatement Potential Abatement Potential at Less
than Net Zero Cost
MMt CO2e/yr MMt CO2e/yr Partial
Revenue Scenario
Full Revenue Scenario
Nat
ural
Gas
(NG
)
Production 50 20 6.3 6.3 Gathering and Boosting 20 7.2 5.0 5.0
Processing 20 12 9.7 9.7 Transmission 35 21 0.0 17
Storage 7.5 3.1 2.9 2.9 LNG Import/ Export 2.5 0.8 0.7 0.7
Distribution 33 3.4 0.0 0.0
Subtotal: Downstream of Production 120 47 18 35
Total 170 67 25 41 Oil Production 50 19 5.9 5.9
Coal Production 72 37 2.3 2.3 NG, Oil
and Coal Total 290 120 33 49
Sources: ICF 201413 14; EPA 2013b
12 Individual emission estimates may not add up to totals due to rounding errors. 13 ICF data is a modification of data for 2011 from EPA (2013b). See Appendix B for an ICF and EPA comparison. 14 Conversion: 1 MMt CO2e = 0.04 MMt methane = 2.08 billion cubic feet (Bcf) methane.

xi
This report is available at no cost from the National Renewable Energy Laboratory (NREL) at www.nrel.gov/publications.
Table of Contents 1 Introduction .............................................................................................................................................. 1
1.1 Methane ......................................................................................................................................... 1 1.2 MACC Analysis Goals and Scope ................................................................................................ 3
2 Constructing MACCs ........................................................................................................................... 5 2.1 Methods ......................................................................................................................................... 5 2.2 Comparison of the Scope of Methane Emission Abatement Studies ............................................ 8 2.3 Data Sources and Underlying Assumptions of EPA, ICF, and Hybrid MACCs ......................... 10
3 Results: The Hybrid ICF-EPA MACCs .............................................................................................. 12 3.1 Natural Gas ICF-EPA Hybrid MACCs ....................................................................................... 12 3.2 Combined Natural Gas, Oil, and Coal ICF-EPA Hybrid MACCs .............................................. 17
4 Areas for Future Analysis Improvement .......................................................................................... 20 5 Conclusions ........................................................................................................................................ 22 6 References .......................................................................................................................................... 24 Appendix A. Summary of Potential Methane Emissions Abatement .................................................. 28 Appendix B. Comparison of EPA and ICF Inventories .......................................................................... 29 Appendix C. Supplemental MACCs ......................................................................................................... 30 List of Tables Table 1. Summary of projected major methane (CH4) emission abatement opportunities across the
natural gas, oil, and coal supply chain ................................................................................................. x Table 2. Summary of major methane (CH4) emission abatement opportunities across the natural gas
supply chain in 2018 .......................................................................................................................... 13
List of Figures Figure 1. U.S. GHGI estimates of methane emissions in the U.S. in 2012. .................................................. 2 Figure 2. Methane (CH4) emissions in 2011 from the natural gas supply chain and contributions to
total emissions (%)............................................................................................................................... 3 Figure 3. Schematic of an MACC, including 4 illustrative categories of emission sources. ........................ 6 Figure 4. Natural gas MACC separated by source and supply chain segment for the partial revenue
scenario in 2018 ................................................................................................................................. 14 Figure 5. Natural gas MACC separated by source and supply chain segment for the full revenue
scenario in 2018 ................................................................................................................................. 16 Figure 6. MACC for each source of methane (CH4) emissions from NG, oil, and coal for partial
revenue scenario in 2018 ................................................................................................................... 18 Figure 7. MACC for each source of methane (CH4) emissions from NG, oil, and coal for full
revenue scenario in 2018 ................................................................................................................... 19 Figure B-1. Comparison of the EPA and ICF GHG emissions inventories for 2011 ................................. 29 Figure C-1. Natural gas MACC separated by source and supply chain segment for the no revenue
scenario in 2018. Labels indicate the emission source ...................................................................... 30 Figure C-2. MACC for each source of methane (CH4) emissions from natural gas, oil, and coal for
the no revenue scenario in 2018 ........................................................................................................ 31 Figure C-3. MACC for methane (CH4) emissions aggregated to each supply chain segment evaluated
for natural gas, oil, and coal systems for the no revenue scenario in 2018 ........................................ 32 Figure C-4. MACC for methane (CH4) emissions aggregated to each supply chain segment evaluated
for natural gas, oil, and coal systems for the partial revenue scenario in 2018 ................................. 33 Figure C-5. MACC for methane (CH4) emissions aggregated to each supply chain segment evaluated
for natural gas, oil, and coal systems for the full revenue scenario in 2018 ...................................... 34

1
This report is available at no cost from the National Renewable Energy Laboratory (NREL) at www.nrel.gov/publications.
1 Introduction Section 1.1 summarizes background information on the increasing importance of methane in regards to climate change and the methane emissions attributed to the natural gas industry. Section 1.2 describes the goals and scope of our analysis of marginal abatement cost curves (MACC).
1.1 Methane Methane is an important climate forcing gas. It has a large global warming potential (GWP) relative to carbon dioxide (CO2), but a shorter atmospheric lifetime according the Intergovernmental Panel on Climate change (IPCC) (2013).15 Thus, reducing methane emissions has been included in the interagency Methane Strategy of the President’s Climate Action Plan (White House 2015). It is therefore important to understand the sources and trends of methane emissions.
At the time of this analysis, the most current U.S. greenhouse gas inventory (GHGI) was published in 2014 according to the U.S. Environmental Protection Agency (EPA) (2014a). That U.S. GHGI used a methane GWP of 21, in conformance with United National Framework Convention on Climate Change (UNFCCC) (1998) reporting requirements for national GHG inventories, and based on scientific consensus at the time from the IPCC (1995). Starting in 2015, the UNFCCC reporting requires the use of a methane GWP of 25 (UNFCCC 2014; IPCC 2007). This report uses a GWP of 25 following its use in EPA’s GHG Reporting Program (GHGRP) as well as its recently published 2015 U.S. GHGI (EPA 2015a; EPA 2014b; Federal Register 2014). It should be noted, however, that recent scientific evidence suggests that the 100-year GWP of methane is greater than 25 (IPCC 2013).16
Figure 1 displays the 2014 U.S. GHGI estimates for anthropogenic methane emission sources. Methane emissions comprised 9% of U.S. GHG emissions in 2012, and 23% of total methane emissions are from the natural gas industry (EPA 2014a). This industry has consistently been identified as one of the top sources of methane emissions in the United States despite changes to GHGI methods that have occurred over time and remaining uncertainties. See Heath et al. (2015) for further details about inventory approaches, uncertainties, current estimates, and future studies of methane emissions from the natural gas supply chain.
Methane emissions from the natural gas supply chain are the result of fugitive and vented sources across the supply chain. Fugitive emissions are unintended emissions from leaks; vented emissions are emitted by design such as from maintenance tasks or incomplete combustion of 15 GWP is a metric defined as the time-integrated radiative forcing of a gas due to a pulse emission and relative to that of carbon dioxide, which by definition has a GWP of 1. The GWP has become the default metric for transforming emissions of different gases to a common scale; often called “CO2 equivalent (CO2e) emissions”. GWPs are assessed over fixed time periods (e.g., 20, 100, and 500-years) since gases have different atmosphere lifetimes, with the 100-year time horizon being the most commonly used. However these specific time horizons should not be considered as having any special scientific significance (IPCC 2013). The 100-year GWP was later adopted as a metric to implement the multi-gas accounting approach embedded in the United Nations Framework Convention on Climate Change (IPCC 2013). 16 The latest international assessment of scientific evidence (IPCC 2013) reports that the 100-year GWP for methane of fossil origin is 36 g CO2e per g methane when including climate-carbon feedbacks (IPCC 2013). If this GWP were used, all instances of GHG emissions in CO2e in this report would increase by about 45%.

2
This report is available at no cost from the National Renewable Energy Laboratory (NREL) at www.nrel.gov/publications.
natural gas in engines. So-called “beneficial uses” of natural gas, such as powering transmission equipment, are considered within the U.S. GHGI but not explicitly tracked (i.e., these uses do not have independent entries). Combusting methane for these “beneficial uses” produces CO2 and small amounts of un-combusted methane that are tracked separately in the U.S GHGI.
Figure 1. U.S. GHGI estimates of methane emissions in the U.S. in 2012. Total emissions are 675
MMt CO2e/yr.
Source: EPA 2014a
Natural gas-related methane emissions in 2011 from the 2013 U.S. GHGI, as modified by ICF International (ICF) (2014) for use in their MACCs, are displayed in Figure 2 by supply chain segment along with sub-components of each segment of the supply chain. According to the U.S. Energy Information Administration (EIA) (2014a) these supply chain segments include:
1. Production, gathering and boosting
o Production of natural gas from a wellhead or field
o Gathering and boosting natural gas from the wellhead to a processing plant or to an interconnection with a larger pipeline
2. Processing plants, which extract natural gas liquids and remove impurities from the natural gas stream, as well as compress the natural gas to transmission line pressure.
3. Transmission and storage o Transmission of natural gas through long-distance pipelines from the producing
area to market areas (so-called “city gates”)
o (temporary) Storage of natural gas in depleted oil and gas reservoirs, aquifers, and salt caverns for future use. Storage also includes liquefied natural gas (LNG) storage infrastructure.
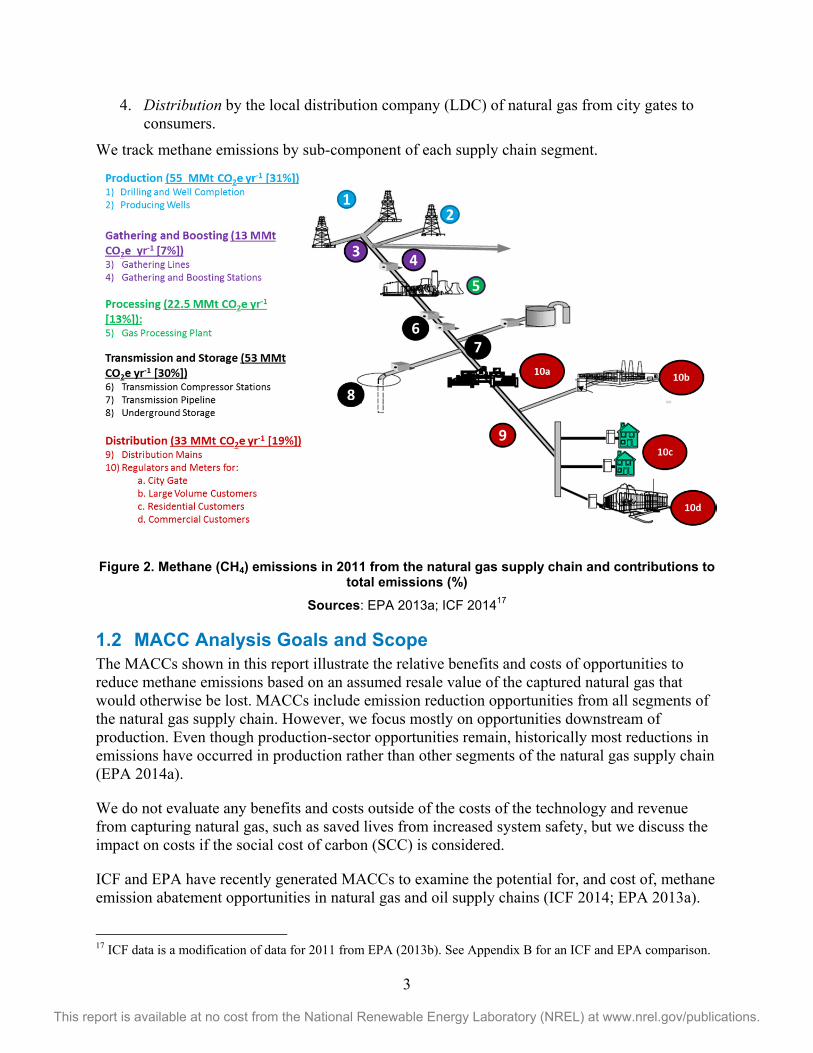
4. Distribution by the local distribution company (LDC) of natural gas from city gates to consumers.
We track methane emissions by sub-component of each supply chain segment.
Figure 2. Methane (CH4) emissions in 2011 from the natural gas supply chain and contributions to total emissions (%)
Sources: EPA 2013a; ICF 201417
1.2 MACC Analysis Goals and Scope The MACCs shown in this report illustrate the relative benefits and costs of opportunities to reduce methane emissions based on an assumed resale value of the captured natural gas that would otherwise be lost. MACCs include emission reduction opportunities from all segments of the natural gas supply chain. However, we focus mostly on opportunities downstream of production. Even though production-sector opportunities remain, historically most reductions in emissions have occurred in production rather than other segments of the natural gas supply chain (EPA 2014a).
We do not evaluate any benefits and costs outside of the costs of the technology and revenue from capturing natural gas, such as saved lives from increased system safety, but we discuss the impact on costs if the social cost of carbon (SCC) is considered.
ICF and EPA have recently generated MACCs to examine the potential for, and cost of, methane emission abatement opportunities in natural gas and oil supply chains (ICF 2014; EPA 2013a).
17 ICF data is a modification of data for 2011 from EPA (2013b). See Appendix B for an ICF and EPA comparison.
3
This report is available at no cost from the National Renewable Energy Laboratory (NREL) at www.nrel.gov/publications.
4
This report is available at no cost from the National Renewable Energy Laboratory (NREL) at www.nrel.gov/publications.
EPA also generated MACCs for coal mining as well as other sources of emissions. The ICF and EPA studies overlap in many of the data sources used and opportunities to abate emissions from examined sources. The analysis by ICF is slightly more recent and uses a more up-to-date U.S. GHGI, but does not examine several sources of emissions and emission abatement opportunities that were addressed by EPA (ICF 2014; EPA 2013a). We synthesized MACCs that integrate data from both the ICF and EPA studies to provide a larger scope of opportunities besides those that are commercial technologies and considered low-cost.
We have constructed MACCs that represent a comprehensive and up-to-date compilation of data on the magnitude and cost of emissions abatement opportunities for methane emissions from fossil energy industries.18 They also represent a novel presentation of current research allowing for the identification of and location in the supply chain of potentially large opportunities for reducing emissions, as well as some of the necessary preconditions for these opportunities to be low-cost. We refer to the MACCs in this report as “hybrid” MACCs because they integrate both ICF and EPA data.
18 Other recent studies, such as those from Bradbury et al. (2013) and Harvey, Gowrishankar, and Singer (2012), examined emission abatement opportunities or their costs, but did not create MACCs.

5
This report is available at no cost from the National Renewable Energy Laboratory (NREL) at www.nrel.gov/publications.
2 Constructing MACCs Section 2 describes how MACCs are created, how the ICF-EPA hybrid MACCs are constructed, and then the differences between the ICF and EPA studies and their estimates.
2.1 Methods An MACC is constructed from an emission abatement potential and the cost for implementing a particular approach to reducing emissions from one type of source. emission abatement potentials are the estimated annual amount of emissions that could be reduced through implementation of an abatement technology or practice to a certain type of emission source. emission abatement potentials represent technical potentials for the abatement opportunities as applied, for example, by switching from annual to quarterly leak detection and repair (LDAR) as described in the ICF report (2014). Abatement costs are the estimated annualized costs (both operation and maintenance [OPEX] and capital [CAPEX] expenditures) to reduce each unit of emissions when employing the same technology or practice on the same source type as for the emission abatement potential.
Figure 3 provides a schematic of an MACC, simplified to illustrate its components and interpretation. Cumulative emission abatement potential is measured on the x-axis and abatement cost is measured on the y-axis of the MACC. An individual column represents the emission abatement potential and abatement cost for one methane source type. Therefore, the area of each column represents total annual costs for each methane source. Each column can be colored to indicate an aggregated “source category”.
The measure categories shown in Figure 3 corresponding to emission abatement opportunities are generic and are dependent on the MACC. These generic categories represent in Figures 4-5 (C-1 in Appendix C), Figures 6-7 (C-2 in Appendix C), and Figures C-3 to C-5 the sources of emissions by supply chain segment, sources of emission by fossil fuel industry, and sources of emissions by fossil fuel industry supply chain segment as shown, respectively.

6
This report is available at no cost from the National Renewable Energy Laboratory (NREL) at www.nrel.gov/publications.
Figure 3. Schematic of an MACC, including 4 illustrative categories of emission sources.
Source: Modified illustration from ICF (2014).
Calculating the emission abatement potential for each source of emissions (see Equation 1) requires establishing a baseline of current methane emissions from all sources along the fossil fuel industry supply chain. Current and historical baseline emissions estimates are taken from an emissions inventory such as the U.S. GHGI. Future baseline emissions must either be estimated or taken from existing projects, such as in EPA (2013a) or from the interagency 2014 Climate Action Report (Department of State 2014). Estimated future emissions are typically constructed using an existing inventory’s emission factors modulated by projected changes to activity factors, e.g., changes to the number of wells, as well as any expected impacts of implementing policies already in place (e.g., New Source Performance Standard) (ICF 2014; Government Publishing Office 2014).
The emission abatement potential for each opportunity can be estimated once baseline net emissions (in MMt CO2e/year)19 for each source are established by multiplying by an expected
19 If the 100-year fossil methane GWP of 36 g CO2e per g methane were used instead of 25, emission abatement potential would increase by about 45%.

7
This report is available at no cost from the National Renewable Energy Laboratory (NREL) at www.nrel.gov/publications.
reduction factor (see Equation 1). For example, research cited by both Colorado and EPA estimates that a switch from annual to quarterly LDAR inspections of wells, compressor stations, reciprocating compressors, and LDC meters & regulators can reduce fugitive emissions by 60% (Colorado Department of Public Health and Environment 2014; EPA 2007). ICF and EPA specify reduction factors by considering a combination of:
• The frequency that the opportunity is used (e.g., number of devices replaced or the increase in the frequency of LDAR)
• The market share, if there are competing opportunities, addressing the same sources of emissions
• The technical effectiveness of the opportunity.
EAP = 𝑏𝑏𝑏𝑏𝑏𝑏𝑏𝑏 𝑏𝑏𝑛 𝑏𝑒𝑏𝑏𝑏𝑏𝑒𝑏𝑏 (𝑀𝑀𝑛 𝐶𝐶2𝑏/𝑦𝑦) ∗ 𝑦𝑏𝑟𝑟𝑟𝑛𝑏𝑒𝑏 𝑓𝑏𝑟𝑛𝑒𝑦 (%) [Eq. 1]
Abatement cost is estimated using a combination of annualized costs and emission abatement potential.20 ICF and EPA calculate abatement costs differently. Equation 2 shows the abatement cost equation from the ICF (2014), which is a simplified version compared to that from EPA, and includes basic costs and benefits such as CAPEX, OPEX, and benefits in the form of revenue (R) from the sale of captured natural gas. EPA includes other costs and benefits such as taxes and the tax benefits of capital depreciation (EPA 2013a).
𝐴𝑏𝑏𝑛𝑏𝑒𝑏𝑏𝑛 𝐶𝑒𝑏𝑛 =𝐶𝐴𝐶𝐶𝐶
𝐶𝐴𝐶 ∗ ∑ 1(1 + 𝐷𝐷)𝑡
𝐿𝑡=1
+𝐶𝐶𝐶𝐶𝐶𝐴𝐶
−𝐷𝐶𝐴𝐶
[Eq. 2]
Where:
• CAPEX = total capital cost ($)
• EAP = emission abatement potential (MMt CO2e/yr)
• L = lifetime of the technology (yr)
• DR = discount rate (%)
• OPEX = operation and maintenance costs ($/yr)
• R = revenue ($/yr).
In both the ICF and the EPA MACCs, CAPEX is annualized based on a technology-specific lifetime and using a discount rate of 10%. Due to being annualized, abatement costs only represent long-term averages and do not account for the variations in costs across years. Each technology requires different CAPEX and OPEX costs that lead to differences between upfront and ongoing annual operating costs. Subsequently, each emission abatement opportunity leads to different multi-year operational cost commitments to fully realize emission reductions over the life of the opportunity.
20 If the 100-year fossil methane GWP of 36 g CO2e per g methane were used instead of 25, abatement costs would decrease by about 45% per unit of methane emission abated.
8
This report is available at no cost from the National Renewable Energy Laboratory (NREL) at www.nrel.gov/publications.
ICF and EPA assumed $4 per thousand cubic feet (Mcf) (ICF 2014; EPA 2014a). Revenue is sensitive to modeling assumptions around whether owners of infrastructure can recover the costs from the sale of natural gas. These assumptions can greatly affect the net abatement cost of most emission abatement potential opportunities.21 emission abatement potential opportunities that combust the gas—such as flaring—do not have a revenue stream. Herein, we show abatement costs that are calculated using three different assumptions about recovered gas and the associated revenue from the sale of the gas:
3) No revenue. This scenario assumes that no fossil energy supply chain participants can recover revenue from captured natural gas.
4) Partial revenue. This scenario assumes that fossil energy supply chain participants can recover revenue from captured natural gas from some sectors, including: natural gas production, gathering and boosting, processing, storage, and LNG infrastructure22; oil production; and coal mining.
5) Full revenue. This scenario illustrates a situation in which all fossil energy sectors and supply chain participants can recover revenue from captured natural gas, and this represents the least cost for all abatement options.
The no revenue and full revenue scenarios provide minimum and maximum bounds for potential revenue recovery from reducing natural gas fugitive and venting emission. The no revenue scenario presents opportunities based only on costs while the full revenue scenario presents an optimistic case in which revenue from captured natural gas can be recovered across the natural gas supply chain. Participants in the natural gas industry such as natural gas producers can recover revenue. Barriers to full monetization of opportunities downstream of production would need to be addressed in order to achieve a full revenue scenario.
The partial revenue case assumes no revenue from the capture of natural gas in transmission and distribution segments of the natural gas supply chain (ICF 2014). The ICF (2014) assumed 100% revenue recovery from all other supply chain segments. This assumption represents a case in which there are limited incentives to conserve fuel or avoid leaks as is typically the case in the transmission and distribution segments (Paranhos et al. 2015). For those segments with revenue recovery, determining the precise rate of actual revenue recovery from captured natural gas in the industry is difficult due to variation by region and regulated market.
In addition to the three revenue scenarios we evaluated for the construction of MACCs, we also compare costs of emission abatement potential in the MACCs to the social cost of the emissions using the SCC. The SCC is $45/metric tonne (t) CO2 in 2018, reported in 2013 dollars (Interagency Working Group 2013).23
2.2 Comparison of the Scope of Methane Emission Abatement Studies Hybrid MACC figures are constructed based on the data and methods from the ICF and EPA studies (ICF 2014; EPA 2013a). The ICF (2014) modeled and analyzed the potential for and 21 Abatement opportunities without gas to capture (e.g., flaring and catalytic combustion) are unaffected by revenue from gas capture. 22 This analysis does not consider contract structures which might transfer revenues to infrastructure asset owners that do not directly derive revenue from gas sales. 23 Adjusted 2014 dollars for inflation to 2013 dollars and assuming a 3% discount rate
9
This report is available at no cost from the National Renewable Energy Laboratory (NREL) at www.nrel.gov/publications.
costs of methane emission abatement opportunities for the onshore natural gas industry as well as oil production. ICF did not analyze offshore production of natural gas. ICF considered opportunities in seven U.S. sub-regions. ICF’s focus was on opportunities in the year 2018. EPA modeled and analyzed the potential for and costs of emission abatement opportunities for all major sources of methane in the U.S. The scope of EPA’s modeling included the United States (no regionalization) as well as other global regions for the years 2010, 2020, and 2030.
The ICF and EPA studies overlap in the data sources used and technologies considered, but they used different U.S. GHGIs. The ICF used a more recent U.S. GHGI (EPA 2013b) and some more recent data, such as EPA’s GHGRP, for emission factors and activity counts to modify the U.S. GHGI (ICF 2014). Major methane emissions source additions were new estimates for compressor and pneumatic device emissions (ICF 2014). The ICF also reclassified certain emissions sources, such as compressors and pneumatic devices, from the oil and natural gas production segment to the gathering and boosting segment (ICF 2014). The ICF inventory made several other changes, such as inclusion of dump valve leakage and new counts of processing plants, to the U.S. GHGI (EPA 2013b) that are more fully documented in the ICF report (ICF 2014). Figure B-1 in Appendix B illustrates the differences between methane emissions in EPA’s and ICF’s inventories by supply chain segment. The ICF also included some vetting of cost data by industry experts (ICF 2014).
The other major difference between the ICF and EPA studies are the abatement opportunities examined. Offshore oil and natural gas, as well as coal mining-related methane emissions, were out of scope for the ICF study (2014) but in scope for the EPA study (EPA 2013a). EPA (2013a) included only coal and oil production related methane emission abatement opportunities because in the U.S. GHGI emissions outside of production are either not tracked or considered to be small (EPA 2014a). The ICF study also did not model several emission abatement opportunities that EPA examined, owing to the ICF’s judgment of high-cost or low-impact (ICF 2014). These excluded opportunities are:
• Emission controls for triethylene glycol dehydrator system venting due to the expected high cost and low methane emission reduction potential
• Replacing gas pneumatic controls with “instrument air systems” due to their expense
• Replacing unprotected steel pipeline and service lines due to their expense
• Replacing cast iron pipeline due to its expense
• Using catalytic convertors to combust methane emissions from natural gas fueled engine and turbines due to assessment of market readiness of the technology.
Conversely, EPA did not consider two emission abatement opportunities that the ICF deemed cost-effective (EPA 2013a). These opportunities included:
• Replacing intermittent bleed pneumatic devices with low-bleed pneumatic devices
• Replacing chemical injection pumps with pumps powered by photovoltaics.
Both the ICF and EPA modeled emission abatement opportunities related to avoiding venting of methane from centrifugal compressors with wet seals. However, the ICF looked at ways to
10
This report is available at no cost from the National Renewable Energy Laboratory (NREL) at www.nrel.gov/publications.
capture vented gas while EPA modeled the use of replacing wet seals with dry seals (EPA 2013a). The ICF considered capturing vented gas to be a lower-cost option than replacing wet seals (ICF 2014).
In addition to including the complete ICF data set, hybrid MACCs include potential emission abatement opportunities that were out of scope or considered not market ready by ICF. Hybrid MACCs include the following opportunities from EPA’s MACC analysis (EPA 2013a):
• Coal mine VAM thermal oxidation
• Coal mine fugitive emissions reduced through:
o Flaring
o Capture and pipeline injection
o Capture and use for onsite electricity generation
o Capture and use for onsite heat generation
• Flaring of offshore well fugitives
• Catalytic combustion of engine exhaust occurring across the natural gas supply chain.
We also discuss EPA’s data on replacement of unprotected steel and cast iron pipe and service lines, but do not include these data in MACCs (EPA 2013a).
2.3 Data Sources and Underlying Assumptions of EPA, ICF, and Hybrid MACCs
Methodologies for the underlying data are mostly similar in the EPA and ICF reports, but harmonization of some assumptions was needed and feasible. These differences are discussed below.
The ICF’s modeling is based on methane emission abatement potentials calculated by modifying the 2013 U.S. GHGI (EPA 2013b). Modification was based mostly on analysis of more recent data published by EPA’s GHGRP (EPA 2014b). The ICF used EPA’s 2013 U.S. GHGI to calculate an MACC for 2018 based on the EIA’s 2014 Annual Energy Outlook early release report (EIA 2014b). The U.S. GHGI ICF used is, one year more recent than the one used in EPA’s MACCs. The resulting annual growth in natural gas methane emissions from the 2011 U.S. GHGI data is less than 0.6% yr-1 through 2018. According to the ICF, 22 of the over 100 emission source categories in the U.S. GHGI considered account for 80% of the emissions, primarily from existing facilities (ICF 2014). Like EPA, the ICF’s cost modeling relies on data from the Natural Gas STAR (NG STAR) program, but also includes some more recent data sources (e.g., EPA 2014c).
EPA’s modeling is based on methane emission abatement potentials calculated from the U.S. GHGI published in 2012 (EPA 2012). EPA used the 2012 U.S. GHGI to calculate an MACC for the year 2010 as well as for 2020 and 2030; projections result in a 1.2% annual growth rate in natural gas and oil industry emissions through 2030. Abatement opportunity costs come from industry data voluntarily submitted to the NG STAR program (EPA 2014c). The ICF and EPA

11
This report is available at no cost from the National Renewable Energy Laboratory (NREL) at www.nrel.gov/publications.
studies did not use the most recent U.S. GHGI published in 2014 (EPA 2014a), as that document was released after the ICF and EPA reports.
Hybrid MACCs are based mainly on the ICF’s data, but also use EPA data to fill important gaps. The ICF’s data are more recent, addresses several potential missing sources of methane emission within the U.S. GHGI, and includes some additional emission abatement opportunities (see Section 2.2 for study comparisons) (ICF 2014).
The underlying data sources of abatement opportunity costs and methane emission abatement potential data used in the ICF and EPA studies are unchanged in this report (ICF 2014; EPA 2013a). We aligned other underlying EPA and ICF assumptions for estimating emission abatement potentials and abatement cost when feasible. Several steps were taken to make ICF and EPA data as commensurate as possible:
• GWP in both studies were harmonized to a 100-yr GWP of 25 g CO2e per g methane (Federal Register 2014; IPCC 2007)
• An inflation factor of 6.8% from the Bureau of Labor Statistics 2014 was used to convert data from the EPA report (EPA 2013a) in 2010 U.S. dollars to the 2013 U.S. dollars used in the ICF study (ICF 2014)
• Since EPA only examined a full revenue scenario, we calculated results for no revenue and partial revenue scenarios when applicable (EPA 2013a)
Both studies already assumed a consistent 10% discount rate and the same market price of $4/Mcf for revenue recovery for the sale of natural gas (ICF 2014; EPA 2013a).
However, the ICF and EPA methodologies differ in several ways that could not be harmonized:
• EPA accounted for costs from taxes (EPA 2013a)
• EPA accounted for the tax benefit from the depreciation of capital (ICF 2014)
• Data available for use are for 2010 from EPA and projections for 2018 from the ICF (EPA 2013a; ICF 2014). The years of available data differ, but the ICF’s assumed natural gas and oil industry growth results in an annual growth rate of 0.6%/yr in methane emissions with most of the growth in oil (ICF 2014). The growth rate assumptions of each study lead to only modest differences in emissions between the studies
Data reporting was a major barrier to addressing these incongruities. The ICF’s and EPA’s reporting on baseline emissions and reduction factors underlying Equation 1 in Section 2.1 are generally explicit. However, the specifics of how each study estimated baseline emissions from each U.S. GHGI are not clear. Not all data used in Equation 2 in Section 2.1 were explicitly reported by ICF and EPA (ICF 2014; EPA 2013a).

12
This report is available at no cost from the National Renewable Energy Laboratory (NREL) at www.nrel.gov/publications.
3 Results: The Hybrid ICF-EPA MACCs Section 3 describes the hybrid ICF-EPA MACC results for all three natural gas revenue recovery scenarios. Section 3.1 shows natural gas hybrid ICF-EPA MACCs and Section 3.2 provides a summary of the natural gas MACCs in the context of MACCs for oil and coal.
3.1 Natural Gas ICF-EPA Hybrid MACCs Table 1 summarizes total methane emissions, total abatement potential (i.e., sum of emission abatement potentials) examined in this report, and total abatement potential with a net zero cost or lower (i.e., less than $0/t CO2e) for each segment of the natural gas supply chain. There is 67 MMt CO2e/yr24 of cost-effective25 abatement potential in the natural gas supply chain. Similar to the ICF report (2014) about 25 to 41 MMt CO2e/yr could be implemented at net zero cost or lower in the partial and full revenue scenarios, respectively.
The majority of the potential, approximately 70%, is found downstream of production. Many measures have already been implemented in the production segment of the natural gas supply chain (EPA 2014a). Opportunities with a net zero cost or lower downstream of production total an abatement potential of 18 to 35 MMt CO2e/yr in the partial and full revenue scenarios, respectively. These emissions represent 11% to 21% of methane emission from the natural gas sector (EPA 2013b).
Mirroring the ICF report (2014) the four largest emission abatement opportunities with a net zero cost or lower (Table 1) along the natural gas supply chain are:
1. LDAR to find and repair sources of fugitives
2. Capturing vented gas from compressors
3. Replacing Kimray (i.e., gas-powered) pumps with electric pumps.26
4. Replacing high-bleed pneumatic devices with low-bleed pneumatic devices
24 The precision of the data presented (e.g., two significant figures) throughout this report does not necessarily represent actual precision of the data. Precision shown is provided help readers follow calculations. 25 Assuming the SCC applies to methane at $45/t CO2 26 We did not analyze if any of the necessary preconditions for natural gas supply chain electrification are met.

13
This report is available at no cost from the National Renewable Energy Laboratory (NREL) at www.nrel.gov/publications.
Table 2. Summary of major methane (CH4) emission abatement opportunities across the natural gas supply chain in 2018.27 Data assumes a methane GWP of 25 (IPCC 2007). Data listed assumes a “partial revenue” scenario unless included in [ ]. [ ] indicates opportunities with a net zero cost or lower in a “full revenue” scenario. Opportunities map to more detailed data by “emission source”, shown in Table
A-1 in Appendix A.
Total Emissions
Total Abatement Potential
Opportunities with Less than a Net Zero Cost
Four Largest Opportunities with Less than a Net Zero Cost
MMt CO2e/yr MMt CO2e/yr
MMt CO2e/yr
% of Total Emissions
% of Total Abatement Potential
LDAR Capturing
Vented Gas from Compressors
Replace Kimray Pumps
w/ Electric Pumps
Replace High-Bleed w/ Low-
Bleed Pneumatic
Devices
Production 50 20 6.3 13% 32% 0.0 - 0.4 5.9
Gathering and Boosting 20 7.2 5.0 25% 69% 1.8 0.6 2.4 0.3
Processing 20 12 9.7 48% 83% 4.7 5.0 0.0 -
Transmission 35 21 [17] [48%] [81%] [8.2] [6.1] - [0.4]
Storage 7.5 3.1 2.9 38% 92% 2.3 0.4 - 0.2
LNG Import/ Export 2.5 0.8 0.7 27% 87% 0.7 - - -
Distribution 33 3.4 0.0 0.0% 0% 0.0 - - -
Subtotal: Downstream of Production 120 47 18 [35] 15% [29%] 40% [73%] 9.4 [18] 6.0 [12] 2.4 0.5 [0.9]
Total 170 67 25 [41] 14% [24%] 37% [61%] 9.4 [18] 6.0 [12] 2.8 6.4 [6.8]
Source: ICF 201428 29; EPA 2013b
Figures 4, 5, and C-1 illustrate total methane abatement potential on the x-axis (MMt CO2e/yr) and the marginal abatement cost ($/t CO2e) on the y-axis for each natural gas methane emission source evaluated in this analysis. Figure 4 shows the partial revenue scenario, Figure 5 shows the full revenue scenario, and Figure C-1 in Appendix C shows the no revenue scenario. Table A-1 in Appendix A lists the method for reducing emissions from each “emissions source” shown in Figures 4, 5, and C-1.
Figure 4 (showing the partial revenue scenario) includes revenue recovered from the sale of captured natural gas in segments of the natural gas supply chain other than transmission and distribution. See Paranhos et al. (2015) for further discussion of regulatory structures related to methane emissions from natural gas.
Transmission and distribution segments are the only segments to have no abatement options at net zero cost or lower in the partial revenue scenario under the current set of assumptions. The four largest emission abatement opportunities in the partial revenue scenario are:
• 9.4 MMt CO2e/yr from LDAR of sources of fugitive emissions, mostly in processing (4.7 MMt CO2e/yr) and storage (2.3 MMt CO2e/yr) segments
27Individual emission estimates may not add up to totals due to rounding errors. 28 ICF data is a modification of data for 2011 from EPA (2013b). See Appendix B for an ICF and EPA comparison. Emissions abatement in 2018 is consistent with data reported in ICF (2014). 29 Conversion: 1 MMtCO2e = 0.04 MMt methane = 2.08 billion cubic feet (Bcf) methane

14
This report is available at no cost from the National Renewable Energy Laboratory (NREL) at www.nrel.gov/publications.
• 6.4 MMt CO2e/yr from replacing high-bleed pneumatic devices with low-bleed pneumatics, mostly in the production segment (5.9 MMt CO2e/yr)
• 6.0 MMt CO2e/yr from capturing vented gas from compressors, mostly in the processing (5.0 MMt CO2e/yr ) segment
• 2.8 MMt CO2e/yr from replacement of Kimray pumps (i.e., gas-powered) with electric pumps, mostly in the gathering and boosting (2.4 MMt CO2e/yr) segment.
Figure 4. Natural gas MACC separated by source and supply chain segment for the partial revenue
scenario in 2018. Labels indicate the emission source. Acronyms: intermittent (intermit.), pneumatic (pneum.), local distribution company (LDC), liquid natural gas (LNG), reciprocating (recip.).
Sources: ICF 201430 31; EPA 2013b
Figure 5 displays MACC results under the full revenue recovery scenario that values all captured natural gas, including from the transmission and distribution segments. In this scenario, net transmission segment abatement costs are reduced and, in most cases, become revenue generating. The largest methane emission abatement opportunities in the transmission segment include capturing vented natural gas from centrifugal compressors, compressor stations, and pipeline venting.
30 ICF data is a modification of data for 2011 from EPA (2013b). See Appendix B for an ICF and EPA comparison. Emissions abatement in 2018 and 2013 dollars is consistent with data reported in ICF (2014). 31 Conversion: 1 MMt CO2e = 0.04 MMt methane = 2.08 Bcf methane
15
This report is available at no cost from the National Renewable Energy Laboratory (NREL) at www.nrel.gov/publications.
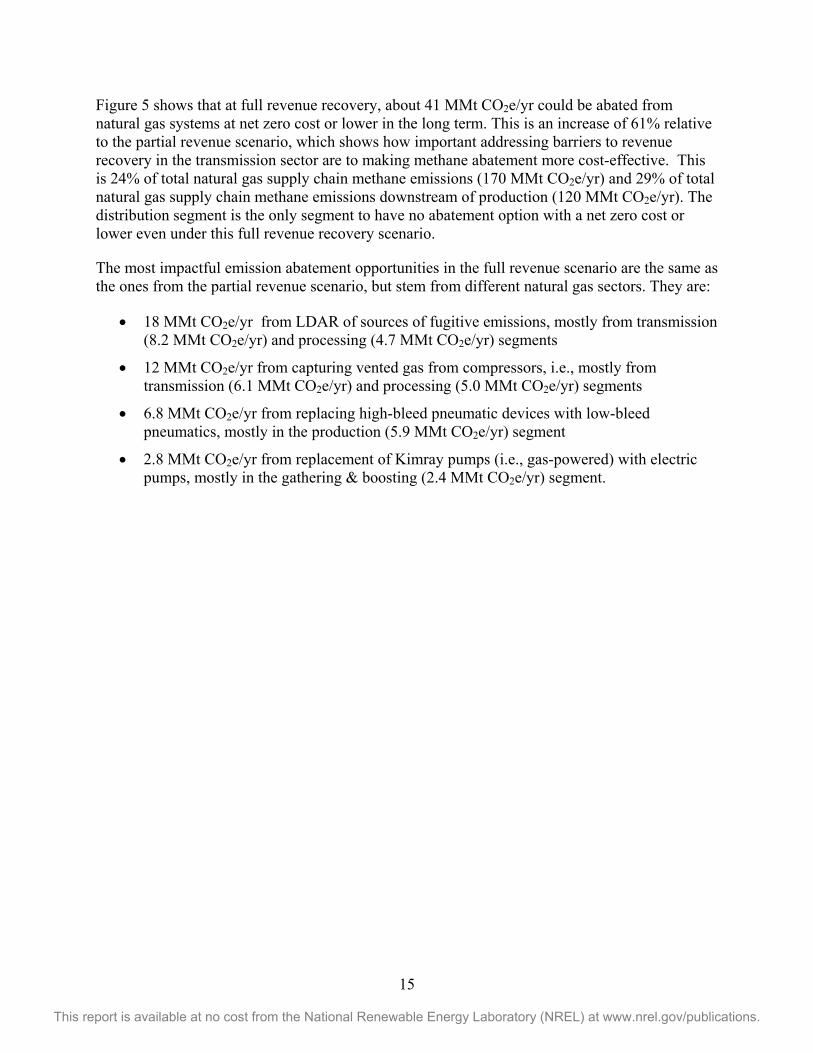
Figure 5 shows that at full revenue recovery, about 41 MMt CO2e/yr could be abated from natural gas systems at net zero cost or lower in the long term. This is an increase of 61% relative to the partial revenue scenario, which shows how important addressing barriers to revenue recovery in the transmission sector are to making methane abatement more cost-effective. This is 24% of total natural gas supply chain methane emissions (170 MMt CO2e/yr) and 29% of total natural gas supply chain methane emissions downstream of production (120 MMt CO2e/yr). The distribution segment is the only segment to have no abatement option with a net zero cost or lower even under this full revenue recovery scenario.
The most impactful emission abatement opportunities in the full revenue scenario are the same as the ones from the partial revenue scenario, but stem from different natural gas sectors. They are:
• 18 MMt CO2e/yr from LDAR of sources of fugitive emissions, mostly from transmission (8.2 MMt CO2e/yr) and processing (4.7 MMt CO2e/yr) segments
• 12 MMt CO2e/yr from capturing vented gas from compressors, i.e., mostly from transmission (6.1 MMt CO2e/yr) and processing (5.0 MMt CO2e/yr) segments
• 6.8 MMt CO2e/yr from replacing high-bleed pneumatic devices with low-bleed pneumatics, mostly in the production (5.9 MMt CO2e/yr) segment
• 2.8 MMt CO2e/yr from replacement of Kimray pumps (i.e., gas-powered) with electric pumps, mostly in the gathering & boosting (2.4 MMt CO2e/yr) segment.

16
This report is available at no cost from the National Renewable Energy Laboratory (NREL) at www.nrel.gov/publications.
Figure 5. Natural gas MACC separated by source and supply chain segment for the full revenue scenario in 2018. Labels indicate the emission source. Acronyms: intermittent (intermit.), pneumatic
(pneum.), local distribution company (LDC), liquid natural gas (LNG), reciprocating (recip.).
Sources: ICF 201432 33; EPA 2013b
Following ICF (2014), natural gas distribution segment methane emission abatement opportunities from pipeline replacement are not included in Figures 4, 5, or C-1 owing to their high cost. Average costs for cast iron pipeline, unprotected steel pipeline, and unprotected steel service line replacements were higher than LDAR to address LDC meters and regulators. LDAR of LDC meters and regulators is the least cost (and only) distribution-related emission abatement opportunity included in Figures 4, 5, and C-1, yet it is one of the most costly opportunities shown. According to EPA, cast iron pipe, unprotected steel pipe, and unprotected steel service line replacement opportunities could reduce emissions by about 3, 2.7, and 3.2 MMt CO2e/yr, respectively, at average costs of about $1,000, $2,300 and $165,000/t CO2e, respectively (EPA 2013a). The primary policy drivers for cast iron and bare steel pipeline replacement programs include safety, reliability, economic development, and employment goals (Yardley Associates
32 ICF data is a modification of data for 2011 from EPA (2013b). See Appendix B for an ICF and EPA comparison. Emissions abatement in 2018 and 2013 dollars is consistent with data reported in ICF (2014). 33 Conversion: 1 MMt CO2e = 0.04 MMt methane = 2.08 Bcf methane
17
This report is available at no cost from the National Renewable Energy Laboratory (NREL) at www.nrel.gov/publications.
2012). Reducing methane emissions is more typically viewed as a co-benefit, though increasingly recognized as an important policy driver.34
3.2 Combined Natural Gas, Oil, and Coal ICF-EPA Hybrid MACCs Figures 6, 7, and C-2 include methane emission sources from oil production, coal mining, and natural gas systems. These figures show both emission sources and the abatement method for reducing those emissions. Methane is emitted from vents along coal seams in the coal sector and during oil production in the oil sector.
Methane is emitted in oil production from similar sources (e.g., wells and pneumatic devices) as those in natural gas production. Many production sites co-produce oil and natural gas. Therefore, addressing a source of emissions in natural gas production or oil production is likely to reduce emissions from both fossil fuel systems even though opportunities from oil and natural gas production are reported separately in our MACCs and in the U.S. GHGI.
Figure 6 shows the partial revenue scenario, Figure 7 shows the full revenue scenario, and Figure C-2 in Appendix C shows the no revenue scenario. Figures 6, 7, and C-2 aggregate natural gas methane emission abatement potential from similar emitting components or activities across the natural gas supply chain. This aggregation of emission abatement opportunities is based on the “emission abatement opportunity” column in Appendix A Table A-1.
Aggregation of emissions abatement across the natural gas supply chain means Figures 6, 7, and C-2 will not match Figures 4, 5, and C-1. In Figures 6, 7, and C-2, marginal costs represent the costs to address a source of emissions in all segments of the natural gas supply chain rather than in one segment as shown in Figures 4, 5, and C-1. Thermal oxidation, flaring, and catalytic combustion-related opportunities do not change between these scenarios because these opportunities do not capture venting gas or reduce fugitives. Without gas recovery these opportunities do not have revenue streams and costs do not change.
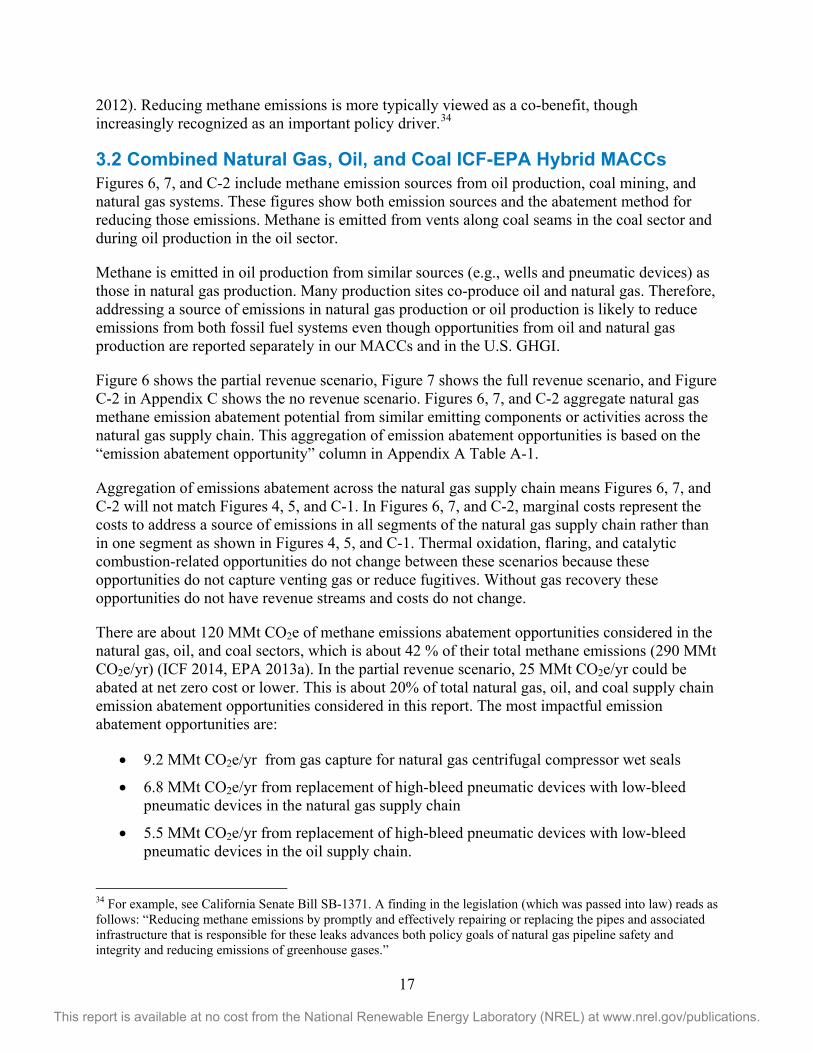
There are about 120 MMt CO2e of methane emissions abatement opportunities considered in the natural gas, oil, and coal sectors, which is about 42 % of their total methane emissions (290 MMt CO2e/yr) (ICF 2014, EPA 2013a). In the partial revenue scenario, 25 MMt CO2e/yr could be abated at net zero cost or lower. This is about 20% of total natural gas, oil, and coal supply chain emission abatement opportunities considered in this report. The most impactful emission abatement opportunities are:
• 9.2 MMt CO2e/yr from gas capture for natural gas centrifugal compressor wet seals
• 6.8 MMt CO2e/yr from replacement of high-bleed pneumatic devices with low-bleed pneumatic devices in the natural gas supply chain
• 5.5 MMt CO2e/yr from replacement of high-bleed pneumatic devices with low-bleed pneumatic devices in the oil supply chain.
34 For example, see California Senate Bill SB-1371. A finding in the legislation (which was passed into law) reads as follows: “Reducing methane emissions by promptly and effectively repairing or replacing the pipes and associated infrastructure that is responsible for these leaks advances both policy goals of natural gas pipeline safety and integrity and reducing emissions of greenhouse gases.”
18
This report is available at no cost from the National Renewable Energy Laboratory (NREL) at www.nrel.gov/publications.
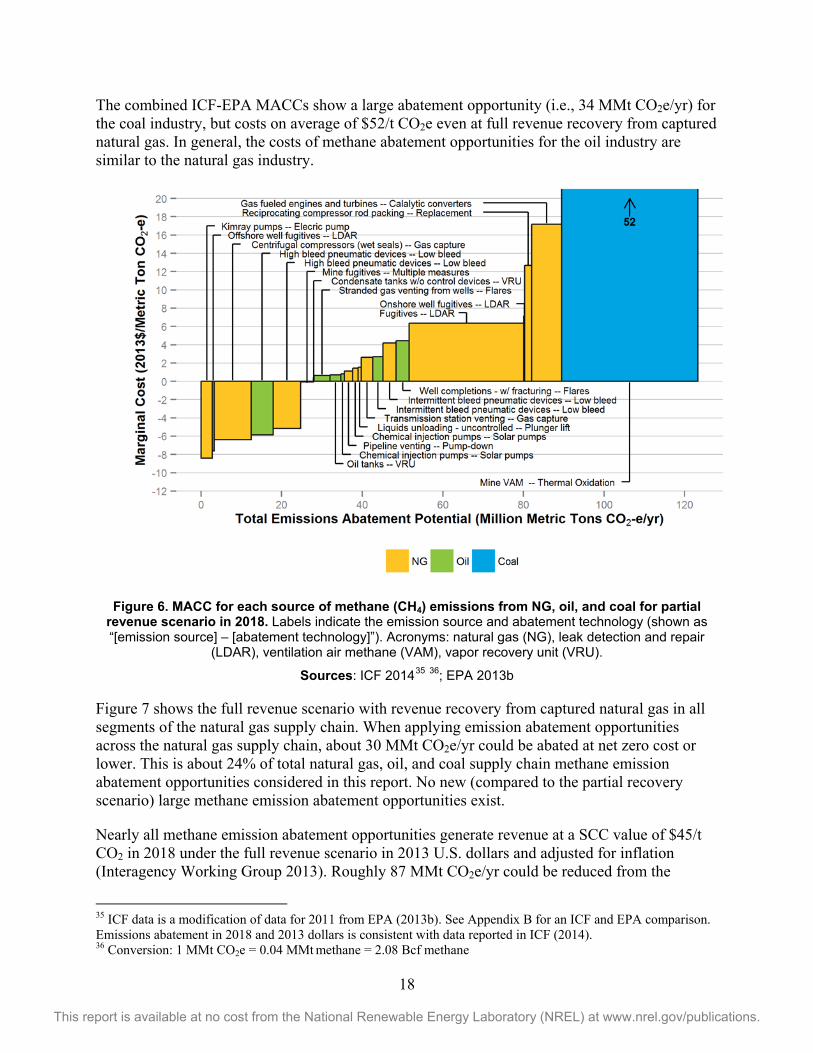
The combined ICF-EPA MACCs show a large abatement opportunity (i.e., 34 MMt CO2e/yr) for the coal industry, but costs on average of $52/t CO2e even at full revenue recovery from captured natural gas. In general, the costs of methane abatement opportunities for the oil industry are similar to the natural gas industry.
Figure 6. MACC for each source of methane (CH4) emissions from NG, oil, and coal for partial revenue scenario in 2018. Labels indicate the emission source and abatement technology (shown as “[emission source] – [abatement technology]”). Acronyms: natural gas (NG), leak detection and repair
(LDAR), ventilation air methane (VAM), vapor recovery unit (VRU).
Sources: ICF 201435 36; EPA 2013b
Figure 7 shows the full revenue scenario with revenue recovery from captured natural gas in all segments of the natural gas supply chain. When applying emission abatement opportunities across the natural gas supply chain, about 30 MMt CO2e/yr could be abated at net zero cost or lower. This is about 24% of total natural gas, oil, and coal supply chain methane emission abatement opportunities considered in this report. No new (compared to the partial recovery scenario) large methane emission abatement opportunities exist.
Nearly all methane emission abatement opportunities generate revenue at a SCC value of $45/t CO2 in 2018 under the full revenue scenario in 2013 U.S. dollars and adjusted for inflation (Interagency Working Group 2013). Roughly 87 MMt CO2e/yr could be reduced from the
35 ICF data is a modification of data for 2011 from EPA (2013b). See Appendix B for an ICF and EPA comparison. Emissions abatement in 2018 and 2013 dollars is consistent with data reported in ICF (2014). 36 Conversion: 1 MMt CO2e = 0.04 MMt methane = 2.08 Bcf methane

19
This report is available at no cost from the National Renewable Energy Laboratory (NREL) at www.nrel.gov/publications.
natural gas, oil, and coal at below the SCC. Abatement of coal mine VAM emissions through thermal oxidation is the one opportunity higher than the SCC.
Figure 7. MACC for each source of methane (CH4) emissions from NG, oil, and coal for full
revenue scenario in 2018. Labels indicate the emission source and abatement technology (shown as “[emission source] – [abatement technology]”). Acronyms: natural gas (NG), leak detection and repair
(LDAR), ventilation air methane (VAM), vapor recovery unit (VRU).
Sources: ICF 201437 38; EPA 2013b
37 ICF data is a modification of data for 2011 from EPA (2013b). See Appendix B for an ICF and EPA comparison. Emissions abatement in 2018 and 2013 dollars is consistent with data reported in ICF (2014). 38 Conversion: 1 MMt CO2e = 0.04 MMt methane = 2.08 Bcf methane

20
This report is available at no cost from the National Renewable Energy Laboratory (NREL) at www.nrel.gov/publications.
4 Areas for Future Analysis Improvement Our analysis is limited by the methane emission abatement opportunities examined in the ICF and EPA studies as well as data provided by those reports. Some example limitations noted in previous sections of this report that could be addressed in future analysis include (ICF 2014; EPA 2013a):
• Only analyzing methane emission abatement opportunities examined in recent studies by ICF and EPA. Other opportunities, both commercial and non-commercial, may exist that were not considered in those studies.
• Excluding several opportunities from EPA’s study that the ICF considered to be low impact or too expensive.
• Not harmonizing some assumptions that differed in the ICF and EPA studies, such as the inclusion of abatement costs of taxes and the tax benefits of capital depreciation in the EPA (but not the ICF) study.
Important limitations related to the underlying data of the ICF and EPA studies also exist. Addressing these limitations or quantifying uncertainty around these limitations would help improve future analysis of the opportunities for reducing methane emissions.
The U.S. GHGI is the primary data source for baseline methane emissions in the ICF and EPA studies (ICF 2014; EPA 2013a). The inventory is a critical tool for addressing climate change that provides the granularity in emissions data needed for a marginal abatement cost analysis. The accuracy of a GHG inventory depends on several assumptions, such as that all sources of emissions are assessed and the sample of emission sources is representative of the population of emitting sources during the year of the inventory. The natural gas sector has experienced large growth and changes in industry practices. New data are becoming available to improve our understanding of emissions—data that present challenges to maintaining a GHG inventory reflecting these changes (Brandt et al. 2014). The U.S. GHGI is steadily being improved, and considerable new research is being conducted (e.g., Allen et al. 2013) to improve the inventory (EPA 2014a). See Heath et al. (2015) for further details about approaches, uncertainties, current estimates, and future studies of methane from the natural gas supply chain. However, caution is warranted regarding interpretation of the results in this report given that variability and potential uncertainties in the underlying data sets used to construct MACCs are not represented in the MACCs.
Costs and methane emissions abatement from actual projects are highly variable and site-specific (ICF 2014). Abatement costs and benefits will also differ by region. MACCs in this report can only show estimated national average methane emission abatement potential and abatement costs for each emission reduction opportunity. Average emission abatement potential and abatement costs as presented in MACCs in this paper do not capture the large range in reported methane emission reduction costs and performances documented by the primary data source, the NG STAR program (EPA 2014c).
MACCs developed from the ICF and EPA reports assume representativeness of the data collected from NG STAR and other sources for the estimation of the national averages used in

21
This report is available at no cost from the National Renewable Energy Laboratory (NREL) at www.nrel.gov/publications.
this report. The NG STAR program is based on self-reported industry data with the potential sampling biases that occur from that, such as the lack of a representative sample of emission rates nationally or even regionally. Also, cost structure may change if costs of basic input materials (e.g., steel) or labor change. Costs for especially newer technologies are less reliable. Although potential efficiency improvement from some technologies (e.g., VAM thermal oxidation [EPA 2013a]) are known, additional cost reductions of abatement options may occur through repeated application (i.e., industrial learning) that may reduce the marginal abatement cost over time.
MACC analysis should be repeatedly updated in order to be most effective for informing policy. The U.S. GHGI is continuously being improved and considerable new research is being conducted to address challenges with the inventory. Updating MACCs so they are current and accurate at the time of decision making is important within the context of continual improvements in the U.S. GHGI and changes to technology costs over time.
Although this report discusses the social costs of carbon (Interagency Working Group 2013), the costs and benefits shown in MACCs do not consider many externalities such as wider macroeconomic benefits of capturing natural gas for use, the SCC, or environmental co-benefits of abating methane emissions. Several of these costs and benefits may be important to consider given that methane emission abatement opportunities are reported to have several co-benefits. As previously noted, emission reductions may be a co-benefit of pipeline replacement when considering safety and deliverability of the natural gas system. Another example is that the ICF projects large volatile organic compound (precursors to ozone formation) and hazardous air pollutant reduction co-benefits that come with reducing methane emissions (ICF 2014).

22
This report is available at no cost from the National Renewable Energy Laboratory (NREL) at www.nrel.gov/publications.
5 Conclusions Many opportunities to abate methane emissions exist, but the potential and cost-effectiveness of each opportunity can vary. MACCs constructed for this report integrate results from two recent MACC studies from EPA (2013a) and ICF (2014) and illustrate potential high impact, low cost opportunities for reducing methane emissions as well as the revenue conditions required for opportunities to be low-cost.
This report identifies approximately 120 MMt CO2e/yr of potential methane emissions from natural gas, oil, and coal systems. All of the natural gas and oil abatement opportunities (86 MMt CO2e) analyzed are cost-effective when compared to the social cost of emitting one ton of CO2 into the atmosphere.39 Across natural gas, oil, and coal 33 MMt CO2e/yr can be achieved at net zero cost or lower under a partial revenue scenario. Under the full revenue scenario many natural gas transmission measures become cost-effective, and thus the total net zero cost or lower potential increases to 49 MMt CO2e/yr. The large majority of the net zero cost or lower abatement opportunities are found in the natural gas supply chain, which accounts for 84% of the total net zero potential.
We identify 67 MMt CO2e/yr of cost-effective abatement potential across all segments of the natural gas supply chain. The majority of the potential, approximately 70%, is found downstream of production. Total abatement potential at net zero cost or lower is 25 or 41 MMt CO2e/yr depending on the revenue scenario40.
Four types of abatement measures account for a majority of the net zero cost or lower potential to reduce emissions within the natural gas supply chain:
• Leak detection and repair (LDAR) of sources of fugitive emissions
• Capturing vented gas from compressors
• Replacing Kimray pumps (i.e., gas-powered) with electric pumps
• Replacing high-bleed with low-bleed pneumatic devices
Reaching net zero costs or lower for methane abatement requires at least some revenue recovery from the sale of captured gas. More fully monetizing the revenue recovered from the sale of saved natural gas, for example in the transmission segment, reduces abatement costs.
Within the oil supply chain, we identify 19 MMt CO2e/yr of potential to abate methane emissions. These opportunities are found entirely within the production segment, and are largely related to the co-production of oil and natural gas.
39 The Interagency Working Group (2015) on the SCC estimated that in 2018 the damage of emitting one ton of carbon dioxide to be $45/t CO2e in 2013 dollars. 40 25 MMt CO2e/yr is for the partial revenue scenario and 41 MMt CO2e/yr is for the full revenue scenario.

23
This report is available at no cost from the National Renewable Energy Laboratory (NREL) at www.nrel.gov/publications.
Within the coal supply chain, methane abatement potential totals 37 MMt CO2e/yr and, like for oil, are entirely found within the production segment. Although the abatement potential is high, the abatement opportunities are generally more costly than those in the natural gas supply chain.41
41 For example, abatement of coal mine ventilation air methane (VAM) through thermal oxidation technology represents a large opportunity of about 34 MMt CO2e/yr, however, this opportunity would come at an estimated cost of on average $52/t CO2e across the U.S., which is significantly more expensive than opportunities available across the natural gas and oil supply chains.

24
This report is available at no cost from the National Renewable Energy Laboratory (NREL) at www.nrel.gov/publications.
6 References Allen, D.; Torres,V.M.; Thomas, J.; Sullivan, D.W.; Harrison, M.; Hendler, A.; Herndon, S.C.; Kolb, C.E.; Fraser, M.P.; Hill, D.; Lamb, B.K.; Miskimins, J.; Sawyer, R.F.; Seinfeld, J.H. (2013). “Measurements of Methane Emissions at Natural Gas Production Sites in the United States.” Proceedings of the National Academy of Sciences 110(44). Accessed December 2014: http://www.pnas.org/content/110/44/17768.abstract.
Bradbury, J.; Obeiter, M.; Draucker, L.; Stevens, A.; Wang, W. (2013). Clearing the Air: Reducing Upstream Greenhouse Gas Emissions from U.S. Natural Gas Systems. Washington, D.C.: World Resources Institute (WRI). Accessed November 2014: http://www.wri.org/publication/clearing-air.
Brandt, A.R.; Heath, G.A.; Kort, E.A.; O’Sullivan, F.; Pétron, G.; Jordaan, S.M.; Tans, P.; Wilcox, J.; Gopstein, A.M.; Arent, D.; Wofsy, S.; Brown, N.J.; Bradley, R.; Stucky, G.D.; Eardley, D.; Harriss, R. (2014). “Methane Leaks from North American Natural Gas Systems.” Science 343:6172; pp. 733-735. Accessed October 2014: http://www.sciencemag.org/content/343/6172/733.full.
Carbon Limits. (2014). Quantifying Cost-effectiveness of Systematic Leak Detection and Repair Programs Using Infrared Cameras. Report CL-13-27. Oslo, Norway: Carbon Limits. Accessed December 2014: http://www.catf.us/resources/publications/files/Carbon_Limits_LDAR.pdf.
Colorado Department of Public Health and Environment. (2014). Regulatory Analysis for Proposed Revisions to Colorado Air Quality Control Commission. Denver, CO: Colorado Department of Public Health and Environment. Accessed March 2015: http://www.epa.gov/airquality/oilandgas/2014papers/Attachment_GG_EDF.pdf.
Department of State. (2014). “United State Climate Action Report: 2014”. Washington, D.C.: DOS. Accessed December 2014: http://www.state.gov/e/oes/rls/rpts/car6/.
U.S. Department of Energy (DOE). (2014a). Methane Stakeholder Roundtables. Washington, D.C. Accessed January 2015: http://energy.gov/epsa/articles/methane-stakeholder-roundtables.
DOE. (2014b). Natural Gas Infrastructure Modernization. Washington, D.C. Accessed January 2015: http://energy.gov/epsa/natural-gas-infrastructure-modernization.
DOE. (2015). The Quadrennial Energy Review: Energy Transmission, Storage, and Distribution Infrastructure. Washington, D.C.: DOE. Accessed June 2015: http://energy.gov/epsa/quadrennial-energy-review-qer.
U.S. Energy Information Administration (EIA). (2014a). “About U.S. Natural Gas Pipelines.” Washington, D.C.: EIA. Accessed October 2014: http://www.eia.gov/pub/oil_gas/natural_gas/analysis_publications/ngpipeline/index.html.
EIA. (2014b). Annual Energy Outlook (AEO) 2014 with projections to 2040. DOE/EIA 0383(2014). Accessed October 2014: http://www.eia.gov/forecasts/aeo/pdf/0383(2014).pdf.

25
This report is available at no cost from the National Renewable Energy Laboratory (NREL) at www.nrel.gov/publications.
U.S. Environmental Protection Agency (EPA). (2003). Directed Inspection and Maintenance at Gate Stations and Surface Facilities. Washington, D.C.: Environmental Protection Agency. Accessed March 2015: http://epa.gov/gasstar/documents/ll_dimgatestat.pdf.
EPA. (2007). Leak Detection and Repair: Best Practices. Washington, D.C.: Environmental Protection Agency. Accessed March 2015: http://nepis.epa.gov/Exe/ZyPDF.cgi/P10008TU.PDF?Dockey=P10008TU.PDF.
EPA. (2011). Reduced Emissions Completions for Hydraulically Fractured Natural Gas Wells. Washington, D.C.: Environmental Protection Agency. Accessed March 2015: http://epa.gov/gasstar/documents/reduced_emissions_completions.pdf.
EPA. (2012). Inventory of U.S. Greenhouse Gas Emissions and Sinks: 1990-2010. Washington, D.C.: EPA. Accessed November 2014: http://www.epa.gov/climatechange/Downloads/ghgemissions/US-GHG-Inventory-2012-Main-Text.pdf.
EPA. (2013a). Global Mitigation of Non-CO2 Greenhouse Gases: 2010-2030. Washington, D.C.: EPA. Accessed September 2014: http://www.epa.gov/climatechange/Downloads/EPAactivities/MAC_Report_2013.pdf.
EPA. (2013b). Inventory of U.S. Greenhouse Gas Emissions and Sinks: 1990-2011. Washington, D.C.: EPA. Accessed November 2014: http://www.epa.gov/climatechange/Downloads/ghgemissions/US-GHG-Inventory-2013-Main-Text.pdf.
EPA. (2014a). Inventory of U.S. GHG Emissions and Sinks: 1990-2012. EPA 430-R-14-003. Washington, D.C.: EPA. Accessed October 2014: http://www.epa.gov/climatechange/Downloads/ghgemissions/US-GHG-Inventory-2014-Main-Text.pdf.
EPA. (2014b). 2011-2012-2013 GHGRP Industrial Profiles: Petroleum and Natural Gas Systems. Washington, D.C.: EPA. Accessed September 2014: http://www.epa.gov/ghgreporting/documents/pdf/2014/documents/Subpart-W-2013-Data-Summary.pdf.
EPA. (2014c). “Natural Gas STAR Program: Recommended Technologies and Practices.” Washington, D.C.: EPA. Accessed November 2014: http://www.epa.gov/gasstar/tools/recommended.html.
EPA. (2015a). DRAFT Inventory of U.S. GHG Emissions and Sinks: 1990-2013. EPA 430-R-13-001. Washington, D.C.: EPA. Accessed March 2015: http://www.epa.gov/climatechange/Downloads/ghgemissions/US-GHG-Inventory-2013-Main-Text.pdf.
EPA. (2015b). Methane: Addressing Greenhouse Gases and Smog forming VOCs from the Oil and Gas Industry. Washington, D.C.: EPA. Accessed March 2015: http://www.epa.gov/airquality/oilandgas/methane.html.

26
This report is available at no cost from the National Renewable Energy Laboratory (NREL) at www.nrel.gov/publications.
Federal Register. (2014). Part II Environmental Protection Agency. 40 CFR Part 98, Subpart A, Table A-1. Accessed December 2014: http://www.ecfr.gov/cgi-bin/text-idx?tpl=/ecfrbrowse/Title40/40cfr98_main_02.tpl.
U.S. Government Publishing Office. (2014). “Title 40—Protection of Environment.” Electronic Code of Federal Regulations (e-CFR). Accessed September 2014: http://www.ecfr.gov/cgi-bin/text-idx?SID=b5e4cc54150e98d36e9aed450257d1cd&tpl=/ecfrbrowse/Title40/40chapterI.tpl.
Harvey, S.; Gowrishankar, V.; Singer, T. (2012). Leaking Profits: The U.S. Oil and Gas Industry Can Reduce Pollution, Conserve Resources, and Make Money by Preventing Methane Waste. New York, NY: National Resources Defense Council (NRDC). Accessed September 2014: http://www.nrdc.org/energy/files/Leaking-Profits-Report.pdf.
Heath, G.; Warner, E.; Steinberg, D.; Brandt, A. (2015). Estimating U.S. Greenhouse Gas Emissions from the Natural Gas Supply Chain: Approaches, Uncertainties, Current Estimates and Future Studies. NREL/TP-6A50-62820. Golden, CO, USA: National Renewable Energy Laboratory.
ICF International (ICF). (2014). Economic Analysis of Methane Emission Reduction Opportunities in the U.S. Onshore Oil and Natural Gas Industries. Fairfax, VA: ICF. Accessed September 2014: https://www.edf.org/sites/default/files/methane_cost_curve_report.pdf.
Intergovernmental Panel on Climate Change (IPCC). (1995). Climate Change 1995: The Science of Climate Change. J. T. Houghton et al., Eds. Cambridge Univ. Press, Cambridge.
IPCC. (2007). Fourth Assessment Report (AR4). Geneva, Switzerland: IPCC. Accessed August 2014: http://www.ipcc.ch/report/ar4/.
IPCC. (2013). Climate Change 2013: The Physical Science Basis. Geneva, Switzerland: IPCC. Accessed September 2014: https://www.ipcc.ch/report/ar5/wg1/.
Interagency Working Group on Social Cost of Carbon. (2015). Technical Support Document: Update of the Social Cost of Carbon for Regulatory Impact Analysis- Under Executive Order 12866. Accessed July 2014: https://www.whitehouse.gov/sites/default/files/omb/inforeg/scc-tsd-final-july-2015.pdf.
Paranhos, E.; Kozak, T.G.; Boyd, W.; Bradbury, J.; Steinberg, D.C.; Arent, D.J. (2015). Controlling Methane Emissions in the Natural Gas Sector – A Review of Federal & State Regulatory Frameworks Governing Production, Processing, Transportation, and Distribution. Joint Institute for Strategic Energy Analysis. NREL/TP-6A50-63416. April 2015. http://energy.gov/epsa/qer-document-library.
United Nations Framework Convention on Climate Change (UNFCCC). (1998). Kyoto Protocol to the United Nations Framework Convention on Climate Change, Kyoto, Japan.

27
This report is available at no cost from the National Renewable Energy Laboratory (NREL) at www.nrel.gov/publications.
United Nations Framework Convention on Climate Change (UNFCCC). (2014). Revision of the UNFCCC reporting guidelines on annual inventories for Parties included in Annex I to the Convention.
The White House. (2014). “Climate Action Plan: Strategy to Reduce Methane Emissions.” Washington, D.C.: The White House, Office of the Press Secretary. Accessed January 2015: https://www.whitehouse.gov/sites/default/files/strategy_to_reduce_methane_emissions_2014-03-28_final.pdf.
The White House. (2015). “Fact Sheet: Administration Takes Steps Forward on Climate Action Plan by Announcing Actions to Cut Methane Emissions.” Washington, D.C.: The White House, Office of the Press Secretary. Accessed January 2015: http://www.whitehouse.gov/the-press-office/2015/01/14/fact-sheet-administration-takes-steps-forward-climate-action-plan-anno-1.
Yardley Associates. (2012). Gas Distribution Infrastructure: Pipeline Replacement and Upgrades. Cost Recovery Issues and Approaches. Prepared for The American Gas Foundation. Accessed June, 2015: https://opsweb.phmsa.dot.gov/pipelineforum/docs/07-2012%20Gas%20Distribution%20Infrastructure%20-%20Pipeline%20Replacement%20and%20Upgrades.pdf.

28
This report is available at no cost from the National Renewable Energy Laboratory (NREL) at www.nrel.gov/publications.
Appendix A. Summary of Potential Methane Emissions Abatement Table A-1 represent disaggregated natural gas data used in other tables and figures of this report. Table 2 as well as figures 4, 5, and C-1 are based on data aggregation by the “emission source” column. Table 2 and Figures 6, 7, and C-2 are based on data aggregation by the “emission abatement opportunity” column.
Table A-1. Summary of potential methane (CH4) emission abatement by source, opportunity, and category in 2018 by supply chain segment. Acronyms: production (PD), gathering and boosting (G&B), processing (Prod), transmission (T), storage (S), liquefied natural gas
(LNG), and distribution (D), leak detection and repair (LDAR), vapor recovery units (VRU), local distribution company (LDC).
Emission Source Emission Abatement Opportunity Prod. Gath & Boost Proc. Trans. Stor. LNG Dist.
Subtotal: Downstream of
Production TOTAL
Well fugitives LDAR 5.8 0 5.8 Compressor station fugitives LDAR 1.6 1.3 0.7 3.8 3.8
Reciprocating compressor fugitives LDAR 1.8 4.7 6.8 1.5 0.7 15 15 LDC meters & regulator fugitives LDAR 3.4 3.4 3.4
Centrifugal compressors (wet seals) Gas Capture 0.6 5.0 3.2 0.4 9.2 9.2 Transmission station venting Gas Capture 2.8 2.8 2.8
Pipeline venting Pump-down prior to maintenance 2.0 2.0 2.0 Kimray (gas-powered) pumps Replacement w/ electric pumps 0.4 2.4 >0.0 2.4 2.8
Liquids unloading - uncontrolled Replacement w/ plunger lifts 0.8 0.0 0.8 Chemical injection pumps Replacement w/ solar pumps 1.4 0.0 1.4
Reciprocating compressor rod packing Replacement 0.3 0.2 0.9 0.2 0.1 1.7 1.7 High-bleed pneumatic devices Replacement w/ low-bleed pneumatic devices 5.9 0.3 0.4 0.2 0.9 6.8
Intermittent bleed pneumatic devices Replacement w/ low-bleed pneumatic devices 2.7 0.1 0.3 0.1 0.5 3.3 Condensate tanks w/o control devices Replacement w/ VRU 0.2 0.2 0.2
Gas fueled engines and turbines Catalytic converters 3.0 * 1.8 2.6 4.4 7.4 TOTAL 20 7.2 12 21 3.1 0.8 3.4 47 67
* EPA data does not separate gathering and boosting data from production. Sources: ICF 201442 43; EPA 2013b
42 ICF data is a modification of data for 2011 from EPA (2013b). See Appendix B for an ICF and EPA comparison.

29
This report is available at no cost from the National Renewable Energy Laboratory (NREL) at www.nrel.gov/publications.
Appendix B. Comparison of EPA and ICF Inventories Figure B-1 shows how EPA’s 2013 inventory for 2011 differs from the ICF’s inventory.
Figure B-1. Comparison of the EPA and ICF GHG emissions inventories for 2011. Acronyms: prod (production) gathering and boosting (gath&boost), liquified natural gas (LNG), processing (proc), production (prod), storage (stor), transmission (trans), distribution (dist).
Source: ICF 201444
43 Conversion: 1 MMt CO2e = 0.04 MMt methane = 2.08 Bcf methane 44 ICF data is a modification of data for 2011 from EPA (2013b).

30
This report is available at no cost from the National Renewable Energy Laboratory (NREL) at www.nrel.gov/publications.
Appendix C. Supplemental MACCs
Figure C-1. Natural gas MACC separated by source and supply chain segment for the no revenue
scenario in 2018. Labels indicate the emission source. Acronyms: intermittent (intermit.), pneumatic (pneum.), local distribution company (LDC), liquid natural gas (LNG), reciprocating (recip.).
Sources: ICF 201445 46; EPA 2013b
45 ICF data is a modification of data for 2011 from EPA (2013b). See Appendix B for an ICF and EPA comparison. Emissions abatement in 2018 and 2013 dollars is consistent with data reported in ICF (2014). 46 Conversion: 1 MMt CO2e = 0.04 MMt methane = 2.08 Bcf methane

31
This report is available at no cost from the National Renewable Energy Laboratory (NREL) at www.nrel.gov/publications.
Figure C-2. MACC for each source of methane (CH4) emissions from natural gas, oil, and coal for
the no revenue scenario in 2018. Labels indicate the emission source and abatement technology (shown as “[emission source] – [abatement technology]”). Acronyms: natural gas (NG), leak detection and
repair (LDAR), ventilation air methane (VAM), vapor recovery unit (VRU).
Sources: ICF 201447 48; EPA 2013b
47 ICF data is a modification of data for 2011 from EPA (2013b). See Appendix B for an ICF and EPA comparison. Emissions abatement in 2018 and 2013 dollars is consistent with data reported in ICF (2014). 48 Conversion: 1 MMt CO2e = 0.04 MMt methane = 2.08 Bcf methane
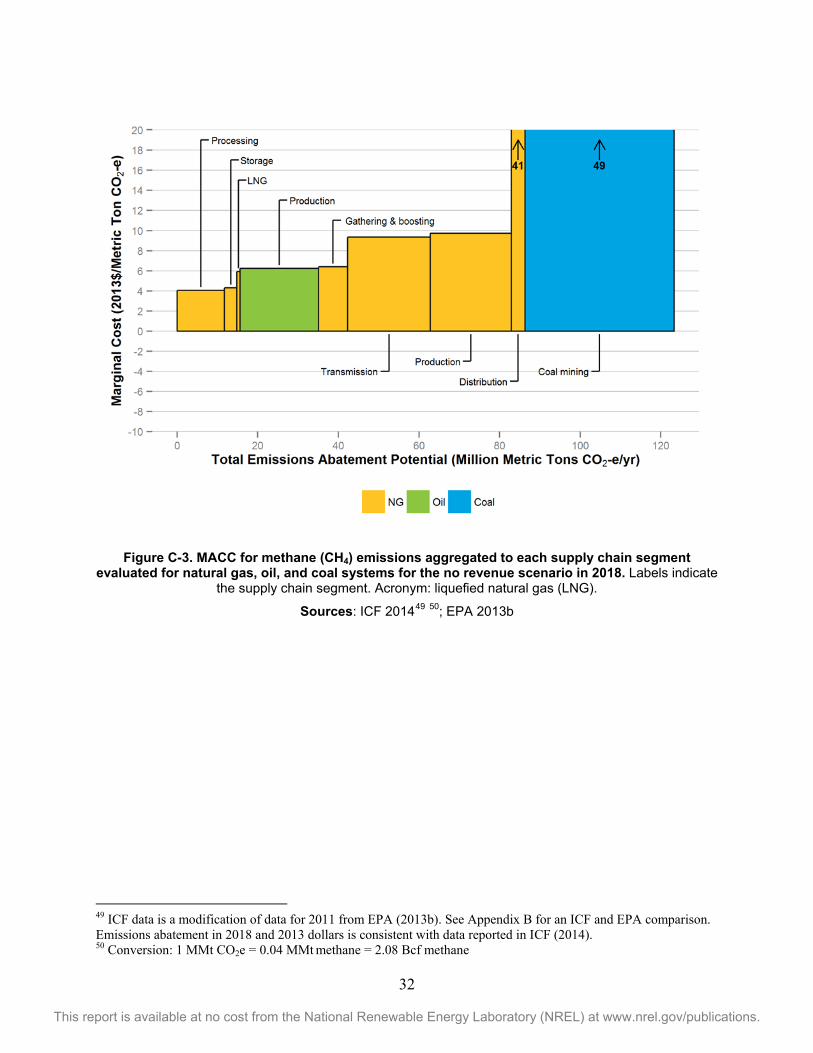
32
This report is available at no cost from the National Renewable Energy Laboratory (NREL) at www.nrel.gov/publications.
Figure C-3. MACC for methane (CH4) emissions aggregated to each supply chain segment
evaluated for natural gas, oil, and coal systems for the no revenue scenario in 2018. Labels indicate the supply chain segment. Acronym: liquefied natural gas (LNG).
Sources: ICF 201449 50; EPA 2013b
49 ICF data is a modification of data for 2011 from EPA (2013b). See Appendix B for an ICF and EPA comparison. Emissions abatement in 2018 and 2013 dollars is consistent with data reported in ICF (2014). 50 Conversion: 1 MMt CO2e = 0.04 MMt methane = 2.08 Bcf methane

33
This report is available at no cost from the National Renewable Energy Laboratory (NREL) at www.nrel.gov/publications.
Figure C-4. MACC for methane (CH4) emissions aggregated to each supply chain segment
evaluated for natural gas, oil, and coal systems for the partial revenue scenario in 2018. Labels indicate the supply chain segment. Acronym: liquefied natural gas (LNG).
Sources: ICF 201451 52; EPA 2013b
51 ICF data is a modification of data for 2011 from EPA (2013b). See Appendix B for an ICF and EPA comparison. Emissions abatement in 2018 and 2013 dollars is consistent with data reported in ICF (2014). 52 Conversion: 1 MMt CO2e = 0.04 MMt methane = 2.08 Bcf methane
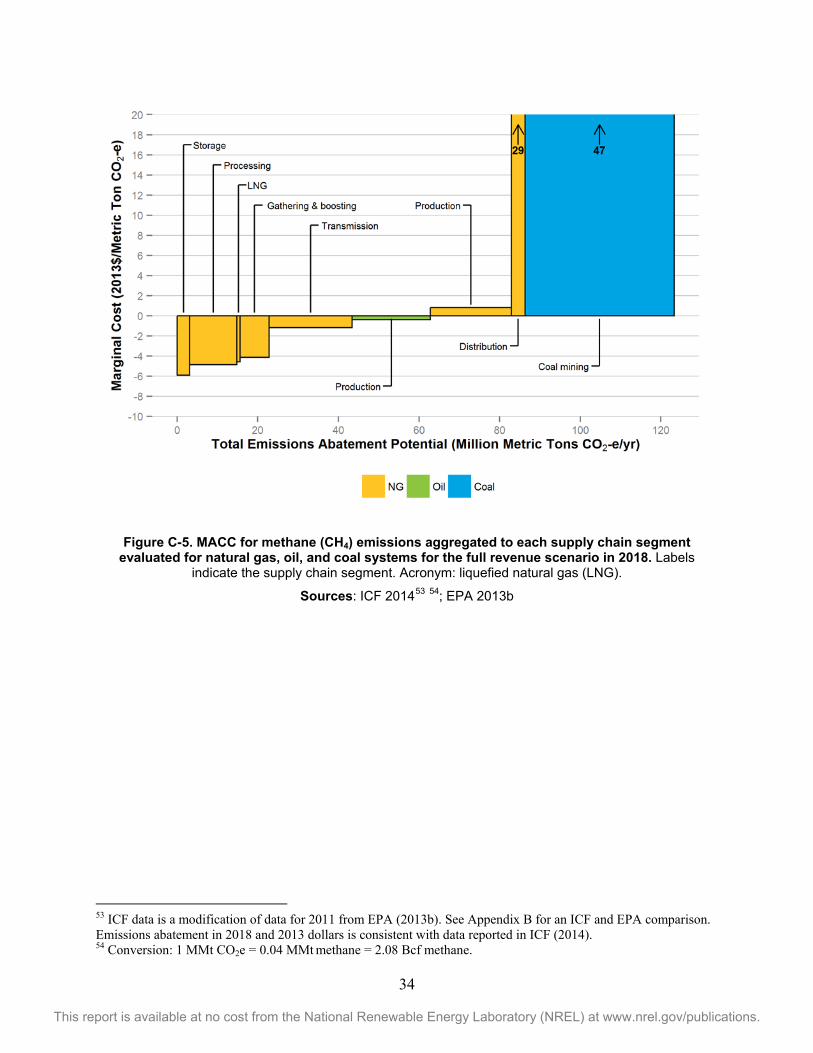
34
This report is available at no cost from the National Renewable Energy Laboratory (NREL) at www.nrel.gov/publications.
Figure C-5. MACC for methane (CH4) emissions aggregated to each supply chain segment
evaluated for natural gas, oil, and coal systems for the full revenue scenario in 2018. Labels indicate the supply chain segment. Acronym: liquefied natural gas (LNG).
Sources: ICF 201453 54; EPA 2013b
53 ICF data is a modification of data for 2011 from EPA (2013b). See Appendix B for an ICF and EPA comparison. Emissions abatement in 2018 and 2013 dollars is consistent with data reported in ICF (2014). 54 Conversion: 1 MMt CO2e = 0.04 MMt methane = 2.08 Bcf methane.