potential impact of electric vehicles on the electric supply system
TRANSCRIPT

EUR 23975 EN 2009
Potential Impact of Electric Vehicles on theElectric Supply System
A case study for the Province of Milan Italy
A Perujo B Ciuffo
The mission of the JRC-IES is to provide scientific-technical support to the European Unionrsquos policies for the protection and sustainable development of the European and global environment European Commission Joint Research Centre Institute for Environment and Sustainability Contact information Adolfo Perujo Address Via Enrico Fermi 2749 - TP441 Ispra (VA) E-mail AdolfoPERUJOeceuropaeu Tel +39 (0332)785175 Fax +39 (0332)785236 httpiesjrceceuropaeu httpwwwjrceceuropaeu Legal Notice Neither the European Commission nor any person acting on behalf of the Commission is responsible for the use which might be made of this publication
Europe Direct is a service to help you find answers to your questions about the European Union
Freephone number ()
00 800 6 7 8 9 10 11
() Certain mobile telephone operators do not allow access to 00 800 numbers or these calls may be billed
A great deal of additional information on the European Union is available on the Internet It can be accessed through the Europa server httpeuropaeu JRC 53390 EUR 23975 EN ISBN 978-92-79-13179-0 ISSN 1018-5593 DOI 10278831623 Luxembourg Office for Official Publications of the European Communities copy European Communities 2009 Reproduction is authorised provided the source is acknowledged Printed in Italy
Summary Mobility of persons and goods is an essential component of the competitiveness of European industry and services as well as an essential citizen right The goal of the EUs sustainable transport policy is to ensure that our transport systems meet societys economic social and environmental needs
The transport sector is responsible for about 30 of the total final energy consumption and for about 25 of the total CO2 emissions In particular the contribution of road transport is very high (around 80 and 70 respectively) These simple data shed light on the necessity to move towards a more sustainable transportation system but also suggest that a technologicalsystemic revolution in the field will positively impact the overall worldrsquos sustainable development
From a technological point of view a lower dependency from not renewable energy sources (ie fuel oil) of the road transport is the main anticipated change In particular electric engines possibly represent the natural vehicle evolution in this direction Indeed they have much higher energy efficiency (around three times that of internal combustion engines ICE) and do not produce any kind of tailpipe emissions How the electricity will be supplied to the vehicles is still unpredictable due to the too many existing uncertainties on the future development but the electrification of the drive train will contribute to having alternative energy paths to reduce the nearly total dependency on crude oil In particular vehicle range and performances allowed by the different possibilities will play a key role on the debate
At the moment a great attention is attracted by electric vehicles both hybrid and not that will allow users to recharge their vehicles directly at home This kind of vehicle can represent a real future alternative to the ICE vehicles in particular for what concerns the daily commuting trips (whose range is quite low) It is therefore important to understand what might be the impact on the electric supply system capabilities of this recharging activity
In this light the present study carries out an analysis of this impact for the Province of Milan (of particular relevant due the very high daily commuting trips) at a 2030 time horizon Key issue of the analysis is the estimation of a potential market share evolution for the electric vehicles The results obtained show that even with a very high future market penetration the impact of the vehicles on the annual energy consumption will be quite negligible On the contrary they also show that without an appropriate regulation (eg the intelligent integration of electric vehicles into the existing power grid as decentralised and flexible energy storage) they could heavily impact on the daily electric power requirements
Table of Contents
Introduction 6
Plug‐in Battery Electric Vehicles ndash Available fleet and potential market 7
Available Plug-in Electric Vehicles ndash Main technical features 7 Potential electric vehicle market penetration and its evolution 9
Expected impact of the electric vehicles fleet on the electric consumption of the Province of Milan 13
Demand of electricity and its evolution in Italy and in the Province of Milan 13 Electric energy required by the electric vehicles fleet to the electric grid of the Province of Milan 14 Electric power required by the electric vehicles fleet to the electric grid of the Province of Milan 16
Concluding remarks and further research 20
References 21
List of Tables Table 1 Main features of the fully electric vehicles (cars and light duty vehicles) already present in the market 7
Table 2 Simplified classification for the Electric Vehicles 8
Table 3 Estimated electric power required by each vehicle category to be recharged 8
Table 4 OriginDestination car matrix for the Province of Milan in the year 2001 (source Istat 2005 Data refer to people who made the trip with their own car as a driver) 11
Table 5 Car fleet composition by engine size (source ACI 2001-2008) 12
Table 6 Absolute and relative electric energy consumption in the Province of Milan Lombardia Region and Italy (source Terna 2007abc in italics data estimated by the authors) 14
Table 7 Average distance travelled in different geographical context (source Isfort 2008) In bold typeface the values estimated by the authors 14
Table 8 Electric vehicles energy consumption in the Province of Milan for the year 2030 ndash Scenario 1 15
Table 9 Electric vehicles energy consumption in the Province of Milan for the year 2030 ndash Scenario 2 15
Table 10 Electric vehicles energy consumption in the Province of Milan for the year 2030 ndash All Scenarios 16
Table 11 Incidence of the electric power peak daily request by the electric fleet for the year 2030 ndash All Scenarios 16 List of Figures Figure 1 Market share evolution for MethaneLPG powered cars (source ACI 2000-2008) and impacts of oil price and Italian national incentives 10
Figure 2 Actual (source ACI 2000-2008) and estimated trend for the MethaneLPG powered car market share 11
Figure 3 Car fleet evolution in the Lombardia Region (source ACI 2000-2008) 12
Figure 4 Actual and estimated yearly energy consumption for the Lombardia Region (source Terna 2007b ) 13
Figure 5 Average daily trend for the Electric Power load on Italian grid per each month(source Terna 2007c) 14
Figure 6 Average and maximum impact on the electric power request profile during the winter months Scenario 1 17
Figure 7 Average and maximum impact on the electric power request profile during the winter months Scenario 2 17
Figure 8 Average and maximum impact on the electric power request profile during the winter months Scenario 3 ndash Electric fleet share = 5 18
Figure 9 Average and maximum impact on the electric power request profile during the winter months Scenario 3 ndash Electric fleet share = 25 18
Introduction Mobility of persons and goods is an essential component of the competitiveness of European industry and services mobility is also an essential citizenrsquos right The goal of the EUs sustainable transport policy is to ensure that our transport systems meet societys economic social and environmental needs as highlighted by the mid-term review of the 2001 White Paper Keep Europe moving (EU 2006) Effective transportation systems are essential for Europes prosperity having significant impacts on economic growth social development and the environment In 2004 the transport sector consumed 30 of the total final energy consumption (of which 82 is due to road transport) and it was responsible for 25 of CO2 emissions (EU-25) In 2003 road transport constituted about 80 of total transport demand Road transport accounts for 71 of transport related CO2 emissions and passenger cars constitute 63 of these road transport related CO2 emissions Road transport is also nearly totally dependent of fuel oil making it very sensitive to foreseeable shortage of crude oil (security of energy supply) At present the reciprocating internal combustion engines (ICE) either as homogeneous charge spark ignition (gasoline engines) or stratified charge compression ignition (diesel engines) dominates the drive trains of road vehicles The market shares of these two technologies at present is about 5050 however the market share of diesel vehicles is likely to further increase in the near future because of their better fuel economy Gains in energy efficiency are still possible however after years of large gains presently small incremental improvements are foreseen by technical development of this current state-of-the-art technology The above mentioned sensitivity of present technologies to shortages of crude oil and the necessity to reduce Greenhouse Gas (GHG) emissions without loosing the competitiveness of the European industry is forcing a demand of new technological approaches to secure sustainable future mobility In road transport vehicles running with Biofuels blend already exist and modified and new power-trains concepts are underdevelopments to accommodate a high degree of Biofuels Well-to-Wheel (WtW) and Life Cycle Assessments (LCA) studies need to be considered in selecting the future energy sources the feasible fuels and the vehicle technology Electrification of drive trains might offer a step change technology based on its excellent WtW energy efficiency an ICE car requires an average of 40kWhday versus the 10kWhday for an electric vehicle (MacKay 2009) This tendency will also open the possibility to use alternative energy paths to secure mobility (security of energy supply) making the road transport more independent from crude oil Also the intelligent integration of electric vehicles into the existing power grid as decentralised and flexible energy storage (V2G concept eg see httpwwwsmartgridseu) might offer new possibilities to the global management of electric energy offer and demand However one could wonder what might be the impact of the electrical vehicle market penetration in the electrical energy and power requirements of the European electrical grid Further is their penetration a possible issue for utility providers and grid operators in terms of generating and distributing capacity Previous studies on this topic has forecast a very optimistic (in the opinion of the authors) market penetration for this type of vehicle in the 2030 horizon The present study aims to define a methodology to calculate the possible impact of electric vehicles in the European electrical grid in terms of energy and power requirement adopting three different hypotheses on the market penetration of these vehicles Indeed since too many degrees of freedom affect the problem the basic idea is to use as a reference the market evolution of a category of vehicles which can appear to the possible customer very similar to electric vehicles ie the methane (CNG) and Liquefied Petroleum Gas (LPG) powered vehicles and then hypothesize different correlated scenarios As a first step and as testing benchmark the case study of Milan and its hinterland (the province of Milan) has been taken as subject of the study Further model refining and access to real data of other European metropolitan areas will make possible to extend the present study to a European-wide approach with a better and realistic study of the possible impact to the European electrical grid in terms of energy and power requirements
Battery Electric Vehicles ndash Available fleet and potential market Key issues for estimating the potential impact of electric vehicles on the electrical grid and in particular on the whole electric consumption are i) the identification of the main technical features for the available (short to medium term) fleet of vehicle and ii) the estimation of the potential market penetration evolution of these vehicles in the next years Because of the data available at this stage are very limited due the very few vehicles using the full electric technology all the conclusions that can be drawn should be taken with the appropriate reservations In addition depending also on the future market response new developments in the electric vehicles technological (eg on the battery performances on the vehicles efficiency and so on) as well as on alternative technologies can also substantially modify future trends in unexpected ways Despite all the possible uncertainties there are several works claiming a very favourable market development of electric vehicle (actually at the moment this regards mainly PHEVs ie the Plug-in Hybrid Electric Vehicle but with the increasing of the distance range of battery electric cars ndashBEV- the same can be expected also in this case) In this study all the works carried out during the last years will be taken in consideration even if the results that will be presented will follow an autonomous path Available Electric Vehicles ndash Main technical features
The analysis of the technical features of the electric vehicles already available or that will be available in the next years is fundamental in order to understand their potential penetration in the market Information like their distance range battery capacity energy consumption and others are important to define which kind of commuters can be attracted to using them In particular one of the main limitations for full electric cars is the distance they are able to cover without the need of recharging (operation that at the moment requires several hours) At the moment this distance very hardly reaches the 150km and this connected to their unlimited possibility of use in the centre of the main European cities makes them particularly suitable for urban utilization At the same time the main cities and their metropolitan areas are also the most electric energy consuming areas and therefore they are the one which can particularly suffer from the electrical energy requirements of these vehicles This is also the reason why in this study the Province of Milan has been chosen as case study being one of the most important urbanized area in Italy
Brand Model
Capacity(kWh)
Range (km)
Consumption (kWh100km)
Classification
Data Source
Renault Twingo Quickshift E 2145 129 1660Medium httpwwwateaittwingo‐elettrichehtm
Fiat Panda 1968 120 1640Medium httpwwwateaitpanda‐elettrichehtm
NICE Mega City 1050 80 1305Small httpwwwnicecarcompanycouk
FIAT 500 2200 113 1953Medium httpwwwitaliaspeedcom
Mitsubishi i‐MIEV 2000 160 1250Medium httpwwwmitsubishi‐motorscom
MINI MINI‐E 3500 180 1944Big httpwwwminiusacomminie‐usa
TESLA RoadsterModel S 5500 300 1833Big httpwwwteslamotorscom
CODA CODA‐EV 3380 180 1878Big httpwwwcodaautomotivecom
Lighting GTS 3500 175 2000Big httpwwwlightningcarcompanycouk
MILES ZX40SZX40ST 1000 105 956Small httpwwwmilesevcom
Cars
Phoenix SUVSUT 3500 209 1673Medium httpwwwphoenixmotorcarscom
AIKegrave ATX 840 70 1200LDV httpwwwalkecomelectric‐vehicleshtml
Piaggio Porter 2574 110 2340LDV httpwwwchvtlpiaggiocomporter_elhtm
Light D
uty
Vehicles
LDV Maxus Electric 160 LDV httpwwwldvcom
Table 1 Main features of the fully electric vehicles (cars and light duty vehicles) already present in the market
A non exhaustive list of available vehicle models is reported in Table 1 By analyzing the vehicle features it was possible to roughly individuate three main car categories based on their battery capacity and on their distance range This is important because data concerning the composition of the Milanrsquos vehicular fleet are available and thus in the evaluations the different features of the different classes have been taken into consideration These features are summarized in Table 2
Recharging time
Size Capacity (kWh) Range (km) Consumption (kWh100km) Standard (h) Industrial (min)
Small 10 100 1000 5 10 Mid‐size 20 130 1538 5 10 Ca
rs
Large 35 180 1944 5 10 Light Duty Vehicles 20 100 2000 5 10
Table 2 Simplified classification for the Electric Vehicles
For these data the expected technological improvement have already been considered Information provided by the AltairNano for the NanoSafe batteries already on Lighting and Phoenix cars
In this table is reported also the expected recharging time This is very important to evaluate the electric power required by the vehicle fleet However this information varies from model to model An average value of 5 hours has been considered in this study to take also into account the future technological developments In addition the AltairNano (httpwwwaltairnanocom) has presented a new technology allowing a 10 minutes charging time without affecting the battery performances and duration by means of an industrial plug-in system Such system is already available in some of the car models listed in Table 1 and thus it represents something more than a simple future perspective Since it can also influence the electric power required by the vehicular fleet this fast-charging option will be included in the evaluations
The data presented are in line with both what is declared by the manufacturer and what can be found in the open literature apart from what is presented in Clement et al (2007) Indeed in Clement et al the vehicles consumption has been estimated to be in the interval 20-35kWh100km which is much higher than what is possible to find elsewhere This is probably due to a possible mistake of the authors that convert the energy from litre of gasoline equivalent100km to kWh100km assigning the half part to the electric consumption These data for PHEVs are usually evaluated measuring the fuel consumption while the battery level remains approximately constant and thus the conversion would be not acceptable Nonetheless the estimates provided result excessively high Finally it is necessary to consider the efficiency of the battery charger For the calculation an efficiency of 90 has been considered for the recharging phase (see Clement et al 2007) Actually also the discharging phase is characterized by a certain efficiency This efficiency has been taken into account while setting the distance range of Table 2
Size Power required to the grid
Standard (kW) Industrial plug‐in
(kW) Small 22 667
Mid‐size 44 1333 Cars
Large 78 2333 Light Duty Vehicles 44 1333
Table 3 Estimated electric power required by each vehicle category to be recharged At this point it is necessary to define the power needed by each single vehicle to be recharged and to hypothesize the way all the vehicles overlap the request of electricity An estimate of the electric
power required is reported in Table 3 Data presented highlight also that normal houses with 3kW Italian electric supplier will not be sufficient anymore requiring the owner of a car to change the agreement made with the electric energy supplier This will then cause the increase of the energy cost to take into consideration for the electric vehicles market penetration estimation Hypothesizing that all the electric vehicles go back home in the hour interval 400-700pm and that the probability of arriving is constant on this interval the main electric power demand will be in the interval 700-1000pm in which all the vehicles will be recharging In case of industrial plug-in the identification of the power request is much more difficult to be forecasted Making assumptions on the probability distribution of the plug-in time it would be possible to use a Monte Carlo simulation to estimate a probability distribution of the power demand In the present study this estimate has not yet been carried out As a final consideration it is important to remark that in the present study the impact of the Plug-in Hybrid Vehicles has not been considered The main reason is connected to the fact that for the kind of trips we are considering (mainly commuter trips on short distances) also the hybrid vehicles will move mainly as fully electric ones thus requiring the same energy For this reason in the fleet evolution evaluation all the different typologies of electric vehicles are considered all together as a whole Potential electric vehicle market penetration and its evolution
The main uncertainty of the study is without any doubt the estimation of the future electric vehicle market penetration Some studies have been already carried out on the topic even if they focus mainly on the Plug-in Hybrid Electric Vehicles (PHEV) The many degrees of freedom of the problem (eg the petroleum price the national incentives schemes the development of new alternatives technologies etc) affect the reliability of any attempt of forecasting In addition the strong dependence of the electric energy production from not renewable sources makes the electric cars also less green as one can expect considering that a full electric car by itself does not produce any kind of tail-end pollution (of course during its operations and not from a life-cycle perspective in which for example the batteries production and disposal play an important role) This also influences the willingness of the governments to strongly push towards this direction In the field open literature it is possible to find studies in which the market penetration estimation is very optimistic In Clement et al (2007-2008) PHEVs reach the 28 of the total Belgian vehicle fleet in 2030 The estimation has been obtained by using the TREMOVE model (Logghe et al 2006) which is widely used in the European Commission to support environmental transport policies In Hadley and Tsvetkova (2008) it has been estimated that by the year 2020 PHEVs will achieve a constant 25 market share reaching the number of 50 million of vehicles in 2030 in the USA Other studies also confirm these estimations However as already stated above the problem has too many degrees of freedom (as outlined also in Simpson 2006) and therefore in the present study three different assessments (scenarios) have been carried out based on the following three different assumptions
1 In 2010 the 05 of the vehicle fleet is made up of electric vehicles Then the number of vehicles evolves in time assuming that the forecasted market share follows a logistic trend calibrated on the trend that methane (CNG) and Liquefied Petroleum Gas (LPG) powered vehicles have had in the period 2000-2009 This assumption is based on the idea that from the consumer perspective the electric technology has fairly the same appeal as the other ldquoalternativerdquo ones
2 In 2010 the 1 of the vehicle fleet is made up of electric vehicles Then the number of vehicles evolves in time assuming that the forecasted market share follows a logistic trend double than the one calibrated on the trend that CNG and LPG powered vehicles had in the period 2000-2009 This assumption is based on the idea that from the consumer perspective the electric technology has fairly the same appeal than the other ldquoalternativerdquo ones apart from the fact that
electric vehicles do not suffer from the limited availability of service stations (the plug-in can be made at home albeit the need for an increase power availability ndash see previous chapter)
3 Without considering a specific future trend the impact of different percentages of electric vehicles on the whole fleet at a 2030 time horizon has been evaluated (from 10 to 30) This evaluation was carried out in order to show the impact on the electric supply system of a wider penetration of electric vehicles on the vehicle market also according to the scenarios forecasted in Clement et al (2007-2008) and in Hadley and Tsvetkova (2008)
000
050
100
150
200
250
300
350
400
2000 2002 2004 2006 2008 2010
Market share trend for MethaneLPG powered car
Oil baril price trend ($)
Incentives start for public vehicles
Incentives stops
Incentives start for all vehicles and continue growing
Figure 1 Market share evolution for MethaneLPG powered cars (source ACI 2000-2008) and impacts of oil price
and Italian national incentives It is worth noting that in the first two assumptions the forecasts are based on real data colected (by the Automobil Club Italiano) in the study area (the Province of Milan) It is quite certain that the market evolution of electric vehicles will not resemble that of the CNG+LPG ones but at least these data contain information about the citizensrsquo appeal to ldquogreenrdquo vehicles and in addition their reaction to the petrol price evolution and national incentives In Figure 1 it is possible to appreciate the linkage between the CNG+LPG vehicle trend in Italy the oil price and the Italian national incentives policy In this light the decision to consider a scenario with an evolutionary trend double than those of CNG and LPG vehicles is also influenced by the belief that national governments will push more urgently towards electric vehicles also because of the potential for vehicle-to-grid applications (ie the opportunity of using vehicles connected to the electric supply network as additional storage unit see Jenkins and Rossmaier 2008 as a reference) In Figure 2 the previously mentioned estimated market share trend for CNG+LPG powered car for the Province of Milan is showed As it is possible to recognize it requires 15 years to reach the maximum value of approximately 10 of the market share
000
200
400
600
800
1000
1200
2000 2005 2010 2015 2020 2025 2030 2035 2040
Market share trend for MethaneLPG powered car
Logistic trend Actual trend
Figure 2 Actual (source ACI 2000-2008) and estimated trend for the MethaneLPG powered car market share Apart from the market share evolution it is necessary to understand which is the number of vehicles in the study area to take into consideration Since the study focuses on the commutersrsquo behaviour it would be necessary to retrieve data about the daily trips that have origin andor destination in the Province of Milan This information is usually not very easily accessible Fortunately the Italian National Statistic Institute (Istat) during the ten-yearly population census has collected also information concerning the daily commuting trips and the transport mode used These data are freely available on-line (SIDT 2005) and allowed us to perform a more detailed evaluation of the potential use of electric vehicles since these trips are those which can be more easily attracted by the lower consumption the possibility to access every part of the cities etc In Table 4 the car OriginDestination matrix for the Province of Milan is reported
OD (n of cars ) Milan Province Outside Total
Milan Province 772945 57960 830905
Outside 117436 ‐‐ 117436
Total 890381 57960 948341 Table 4 OriginDestination car matrix for the Province of Milan in the year 2001 (source Istat 2005 Data refer to
people who made the trip with their own car as a driver)1
In addition the analysis has also considered that a part of Light Duty Vehicles (LDV) fleet could probably be converted to electric technology However at this stage the available data were not enough to give a reliable estimation of this amount and for this reason the authors made the choice to simplistically evaluate the total number of LDV as the 10 of the total number of electric vehicles (percentage usually accepted for this kind of studies) Table 4 data refer to the year 2001 and for this reason it is necessary to foresee a possible evolution law In transportation studies the traffic evolution is usually simplistically connected with the growth of the Gross Domestic Product (GDP) During the last years however this relationship has become weaker since the GDP growth has significantly started to decrease in the Italian context without a correspondent remarkable reduction in the mobility growth For this reason the future trend for the
1 These informations are not readily available on-line but required some elaborations The authors are thankful to Maria Teresa Borzacchiello of the University of Napoli who retrieved these information
traffic in the Province of Milan has been linked to the evolution of the total number of cars in the Lombardy Region (ACI 2001-2008) In Figure 3 this trend is shown appearing approximately linear
500E+06
550E+06
600E+06
650E+06
700E+06
2000 2005 2010 2015 2020 2025 2030
Total number of cars in the Lombardia Region
Actual trend Estimated Trend
Figure 3 Car fleet evolution in the Lombardia Region (source ACI 2000-2008) For what concerns the composition of the car fleet (with respect to the engine dimensions) according to the data provided by the ACI (2001-2008) it is possible to consider the composition reported in Table 5 These data will be used together with those of Table 3 for the evaluation of the electric energy required by the whole vehicle fleet
Car size of the car fleetSmall 300 Mid‐size 629 Large 71
Table 5 Car fleet composition by engine size (source ACI 2001-2008)
Expected impact of the electric vehicles fleet on the electric consumption of the Province of Milan Demand of electricity and its evolution in Italy and in the Province of Milan
In order to assess the electric vehicles impact on the energy supply system it is necessary to have detailed information about the electric grid capacity the yearly energy consumption and the time dependent electric power required in the geographical area under investigation In Italy these data are collected and published by the society TERNA SpA (httpwwwternait) which is one the Italian electric provider Unfortunately available data are not very detailed for what concerns the Provincial Scale However data regarding the total electric energy consumption for the last year is available at that scale while the past energy consumption trend is available at a Regional scale and the power required to the grid (for the current year and also an estimate for the following 10 years) is available only at a National level (Terna 2007abcd)
0
20
40
60
80
100
1960 1970 1980 1990 2000 2010 2020 2030 2040
Real and estimated energy consumption in Lombardia Region (TWh)
Estimated TWh
Figure 4 Actual and estimated yearly energy consumption for the Lombardia Region (source Terna 2007b ) Starting from the available data it was possible to estimate the future trend for the yearly electric energy consumption of the Lombardy Region (see Figure 4) and of the entire Italy Then the same trend has been applied to the Province of Milan By using the ratio between the Milan and Italian yearly electric energy demand and the peak power requested to the Italian grid the peak power requested by the Province of Milan has been also estimated In the same way also the power peak trend for the Province of Milan has been obtained starting from the available trend of the peak power required for Italy In Figure 5 the daily trend of the electric power requested to the grid is showed per each month of the year 2007 It is very interesting to notice that apart from the summer months (in which the use of the car is much more differentiated and thus the impact of the electric vehicles on the grid would be more difficult to estimate) the peak power load is requested to the network during the time interval 430-600pm in which it is possible to hypothesize there will be also an high power request for the vehicles battery charging (commuters coming back home and plugging-in the vehicle to get it ready to be used the day after) For this reason the calculated value of vehicle electric power request has been compared with this peak value
20
25
30
35
40
45
50
55
60
0 4 8 12 16 20 2
Electric Power Demand during a normal day (GW)
4January February March April
May June July August
September October November December
Figure 5 Average daily trend for the Electric Power load on Italian grid per each month(source Terna 2007c)
Year 2007 Electric energy consumption
(TWh) Electric energy consumption
(of the national) Peak of Electric Power
(GW) Province of Milan 215851 599 331
Lombardy Region 67413 1872 1034
Italy 360171 10000 5522 Table 6 Absolute and relative electric energy consumption in the Province of Milan Lombardia Region and Italy
(source Terna 2007abc in italics data estimated by the authors) Electric energy required by the electric vehicles fleet to the electric grid of the Province of Milan
The final part of the work was then devoted to set-up a calculation model for the electric consumption of the estimated electric vehicle fleet First element in this calculation is the estimation of the average daily distance covered by the vehicles The National Institute for Training and Research on Transport (Isfort) publishes every year a report summarizing the Italiansrsquo mobility behaviours In this report the following data have been summarized
Vehicle Context Average distance covered (km) Italy 4000 North‐West Italy 3830 Big Cities 2970
Cars
Estimation for Milan 2844 LDV Estimation for Milan 6000
No statistics were available for Light Duty Vehicles The reported value refers to Clement et al (2007) Table 7 Average distance travelled in different geographical context (source Isfort 2008) In bold typeface the
values estimated by the authors For what concerns Light Duty Vehicles no data were available For this reason it has been considered the value reported in Clement et al (2007) for the Belgian context (the value for the cars was also very similar)
Year Fleet consistency (number of cars) Electric Vehicles share () 2030 1206612 155
Vehicle Number No of charges per day and
per vehicle Total number of charges
per day Average required energy per day
(kWh)
Small 5605 0284 1593936 17533 Mid‐size 11730 0219 2565960 56451 Ca
rs
Large 1325 0158 209333 8059 LDV 1866 0600 1119600 24631
Daily Total (kWhday) 106670 Yearly Total (kWh) 38936358
Table 8 Electric vehicles energy consumption in the Province of Milan for the year 2030 ndash Scenario 1
Year Fleet consistency (number of cars) Electric Vehicles share () 2030 1206612 309
Vehicle Number Nb of charges per day and
per vehicle Total number of charges
per day Average required energy per day
(kWh)
Small 11211 0284 3188156 35070 Mid‐size 23460 0219 5131920 112902 Ca
rs
Large 2651 0158 418825 16125 LDV 3732 0600 2239200 49262
Daily Total (kWhday) 213360 Yearly Total (kWh) 77876078
Table 9 Electric vehicles energy consumption in the Province of Milan for the year 2030 ndash Scenario 2 In Table 8 and in Table 9 the electric vehicles energy consumption is reported The model operates in the following way Based on the year a certain fleet consistency and a certain percentage of electric vehicles are used (with respect to the previously mentioned trends and the evaluation scenario considered) Then using the percentages of Table 5 the number of small medium and large cars are calculated and then the number of LDVs On the other hand using the distance range of Table 2 and the average covered distance of Table 7 the average number of charges per day and per vehicle is considered (ie not all the vehicles recharge the batteries the same day) Then it is possible to calculate the total number of charges per day by multiplying the number of charges per day and per vehicles by the number of vehicles Multiplying the obtained value by the capacity of the battery of each vehicle category and dividing by 09 to take into account the recharging efficiency it is possible to evaluate the average total daily electric requirement Multiplying this value for the number of days in one year it is possible to calculate the total yearly electric requirement In this case the number of days in one year would have been the number of working days (around 250) since the study refers to commuters trips However in order to consider also the energy consumption for the other days and to keep a safety margin the daily value has been multiplied by 365 days The total yearly electric energy required by the electric vehicles can appear a very high value Actually it represents less than the 03 of the electric energy consumption of the province of Milan (which in 2030 will be around 30times109 kWh) Even using the same electric vehicle fleet evolution until 2050 the situation does not change significantly never exceeding the value of 05 of the total energy consumption For this reason despite all the approximations made during the study the authors are confident about the reliability of the magnitude of the results presented so far In this light the impact of electric vehicles on the total electric energy consumption could be considered quite negligible The problem that will be examined in the next section will be related to ldquowhenrdquo this energy is needed ie on the electric power demand which is requested to the grid In the next table the main results about the incidence of electric vehicles on the electric energy consumption are summarized for all the scenarios at the time horizon 2030
Year Yearly electric energy consumption in the Province of Milan (kWh)
2030 30261152
Scenario1 Scenario2 Scenario 3
Fleet Share () 155 309 5 10 15 20 25 30 Electric vehicles
consumption (kWh) 38936 77876 125885 251771 377659 503547 629433 755321
Incidence of electric vehicles on energy consumption ()
013 026 042 083 125 166 208 250
Table 10 Electric vehicles energy consumption in the Province of Milan for the year 2030 ndash All Scenarios In Table 10 it is possible to notice that even in the extreme event of electric vehicle accounting for the 30 of the vehicle fleet the energy consumption will not represent more than the 25 of the total amount thus confirming what previously stated Electric power required by the electric vehicles fleet to the electric grid of the Province of Milan
The evaluation of the power required by the electric vehicles needs the definition of a time interval in which the vehiclesrsquo batteries are charged As already stated above according also with the results of the study presented by Isfort (2008) it is here hypothesized that all the vehicles will go back home in the time interval 400-700pm then plugging-in their batteries The definition of the peak of required electric power depends on the precise plug-in time of each vehicle For this reason it should be treated as a random variable Making assumption on the distribution of the vehicles arrival time it is possible by using a Monte Carlo simulation determining the probability distribution of the energy peak However at this stage the analysis has considered only the average hourly electric power request Considering that the arrivals are equally distributed in the time interval 400-700pm the maximum of the power request will be in the time interval 700-900pm (as presented in Table 2 the recharging time for all the vehicles is assumed to be equal to 5 hours) In addition two different values have been considered
- the average electric power request ie the values considering that the vehicles have not to recharge their battery every day (see what stated in the previous paragraph) but that in each day the same average percentage of vehicle recharges its battery
- the maximum electric power ie the power required to the grid in the improbable but not impossible extreme event that all the vehicles recharge in the same day
The first statistic is important to understand the power that every day will be additionally asked to the grid while the second gives an estimate of the maximum request the grid could have
Year 2030 Scenario1 Scenario2 Scenario 3
Fleet Share 2 3 5 10 15 20 25 30 Average incidence on the electric power request ()
040 083 134 267 401 534 668 802
Maximum incidence on the electric power request ()
169 351 567 1135 1702 2269 2836 3404
Table 11 Incidence of the electric power peak daily request by the electric fleet for the year 2030 ndash All Scenarios In Table 11 the average and the maximum incidence in terms of power request by the electric fleet is presented for the year 2030 It is worth noting that in both the Scenario 1 and 2 the incidence is quite
low It reaches very high values only in case electric vehicles would exceed the 15 To understand the possible effect on the daily trend it is possible to examine the following figures
25
3
35
4
45
5
55
6
Average electric power demand with and without electric cars (GW)
Demand with electric cars Demand without electric cars
Octob Novemb Decemb January February March April May 25
3
35
4
45
5
55
6
Maximum electric power demand with and without electric cars (GW)
Demand with electric cars Demand without electric cars
Octob Novemb Decemb January February March April May
Figure 6 Average and maximum impact on the electric power request profile during the winter months Scenario 1
25
3
35
4
45
5
55
6
Average electric power demand with and without electric cars (GW)
Demand with electric cars Demand without electric cars
Octob Novemb Decemb January February March April May25
3
35
4
45
5
55
6
Maximum electric power demand with and without electric cars (GW)
Demand with electric cars Demand without electric cars
Octob Novemb Decemb January February March April May
Figure 7 Average and maximum impact on the electric power request profile during the winter months Scenario 2
25
3
35
4
45
5
55
6
Average electric power demand with and without electric cars (GW)
Demand with electric cars Demand without electric cars
Octob Novemb Decemb January February March April May25
3
35
4
45
5
55
6
Maximum electric power demand with and without electric cars (GW)
Demand with electric cars Demand without electric cars
Octob Novemb Decemb January February March April May
Figure 8 Average and maximum impact on the electric power request profile during the winter months Scenario 3 ndash
Electric fleet share = 5
25
3
35
4
45
5
55
6
Average electric power demand with and without electric cars (GW)
Demand with electric cars Demand without electric cars
Octob Novemb Decemb January February March April May 25
3
35
4
45
5
55
6
Maximum electric power demand with and without electric cars (GW)
Demand with electric cars Demand without electric cars
Octob Novemb Decemb January February March April May
Figure 9 Average and maximum impact on the electric power request profile during the winter months Scenario 3 ndash
Electric fleet share = 25 From Figure 6 to Figure 9 it is possible to appreciate the impact of the electric vehicles market penetration on the incidence of the electric power required during the average day of each winter month As the percentage increase significantly it is necessary to adopt strategies in order to avoid the potential damages created to the grid capacity In particular creating an ldquointelligentrdquo grid able to decide ldquowhenrdquo providing power to the batteries (there are several studies on this topic see eg Jenkins et al 2008) it would be very fruitful in order to shift the power request on hours in which this is lower avoiding all the possible problem of network overloading This concept is at the basis of the ldquoVehicle to Gridrdquo (V2G) strategy according to which the vehicles can represents additional element capable of storing electric energy to be used during the peaks of demand (if the vehicles are connected to the network)
It is necessary to underline that the creation of an additional ldquointelligentrdquo network represent a not negligible investment whose costs and benefits need to be taken into consideration more carefully In addition the V2G strategy can result in an additional degree of freedom of the problem Indeed it could be an additional incentive to the electric vehicles if for example the energy moved from the vehicles to the network is paid by the electric energy supplier at a higher value than it is sold (the equivalent of the feed-in tariff for PV in many European countries) On the other hand it could have a negative outcome if for example the vehiclesrsquo owners loose the possibility to have their car always ready in case of necessity of use (the grid ldquointelligencerdquo should for example give the possibility of choosing if making available the vehicle capacity to the grid or not )
Concluding remarks and further research Electric vehicles represent an important opportunity for pursuing a sustainable development not only of the transportation system but for the entire society Indeed their Well to Wheel efficiency is indeed very high and this will allow a considerable step forward in the reduction of the overexploitation of resources
Among the possible alternatives the electric vehicles both hybrid and not are deserving particular attention at the moment also in light of the apparent simplicity of their diffusion (they can be recharged directly at home using the normal electric grid)
Actually the diffusion of this technology will increase the demand of domestic electric energy for recharging the vehiclersquos batteries In particular due to the common habits of many people and to the still long recharging time required it is necessary to evaluate the possible impact that the contemporary plug-in of thousands of cars can have on the electric grid
The present study has tried to evaluate this impact on the grid of the Italian Province of Milan at a 2030 time horizon The model used to calculate the electric energy and power required has been very simple but being based on as detailed as possible real data it is able to provide a reliable estimation
In particular the main uncertainty of the whole model is the future evolution of the electric vehicles market share Several studies have tried to give an estimate of such a trend but the results presented due to the many degrees of freedom affecting the problem have also been very different For this reason in the present study the basic idea has been to use as a reference the market evolution of a category of vehicles which can appear to the possible customers very similar to electric vehicles namely the methane (CNG) and Liquefied Petroleum Gas (LPG) powered vehicles Then on the basis of their actual past trend different correlated scenarios have been hypothesized
Results obtained show that even with a very high future market penetration the impact of the vehicles on the annual energy consumption will be quite negligible On the contrary they also show that without an appropriate regulation (eg the intelligent integration of electric vehicles into the existing power grid as decentralised and flexible energy storage) they could heavily impact on the daily electric power request Actually this is true only considering very high (in the authorsrsquo opinion unrealistic) future electric vehicles market share (20-25) in 2030
As a conclusion of the study it is the authorsrsquo opinion that electric vehicles can really represent a realistic alternative to ICE vehicles also in terms of the available capacity of the electric grid Further analyses are however required in order to extend the results to a wider and more complex context and in particular to better individuate a more reliable future trend for this vehicle category
References ACI Automobil Club Italiano (2000-2008) httpwwwaciitindexphpid=54 Autoritratto 2000-2008 httpwwwalkecomelectric-vehicleshtmlhttpwwwaltairnanocomhttpwwwateaittwingo-elettrichehtmhttpwwwateaitpanda-elettrichehtmhttpwwwchvtlpiaggiocomporter_elhtmClement K Van Reusel K Driesen K (2007) The consumption of Electrical Energy of Plug-in Hybrid Electric Vehicles in Belgium European Ele-Drive Conference Brussels Belgium Clement K Heasen E Driesen K (2008) The Impact of Charging Plug-in Hybrid Electric Vehicles on the Distribution Grid Proceedings 2008 - 4th IEEE BeNeLux Young Researchers Symposium in Electrical Power Engineering Eindhoven The Netherlands httpwwwcodaautomotivecomEuropean Commission DG-TREN (2006) Keep Europe moving ndash Sustainable mobility for our continent httpbookshopeuropaeueubookshopdownloadactionfileName=KO7606127ENC_002pdfampeubphfUid=494666ampcatalogNbr=KO-76-06-127-EN-C Hadley S W Tsvetkova A (2008) Potential Impacts of Plug-in Hybrid Electric Vehicles on Regional Power Generation Oak Ridge National Laboratory Oak Ridge Tennessee USA Isfort (2008) La domanda di mobilitagrave degli italiani httpwwwisfortit Istat (2005) 14mo Censimento Generale della Popolazione e delle Abitazioni ndash 2001 Final Report httpdawinciistatit httpwwwitaliaspeedcomJenkins S D Rossmaier J R Ferdowsi M (2008) Utilization and Effect of Plug-in Hybrid Electric Vehicles in the United States Power Grid IEEE Vehicle and Propulsion Conference Harbin China httpwwwldvcomhttpwwwlightningcarcompanycoukMackay DJC (2009) Sustainable Energy mdash without the hot air UIT Cambridge Ltd Cambridge England httpwwwmilesevcomhttpwwwminiusacomminie-usahttpwwwmitsubishi-motorscomhttpwwwnicecarcompanycoukhttpwwwphoenixmotorcarscomSimpson A (2006) Cost-Benefit analysis of Plug-in Hybrid Electric Vehicle Technology 22nd International Battery Hybrid and Fuel Cell Electric Vehicle Symposium and Exhibition Yokohama Japan httpwwwnrelgovdocsfy07osti740485pdf httpwwwsmartgridseu Terna SpA (2007a) Dati Statistici sullenergia elettrica in Italia ndash Dati Storici httpwwwternaitTerna SpA (2007b) Dati Statistici sullenergia elettrica in Italia ndash Lrsquoelettricitagrave nelle regioni httpwwwternaitTerna SpA (2007c) Dati Statistici sullenergia elettrica in Italia ndash Carichi httpwwwternaitTerna SpA (2007d) Previsioni della domanda elettrica in Italia e del fabbisogno di potenza necessario Anni 2008 2018 httpwwwternait
httpwwwteslamotorscom
European Commission EUR 23975 EN ndash Joint Research Centre ndash Institute for Environment and Sustainability Title Potential Impact of Electric Vehicles on the Electric Supply System Author(s) A Perujo B Ciuffo Luxembourg Office for Official Publications of the European Communities 2009 ndash 25 pp ndash 21 x 297 cm EUR ndash Scientific and Technical Research series ndash ISSN 1018-5593 ISBN 978-92-79-13179-0 DOI 10278831623 Abstract The study analyses the impact of the electric vehiclesrsquo recharging activities on the electric supply system for the Province of Milan with a 2030 time horizon In particular the impact is seen both in terms of total electric energy consumption and in power requested to the grid Because of the long recharging time required by the cars batteries the probability to have thousands of cars contemporary plugged-in is not negligible The key issue of the study is a more plausible (in the authorsrsquo opinion) estimation of the potential electric vehicles market share evolution in the time period considered The results obtained clearly show that without an appropriate regulation (eg the intelligent integration of electric vehicles into the existing power grid as decentralized and flexible energy storage) electric vehicles could heavily impact on the daily requested electric power
How to obtain EU publications Our priced publications are available from EU Bookshop (httpbookshopeuropaeu) where you can place an order with the sales agent of your choice The Publications Office has a worldwide network of sales agents You can obtain their contact details by sending a fax to (352) 29 29-42758
The mission of the JRC is to provide customer-driven scientific and technical supportfor the conception development implementation and monitoring of EU policies As a service of the European Commission the JRC functions as a reference centre of science and technology for the Union Close to the policy-making process it serves the common interest of the Member States while being independent of special interests whether private or national
LB
-NA
-23975-EN-C
- Introduction
- Battery Electric Vehicles ndash Available fleet and potential market
- Expected impact of the electric vehicles fleet on the electric consumption of the Province of Milan
- Concluding remarks and further research
- References
-
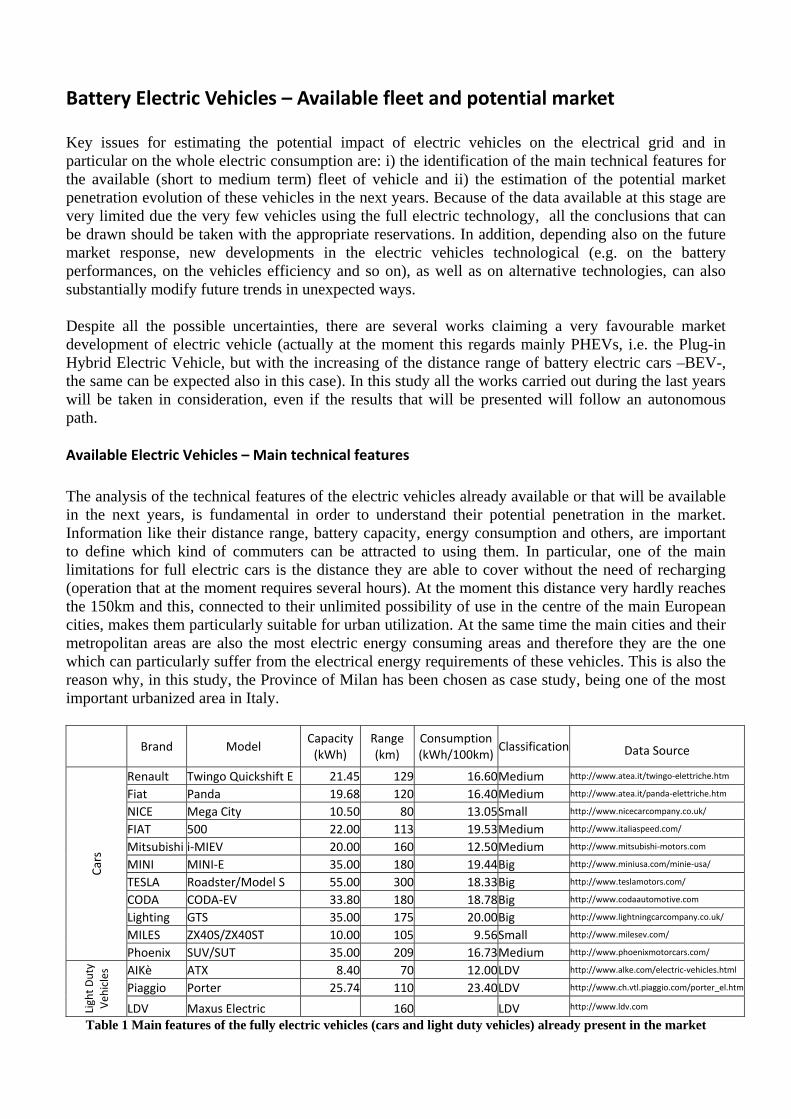
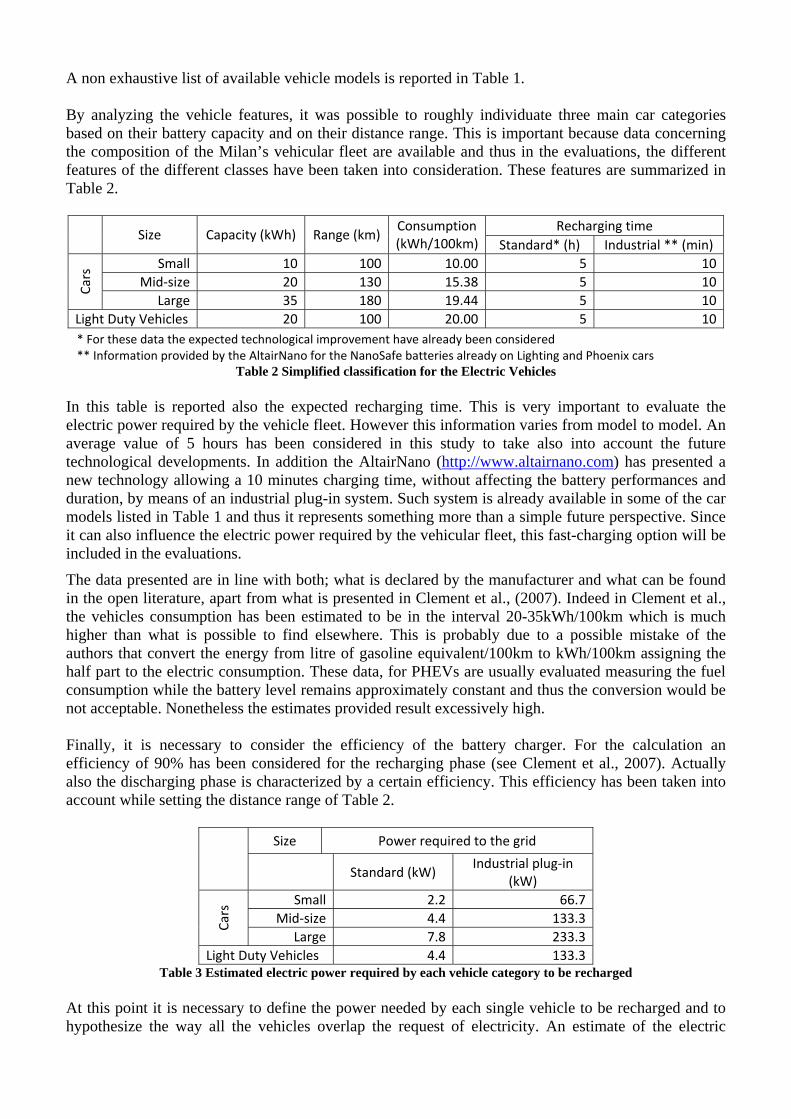
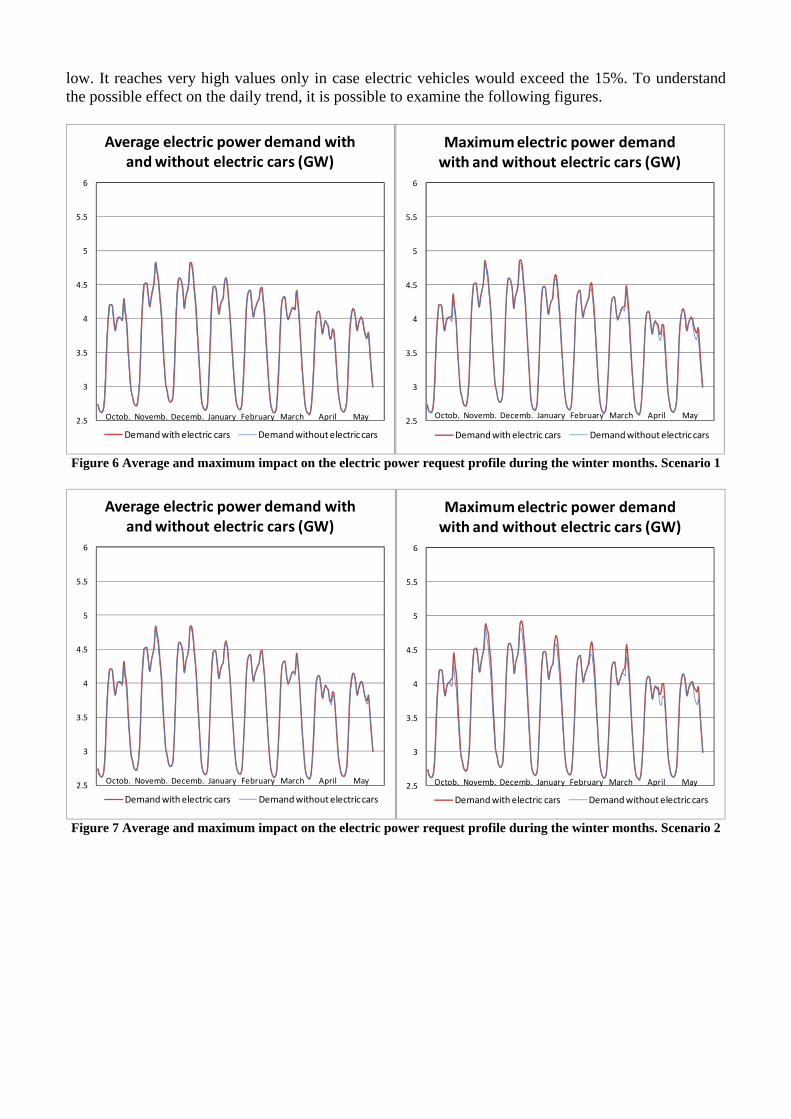

25
3
35
4
45
5
55
6
Average electric power demand with and without electric cars (GW)
Demand with electric cars Demand without electric cars
Octob Novemb Decemb January February March April May25
3
35
4
45
5
55
6
Maximum electric power demand with and without electric cars (GW)
Demand with electric cars Demand without electric cars
Octob Novemb Decemb January February March April May
Figure 8 Average and maximum impact on the electric power request profile during the winter months Scenario 3 ndash
Electric fleet share = 5
25
3
35
4
45
5
55
6
Average electric power demand with and without electric cars (GW)
Demand with electric cars Demand without electric cars
Octob Novemb Decemb January February March April May 25
3
35
4
45
5
55
6
Maximum electric power demand with and without electric cars (GW)
Demand with electric cars Demand without electric cars
Octob Novemb Decemb January February March April May
Figure 9 Average and maximum impact on the electric power request profile during the winter months Scenario 3 ndash
Electric fleet share = 25 From Figure 6 to Figure 9 it is possible to appreciate the impact of the electric vehicles market penetration on the incidence of the electric power required during the average day of each winter month As the percentage increase significantly it is necessary to adopt strategies in order to avoid the potential damages created to the grid capacity In particular creating an ldquointelligentrdquo grid able to decide ldquowhenrdquo providing power to the batteries (there are several studies on this topic see eg Jenkins et al 2008) it would be very fruitful in order to shift the power request on hours in which this is lower avoiding all the possible problem of network overloading This concept is at the basis of the ldquoVehicle to Gridrdquo (V2G) strategy according to which the vehicles can represents additional element capable of storing electric energy to be used during the peaks of demand (if the vehicles are connected to the network)
It is necessary to underline that the creation of an additional ldquointelligentrdquo network represent a not negligible investment whose costs and benefits need to be taken into consideration more carefully In addition the V2G strategy can result in an additional degree of freedom of the problem Indeed it could be an additional incentive to the electric vehicles if for example the energy moved from the vehicles to the network is paid by the electric energy supplier at a higher value than it is sold (the equivalent of the feed-in tariff for PV in many European countries) On the other hand it could have a negative outcome if for example the vehiclesrsquo owners loose the possibility to have their car always ready in case of necessity of use (the grid ldquointelligencerdquo should for example give the possibility of choosing if making available the vehicle capacity to the grid or not )
Concluding remarks and further research Electric vehicles represent an important opportunity for pursuing a sustainable development not only of the transportation system but for the entire society Indeed their Well to Wheel efficiency is indeed very high and this will allow a considerable step forward in the reduction of the overexploitation of resources
Among the possible alternatives the electric vehicles both hybrid and not are deserving particular attention at the moment also in light of the apparent simplicity of their diffusion (they can be recharged directly at home using the normal electric grid)
Actually the diffusion of this technology will increase the demand of domestic electric energy for recharging the vehiclersquos batteries In particular due to the common habits of many people and to the still long recharging time required it is necessary to evaluate the possible impact that the contemporary plug-in of thousands of cars can have on the electric grid
The present study has tried to evaluate this impact on the grid of the Italian Province of Milan at a 2030 time horizon The model used to calculate the electric energy and power required has been very simple but being based on as detailed as possible real data it is able to provide a reliable estimation
In particular the main uncertainty of the whole model is the future evolution of the electric vehicles market share Several studies have tried to give an estimate of such a trend but the results presented due to the many degrees of freedom affecting the problem have also been very different For this reason in the present study the basic idea has been to use as a reference the market evolution of a category of vehicles which can appear to the possible customers very similar to electric vehicles namely the methane (CNG) and Liquefied Petroleum Gas (LPG) powered vehicles Then on the basis of their actual past trend different correlated scenarios have been hypothesized
Results obtained show that even with a very high future market penetration the impact of the vehicles on the annual energy consumption will be quite negligible On the contrary they also show that without an appropriate regulation (eg the intelligent integration of electric vehicles into the existing power grid as decentralised and flexible energy storage) they could heavily impact on the daily electric power request Actually this is true only considering very high (in the authorsrsquo opinion unrealistic) future electric vehicles market share (20-25) in 2030
As a conclusion of the study it is the authorsrsquo opinion that electric vehicles can really represent a realistic alternative to ICE vehicles also in terms of the available capacity of the electric grid Further analyses are however required in order to extend the results to a wider and more complex context and in particular to better individuate a more reliable future trend for this vehicle category
References ACI Automobil Club Italiano (2000-2008) httpwwwaciitindexphpid=54 Autoritratto 2000-2008 httpwwwalkecomelectric-vehicleshtmlhttpwwwaltairnanocomhttpwwwateaittwingo-elettrichehtmhttpwwwateaitpanda-elettrichehtmhttpwwwchvtlpiaggiocomporter_elhtmClement K Van Reusel K Driesen K (2007) The consumption of Electrical Energy of Plug-in Hybrid Electric Vehicles in Belgium European Ele-Drive Conference Brussels Belgium Clement K Heasen E Driesen K (2008) The Impact of Charging Plug-in Hybrid Electric Vehicles on the Distribution Grid Proceedings 2008 - 4th IEEE BeNeLux Young Researchers Symposium in Electrical Power Engineering Eindhoven The Netherlands httpwwwcodaautomotivecomEuropean Commission DG-TREN (2006) Keep Europe moving ndash Sustainable mobility for our continent httpbookshopeuropaeueubookshopdownloadactionfileName=KO7606127ENC_002pdfampeubphfUid=494666ampcatalogNbr=KO-76-06-127-EN-C Hadley S W Tsvetkova A (2008) Potential Impacts of Plug-in Hybrid Electric Vehicles on Regional Power Generation Oak Ridge National Laboratory Oak Ridge Tennessee USA Isfort (2008) La domanda di mobilitagrave degli italiani httpwwwisfortit Istat (2005) 14mo Censimento Generale della Popolazione e delle Abitazioni ndash 2001 Final Report httpdawinciistatit httpwwwitaliaspeedcomJenkins S D Rossmaier J R Ferdowsi M (2008) Utilization and Effect of Plug-in Hybrid Electric Vehicles in the United States Power Grid IEEE Vehicle and Propulsion Conference Harbin China httpwwwldvcomhttpwwwlightningcarcompanycoukMackay DJC (2009) Sustainable Energy mdash without the hot air UIT Cambridge Ltd Cambridge England httpwwwmilesevcomhttpwwwminiusacomminie-usahttpwwwmitsubishi-motorscomhttpwwwnicecarcompanycoukhttpwwwphoenixmotorcarscomSimpson A (2006) Cost-Benefit analysis of Plug-in Hybrid Electric Vehicle Technology 22nd International Battery Hybrid and Fuel Cell Electric Vehicle Symposium and Exhibition Yokohama Japan httpwwwnrelgovdocsfy07osti740485pdf httpwwwsmartgridseu Terna SpA (2007a) Dati Statistici sullenergia elettrica in Italia ndash Dati Storici httpwwwternaitTerna SpA (2007b) Dati Statistici sullenergia elettrica in Italia ndash Lrsquoelettricitagrave nelle regioni httpwwwternaitTerna SpA (2007c) Dati Statistici sullenergia elettrica in Italia ndash Carichi httpwwwternaitTerna SpA (2007d) Previsioni della domanda elettrica in Italia e del fabbisogno di potenza necessario Anni 2008 2018 httpwwwternait
httpwwwteslamotorscom
European Commission EUR 23975 EN ndash Joint Research Centre ndash Institute for Environment and Sustainability Title Potential Impact of Electric Vehicles on the Electric Supply System Author(s) A Perujo B Ciuffo Luxembourg Office for Official Publications of the European Communities 2009 ndash 25 pp ndash 21 x 297 cm EUR ndash Scientific and Technical Research series ndash ISSN 1018-5593 ISBN 978-92-79-13179-0 DOI 10278831623 Abstract The study analyses the impact of the electric vehiclesrsquo recharging activities on the electric supply system for the Province of Milan with a 2030 time horizon In particular the impact is seen both in terms of total electric energy consumption and in power requested to the grid Because of the long recharging time required by the cars batteries the probability to have thousands of cars contemporary plugged-in is not negligible The key issue of the study is a more plausible (in the authorsrsquo opinion) estimation of the potential electric vehicles market share evolution in the time period considered The results obtained clearly show that without an appropriate regulation (eg the intelligent integration of electric vehicles into the existing power grid as decentralized and flexible energy storage) electric vehicles could heavily impact on the daily requested electric power
How to obtain EU publications Our priced publications are available from EU Bookshop (httpbookshopeuropaeu) where you can place an order with the sales agent of your choice The Publications Office has a worldwide network of sales agents You can obtain their contact details by sending a fax to (352) 29 29-42758
The mission of the JRC is to provide customer-driven scientific and technical supportfor the conception development implementation and monitoring of EU policies As a service of the European Commission the JRC functions as a reference centre of science and technology for the Union Close to the policy-making process it serves the common interest of the Member States while being independent of special interests whether private or national
LB
-NA
-23975-EN-C
- Introduction
- Battery Electric Vehicles ndash Available fleet and potential market
- Expected impact of the electric vehicles fleet on the electric consumption of the Province of Milan
- Concluding remarks and further research
- References
-