potential impact of temperature and atmospheric pressure
TRANSCRIPT
Vol. 12(3), pp. 246-260, July-September 2020
DOI: 10.5897/JPHE2020.1258
Article Number: 4ADC76064898
ISSN 2141-2316
Copyright © 2020
Author(s) retain the copyright of this article
http://www.academicjournals.org/JPHE
Journal of Public Health and Epidemiology
Full Length Research Paper
Potential impact of temperature and atmospheric pressure on the number of cases of COVID-19 in
Mozambique, Southern Africa
Edgar Manuel Cambaza1*, Gabriel Chico Viegas2 and Cesário Manuel Cambaza3
1Department of Health Sciences, Tertiary Institute for Science and Distance Education (ISCED), Rua Dr. Lacerda de
Almeida, n° 211, Cidade da Beira, Mozambique. 2Department of Agriculture and Engineering, Tertiary Institute for Science and Distance Education (ISCED), Rua Dr.
Lacerda de Almeida, n° 211, Cidade da Beira, Mozambique. 3Division of Agriculture, Gaza Polytechnic Tertiary Institute (ISPG), Campus Politécnico - Posto Administrativo de
Lionde, Cidade de Chókwè, Mozambique.
Received 5 August, 2020; Accepted 14 September, 2020
The potential reasons why COVID-19 is not spreading rapidly in Sub-Saharan Africa include sociopolitical, biological and environmental variables. Among the latter, some studies indicate temperature and atmospheric pressure as significantly influential. Could they have impact on the number of COVID-19 cases in Mozambique? The aim of this study is to analyze the relationships between weather and the frequency of confirmed COVID-19 cases in Mozambique, Southern Africa. The study was conducted in Mozambique, Maputo area (Province and City) and Nampula Province. Daily history of weather variables – daily maximum and minimum temperatures and atmospheric pressure – was obtained from three online databases (AccuWeather, Time and Date AS and WeatherSpark) and the number of COVID-19 cases from official Government’s daily Bulletins. The main statistical analyses were Pearson correlations between the variables. The first case was observed in the Maputo area on 22 March, 2020 and the cases in Mozambique increased exponentially up to 769 by 24 June, 2020. The first three cases in Nampula province were observed on 24 May 2020 but its frequency surpassed Maputo area’s within one month. Temperatures showed negative correlations with the number of cases in all areas and pressure showed positive correlations in Maputo area and Nampula Province. A bubble chart allowed the visualization of the combined relationship of both weather variables and the number of cases, suggesting that the number of cases increases as temperature decreases and pressure increases. Temperature and atmospheric pressure seems to be correlated with the number of confirmed cases of COVID-19 in Mozambique. Thus, decision-makers should consider weather as a predictor of the rate at which the pandemic is spreading in the country. Key words: COVID-19, Mozambique, Maputo, Nampula, weather, temperature, atmospheric pressure.
INTRODUCTION Mozambique was among the last countries in the world with confirmed cases of COVID-19, on 22 March 2020
(World Health Organization 2020d, c). President Jacinto Nyusi (2020b) declared an Emergency State for the entire Mozambican territory through the Decree 11/2020, considering COVID-19 as public calamity. By then, there were already half a million people infected worldwide, with 30,000 dead (Nyusi, 2020b). Just before Mozambique presented the first confirmed cases of COVID-19, all countries around already had cases (Nyusi, 2020a). The Government was engaged in COVID-19 surveillance and control, following guidelines from the World Health Organization (WHO) (Nyusi, 2020a). There were 788 cases by the end of June, still increasing (SAVANA, 2020). Most cases have been mild (Nyusi, 2020a; SAVANA, 2020).
There are several social, biological and environmental factors affecting the dissemination of COVID-19 in Africa (Cambaza, 2020; Nachega et al., 2020; Njenga et al., 2020) and worldwide. There have been several unexpected events, at least considering their magnitude, such as the disproportionally high frequency of cases in the northern hemisphere in relation to the south (World Health Organization, 2020a), or simply the fact that Africa did not face the calamity as severely as the developed world, even with its vulnerable healthcare systems (Houssin et al., 2020) or precarious hygiene or sanitation (Gates, 2020). There is plenty of focus on what scientists, legislators and decision-makers have to do to minimize COVID-19 dissemination but the role of environmental variables such as temperature or atmospheric pressure should not be underestimated. For instance, low temperature and high humidity have been associated to high frequency of confirmed cases in China, particularly Wuhan City (Ma et al., 2020; Wang et al., 2020b). Despite the remarkable effort of the National Institute of Health (Instituto Nacional da Saúde, 2020b), press and mainstream media to inform the population, there is plenty of misinformation and panic, and also lack of attention to potentially reliable tools and data which could at least support key decision-makers. In their brief report, Battineni et al. (2020) asked an important question: how is weather related to COVID-19? In theory and according to observations, weather should affect COVID-19 dissemination (Ma et al., 2020; Wang et al., 2020a), as it at least affects the epidemiology of other hygiene-related diseases (Cambaza et al., 2019, 2020; Mongo et al., 2020). Thus, this paper aims to analyze how two meteorological variables – temperature and atmospheric pressure – have been influencing the dynamics of COVID-19 dissemination in Mozambique. If there are correlations between weather variables and the frequency of confirmed cases, it is possible to develop
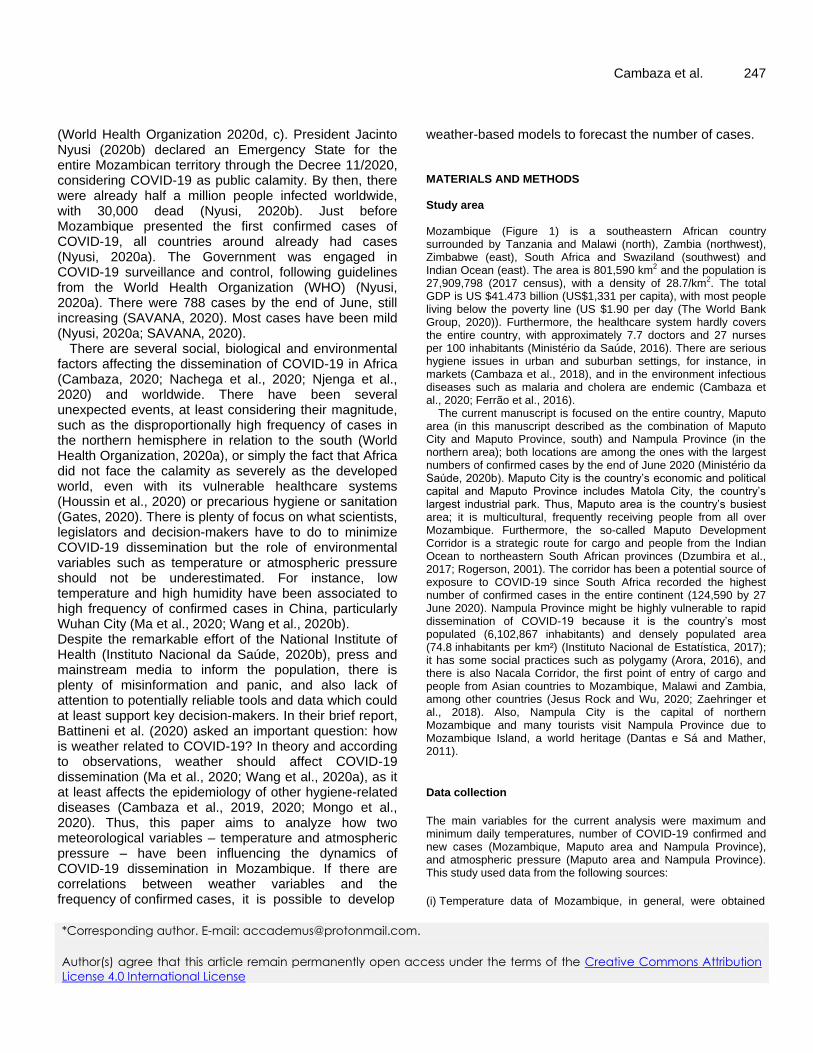
Cambaza et al. 247 weather-based models to forecast the number of cases. MATERIALS AND METHODS Study area Mozambique (Figure 1) is a southeastern African country surrounded by Tanzania and Malawi (north), Zambia (northwest), Zimbabwe (east), South Africa and Swaziland (southwest) and Indian Ocean (east). The area is 801,590 km
2 and the population is
27,909,798 (2017 census), with a density of 28.7/km2. The total
GDP is US $41.473 billion (US$1,331 per capita), with most people living below the poverty line (US $1.90 per day (The World Bank Group, 2020)). Furthermore, the healthcare system hardly covers the entire country, with approximately 7.7 doctors and 27 nurses per 100 inhabitants (Ministério da Saúde, 2016). There are serious hygiene issues in urban and suburban settings, for instance, in markets (Cambaza et al., 2018), and in the environment infectious diseases such as malaria and cholera are endemic (Cambaza et al., 2020; Ferrão et al., 2016).
The current manuscript is focused on the entire country, Maputo area (in this manuscript described as the combination of Maputo City and Maputo Province, south) and Nampula Province (in the northern area); both locations are among the ones with the largest numbers of confirmed cases by the end of June 2020 (Ministério da Saúde, 2020b). Maputo City is the country’s economic and political capital and Maputo Province includes Matola City, the country’s largest industrial park. Thus, Maputo area is the country’s busiest area; it is multicultural, frequently receiving people from all over Mozambique. Furthermore, the so-called Maputo Development Corridor is a strategic route for cargo and people from the Indian Ocean to northeastern South African provinces (Dzumbira et al., 2017; Rogerson, 2001). The corridor has been a potential source of exposure to COVID-19 since South Africa recorded the highest number of confirmed cases in the entire continent (124,590 by 27 June 2020). Nampula Province might be highly vulnerable to rapid dissemination of COVID-19 because it is the country’s most populated (6,102,867 inhabitants) and densely populated area (74.8 inhabitants per km²) (Instituto Nacional de Estatística, 2017); it has some social practices such as polygamy (Arora, 2016), and there is also Nacala Corridor, the first point of entry of cargo and people from Asian countries to Mozambique, Malawi and Zambia, among other countries (Jesus Rock and Wu, 2020; Zaehringer et al., 2018). Also, Nampula City is the capital of northern Mozambique and many tourists visit Nampula Province due to Mozambique Island, a world heritage (Dantas e Sá and Mather, 2011).
Data collection
The main variables for the current analysis were maximum and minimum daily temperatures, number of COVID-19 confirmed and new cases (Mozambique, Maputo area and Nampula Province), and atmospheric pressure (Maputo area and Nampula Province). This study used data from the following sources:
(i) Temperature data of Mozambique, in general, were obtained
*Corresponding author. E-mail: [email protected].
Author(s) agree that this article remain permanently open access under the terms of the Creative Commons Attribution
License 4.0 International License
248 J. Public Health Epidemiol.
Figure 1. Mozambique. Source: United Nations (2013), under public domain.
from AccuWeather (2020)database. AccuWeather’s source is the US National Weather Service (2020); (ii) Time and Date AS (2020), and online database with weather history (maximum and minimum daily temperature and pressure) of Maputo area and Nampula Province. Its data can be traced to stations run by the World Meteorological Organization (WMO) and Meteorological Assimilation Data Ingest System (MADIS), a database of the US National Weather Service (2020); (iii) Cedar Lake Ventures Inc. (2020) (WeatherSpark) to estimate values of missing data in Time and Date AS database. Data from Weather Spark do not comprise observations. Instead, they are estimated based on historical records provided by MERRA-2 satellite of the National Aeronautics and Space Administration (NASA) after some accuracy correction according to the International Standard Atmosphere (International Organization for Standardization, 1975); (iv) The website “Fica Atento” from Instituto Nacional da Saúde (2020a) (INS), Mozambique, with daily updates about number of
COVID-19 new and confirmed cases. Statistical analysis Statistical analysis was performed on Microsoft Excel 2016™ (Microsoft Corporation, Washington DC, US), JASP (version 0.10.2, University of Amsterdam, Netherlands) (Team, 2019) and SPSS Statistics (International Business Machines, Armonk, New York, USA). Trends of daily temperature and atmospheric pressure through time plotted and analyzed through regression and curve fitting, on Excel. The same software was used to plot the number of confirmed cases in Mozambique, Maputo area and Nampula Province since 22 March until 24 June 2020. Then, the data were transferred to JASP and used to determine correlations between maximum and minimum daily temperature and number of confirmed COVID-19 cases in Mozambique. The same analysis was performed for Maputo area and Nampula Province including

Cambaza et al. 249
Figure 2. Temperature variation in Mozambique from 22 March to 21 June 2020.
atmospheric pressure. Finally, on SPSS, a bubble plot allowed the combined analysis of the combined relationship between weather variables – minimum temperature and pressure – and the frequency of confirmed cases.
RESULTS AND DISCUSSION
Weather variation
Kolmogorov-Smirnov tests show significant variations in maximum and minimum daily temperatures (p < 0.001) for both, from 22 March to 24 June 2020. Despite fluctuations, it is possible to notice that both temperatures have been decreasing (), although only the minimum daily temperature presented considerable consistency with a simple algebraic trend (R
2 ≈ 0.65). It is well-known
that temperature in Mozambique consistently decreases from mid-April to mid-July, and this period, meteorologically described as the dry season, is widely perceived as the winter due to the temperature drop. Previous research from China showed that temperature is inversely proportional to incidence of COVID-19 (Ma et al., 2020; Wang et al., 2020a). This is relevant because some authorities believe that respiratory diseases such as influenza are more incident during winter because people tend to stay indoors during this season, thus more easily infecting each other (Lowen and Steel, 2014). If this is the case, rather than a direct effect of the temperature on the viral particles, the temperature might
not be important. The perceived winter is leading people to stay indoors, favoring proliferation of COVID-19, even if the season is not as cold winter from temperate or subpolar areas.
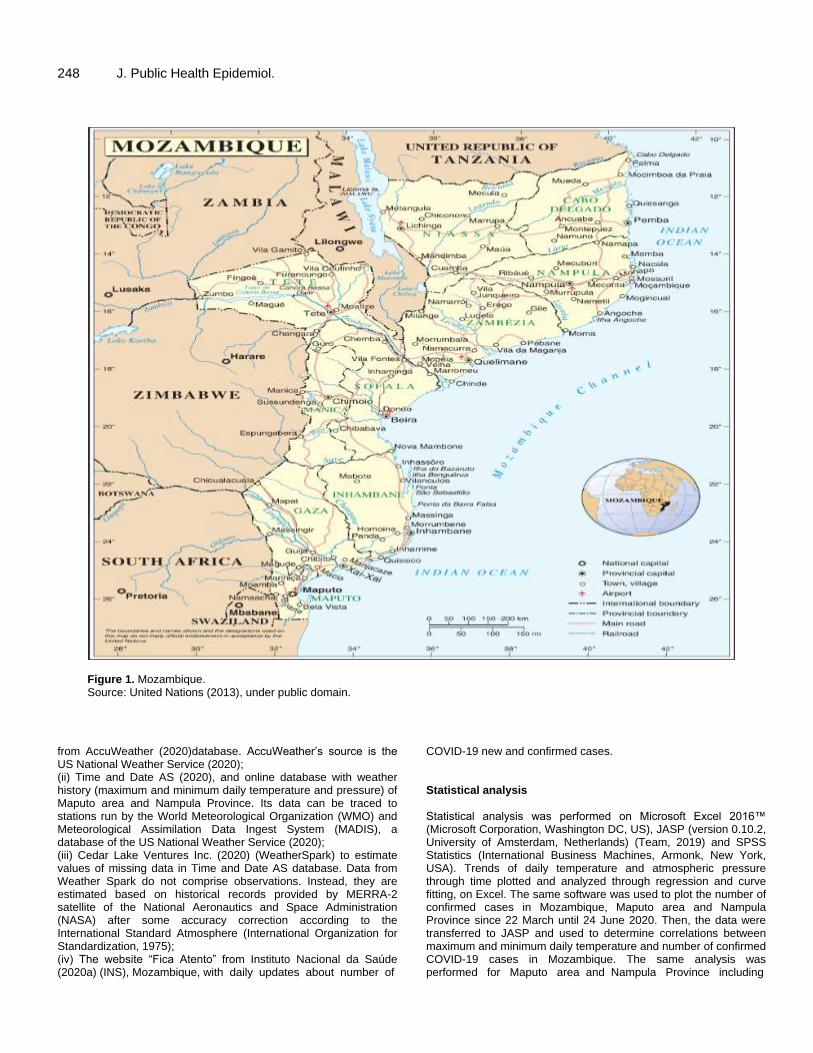
In Maputo area, the maximum and minimum daily temperatures showed similar trend with the entire country, and it is possible to notice that logarithmic regression shows more consistency, as R
2 values
indicate (a). Maputo is the country’s most southern area, the furthest from the equator, and among the few below the Tropic of Capricorn, thus its temperature decline was understandably below the country’s average. By the logic of the aforementioned Chinese researchers (Ma et al., 2020; Wang et al., 2020a), Maputo is among the most vulnerable areas for the dissemination of COVID-19. Indeed, Maputo area was the first with confirmed cases (Tiago, 2020a) and it has been consistent among the locations with the highest frequency of cases, presenting by 3 July 2020 the third highest number of cases (Ministério da Saúde, 2020b). Yet, several other reasons are likely affecting the incidence of COVID-19 in Maputo area, as it includes Maputo City, the capital and Mozambique’s most densely populated area, and Matola City, the country’s largest industrial park. For instance, Maputo shares its border with South Africa, the location with the highest number of confirmed COVID-19 cases in Sub-Saharan Africa by the end of June 2020 (World Health Organization, 2020e).In addition, Maputo City has an international airport and
250 J. Public Health Epidemiol.
(a)
(b)
Figure 3. Temperature variation in (a) Maputo area from 22 March to 24 June 2020 and (b) Nampula Province from 24 May to 24 June 2020.
port, being perhaps the major point of entry for people coming from abroad. Domestically, there is frequent migration between Maputo City and the rest of the country.
Nampula also showed decline in maximum and minimum daily temperatures (b), even though the current analysis included less data for this area, starting approximately two months when compared to the country and Maputo. The trends of temperature decline are also consistent with logarithmic functions, and the idea of
increased risk of COVID-19 dissemination applies in Nampula Province. Furthermore, Nampula area also has other factors potentially affecting the dynamics of COVID-19 transmission among people, as the area hosts the country’s third capital (also called Nampula), has an international airport and port, among other factors. Its privileged position in northern Mozambique makes its port, in Nacala City, the first location where ships from Asia arrive, and countries without sea, such as Malawi and Zambia, rely considerably on. Thus, there is
Cambaza et al. 251 considerable movement of people and goods in Nampula Province. Yet, Nampula is very far from South Africa, not having the same risk of immigration of infected people as Maputo area; it is not as busy as the country’s capital and the first case of COVID-19 was observed two months after the first case in Maputo. Furthermore, its position in northern Mozambique, closer to the equator, makes the province warmer than Maputo, and this idea is consistent with the observations in analyzing the period from 24 May to 24 June 2020.
Atmospheric pressure is responsible for air movement (wind), formation of clouds and, ultimately, rainfall and humidity (Özgür and Kocak, 2015). Thus, it has a major influence on weather variation, potentially affecting any health condition affected by the aforementioned weather variables. For instance, by affecting rainfall, it can influence the dynamics of hygiene-related diseases such as cholera (Cambaza et al., 2019, 2020; Mongo et al. 2020). COVID-19 is widely described as a hygiene-related disease (World Health Organization, 2020h; Dalton et al., 2020), and this gives some pertinence to the idea that atmospheric pressure affects the dynamics of SARS-CoV-2 dissemination.
presents the variation of atmospheric pressure in Maputo area (a) and Nampula Province (b) each since the day of confirmation of the first case of COVID-19. While pressure variation in Maputo did not fit to any simple algebraic curve, in Nampula it was highly consistent with a six-degree function (R
2 ≈ 0.8).
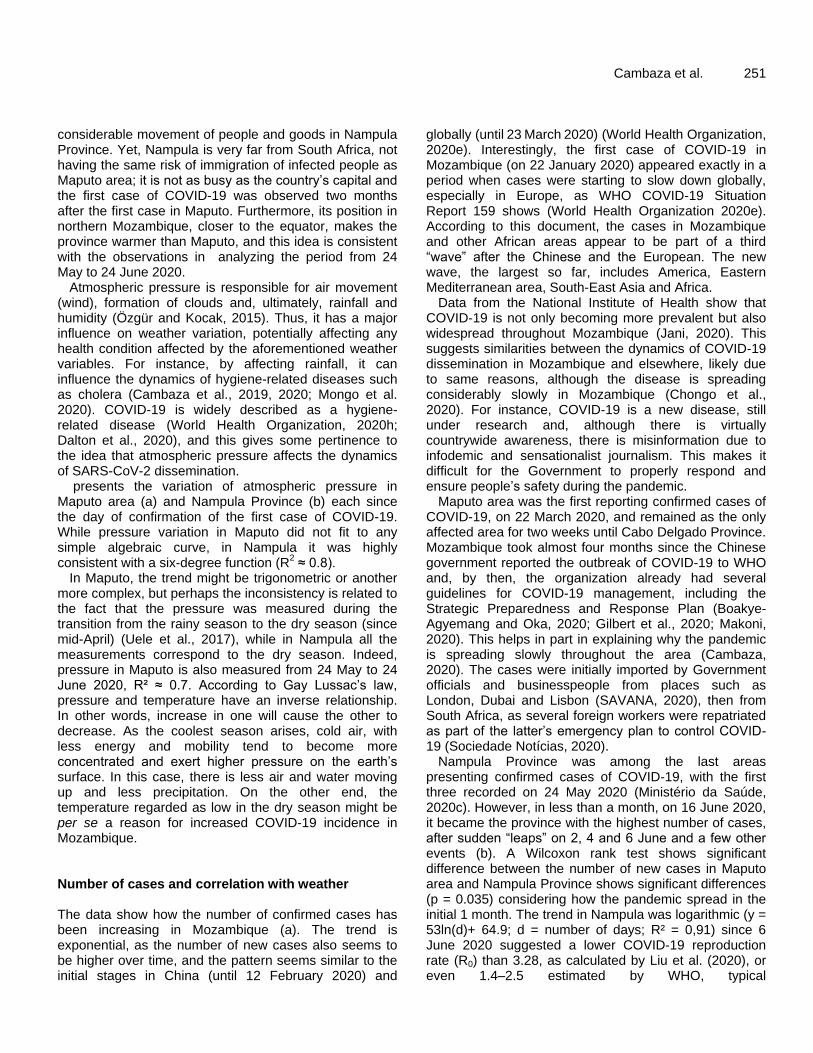
In Maputo, the trend might be trigonometric or another more complex, but perhaps the inconsistency is related to the fact that the pressure was measured during the transition from the rainy season to the dry season (since mid-April) (Uele et al., 2017), while in Nampula all the measurements correspond to the dry season. Indeed, pressure in Maputo is also measured from 24 May to 24 June 2020, R² ≈ 0.7. According to Gay Lussac’s law, pressure and temperature have an inverse relationship. In other words, increase in one will cause the other to decrease. As the coolest season arises, cold air, with less energy and mobility tend to become more concentrated and exert higher pressure on the earth’s surface. In this case, there is less air and water moving up and less precipitation. On the other end, the temperature regarded as low in the dry season might be per se a reason for increased COVID-19 incidence in Mozambique. Number of cases and correlation with weather The data show how the number of confirmed cases has been increasing in Mozambique (a). The trend is exponential, as the number of new cases also seems to be higher over time, and the pattern seems similar to the initial stages in China (until 12 February 2020) and
globally (until 23 March 2020) (World Health Organization, 2020e). Interestingly, the first case of COVID-19 in Mozambique (on 22 January 2020) appeared exactly in a period when cases were starting to slow down globally, especially in Europe, as WHO COVID-19 Situation Report 159 shows (World Health Organization 2020e). According to this document, the cases in Mozambique and other African areas appear to be part of a third “wave” after the Chinese and the European. The new wave, the largest so far, includes America, Eastern Mediterranean area, South-East Asia and Africa.
Data from the National Institute of Health show that COVID-19 is not only becoming more prevalent but also widespread throughout Mozambique (Jani, 2020). This suggests similarities between the dynamics of COVID-19 dissemination in Mozambique and elsewhere, likely due to same reasons, although the disease is spreading considerably slowly in Mozambique (Chongo et al., 2020). For instance, COVID-19 is a new disease, still under research and, although there is virtually countrywide awareness, there is misinformation due to infodemic and sensationalist journalism. This makes it difficult for the Government to properly respond and ensure people’s safety during the pandemic.
Maputo area was the first reporting confirmed cases of COVID-19, on 22 March 2020, and remained as the only affected area for two weeks until Cabo Delgado Province. Mozambique took almost four months since the Chinese government reported the outbreak of COVID-19 to WHO and, by then, the organization already had several guidelines for COVID-19 management, including the Strategic Preparedness and Response Plan (Boakye-Agyemang and Oka, 2020; Gilbert et al., 2020; Makoni, 2020). This helps in part in explaining why the pandemic is spreading slowly throughout the area (Cambaza, 2020). The cases were initially imported by Government officials and businesspeople from places such as London, Dubai and Lisbon (SAVANA, 2020), then from South Africa, as several foreign workers were repatriated as part of the latter’s emergency plan to control COVID-19 (Sociedade Notícias, 2020).
Nampula Province was among the last areas presenting confirmed cases of COVID-19, with the first three recorded on 24 May 2020 (Ministério da Saúde, 2020c). However, in less than a month, on 16 June 2020, it became the province with the highest number of cases, after sudden “leaps” on 2, 4 and 6 June and a few other events (b). A Wilcoxon rank test shows significant difference between the number of new cases in Maputo area and Nampula Province shows significant differences (p = 0.035) considering how the pandemic spread in the initial 1 month. The trend in Nampula was logarithmic (y = 53ln(d)+ 64.9; d = number of days; R² = 0,91) since 6 June 2020 suggested a lower COVID-19 reproduction rate (R0) than 3.28, as calculated by Liu et al. (2020), or even 1.4–2.5 estimated by WHO, typical

252 J. Public Health Epidemiol.
(a)
(b)
Figure 4. Atmospheric pressure variation in (a) Maputo area from 22 March to 24 June 2020 and (b) Nampula Province from 24 May to 24 June 2020.
in areas such as China or Europe (World Health Organization, 2020e). Mozambique and Maputo area also presented a seemingly exponential trend. Some
superspreader event quickly disseminated the disease but it was later isolated or controlled (Tiago, 2020b; Governo de Moçambique, 2020), as it would explain an
Cambaza et al. 253
(a)
(b)
Figure 5. Frequency of (a) confirmed cases in Mozambique, Maputo area and Nampula Province and (b) new cases in Maputo Area and Nampula Province from 22 March to 24 June 2020.
early inflexion from the initially exponential dissemination of the disease expected to a phase of a declining reproduction rate (Fujie and Odagaki, 2007; James et al.,
2007). For instance, Cabo Delgado, a province sharing Nampula’s northern border () was the first province in Mozambique showing evidence of community
254 J. Public Health Epidemiol.
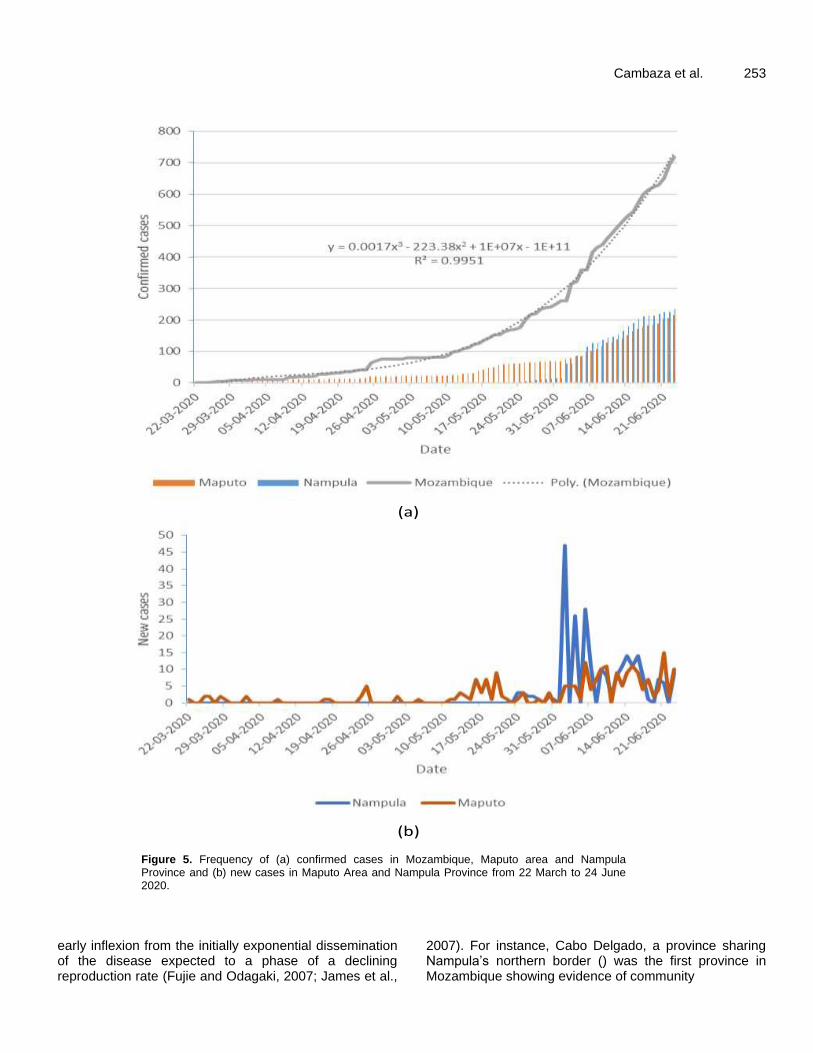
Figure 6. Correlations between confirmed COVID-19 cases and temperature variation in Mozambique from 22 March to 24 June 2020. All correlations were significant (p < 0.001). Tmin (C) = minimum daily temperature in degree Celsius; Tmax (C) = maximum daily temperature in degree Celsius; r = Pearson’s correlation; CI = confidence interval.
transmission (Ministério da Saúde, 2020c). Perhaps SARS-CoV-2 positive people migrated from Cabo Delgado to Nampula, and the fact that the “leaps” occurred within a week is consistent with the idea that the Ministry of Health has acted promptly according to WHO guidelines (Allegranzi et al., 2020; World Health Organization, 2020f, 2020g), isolating or controlling the super spreader.
Besides likely immigrations of SARS-CoV-2 positive individuals from Cabo Delgado, it is worth considering aforementioned factors potentially facilitating the propagation of the pandemic in Nampula Province, such as the large and dense population in comparison with other areas, polygamy and other population clustering social practices, Nacala Corridor and tourism (Instituto Nacional de Estatística, 2017; Arora, 2016; Jesus Rock and Wu, 2020; Zaehringer et al., 2018; Dantas e Sá and Mather, 2011).
Pearson’s correlations (r) suggest significant impact of temperature on the number of confirmed cases (), especially the minimum daily temperature. As expected from previous observations (Ma et al., 2020; Wang et al., 2020a), the number of cases seems to be inversely proportional to temperature. There are two indicators that
low temperatures are associated to increased cases of COVID-19: the inverse proportionality between temperature and number of cases and the fact that the minimum daily temperature presented a higher correlation with the number of confirmed cases.
The observations are also consistent with how widespread the disease was, by 25 February 2020, in the northern hemisphere (winter) and how sporadic it was in the southern (summer) (World Health Organization 2020b), and how quickly COVID-19 spread in the latter as it became increasingly cooler. Furthermore, South Africa has its most southern regions with very cold weather, sometimes snowing, and it is the African country with the highest number of cases. Interestingly, the number of cases in South Africa and other African areas (World Health Organization 2020e) has been increasing since the end of summer.
When the maximum daily temperature was within the range 25-30°C and the minimum was within 14-16°C there was a higher dispersion of number of cases (for instance, the frequency range of confirmed cases). By following the gridlines on , it is possible so see that these temperature ranges seem to correspond mostly to the same dates, during May 2020. Thus, perhaps for this

particular analysis temperature only suffices, whether it is maximum or minimum. This said, from the ranges mentioned, the level of dispersion decreases as temperature rises. Such dispersion might reflect some instability in the number of cases associated to the temperature ranges, and it reduces as one moves out of these “hotspots”. Temperatures below these ranges have fewer records, likely because Mozambique is in general a warm country, even during the dry season, rarely having temperatures low enough to produce ice in the atmosphere. May was a period of remarkable epidemiological turns in Mozambique: (1) b shows unprecedented number of new cases in Maputo between 10 May and 24 May 2020; (2) the comparison of the National Institute of Health daily reports from 1 May and 1 June 2020 (Ministério da Saúde, 2020d, 2020a) shows that it was during May 2020 that COVID-19 disseminated from 2 regions (Maputo area and Cabo Delgado Province) to the rest of the country. The high dispersion of confirmed cases in relation to some temperatures might be also due to the variation of frequency of cases throughout the different areas of Mozambique. In any case, temperature seems to play a role in the incidence of COVID-19 in the country.
The correlations between temperature and number of cases were even stronger and more significant in Maputo area and Nampula Province (p < 0.001; ). Maximum and minimum daily temperatures were also inversely
proportional to the number of cases, and there seems to be a more constant dispersion of frequencies of confirmed cases. The latter observation is consistent with the idea that such dispersion, observed in Figure 6, is in truth due to the consideration of several provinces, each with a particular number of confirmed cases. Minimum daily temperatures still show stronger impact on the number of confirmed cases. There are evident similarities between the observations in Mozambique, Maputo area and Nampula Province, as from all perspectives maximum and minimum daily temperatures presented the same sort of correlations with the number of cases. Indeed, regarding Maputo area (Figure 7a), these observations are highly related in part because initially all cases in Mozambique were observed in Maputo City, then Maputo Province, and even by the end of June 2020 Maputo area was among the areas with the highest number of cases.
By 8 July 2020, Maputo area, Cabo Delgado and Nampula provinces still presented the highest number of confirmed cases (Ministério da Saúde, 2020a). These are the areas expected to affect more strongly the country’s epidemiological profile of COVID-19. The fact that Nampula Province (a) also presents significant correlations and the same trends as the country and Maputo area support the idea that temperature affects the number of cases. In any case, lower temperatures present, once again, higher correlation with the number
Cambaza et al. 255 of cases and this is consistent with observations by Wang et al. (2020a) and Ma et al. (2020).
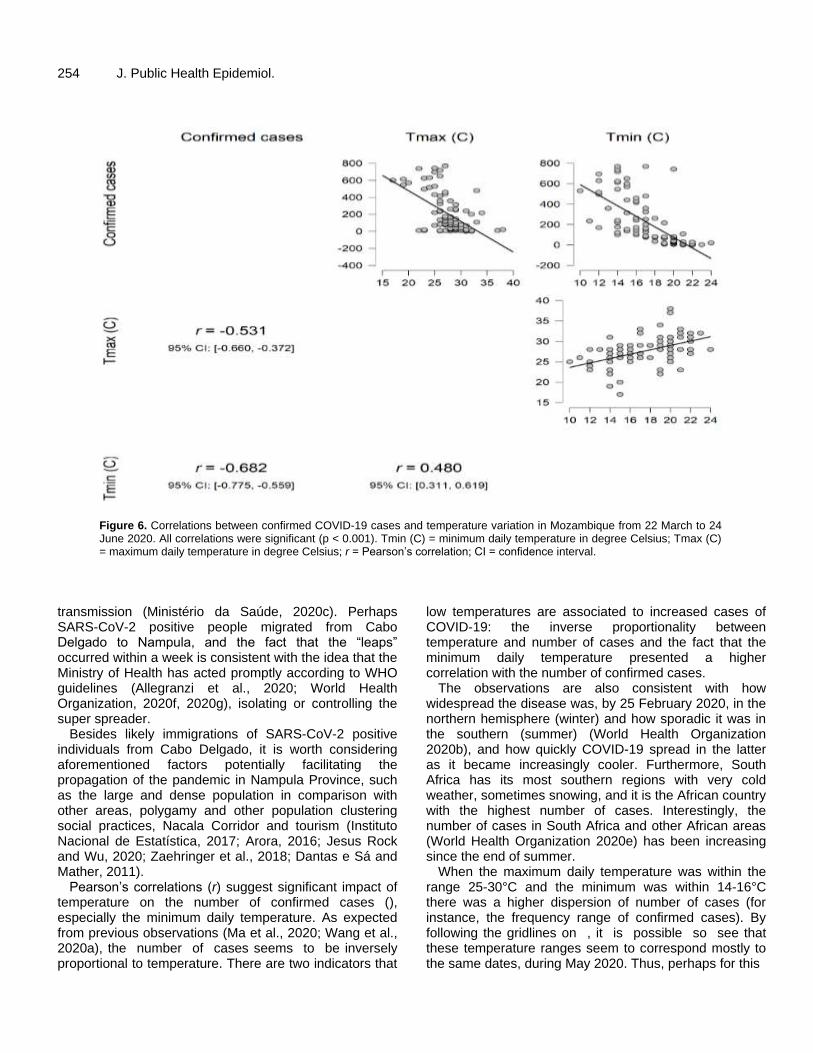
As shows, atmospheric pressure also showed significant correlation with the frequency of confirmed cases in Maputo area (p < 0.001; r = 0.518) and Nampula Province (p = 0.002; r = 0.533). It is well-known among meteorologists that high pressure originates sunny weather, sometimes foggy, while low pressure causes the formation of clouds and precipitation (Özgür and Kocak, 2015), and in part that is why pressure is measured in first place. By this logic, low pressure should increase the propensity for hygiene-related infectious diseases, and it is widely believed that COVID-19 belongs to this category (Ghebreyesus et al., 2020). However, the observation shows an opposite trend in both Maputo area and Nampula Province, the two of them with acceptable Pearson’s correlations. Perhaps rainfall was not the main pressure-related cause of COVID-19 dissemination because the dry season lasts from April to September in Mozambique, as several authorities agree (Uele et al., 2017; Manhique et al., 2019; Dade et al., 2014). Furthermore, the same sources showed that Maputo area’s average annual precipitation is rarely above 875 mm, being among the provinces with lower values. Nampula Province seems to be higher (mostly below 1,043 mm), but provinces such as Niassa, Manica and Zambézia have higher average precipitation per year, the latter presenting 2,135 mm in some districts. Thus, the relatively low levels of precipitation in these areas, combined with the dry season might not have produced enough water to cause major sanitation issues and facilitate the propagation of COVID-19. On the other hand, pressure seemed directly proportional to the number of cases, and this might be related to increased production of fog (Louw et al., 1998), thus, increased humidity in the air and on surfaces.
COVID-19 transmission route is still to be thoroughly understood (MacIntyre 2020; Jasarevic et al., 2020), but sources such as WHO (Organização Pan-Americana da Saúde, 2020) state that infected surfaces play a major role.
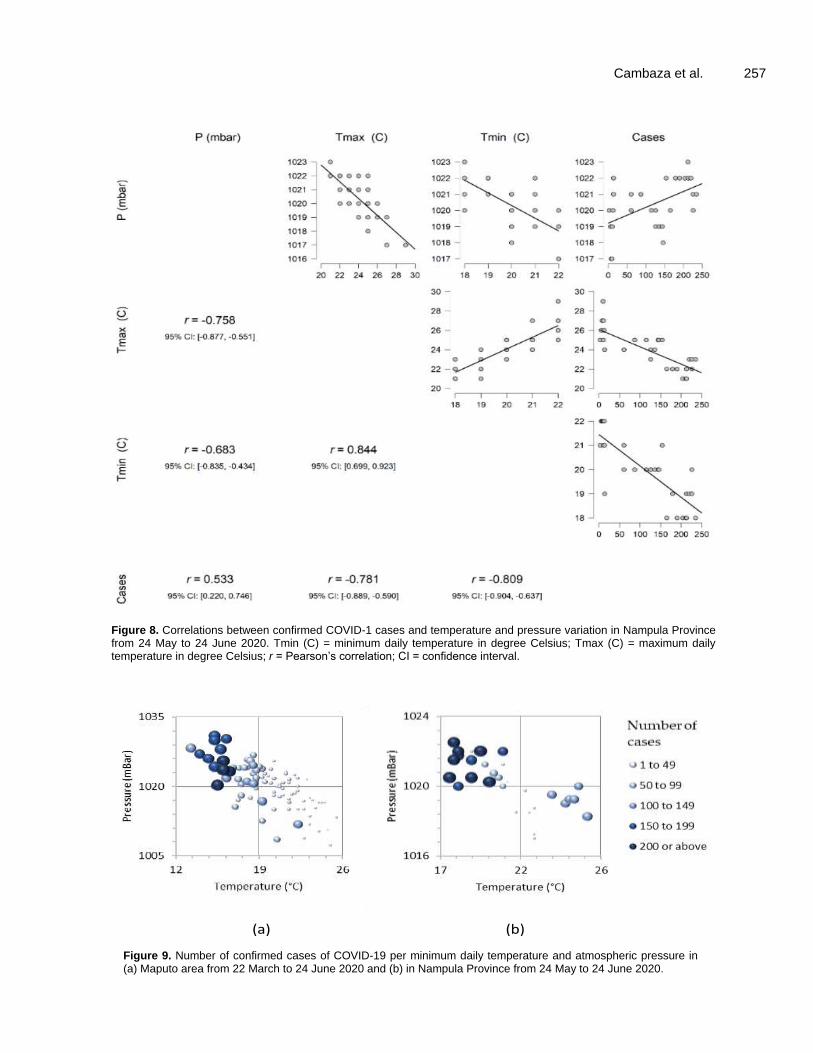
It is perhaps a good idea to analyze the combined relationship between both weather variables analyzed and the number of confirmed cases (). Since the first COVID-19 case was confirmed in Mozambique, as winter approached, the average trend of temperature was decreasing (), accompanied with increasing number of confirmed cases. Unlike temperature, the pressure increased in Maputo area and Nampula Province. Therefore, the results in both Maputo area and Nampula Province showed consistent ensemble relationship between the weather variables and the number of confirmed cases. The figures show greater number of confirmed cases when temperatures are lower and pressure higher, as expected. The phenomenon was less noticeable in Nampula Province (b), certainly because its

256 J. Public Health Epidemiol.
Figure 7. Correlations between confirmed COVID-1 cases and temperature and pressure variation in Maputo area from 22 March to 24 June 2020. Tmin (C) = minimum daily temperature in degree Celsius; Tmax (C) = maximum daily temperature in degree Celsius; r = Pearson’s correlation; CI = confidence interval.
sample was smaller than Maputo’s, yet it is clear that the number of confirmed cases decreases as one moves from the chart’s top left to bottom right.
Previous research by Guo et al. (2019) in Guangzhou, China showed that mean temperature and atmospheric pressure were associated with influenza cases. According to these authors, temperature is inversely proportional to influenza cases, while the risk of influenza increases with the increase of atmospheric pressure. Since COVID-19 is a respiratory disease frequently perhaps shares some features with other respiratory associated to low temperatures (Wang et al., 2020a), it
influenza and other respiratory diseases. Other studies, also in China, showed that local weather conditions with low temperature, mild diurnal temperature range and low humidity likely favor the transmission of COVID-19 (Liu et al., 2020; Ma et al., 2020; Wang et al., 2020b). Following the same logic, a study conducted in Japan found that COVID-19 prevalence decreased significantly as air temperature, air pressure, and UV index increased (Bashir et al., 2020). Thus, it seems reasonable to postulate that the dynamics of temperature-pressure can predict the number of COVID-19 confirmed cases in Mozambique,other Subsaharan African countries or area
Cambaza et al. 257
Figure 8. Correlations between confirmed COVID-1 cases and temperature and pressure variation in Nampula Province from 24 May to 24 June 2020. Tmin (C) = minimum daily temperature in degree Celsius; Tmax (C) = maximum daily temperature in degree Celsius; r = Pearson’s correlation; CI = confidence interval.
(a) (b)
Figure 9. Number of confirmed cases of COVID-19 per minimum daily temperature and atmospheric pressure in (a) Maputo area from 22 March to 24 June 2020 and (b) in Nampula Province from 24 May to 24 June 2020.
258 J. Public Health Epidemiol.
with similar settings or level of influence of weather on the sociopolitical dynamics.
Conclusions
This study aims to analyze how weather is related to COVID-19 dissemination in Mozambique. Early observations associated low temperatures to an increased number of COVID-19 confirmed cases. Data from Mozambique appear to support such observations. Maputo area and Nampula Province presented significant negative correlations between both variables. Being these two distinct areas in several ways, plus previous knowledge of the phenomenon elsewhere, it seems reasonable to admit that temperature is inversely proportional to the frequency of COVID-19 cases. Atmospheric pressure also showed a correlation with temperatures, but in a counterintuitive fashion. Pressure increased with the number of confirmed cases, suggesting that rainfall was a minor cause of COVID-19 dissemination. Instead, fog might be playing a significant role by surfaces humid enough for SARS-CoV-2 transmission. Moreover, there seems to be some combined influence of temperature and atmospheric pressure on the number of confirmed cases. Thus, it is possible to build predictive models for confirmed cases based on temperature and pressure. It is important to bear in mind that this study does not reveal any causality between weather variables and COVID-19 propagation. Weather’s impact on the dissemination of COVID-19 shall be regarded as potential rather than actual because the transmission route and pattern of propagation are not yet thoroughly understood among the scientific community. Thus, even if the weather is affecting the pandemic, it is important to consider it as a potential predictor rather than its driving force. Further studies could more deeply explore the dynamics of causality between the variables. Decision-makers in Mozambique can use the weather as a set of variables to pay attention among numerous others such as social and biological.
ABBREVIATIONS
COVID-19, Coronavirus disease of 2019; INS, Instituto Nacional de Saúde (National Institute of Health); MADIS, Meteorological Assimilation Data Ingest System; NASA, National Aeronautics and Space Administration; SARS-CoV-2, Severe Acute Respiratory Syndrome Coronavirus 2; SPSS, Statistical Product and Service Solutions; USA, United State of America; WHO, World Health Organization; WMO, World Meteorological Organization.
CONFLICT OF INTERESTS
The authors have not declared any conflict of interests.
REFERENCES
AccuWeather I (2020). AccuWeather, AccuWeather, Inc.
https://www.accuweather.com/. Accessed 12 July 2020 Allegranzi B, Baller A, Coutinho AP, Diaz J, Francis C, Clara M,
Padoveze, de Toledo JP, Kerkhove MV (2020). Infection prevention and control during health care when novel coronavirus (nCoV) infection is suspected: Interim guidance. In Technical Guidance. Geneva, Switzerland: World Health Organization.
Arora D (2016). Gendered poverty in peasant households: A case study of northern Mozambique. The University of Utah.
Bashir MF, Ma B, Bilal, Komal B, Bashir MA, Tan D, Bashir M (2020). Correlation between climate indicators and COVID-19 pandemic in New York, USA. Science of the Total Environment 728:138835.
Battineni G, Chintalapudi N, Amenta F (2020). Is Really Weather or Tropical Conditions Affects an Outbreak of COVID-19: A Brief Report, Pharmaceutical and Biomedical Research 6:0-0.
Boakye-Agyemang C, Oka S (2020). The African region reinforces preparedness for novel coronavirus, World Health Organization. https://www.afro.who.int/news/african-region-reinforces preparedness-novel-coronavirus. Accessed 18 February 2020
Cambaza E, Gazeta L, Anapakala E, Koseki S (2018). Lettuce (Lactuca sativa) handling features and coliform levels in markets of Maputo City. In Preprints, 1-15. MDPI AG.
Cambaza E, Mongo E, Anapakala E, Nhambire R, Singo J, Machava E (2019). Outbreak of Cholera Due to Cyclone Kenneth in Northern Mozambique. International Journal of Environmental Research and Public Health 16:2925.
Cambaza EM (2020). The African miracle: why COVID-19 seems to spread slowly in Sub-Saharan Africa, Revista Científica da UEM: Série Ciências Biomédicas e Saúde Pública, Preprint: 1-8.
Cambaza EM, Mongo E, Anapakala E, Nhambire R, Singo J, Machava E (2020). An Update on Cholera Studies in Mozambique. in Umar Bacha, Urška Rozman and Sonja Šostar Turk (eds.), Healthcare Access - Regional Overviews (IntechOpen Limited: London, UK).
Cedar Lake Ventures Inc. (2020). Weather Spark, Cedar Lake Ventures Inc. https://weatherspark.com/. Accessed 13 July 2020
Chongo AE, Sineque AR, Augusto O, Sumbana JS, Monteiro L, de Sousa IM, Mabasso AA (2020). COVID-19 Reproduction Rate: Relevance in the Mozambican Context, Revista Científica da UEM: Série Ciências Biomédicas e Saúde Pública, Preprint: 6.
Dade S, Pedro LV, Gimo N, Guiliche FA, Guimarães A, Chivambo M, Magaua M, Duarte L, Matsimbe A, Michangula P (2014). Caderno de Informação Rápida, 2014-Moçambique. In, edited by Instituto Nacional de Estatística. Maputo, Mozambique: Departamento de Difusão da Direcção de Coordenação Integração e Relações Externas (DICRE), Instituto Nacional de Estatística.
Dalton CB, Corbett SJ, Katelaris AL (2020). Pre-emptive low cost social distancing and enhanced hygiene implemented before local COVID-19 transmission could decrease the number and severity of cases. The Medical Journal of Australia 212:1.
Dantas e Sá V, Mather C (2011). Ilha de Moçambique: Conserving and Managing World Heritage in the Developing World. Tourism Review International 15:51-62.
Dzumbira W, Geyer HS, Geyer HS (2017).Measuring the spatial economic impact of the Maputo Development Corridor, Development Southern Africa, 34:635-651.
Ferrão JL, Mendes JM, Painho M, João SZ (2016). Spatio-temporal variation and socio-demographic characters of malaria in Chimoio municipality, Mozambique. Malaria Journal 15:329.
Fujie R, Odagaki T (2007). Effects of superspreaders in spread of epidemic. Physica 374:843-852.
Gates M (2020). Melinda Gates: Covid-19 will be horrible in the developing world. In CNN Business, edited by Poppy Harlow. Atlanta, GA, United States: Cable News Network (CNN). Turner Broadcasting System, Inc. Ghebreyesus TA, Ryan MJ, Christiane, Swaminathan S, Briand S, Kieny M-P, MacDonald V, Tom, John, Mazumdar T, Cohen J, Bodhi, Stephanie, von Hall G (2020). Coronavirus press conference 11 February, 2020. In Coronavirus Disease (COVID-2019) Press

Cambaza et al. 259 Briefings, edited by Tarik Jasarevic. Geneva, Switzerland: World Health Organization.
Gilbert M, Pullano G, Pinotti F, Valdano E, Poletto C, Boelle P-Y, D'Ortenzio E, Yazdanpanah Y, Eholie SP, Altmann M, Gutierrez B, Kraemer MUG, and Colizza V (2020). Preparedness and vulnerability of African countries against importations of 2019-nCoV. The Lancet
Governo de Moçambique (2020). MISAU activa várias medidas para conter transmissão comunitária da Covid-19 em Nampula. https://www.portaldogoverno.gov.mz/index.php/por/Imprensa/Noticias/MISAU-activa-varias-medidas-para-conter-transmissao-comunitaria-da-Covid-19-em-Nampula. Accessed 5 July 2020
Guo Q, Dong Z, Zeng W, Ma W, Zhao D, Sun X, Gong S, Xiao J, Li T, Hu W (2019). The effects of meteorological factors on influenza among children in Guangzhou, China. Influenza Other Respir Viruses 13:166-175.
Houssin D, Ghebreyesus TA, Yang, Keaton J, Lanche J, Kupferschmidt K (2020). WHO Emergencies Coronavirus Emergency Committee Second Meeting, 30 January 2020. In Coronavirus Disease (COVID-2019) Press Briefings, edited by Christian Lindmeier. Geneva, Switzerland: World Health Organization.
Instituto Nacional da Saúde (2020a). Documentos, Instituto Nacional da Saúde. https://covid19.ins.gov.mz/documentos/. Accessed 14 July 2020
Instituto Nacional da Saúde (2020b). Fica Atento, Instituto Nacional da Saúde. https://covid19.ins.gov.mz/. Accessed 13 July 2020
Instituto Nacional de Estatística (2017). Censo 2017: IV Recenseamento Geral da População e Habitação. In Censo, 14. Maputo, Mozambique: Gabinete do Presidente, Instituto Nacional de Estatística.
International Organization for Standardization (1975). ISO 2533:1975 Standard Atmosphere. In, 108. Geneva, Switzerland: International Organization for Standardization.
James A, Pitchford JW, Plank MJ (2007). An event-based model of superspreading in epidemics, Proceedings. Biological Sciences 274:741-747.
Jani IV (2020). Análise da situação epidemiológica Sars-CoV-2/COVID-19, Instituto Nacional da Saúde. https://covid19.ins.gov.mz/wp-content/uploads/2020/06/An%C3%A1lise-Epidemiologica-22.06.2020.pdf. Accessed 30 June 2020
Jasarevic T, Chaib F, Lindmeier C, Nery T (2020). WHO, China leaders discuss next steps in battle against coronavirus outbreak, World Health Organization. https://www.who.int/news-room/detail/28-01-2020-who-china-leaders-discuss-next-steps-in-battle-against-coronavirus-outbreak. Accessed 10 February 2020
Jesus Rock ED, Wu S (202).The Nacala Corridor Railway and Port PPP project Risks identification research, IOP Conference Series: Earth and Environmental Science 474:042001.
Liu J, Zhou J, Yao J, Zhang X, Li L, Xu X, He X, Wang B, Fu S, Niu T, Yan J, Shi Y, Ren X, Niu J, Zhu W, Li S, Luo B, Zhang K (2020). Impact of meteorological factors on the COVID-19 transmission: A multi-city study in China. Science of the Total Environment 726:138513.
Liu Y, Gayle AA, Wilder-Smith A, Rocklöv J (2020). The reproductive number of COVID-19 is higher compared to SARS coronavirus. Journal of Travel Medicine, p. 27.
Louw C, Van Heerden J, Olivier J (1998). The South African fog-water collection experiment: Meteorological features associated with water collection along the eastern escarpment of South Africa, Water SA, 24:269-280.
Lowen AC, Steel J (2014). Roles of humidity and temperature in shaping influenza seasonality. Journal of Virology 88:7692-7695.
Ma Y, Zhao Y, Liu J, He X, Wang B, Fu S, Yan J, Niu J, Zhou J, and Luo B (2020). Effects of temperature variation and humidity on the death of COVID-19 in Wuhan, China. Science of the Total Environment 724:138226.
MacIntyre CR (2020). Wuhan novel coronavirus 2019nCoV – update January 27th 2020, Global Biosecurity, 1.
Makoni M (2020). Africa prepares for coronavirus, Lancet 395:483. Manhique AJ, Zucule J, Macandza NJ, Duvane A, Arcanjo A, Silinto BF,
Patrício DM, Congolo F, Raiva IGA, Sequeira JA, and Couto P
(2019). Atlas de Precipitação Moçambique (Instituto Nacional de Meteorologia: Maputo, Mozambique).
Ministério da Saúde (2016). Plano Nacional de Desenvolvimento de Recursos Humanos para a Saúde. In, 151. Maputo, Mozambique: Ministério da Saúde.
Ministério da Saúde (2020a). Boletim Diário COVID-19. In, edited by Departamento de Saúde Pública, 17. Maputo, Mozambique: Ministério da Saúde.
Ministério da Saúde. (2020b). Boletim Diário COVID-19. In, edited by Departamento de Saúde Pública, 19. Maputo, Mozambique: Ministério da Saúde.
Ministério da Saúde. (2020c). Boletim Diário COVID-19. In, edited by Departamento de Saúde Pública, 18. Maputo, Mozambique: Ministério da Saúde.
Ministério da Saúde (2020d). Boletim Diário COVID-19. In, edited by Departamento de Saúde Pública, 15. Maputo, Mozambique: Ministério da Saúde.
Mongo E, Cambaza E, Nhambire R, Singo J, Machava E (2020). Outbreak of Cholera Due to Cyclone Idai in Central Mozambique (2019). in Sandeep Reddy and Aida Isabel Tavares (eds.), Evaluation of Health Services (IntechOpen: London, UK).
Nachega JB, Seydi M, Zumla A (2020). The late arrival of COVID-19 in Africa-mitigating pan-continental spread, Clinical Infectious Diseases.
National Weather Service (2020). The National Weather Service (NWS), National Weather Service. https://www.weather.gov/about/. Accessed 14 July 2020
Njenga MK, Dawa J, Nanyingi M, Gachohi J, Ngere I, Letko M, Otieno C, Gunn BM, and Osoro E (2020). Why is There Low Morbidity and Mortality of COVID-19 in Africa? The American Journal of Tropical Medicine Hygiene: tpmd200474.
Nyusi J (2020a). Comunicação à Nação de Sua Excelência Filipe Jacinto Nyusi, Presidente da República. In, edited by Gabinete de Imprensa, 5. Maputo, Mozambique: Presidência da República de Moçambique.
Nyusi J (2020b). Decreto Presidencial 11/2020: Declara o Estado de Emergência, por razões de calamidade pública, em todo o território nacional', Boletim da República: Publicação Oficial da República de Moçambique, 1(61):325-26.
Organização Pan-Americana da Saúde (2020). Folha informativa – novo coronavírus (COVID-19), Organização Pan-Americana da Saúde.https://www.paho.org/bra/index.php?option=com_content&view=article&id=6101:folha-informativa-novo-coronavirus-2019-ncov&Itemid=875. Accessed 11 March 2020
Özgür E, Kocak K (2015). The Effects of the Atmospheric Pressure on Evaporation. Acta Geobalcanica 1:17-24.
Rogerson CM (2001). Spatial development initiatives in Southern Africa: The Maputo Development Corridor, Tijdschrift voor economische en sociale geografie 92:324-346.
SAVANA (2020). 'Insurgentes, Coronavírus e Nyungue: um grande teste à liderança de Filipe Nyusi', Savana P 3.
Sociedade Notícias (2020). Temos 104 infectados: regressado da África do Sul acusa positivo para a COVID-19, Sociedade Notícias. https://www.jornalnoticias.co.mz/index.php/sociedade/97055-temos-104-infectados-regressado-da-africa-do-sul-acusa-positivo-para-a-covid-19. Accessed 4 July 2020
Team J (2019). JASP (Version 0.10.2) [Computer software]. In. Amsterdam, Netherlands: University of Amsterdam.
The World Bank Group (2020). FAQs: Global Poverty Line Update, The World Bank Group. https://www.worldbank.org/en/topic/poverty/brief/global-poverty-line- faq#:~:targetText=As%20of%20October%202015%2C%20the,at%20%241.90%20using%202011%20prices. Accessed 30 June 2020
Tiago A (2020a). Comunicado de Imprensa. In, edited by Ministério da Saúde, 4. Maputo, Mozambique: Ministério da Saúde.
Tiago A (2020b). Saúde declara contaminação comunitária na cidade de Nampula Sociedade Notícias. https://www.jornalnoticias.co.mz/index.php/capital/nampula/97398-saude-declara-contaminacao-comunitaria-na-cidade-de-nampula. Accessed 5 July 2020
Time and Date AS (2020). timeanddate.com, Time and Date AS.
260 J. Public Health Epidemiol.
https://www.timeanddate.com/. Accessed 13 July 2020 Uele DI, Lyra GB, Júnior JFdO (2017). Variabilidade Espacial e
Intranual das Chuvas na Região Sul de Moçambique, África Austral, revista brasileira de meteorologia 32:473-484.
United Nations (2013). Ficheiro:Un-mozambique.png, Wikimedia Foundation Inc. https://commons.wikimedia.org/wiki/File:Un-mozambique.png. Accessed 13 December 201
Wang J, Tang K, Feng K, Lv W(2020a). High temperature and high humidity reduce the transmission of COVID-19, SSRN Electronic Journal.
Wang J, Tang K, Feng K, Lv WJAaS (2020b). High temperature and high humidity reduce the transmission of COVID-19.
World Health Organization (WHO) (2020a). Coronavirus disease 2019 (COVID-19) Situation Report - 25. In Coronavirus disease 2019 (COVID-19) situation reports, 7. Geneva, Switzerland: World Health Organization.
World Health Organization (WHO) (2020b). Coronavirus disease 2019 (COVID-19) Situation Report - 37. In Coronavirus disease 2019 (COVID-19) situation reports, 6. Geneva, Switzerland: World Health Organization.
World Health Organization (WHO) (2020c). Coronavirus disease 2019 (COVID-19) Situation Report - 62. In Coronavirus disease 2019 (COVID-19) situation reports, 9. Geneva, Switzerland: World Health Organization.
World Health Organization (WHO) (2020d). Coronavirus disease 2019 (COVID-19) Situation Report - 63. In Coronavirus disease 2019 (COVID-19) situation reports, 9. Geneva, Switzerland: World Health Organization.
World Health Organization (WHO) (2020e). Coronavirus disease 2019
(COVID-19) Situation Report - 159. In Coronavirus disease 2019 (COVID-19) situation reports, 16. Geneva, Switzerland: World Health Organization.
World Health Organization (WHO) (2020f). Home care for patients with suspected novel coronavirus (nCoV) infection presenting with mild
symptoms and management of contacts: Interim guidance. In Technical Guidance. Geneva, Switzerland: World Health Organization.
World Health Organization (WHO) (2020g). Operational considerations for managing COVID-19 cases / outbreak on board ships: Interim guidance. In Coronavirus disease (COVID-19) technical guidance, 11. Geneva, Switzerland: World Health Organization.
World Health Organization (WHO) (2020h). Water, sanitation, hygiene and waste management for COVID-19: technical brief. In. Geneva, Switzerland: World Health Organization.
Zaehringer JG, Atumane A, Berger S, Eckert S (2018). Large-scale agricultural investments trigger direct and indirect land use change: New evidence from the Nacala corridor, Mozambique, Journal of Land Use Science 13:325-343.