potential neuraminidase inhibitors via virtual …
TRANSCRIPT

POTENTIAL NEURAMINIDASE INHIBITORS
VIA VIRTUAL SCREENING, KINETIC STUDIES,
AND ADME PREDICTIONS
RINA FAJRI NUWARDA
UNIVERSITI SAINS MALAYSIA
2015

POTENTIAL NEURAMINIDASE INHIBITORS
VIA VIRTUAL SCREENING, KINETIC STUDIES,
AND ADME PREDICTIONS
by
RINA FAJRI NUWARDA
Thesis submitted in fulfillment of the requirements
for the Degree of Master of Science
October 2015

ii
ACKNOWLEDGEMENTS
In the name of Allah, the Most Gracious, the Most Merciful.
All praise is due Allah, for giving me strength and opportunity to do this work and for
putting so many good people in my way. May Allah's peace and blessing be upon
Prophet Muhammad (Peace be upon him), whose way of life has been a continuous
model for mankind.
First and foremost, I would like to express my sincere gratitude and deep appreciation
to my supervisor, Prof. Habibah Abdul Wahab, who gave me the opportunity to work
in this research group, her continuous support, motivation, and guidance have made
this thesis possible. I am also very grateful to my co-supervisor Assoc. Prof. Dr. Tan
Mei Lan for her time and untiring assistance she has kindly spent to guide my research,
without which it would have been impossible to complete my thesis.
My heartfelt thanks to Yusuf and Maywan, for being really supportive friends all the
time, and also to my senior Safri, for his help, encouragement and valuable discussions.
Many thanks to my fellow lab mates in the Pharmaceutical Design and Simulation
Laboratory (PhDS) Universiti Sains Malaysia and also to the coolest lab companions
ever: Asyraf, Yea Lu, Yi Fan, Yanti, Anis, and Yoong Min in the Lead Optimization
Division Institut Farmasetikal dan Nutrasetikal Malaysia (IPHARM). This work could
not have been completed without their help and contributions.

iii
Furthermore, I'd like to thank Nadia, Izzati, and Fatemeh for their wonderful friendship
since the very first time I started my study. Special thanks to my friends in the
Indonesian Student Association (PPI) Universiti Sains Malaysia, and also my
international friends Bija, Hamza, Nadirah, Mahmoud, Bilal, Abdullah, and Hidayu
who have been the best family during my stay in Penang. Thank you for all the
moments we spent together, for the friendships and comforting words through rough
times in our study. My sincere thank also goes to my big family and best friends in
Indonesia for always supporting me in any way possible.
Last but not least, no words are ever sufficient to express my everlasting gratitude,
appreciation and thanks to my beloved, wonderful parents for their constant supports,
prayers and inspiration. My sister Widya, for always being such an understanding and
uplifting one, there's really no better friend than a sister. My heartfelt love and thanks
to them for always believing in me and helping me in every way while I work to
achieve my dreams.
Al-hamdu lillahi rabbil 'alamin.
iv
TABLE OF CONTENTS
Page
ACKNOWLEDGEMENT ………………………………………………..... ii
TABLE OF CONTENTS …………………………………………………... iv
LIST OF TABLES ………………………………………………………..... x
LIST OF FIGURES ………………………………………………………… xi
LIST OF SCHEMES ……………………………………………………….. xvii
LIST OF SYMBOLS AND ABBREVIATIONS …………………………... xviii
LIST OF PUBLICATIONS AND CONFERENCES ……………………..... xx
ABSTRAK ………………………………………………………………..... xxi
ABSTRACT ………………………………………………………………... xxiii
CHAPTER 1 – INTRODUCTION ……………………………………….. 1
1.1. Statement of the Problem …………………..…………………………. 1
1.2. The Influenza ………..………………………………………………... 4
1.2.1. Epidemics and Pandemics ………………………………….... 4
1.2.2. The Influenza Virus …………………………………..……… 7
1.2.3. Influenza Virus Life Cycle ……………………...…………… 8
1.2.4. Influenza Virus Neuraminidase ……………………………… 10
1.2.4.1. Structure of Neuraminidase ………………………. 10
1.2.4.2. The Substrate and the Active site of Neuraminidase 12
1.2.4.3. Neuraminidase Inhibitor ………………………….. 16
1.3. Computational Methods for Drug Discovery ………..……………… 18
1.4. Enzyme Kinetics ……………………………………………………… 23

v
Page
1.4.1. Maximum Rate of Metabolism (Vmax) and Michaelis Constant
(Km) …………………………………………………………...
23
1.4.2. Inhibition Constant (Ki) ……………………………………… 26
1.5. Absorption, Distribution, Metabolism, and Excretion (ADME) of
Compounds ……………………………………………………………
29
1.5.1. Overview …………….………………………………………. 29
1.5.2. Drug Absorption …………………………………………… 30
1.5.3. Drug Distribution …………………………………………….. 32
1.5.4. Drug Metabolism …………………………………………….. 33
1.5.5. Drug Excretion ………………………………………………. 34
CHAPTER 2 – MATERIALS AND METHODS ………..……………… 36
2.1. Materials and Reagents ………………………………………………. 36
2.2. Instruments …………………………………………………………… 36
2.3. Overview of the Methodology ..……………………………………… 38
2.4. Automated Flexible Ligand Docking Of NCI Compound Database
…………………………………………………………………………
40
2.4.1. Software ……….……………………………….….………… 41
2.4.2. Preparation of Target Macromolecule (3TI6) ……………….. 41
2.4.3. Positive Control Docking ……………………………………. 42
2.3.3.1. Preparation of Ligand (Oseltamivir/NCI) ………… 42
2.3.3.2. Creating Grid Parameter File ……………………... 42
2.3.3.3. Creating Docking Parameter File ………………… 43
2.4.4. Virtual Screening of NCI Database …………………………. 43
2.5. Development of Neuraminidase Inhibition Assay using Alphascreen
Technology ……………..……………………………………………..
44
2.5.1. Biotinylation of lpha-1-acid glycoprotein (AGP) ………….. 44

vi
Page
2.5.1.1. Buffer Exchange ………………….………………. 44
2.5.1.2. Determination of AGP Concentration Using BCA
(Bicinchoninic Acid Assay) Protein Assay Kit ……
45
2.5.1.3. Preparation of ChromaLink Biotin Reagent Water
Soluble …………………………………………….
46
2.5.1.4. Biotinylation Reaction ……………………………. 46
2.5.1.5. Desalting Procedure ………………………………. 47
2.5.1.6. Quantification of Biotin Incorporation in
Biotinylated AGP ………………………………….
47
2.5.1.7. TruHits Detection of Biotinylated AGP ………….. 48
2.5.2. Protein-protein Interaction Experiments: Biotinylated AGP
and Lectin WGA Acceptor Beads Binding Partner
…….…..…………………………………………….……....
51
2.5.2.1. Biotinylated AGP and Lectin WGA Binding
Experiment ………………………………………...
51
2.5.2.2. Buffer Optimization ………………………………. 51
2.5.2.3. Biotinylated AGP and Lectin WGA Binding
Experiment in the Presence of NA
……………………………………………………..
52
2.5.2.4. Optimization of NA and biotinylated AGP via Cross
Titration Experiment …………...…………...
53
2.5.3. Validation of Assay Protocol with Oseltamivir Carboxylate ... 54
2.6. Fluorometric neuraminidase assay using MUNANA as substrate …… 56
2.6.1. Preparation of Stock Solution ……………………………….. 57
2.6.2. Preparation of the Working Solution ……………………..…. 58
2.6.3 Preparation of Substrate and Enzyme ……….…………...….. 58
2.6.4. Neuraminidase Optimal Activity Assay ……………………... 58
2.6.5. Validation of MUNANA assay using oseltamivir carboxylate
and 2-deoxy-2,3-didehydro-N-acetylneuraminic acid (DANA)
……………………………………………………...………...
59
2.6.6. Neuraminidase inhibition assay for in silico hits compounds .. 60

vii
Page
2.6.6.1. Preparation of in silico Hits Compounds ….………. 60
2.6.6.2. Inhibition Assay of in silico Hits Compounds ……. 60
2.6.7. Neuraminidase Kinetic Assay ………………………………... 62
2.6.7.1. Determination of Vmax and Km for MUNANA ..….. 62
2.6.7.2. Determination of Ki for Neuraminidase Inhibitor … 62
2.7 In silico ADME Prediction of top NCI Compounds .…………………. 63
2.7.1. Software ……………………………………………………… 63
2.7.2. Methods ……………………………………………………… 64
CHAPTER 3 – RESULTS AND DISCUSSIONS ………………………. 65
3.1. Automated Flexible Ligand Docking of NCI Compound Database …. 65
3.1.1. Control Docking with Oseltamivir …………………………... 65
3.1.2. Virtual Screening Results …………………………………….. 67
3.2. Development of Neuraminidase Inhibition Assay using AlphaScreen
technology ……….……………………………………………………
86
3.2.1. Biotinylation of alpha-1-acid glycoprotein (AGP) …………. 89
3.2.2. Protein-protein Interaction Experiments: Biotinylated AGP
and Lectin WGA Acceptor Beads Binding Partner …………..
93
3.2.2.1. Biotinylated AGP - Lectin WGA Binding
Experiment ………………………………………...
93
3.2.2.2. Buffer Optimization ………....……………………. 95
3.2.2.3. Biotinylated AGP and Lectin WGA Binding
Experiment in the Presence of NA ……………..….
98
3.2.2.4. Biotinylated AGP-Lectin WGA Cross Titration
Experiment ………………………………………...
99
3.2.3 Validation of Assay Protocol with OTV as Known Inhibitor
….………………………………………...…………………...
102
3.3. Fluorometric Neuraminidase Assay Using MUNANA as Substrate … 105

viii
Page
3.3.1.
NA Optimal Activity Assay …………………………………
106
3.3.2. Validation of MUNANA Assay Using Oseltamivir
carboxylate and 2-deoxy-2,3-didehydro-N-acetylneuraminic
acid (DANA) …………………………………………………
107
3.3.3. Neuraminidase Inhibition Assay For 40 In Silico Hits
Compounds …………………………………………………..
108
3.3.4. Neuraminidase Kinetic Assay ……………………………….. 119
3.3.4.1. Determination of Vmax and Km for MUNANA ...…. 120
3.3.4.2. Inhibition Constant for Oseltamivir Carboxylate
and DANA as Known NA Inhibitor ………………
121
3.3.4.3. Inhibition Constant for Top 4 in vitro Compounds . 123
3.4. Absorption, Distribution, Metabolism, and Excretion of NCI Top
Compounds ……………………………………………………………
125
3.4.1. Assessment of Drug-likeness Properties ……………………... 126
3.4.2. Assessment of Pharmacokinetic Properties ………………….. 129
3.4.2.1. Degree of ionization (pKa) ………………….....…. 129
3.4.2.2. Topological Polar Surface Area (TPSA) …………. 131
3.4.2.3. Fraction Absorbed (%F) ………………………….. 132
3.4.2.4. Volume Distribution (Vd) ………………………... 132
3.4.2.5. Plasma protein binding (%PPB) ………………….. 133
3.4.2.6. Cytochrome (CYP) P450 Inhibitors and Substrate
Probability) ………………………………………..
133
CHAPTER 4 – CONCLUSION ……………………..…………………… 137
4.1. Objective Accomplishment ……………….…………….……………. 137
4.2. Recommendation for Future Studies …………...……………………. 140

ix
Page
REFERENCES …………………………………………………………….. 141
APPENDICES ……………………………………………………………... 151

x
LIST OF TABLES
Page
Table 2.1
Table 2.2
Table 2.3
Table 2.4
Table 3.1
Table 3.2
Table 3.3
Table 3.4
Table 3.5
Table 3.6
Materials and Reagents
Parameters of molecular docking for virtual screening of NCI
database
The composition of well and expected signal generated in the
biotin AGP-Lectin WGA experiments
Composition of each well: ( ) inhibitor; ( ) blank; and ( )
positive control.
Two-dimensional structure of compounds from virtual
screening results, consists of 39 compounds and 1 compound as
the top rank and the lowest rank of FEB, respectively.
Amino acid residue involved in the hydrogen bond and pi-pi
interactions between ligand and NA of the selected compounds.
Free energy of binding and % inhibition of selected NCI
compounds from virtual screening experiments.
Assessment of drug-likeness properties based on Lipinski's
Rule-of-Five.
Assessment of pharmacokinetic properties
Cytochrome (CYP) P450 inhibitors and substrate probability
for top 4 compounds
37
43
56
62
68
84
109
128
130
135

xi
LIST OF FIGURES
Page
Figure 1.1 Influenza virus can change in two different way. Antigenic
drift is small changes in the virus that produce new virus
strains that may not be recognized by the body's immune
system while antigenic shift is an abrupt, major change
resulting new hemagglutinin and/or new hemagglutinin and
neuraminidase proteins in influenza viruses …………………
5
Figure 1.2 Diagram of Influenza A virus. On the outside virus particles, 3
viral proteins: haemagglutinin (HA, trimers), neuraminidase
(NA) (tetramers) and M2 (tetramers that make up ion-
channels) are exposed …………………………...……………
8
Figure 1.3 Influenza virus replication cycle (Gubareva et al., 2000) …..… 10
Figure 1.4 Three dimensional structure of an N2 neuraminidase tetramer
in complex with sialic acids (PDB ID 2BAT) (Varghese et al.,
1992) ……………………………………………………….
11
Figure 1.5 a. The two most common sialic acids are N-acetyl neuraminic
acid (Neu5Ac) and N-glycolylneuraminic acid (Neu5Gc). b.
Sialic acids are attached to carbohydrate chains on
glycoproteins and glycolipids via different glycosidic linkages.
The most common linkage types are α2, 3-linkage to a
galactose residue, α2,6-linkage to a galactose moiety or to
an N-acetylgalactosamine moiety, and α2,8-linkage to another
sialic acid moiety on a glycan (Stencel-Baerenwald et al.,
2014) ..………………………….…………………………….
13
Figure 1.6 Neuraminidase active site consists of functional amino acid
residues Arg118, Asp151, Arg152, Arg224, Glu 276, Arg292,
Arg371, and Tyr406, which are in direct contact with sialic
acid, and structural amino acids residue Glu119, Arg156,
Trp178, Ser179, Asp (or Asn in N7 and N9)198, Ile222,
Glu227, Glu277, Asp293, and Glu42. (Protein Data Bank ID:
2BAT www.rcsb.org) …...…………….…….…….……..…
15
Figure 1.7 Mechanism of Action of Neuraminidase Inhibitors. Panel A
shows the action of neuraminidase in the continued replication
of virions in influenza infection. The replication is blocked by
neuraminidase inhibitors (Panel B), which prevent from being
release from the surface of infected cells. ……………………
16

xii
Page
Figure 1.8 Neuraminidase crystal structure in complex with zanamivir
(PDB ID: 3B7E) (Xu et al., 2008) …….…….………………
18
Figure 1.9. Mechanism of ligand interactions in the receptor binding site
…….……………………………………..……………..……..
22
Figure 1.10 Velocity of product formation or substrate disappearance is
defined as the change in product concentration per unit time.
Velocity is the slope of a plot o product concentration against
time ………………………………..………………………….
24
Figure 1.11 Plot of Michaelis-Menten equation, reaction velocity as a
function of substrate concentration, where the substrate
concentration affects the velocity of reaction. The significance
of kinetic parameters Vmax and Km are depicted ……...…….
25
Figure 1.12 Determination of Km with Lineweaver-Burk Plot …...…….. 26
Figure 1.13 Lineweaver-Burk Plot for competitive, uncompetitive, and
noncompetitive enzyme inhibition ………….………………..
27
Figure 1.14 Determination of Inhibition constant (Ki) - Dixon Plot for
competitive inhibition …………………………………..…….
28
Figure 1.15 Determination of Inhibition constant (Ki) - Dixon Plot for
noncompetitive inhibition. ……………………………………
29
Figure 2.1 Overview of the methodology ……………………………… 39
Figure 2.2 Flow chart of molecular docking and virtual screening
experiments ………..………………………….………………
40
Figure 2.3 Flow chart of development of neuraminidase inhibition assay
AlphaScreenTM technology ………………….………………..
44
Figure 2.4 ChromaLink Biotin Protein Labeling Calculator ……………. 46
Figure 2.5 BCA ChromaLink Biotin MSR Calculator to determine biotin
incorporation into protein ………………….…………………
48
Figure 2.6 Biotinylation of AGP illustration and summarized protocol …. 50
Figure 2.7 Summarize protocol and illustration of Biotin AGP-Lectin
WGA binding experiments ………..…………………………
54
Figure 2.8 Flow chart of MUNANA assay (inhibition and kinetic assay)
and in silico ADME prediction. ……………………………….
57

xiii
Page
Figure 2.9 Illustration of the 96-well microplate for NA optimal activity
assay. Each well contains 50 µL NA and 50 µL MUNANA.
Wells with red colors represent serial dilution of NA, while
wells with green colors represent negative control (without
NA) and yellow colors represent blank (buffer) ……………...
59
Figure 2.10 Illustration of the 96-well microplate for inhibition assay ..…... 61
Figure 2.11 Illustration of the 96-well microplate for kinetic assay. Each
well contains 25 µL of inhibitors, 25 µL NA, and 50 µL
MUNANA …...…………………….…………………………
63
Figure 3.1 Cluster analysis of docking result of oseltamivir as control
ligand. Histogram showed that there are four clusters resulted
in the docking simulation. The lowest binding energy with
value -9.75 kcal was found in the largest cluster …..…………..
66
Figure 3.2 The superposition of the initial pose (green color) and the
control docking pose (blue color) of oseltamivir (PDB ID
3TI6). RMSD value obtained was 0.97 Å …..………………...
67
Figure 3.3 Overlay of NSC 5069 structure (green carbon color) with OTV
(turquoise carbon color) and their binding to neuraminidase
active site in 3TI6 crystal structure. Dashed lines represented
the H-bonds between these compounds and important amino
acid residues of 3T16 .…...………….…...…………..………..
82
Figure 3.4 Two dimensional (2D) diagram of NSC 293778 showing Pi
interactions (orange lines) between ligand and amino acid
residues in NA binding site. Blue dotes and blue circles are the
part of compounds or amino acid residues which are exposed
to solvent …………….…...…………………….………….…
83
Figure 3.5 Alpha-1-acid Glycoprotein structure, sialic acid structure was
presented in green color (PDB ID: 3APU) ...………………….
88
Figure 3.6 Biotinylation of AGP allows the protein to interact with
streptavidin-coated donor beads ………………………………
91
Figure 3.7 TruHits signal inhibition by increasing concentration of AGP.
AGP final concentration ranging from 0.3 nM to 300 nM were
used ….……………………….…...…………………….….....
92
Figure 3.8 A bell-shaped curve obtain from Biotin AGP titration
experiment …………………………………………………...
94
Figure 3.9 Competition assay using unlabeled AGP..…………………... 95

xiv
Page
Figure 3.10 Optimization with three kinds of buffer: (1) PBS (2) MES (3)
HEPES …………………………………………………...…...
96
Figure 3.11 Buffer optimization: Addition of detergent Tween-20 and BSA
…………………………………………………...………...….
97
Figure 3.12 Effect of NA to the binding of Biotin AGP- Lectin WGA.
Increasing concentration of NA resulted in signal decrease …..
98
Figure 3.13 Typical bell-shaped curve obtained from Biotin AGP and
Lectin WGA cross titration experiments ……………………..
100
Figure 3.14 Biotin AGP- Lectin WGA binding partner in the development
of NA inhibition assay using AlphaScreen technology. The
presence of NA interrupted the binding and generate signal
loss. ……………...……….……………...……….…...………
101
Figure 3.15 Validation of AlphaSceen assay using oseltamivir (1) with
100nM NA; (2) with 10nM NA; (2) various incubation time …
102
Figure 3.16 Schematic representation of the hydrolysis of 4-MUNANA
catalysed by neuraminidase. The reaction product: 4-
methylumbelliferone (4-MU) is quantified fluorimetrically by
using an excitation wavelength of 355 nm and the emission at
460 nm………………………………………………………..
105
Figure 3.17 H1N1 NA optimum activity (at concentration 0.039 U/ml).
Experiment was done in triplicate …………………………….
106
Figure 3.18 Inhibition activity of oseltamivir carboxylate against H1N1
NA (3 replicates) ………………………………...……………
107
Figure 3.19 Inhibition activity of DANA against H1N1 NA (3 replicates) ... 108
Figure 3.20 Percentage of enzyme activity of NSC 5069 against H1N1 NA
(3 replicates) ………………………………...………………..
110
Figure 3.21 Percentage of enzyme activity of NSC 83318 against H1N1
NA (3 replicates) ………………………………...……………
111
Figure 3.22 Percentage of enzyme activity of NSC 156563 against H1N1
NA (3 replicates) ………………………………...……………
111
Figure 3.23 Percentage of enzyme activity of NSC 134137 against H1N1
NA (3 replicates) ………………………………...……………
112
Figure 3.24 24 Percentage of enzyme activity of NSC 148304 against NA.
(3 replicates) ………………………………...………………..
112

xv
Page
Figure 3.25 2D diagram (a) and 3D docking pose (b) of NSC 5069. In the
2D diagram hydrogen bonds are presented in dashed lines and
Pi interactions are presented in orange lines, meanwhile blue
dotes and blue circles are the part of compounds or amino acid
residues which are exposed to solvent. Functional groups of
these compounds interact via hydrogen bond with important
residues of NA, namely Arg118, Arg292, Arg371, Tyr406, and
Asp151 ………………………………...………………..….....
113
Figure 3.26 2D diagram (a) and 3D docking pose (b) of NSC 83318. In the
2D diagram hydrogen bonds are presented in dashed lines and
Pi interactions are presented in orange lines, meanwhile blue
dotes and blue circles are the part of compounds or amino acid
residues which are exposed to solvent. Functional groups of
these compounds interact via hydrogen bond with important
residues of NA, namely Arg118, Arg292, Arg371 and Tyr406..
114
Figure 3.27 2D diagram (a) and 3D docking pose (a) of NSC 156563. In
the 2D diagram hydrogen bonds are presented in dashed lines
and Pi interactions are presented in orange lines, meanwhile
blue dotes and blue circles are the part of compounds or amino
acid residues which are exposed to solvent.Functional groups
of these compounds interact via hydrogen bond with important
residues of NA, namely Arg118, Arg292, Arg371 and Tyr406..
116
Figure 3.28 2D diagram (a) and 3D docking pose (b) of NSC 134137. In
the 2D diagram hydrogen bonds are presented in dashed lines
and Pi interactions are presented in orange lines, meanwhile
blue dotes and blue circles are the part of compounds or amino
acid residues which are exposed to solvent. Functional groups
of these compounds interact via hydrogen bond with important
residues of NA, namely Arg118, Arg292, Arg371 and Tyr406..
117
Figure 3.29 2D diagram (a) and 3D docking pose (b) of NSC 148304
showing few hydrogen bonds between compound and Arg224,
Arg276, and Glu227. In the 2D diagram hydrogen bonds are
presented in dashed lines and Pi interactions are presented in
orange lines, meanwhile blue dotes and blue circles are the part
of compounds or amino acid residues which are exposed to
solvent .. ……………………...……………………………….
118
Figure 3.30 Michaelis-Menten plot from determination of Michaelis-
Menten constant (Km) for MUNANA and maximum reaction
velocity (Vmax) ……………...………………………………...
120

xvi
Page
Figure 3.31 Lineweaver-Burk Plot for determining Km and Vmax …………. 121
Figure 3.32 Dixon plot for Oseltamivir Carboxylate as NA inhibitor. [I] is
the concentration of inhibitor. Ki value: 1.70 nM. Type of
inhibition: competitive inhibition (see Figure 1.14 page 29) ….
122
Figure 3.33 Lineweaver-Burk plot for DANA as NA inhibitor. [I] is the
concentration of inhibitor. Ki value: 9.93 µM. Type of
inhibition: competitive inhibition (see Figure 1.14 page 29) ….
122
Figure 3.34 Dixon plot for NSC 5069. [I] is the concentration of inhibitor.
Type of inhibition: competitive inhibition. Ki value: 100.26
µM ………………………………...……………….................
123
Figure 3.35 Dixon plot for NSC 83318. [I] is the concentration of inhibitor.
Type of inhibition: competitive inhibition. Ki value: 204.13
µM ………………………………...……………….................
124
Figure 3.36 Dixon plot for NSC 156563. [I] is the concentration of
inhibitor. Type of inhibition: competitive inhibition. Ki value:
202.9 µM ………………………………...……………………
124
Figure 3.37 Dixon plot for NSC 134137. [I] is the concentration of
inhibitor. Type of inhibition: competitive inhibition. Ki value:
197.75 µM ………………………………...………………......
125

xvii
LIST OF SCHEMES
Page
Scheme 1.1 Reaction steps and corresponding intermediates of catalytic
pathway of neuraminidase
Scheme 1.2 A typical docking workflow. This flowchart shows the key
steps common to all docking protocols. The 3D structures
for the target macromolecule and the small molecule must
first be chosen, and then each structure must be prepared in
accordance with the requirements of the docking method
being used. Following the docking, the results must be
analyzed, selecting the binding modes with the best scores.
Scheme 1.3 Drug disposition process which is divided into four parts:
Absorption, distribution, metabolism, and excretion
15
21
30

xviii
LIST OF SYMBOLS AND ABBREVIATIONS
% F % Fraction absorbed
3D Three-dimensional
Å Angstrom
ACD Advance Chemistry Development
ADME Absorption, Distribution, Metabolism, and Excretion
ADT AutoDock Tools
AGP alpha 1-acid glycoprotein
Arg Arginine
Asn Asparagine
Asp Aspartic acid
BBB Blood Brain Barrier
BCA Bicinchoninic acid
BSA bovine serum albumin
Camp cyclic-adenosine monophosphate
CDC Centre of Disease Control and Prevention
Clint Intrinsic clearance
CNS Central Nervous System
CYP Cytochrome P450
DANA 2,3-didehydro-2-deoxy-N-acetylneuraminic acid
DMSO Dimethyl sulfoxide
DNA Deoxyribonucleic acid
E Enzyme
EC Enzyme commission
FDA Food and Drug Administration
FEB Free Energy of Binding
GA Genetic Algorithm
Glu Glutamic acid
GPCR G protein-coupled receptor
GSH Glutathione
GUI Graphic User Interface
HA Hemagglutinin
HBA hydrogen bond acceptor
HBD hydrogen bond donor
HEPES (4-(2-hydroxyethyl)-1-piperazineethanesulfonic acid)
HTS High-throughput screening
Ile Isoleucine
IP3 Inositol trisphosphate
Ki Inhibition constant
Km Michaelis constant
LGA Lamarckian Genetic Algorithm
Log P Partition coefficient
M1 Matrix protein 1
M2 Matrix protein 2
MC Monte Carlo
MES 2-(N-morpholino)ethanesulfonic acid
MGL Molecular Graphic Laboratory
xix
MRP2 Multidrug Resistance-associate Protein 2
MUNANA 2'-(4-Methylumbelliferyl)-α-D-N-acetylneuraminic acid
MW molecular weight
NA Neuraminidase
NANA N-Acetylneuraminic acid
NCI National Cancer Institute
Neu5Ac N-Acetylneuraminic acid
Neu5Ac N-acetylneuraminic acids
Neu5Gc N-Glycolylneuraminic acid
Neu5Gc N-glycolylneuraminic acids
NH2 Amino
NP Nucleoprotein
NS Non-structural
-OH Hydroxyl group
P Product
PA Polymerase acidic protein
PB Polymerase basic protein
PBS Phosphate buffered saline
PDB Protein data bank
P-gp P-glycoprotein
pKa Acid dissociation constant
PMV Phyton Molecular Viewer
QSAR Quantitative Structure Activity Relationship
RdRp RNA-dependent RNA polymerase
RNA Ribonucleic acid
S Substrate
SA Sialic acid
Ser Serine
-SH sulfohydryl group
Trp Triptophan
Tyr Tyrosine
UDP Uridine5'-diphospho-glucuronosyltransferase (UDP-
glucuronosyltransferase
UGT Uridine 5'-diphospho-glucuronosyltransferase
Vmax Maximum velocity
Vo Initial velocity
vRNP Viral ribonucleoprotein
WHO World Health Organization
α alpha
β beta

xx
LIST OF PUBLICATIONS AND CONFERENCES
Conference Proceeding / Book of Abstract / Oral Presentation / Poster
Presentation
NUWARDA, R. F., WAHAB, H. A., TAN, M. L. 2011. Development of a High-
Throughput Screening (HTS) Assay for Influenza Neuraminidase H1N1 Using
AlphaScreenTM Technology. The 2nd International Seminar on Chemistry, Bandung –
Indonesia, 24-25 November 2011

xxi
PERENCAT NEURAMINIDASE BERPOTENSI MELALUI SARINGAN
MAYA, KAJIAN KINETIK, DAN JANGKAAN ADME
ABSTRAK
Aktiviti neuraminidase (NA) memainkan peranan yang penting dalam
jangkitan oleh virus influenza dengan memudahkan pelepasan virion yang baru
ditubuhkan daripada reseptor sel tuan rumah dan menggalakkan jangkitan kepada sel-
sel atau organ-organ lain. Disebabkan kemunculan rintangan virus terhadap perencat
NA sedia ada, penemuan perencat NA baru amat diperlukan. Dalam kajian ini,
pemeriksaan maya berdasarkan pendokan sebatian-sebatian daripada pangkalan data
NCI untuk memilih dengan pantas hit in silico bagi menjadi potensi perencat NA telah
dijalankan. Satu kaedah in vitro baru telah dicuba untuk membangunkan perencatan
asai NA dengan menggunakan teknologi AlphaScreenTM dengan Alpha-1-Asid
Glikoprotein sebagai substrat. Malangnya, usaha ini tidak berjaya mungkin disebabkan
pemisahan tidak spesifik asid sialik oleh NA. Selepas itu, asai MUNANA tradisional
telah dijalankan untuk menyiasat aktiviti perencatan dan parameter kinetik sebatian
perencat. Akhir sekali, sebatian-sebatian terpilih dikaji untuk ciri farmakokinetik in
silico mereka. Dari pangkalan data NCI, 1541 sebatian telah berjaya disaring untuk
mendapatkan 40 kompaun hit in silico diikuti oleh asai MUNANA untuk menentukan
IC50 mereka. Sepuluh daripada mereka menunjukkan lebih daripada 50% perencatan
terhadap NA dan empat sebatian iaitu NSC 5069, NSC 83318, NSC 156563, dan NSC
134137 didapati mempunyai nilai IC50 sebanyak masing-masing 216 μM, 320 μM,
571 μM dan 673 μM. Kajian kinetik menunjukkan nilai Km untuk MUNANA ialah
36.44 μM dan Vmax bagi tindak balas enzim ialah 551.25 RFU / min. Daripada plot
Dixon, semua sebatian mempunyai daya saing dengan nilai Ki untuk NSC 5069, NSC

xxii
83318, NSC 156563 dan NSC 134137 masing-masing ialah 100.26 μM, 204.13 μM,
202.9 μM, 197.75 μM. Penilaian ciri-ciri kesamaan-dadah meramalkan sifat-sifat
fizikokimia seperti berat molekul, Log P, bilangan ikatan hidrogen penderma dan
penerima memenuhi Peraturan Lima Lipinski. Hasil nilai pKa menunjukkan bahawa
sebatian berasid lemah dan cenderung untuk diserap dalam usus (NSC 5069 dengan
nilai pKa 4.1, dan NSC 83318 dengan nilai pKa 6.3), dan kompaun berasid lebih kuat
untuk diserap dalam perut (NSC 156563 dan NSC 134137 dengan nilai pKa 2.7).
Pengiraan in silico TPSA menunjukkan bahawa NSC 83318 dan NSC 156563
memenuhi kriteria Lipinski dengan mempunyai nilai TPSA kurang daripada 140 A2,
manakala NSC 5069 dan NSC 134137 telah diramalkan untuk mempunyai penyerapan
lemah kerana nilai TPSA mereka adalah lebih daripada had yang boleh diterima 140
A2. Berdasarkan peratusan fraksi diserap, NSC 5069 dan NSC 83318 telah dianggap
mempunyai fraksi tinggi untuk penyerapan. Manakala dua sebatian, NSC 156563 dan
NSC 134137 telah mempunyai fraksi rendah untuk penyerapan. Dalam meramalkan
isipadu pengedaran, hasil menunjukkan bahawa isipadu pengedaran NSC 5069, NSC
83318, NSC 156563, NSC 134137 masing-masing adalah 0.86 L/kg, 0.7 L/kg, 0.13
L/kg dan 0.12 L/kg. NSC 83318, NSC 156563, dan NSC 134137 mempunyai %PPB
lebih daripada 90% yang bermakna bahawa hampir semua sebatian ditadbir boleh
terikat kepada protein plasma dalam badan, manakala NSC 5069 mempunyai %PPB
57%, menunjukkan bahawa 57% daripada kompaun adalah terikat kepada protein
plasma. Akhir sekali, empat sebatian utama tidak menunjukkan kebarangkalian
sebagai substrat atau perencat bagi kebanyakan isoform CYP, kecuali NSC 83318
yang menunjukkan kebarangkalian yang tinggi untuk bertindak sebagai CYP 1A2
dengan nilai 0.84.

xxiii
POTENTIAL NEURAMINIDASE INHIBITORS VIA VIRTUAL
SCREENING, KINETIC STUDIES, AND ADME PREDICTIONS
ABSTRACT
Neuraminidase (NA) activity plays an important role in the infection by
influenza viruses by facilitating the release of the newly formed virions from the host
cell receptor and promotes its infection to other cells or organs. With the emergence
of viral resistance towards the existing NA inhibitors, the discovery of new NA
inhibitors is urgently needed. In this work, docking-based virtual screening of large
compounds from NCI database to rapidly select in silico hits to be potential NA
inhibitors was carried out. A new in vitro method has been attempted to be developed
for NA inhibition assay by utilizing AlphaScreenTM technology with Alpha-1-Acid
glycoprotein as a substrate. Unfortunately, this effort was unsuccessful probably due
to the non-specific cleavage of sialic acid by NA. Subsequently, a traditional
MUNANA assay was performed to investigate the inhibitory activities and kinetic
parameters of the inhibitor compounds. Finally, the selected compounds were studied
for their pharmacokinetic properties in silico. From the NCI database, 1541
compounds have been successfully screened and 40 in silico hits compounds were
obtained, and assayed to determine their IC50s. Ten of them demonstrated over 50%
inhibition against NA and four compounds namely NSC 5069, NSC 83318, NSC
156563, and NSC 134137 were found having IC50 values of 216 µM, 320 µM, 571 µM
and 673 µM, respectively. The kinetic studies showed Km value for MUNANA was
36.44 µM and Vmax for the enzymatic reaction was 551.25 RFU/min. From the Dixon
plot, these four compounds appeared to competitively inhibit the neuraminidase with
Ki values for NSC 5069, NSC 83318, NSC 156563, and NSC 134137 were 100.26,

xxiv
204.13, 202.90, and 197.75 µM, respectively. Drug-likeness properties assessment
predicting the physicochemical properties such as molecular weight, Log P, number
of hydrogen bond donor and acceptor fulfilled Lipinski's Rule of Five. The results of
pKa value showed that the compounds are weakly acidic and tend to be absorbed in
the intestine (NSC 5069 with pKa value 4.1, NSC 83318 with pKa value 6.3 and), and
stonger acidic compound to be absorbed in the gastrik (NSC 156563 and NSC 134137
with pKa value 2.7). In silico calculations of TPSA showed that NSC 83318 and NSC
156563 fulfill Lipinski's criteria of having TPSA value less than 140 Å2, while NSC
5069 and NSC 134137 were predicted to have poor permeation since their TPSA
values are more than the acceptable upper limit of 140 Å2. Based on the fraction’s
absorbed percentage, NSC 5069 and NSC 83318 were considered to have high fraction
for the absorption. While the other two compounds, NSC 156563 and NSC 134137
had low fraction for the absorption. In predicting volume distribution, the results
showed that the volume distribution of NSC 5069, NSC 83318, NSC 156563, NSC
134137 were 0.86 L/kg, 0.7 L/kg, 0.13 L/kg and 0.12 L/kg, respectively. NSC 83318,
NSC 156563, and NSC 134137 have %PPB more than 90% which means that almost
all the compounds administered may be bound to the plasma protein in the body,
whereas NSC 5069 has %PPB 57%, indicating that 57% of the compound is bound to
the plasma proteins. Lastly, the four top compounds showed no probability as
substrates or inhibitors for almost all CYP isoforms, except for NSC 83318 which
showed relatively high probability to act on CYP 1A2 with value 0.84.

1
CHAPTER ONE
INTRODUCTION
1.1 Statement of the Problem
Influenza, according to WHO (World Health Organization), spreads around the
world in seasonal epidemics, resulting the death between 250,000 and 500,000 people
every year (Knobler et al., 2005). The three influenza pandemics that occurred in the
20th century and killed tens of millions people were Spanish flu in 1918, Asian flu in
1957, and then followed by Hong Kong flu in 1968-69. In the 21st century, the
emergence of a highly pathogenic avian influenza virus of type A (H5N1) or bird flu,
the pandemic of 2009 H1N1 (Swine flu), and also a recent case of a new avian
influenza A (H7N9), which was firstly reported in China in March 2013, have led this
disease becoming a threatening health issue in human (Hu et al., 2014).
Centers for Disease Control and Prevention (CDC) study of the disease burden
of 2009 H1N1 pandemic, showed that the largest death burden took place in the
African and Southeast Asian regions, with more than half of 2009 H1N1-related deaths
occurred (Dawood et al., 2012). Since the first reported case in May 2009, Malaysia
has witnessed 2,253 cases of H1N1 infection as of August 2009. The number of cases
had been increasing and as of September 2009, there have been 73 death reported
(Kementerian Kesihatan Malaysia, 2011).
Vaccination has become a primary strategy for the prevention of influenza.
However in 2005, in some cases vaccination were inadequate, especially during the
2
course of pandemic. Current vaccine production methods cannot be carried out with
the speed required to halt the development of new strains of influenza virus; therefore,
it is possible that vaccine may not be available for the first wave of the virus outbreak.
The limitations of vaccine efficacy, design and delay in strain specific vaccine
production have stimulated the search for antivirals. Thus, antiviral agents form an
important part of a rational approach to overcome epidemic influenza (Moscona, 2005,
Boltz et al., 2010). Two classes of antivirals are currently approved for both
prophylaxis and therapeutic treatment of influenza virus infection: M2-ion channel
inhibitors (the adamantanes, amantadine and its derivative, rimantadine) and
neuraminidase inhibitors (zanamivir and oseltamivir). Neuraminidase inhibitors have
better tolerance, broader antiviral spectrum, and less potential for the emergence of
resistance compared to the M2 inhibitor (Gubareva et al., 2000). Neuraminidase
inhibitors are also currently the preferred treatment option for flu virus infection since
they are less toxic and more effective (Beigel and Bray, 2008). Zanamivir and
oseltamivir are examples of neuraminidase inhibitors, which are already licensed and
commercially available for the treatment and prophylaxis of influenza. However, the
poor oral bioavailability of zanamivir requires this drug to be administered by
inhalation, while oseltamivir-resistant H1N1 viruses have emerged due to the latter
broad use as oral medication. Recently, laninamivir, a potent neuraminidase inhibitor
has been approved for use in Japan. Unfortunately, its effectiveness against
oseltamivir-resistant neuraminidase in adults has not been proven, thus more study is
needed to find new and more effective anti-influenza agents (Ives et al., 2002,
Vavricka et al., 2011).
Currently, the activity of neuraminidase inhibitor is determined using a
fluorogenic assay utilizing 2'-(4-Methylumbelliferyl)-α-D-N-acetylneuraminic acid

3
(MUNANA) as substrate. This method is quite sensitive and has been the most widely
used and accepted method for detecting neuraminidase inhibition activity. However,
typically in screening large libraries of chemicals, this assay is not very economical.
A lot of enzymes are needed to conduct the experiments. Thus, fast, robust, sensitive,
and reliable assays are needed. Therefore, the ultimate aim of this research is to
develop an alternative neuraminidase inhibition assay, as well as to test this assay, to
validate the inhibition of potential neuraminidase inhibitor from NCI database.
The present study focused on the development of neuraminidase inhibition
assay using AlphaScreenTM technology to screen potential neuraminidase inhibitors.
Following the optimization of the assay, it was intended that the assay was to be
validated by testing known inhibitors for their inhibition. Since the assay is high
throughput, molecular docking and virtual screening of compounds from National
Cancer Institute (NCI) Diversity Set II database were also employed to obtain top in
silico hits compounds for subsequent alpha screen inhibition assay. However, due to
the failure of establishment of the assay, a traditional MUNANA in vitro assay was
performed to investigate these compounds’ inhibitory activities and their kinetic
parameters. Finally the selected active compounds were studied for their
pharmacokinetic properties in silico in an attempt to rationale their selection for further
lead optimization, and possible drug development.

4
Specifically, the objectives of the study are to:
1. Virtually screen National Cancer Institute Diversity Set II compounds for
potential neuraminidase inhibitors using molecular docking methods;
2. Screen these in silico hits compounds with in vitro fluorescence based assay
with 2'-(4-Methylumbelliferyl)-α-D-N-acetylneuraminic acid (MUNANA) as
substrate;
3. Determine Vmax, Km for MUNANA substrate and Ki for the top compounds;
4. Predict the ADME properties of the top compounds screened with
ACD/ADME Suite software.
1.2 The Influenza
1.2.1 Epidemics and Pandemics
Influenza is a serious infectious disease that affects respiratory tract and can
lead to hospitalization and even death. Annual epidemic of influenza is estimated to
be 3 to 5 million cases of severe illnesses and ~500,000 deaths globally. The high-risk
groups of severe consequences and death include persons aged 65 years and above,
children under 2 years, and persons with chronic medical conditions that put them at
increased risk of developing influenza or its complications (Fauci, 2006, WHO, 2014).
Novel strains of Influenza A virus emerge sporadically every 1 to 2 years as
influenza epidemics. The introduction of selected point mutations within
hemagglutinin (HA) and neuraminidase (NA), the two surface glycoproteins of
influenza virus, evade the human host defenses and therefore resulting in no lasting
immunity against the virus, neither after natural infection nor vaccination. The small
5
changes of antigenicity of influenza virus are termed antigenic drift and become the
basis for regular occurrence of the epidemic of influenza (Holmes et al., 2005).
On the other hand, influenza pandemics which involve a major change in the
antigenicity of influenza A virus occur once every 10 to 50 years. At least three
influenza pandemics have been recorded during the twentieth century: the Spanish flu
in 1918-19, Asian Flu in 1957 and Hong Kong Flu in 1968 with mortality impact
ranged from devastating to mild (Holmes et al., 2005, Lazzari and Stöhr, 2004, Oxford,
2000, Simonson, 2004). These viruses acquire a new subtype by re-assortment of RNA
segments from different influenza viral strains. This genetic change, called antigenic
shift, allows a viral strain to jump from one species of animal to another, including
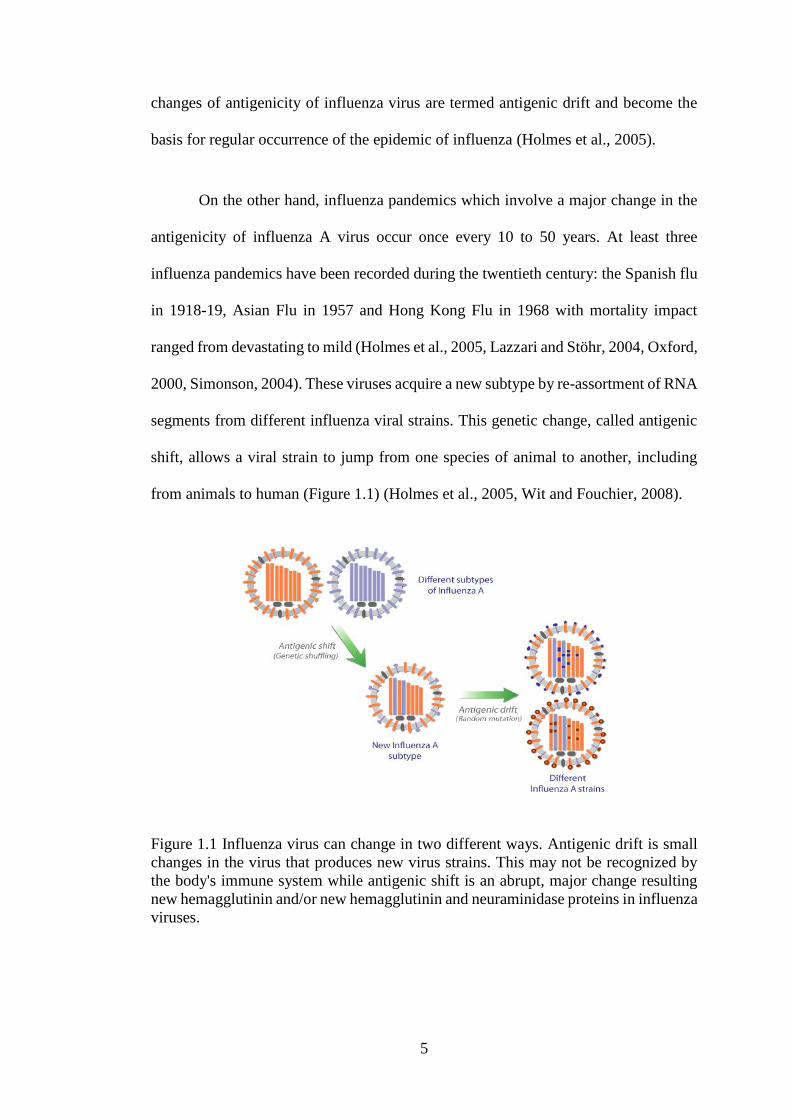
from animals to human (Figure 1.1) (Holmes et al., 2005, Wit and Fouchier, 2008).
Figure 1.1 Influenza virus can change in two different ways. Antigenic drift is small
changes in the virus that produces new virus strains. This may not be recognized by
the body's immune system while antigenic shift is an abrupt, major change resulting
new hemagglutinin and/or new hemagglutinin and neuraminidase proteins in influenza
viruses.

6
The 1918 influenza pandemic, also referred to as Spanish Flu, was the first and
the most devastating influenza pandemic in the 20th century. The pandemic spread
globally by infecting 25-30% of the world's population and killing more than 50
million people (Taubenberger and Morens, 2006). Analysis of 1918 flu survivors
suggested that 1918 pandemic was caused by H1N1-subtype influenza virus that
contained genes derived from avian-like virus, which was also believed as the common
ancestor of almost all influenza A cases, including re-assorted H3N2 and H2N2 viruses
and drifted H1N1 viruses (Taubenberger et al., 2000, Taubenberger and Morens, 2006).
These virus strains continued to circulate until they were replaced by H2N2 in 1957
influenza pandemic (Basler and Aguilar, 2008, Taubenberger and Morens, 2006). The
influenza A virus with H2 subtype emerged in February 1957 in Hunan Province of
China, considered clinically milder than 1918 pandemic virus with global mortality
rate at 1-2 million deaths. The H2N2 virus circulated worldwide until H3N2 virus
appeared in 1968 and replaced it. The 1968 influenza pandemic, also known as Hong
Kong flu, was comparatively a milder pandemic with the death toll associated with it
has been estimated around 1 million deaths (Oxford, 2000, Subbarao and Katz, 2000).
The first influenza pandemic in 21st century began in 2009 when a new swine-origin
influenza virus emerged and replaced the previous seasonal influenza H1N1. First
identified in Mexico, the virus had spread to over 43 countries (Guarnaccia et al., 2013).
The virus, often called "2009 H1N1", has been circulating in human and caused the
first influenza pandemic in more than 40 years (CDC, 2014). Influenza A virus subtype
H5N1, also called avian influenza or bird flu, is known to be highly pathogenic avian
influenza A virus which caused devastating outbreaks in domestic poultry and give
rise to the threat of human influenza pandemics. In July 2013 the WHO announced
7
630 confirmed human cases for avian influenza A (H5N1) in total which resulted in
the deaths of 375 people since 2003 (WHO, 2013).
1.2.2 The Influenza Virus
Influenza virus is an enveloped virus which belongs to the family of
Orthomyxoviridae with negative-sense, single stranded, and segmented RNA genome.
The virus is classified into three serologically different types, influenza virus A, B, and
C, with type A is the most virulence which cause severe and even fatal respiratory
disease, influenza epidemic and also worldwide pandemic (Itzstein and Thomson,
2009, Gong et al., 2007, Nicholls et al., 2007, Samji, 2009). The influenza A viruses
have eight segments which encode 11 viral genes: hemagglutinin (HA), neuraminidase
(NA), matrix proteins M1 and M2, nucleoprotein (NP), non-structural (NS) proteins
NS1 and NS2, polymerase acidic protein (PA), polymerase basic (PB) proteins PB1,
PB2, and PB1-F2 (Samji, 2009). Influenza A viruses are further sub-divided based on
the antigenic properties of their surface glycoproteins, HA and NA (Itzstein and
Thomson, 2009, Gong et al., 2007). There are 18 known hemagglutinin subtypes and
11 known neuraminidase subtypes (CDC, 2014, Tong et al., 2013). A simple diagram
of influenza A virus is shown on Figure 1.2. Hemagglutinin is the major surface protein
of influenza A virus which consists of three identical subunits (homotrimeric)
anchored to the lipid membrane of the virus. It is responsible for the initial contact
between the virus and the target cell which contains terminal N-acetylneuraminic acid
(sialic acid) residues. Moreover, hemagglutinin also contributes to the internalisation
of the virus through fusion of the viral envelope with the target cell (Itzstein and
Thomson, 2009). Influenza virus neuraminidase is a tetrametric protein and acts as
glycohydrolase which removes N-acetylneuraminic acid (sialic acid) residues from

8
glycoconjugates in the surface of target cells, a crucial role in facilitating the release
of newly synthesized virus from the host cells (Itzstein and Thomson, 2009, Xu et al.,
2008).
Figure 1.2 Diagram of influenza A virus. On the outside virus particles, 3 viral proteins:
haemagglutinin (HA, trimers), neuraminidase (NA) (tetramers) and M2 (tetramers that
make up ion-channels) are exposed (Hedestam et al., 2008).
1.2.3 Influenza Virus Life Cycle
The life cycle of influenza virus can be divided into several stages: virus entry
to the host cell; entry of vRNPs into the nucleus; transcription and replication of the
viral genome; export of vRNPs from the nucleus; then assembly and budding at the
host cell plasma membrane. The first stage of virus infection is the binding of HA to
sialic acid found in the surface of host cell's membrane. Sialic acids are bound to

9
carbohydrates of the membrane's glycoprotein with glycosidic linkage. There are two
major linkages that are important for the specificity of HA, α (2, 3) linkage which is
recognized by viral HA from avians and equines, whereas those from human recognize
α (2, 6) linkage and those from swine recognize both. Upon binding with sialic acids,
receptor-mediated endocytosis occurs and the virus enters the host cell in an endosome.
The low pH of endosome (around 5 to 6) triggers the fusion of the viral and endosomal
membrane. The acidic endosomes also open up the M2 ion channel and acidifies the
viral core. This acidic environment in the virion allows vRNP to be released from M1
so that it is free to enter the host cell's cytoplasm as well as the nucleus. The viral
proteins that make up the vRNP (NP, PA, PB1 and PB2) have recognized the nuclear
localization signals (NLSs) which can bind to the cellular nuclear import machinery
and thus, enter the nucleus to undergo transcription and replication. In order to be
transcribed, the negative-sense RNA genome is first converted into a positive sense
RNA as a template for the production of viral RNAs. The viral RHA dependent RNA
polymerase (RdRp) initiates the synthesis of RNA internally in viral RNA, continued
by cellular RNA Polymerase II (Pol II) that binds to DNA and starts transcription.
vRNPs is then exported out from the nucleus through the nuclear pores. Before leaving
the cell, virus needs to form viral particles. Therefore, the viral proteins that normally
found within the viral lipid bilayer, i.e HA, NA, and M2, must be present and
transported to the apical plasma membrane, since the virus particles bud from the
apical side of polarized cells. After viral particles are formed, the sialic acid residues
from glycoproteins and glycolipids are cleaved by neuraminidase, thus enable the viral
particles to be released from the plasma membrane and goes on to infect neighboring
cells (Samji, 2009). The virus life cycle is presented in Figure 1.3.

10
Figure 1.3 Influenza virus replication cycle (Gubareva et al., 2000).
1.2.4 Influenza Virus Neuraminidase
1.2.4.1 Structure of Neuraminidase
Influenza virus neuraminidase (EC 3.2.1.18) is a tetramer with four identical
polypeptides composed of a cytoplasmic tail, a transmembrane domain, a globular
head, and a stalk region (Gubareva et al., 2000, Gong et al., 2007). It destroys the
receptors recognized by hemagglutinin by catalyzing the cleavage of terminal α-(2,3
or 2,6)-ketosidically linked sialic acid (N-acetylneuraminic acid) from a wide range of
glycoconjugates, including glycoproteins and glycolipids, thus playing an important
role in the life cycle of the virus (Gubareva et al., 2000, Itzstein and Thomson, 2009).
Neuraminidase acts as a biological scissor that cut sialic acids residues both from upper
respiratory tract mucins facilitating the movement of the virus, and also from the
surface of glycoprotein of the newly synthesized virions, thus enabling the virus to be
released from the host cell and continue to infect other cells (Itzstein and Thomson,

11
2009). The first X-ray crystal structure of neuraminidase was published in 1983. In
1992, Varghese and colleagues elucidated the structure of N2 subtype of
neuraminidase at 2.9° Å resolutions as shown in Figure 1.4. The structure showed a
tetrameric association of identical monomers with β-sheet propeller (Gong et al., 2007,
Varghese et al., 1992).
Figure 1.4 Three dimensional structure of an N2 neuraminidase tetramer in complex
with sialic acids (PDB entry 2BAT) (Varghese et al., 1992).
The structural studies on NA enzymes from four influenza A viruses and two
influenza B virus subtypes have discovered that NA structure is well conserved.
Investigation conducted by Gong and colleagues on several NA structures showed that
they have a generally similar topology to N2 NA (Gong et al., 2007).

12
1.2.4.2 The Substrate and the Active Site of Neuraminidase
Sialic acid (SA) is a generic term for nine-carbon sugar acids that are widely
expressed on the surface of all cells in all animals of the deuterostome lineage
(vertebrates and so-called "higher" invertebrates) and also in certain pathogenic or
symbiotic bacteria that associate with them. It features conspicuously at terminal
positions of the surface-exposed glycoconjugates (Severi et al., 2007, Suzuki et al.,
2000, Varki and Gagneux, 2012).
Sialic acid was first discovered about 70 years ago as a major product released
by mild acid hydrolysis of brain glycolipids or salivary mucins by Gunnar Blix, Ernst
Klenk, and other scientists (Du et al., 2009). Erwin Chargaff's group then found out
that "receptor-destroying enzyme" of influenza viruses was able to release sialic acid
from macromolecules and thus, acts as sialidase (Varki and Schauer, 2009). Karl
Meyer's group observed a similar activity in bacteria, then the name "neuraminidase"
was suggested for this activity by Alfred Gottschalk in 1957. Partially because of its
discovery in salivary mucins (Greek: sialos), this family was named the "sialic acids"
(Varki and Schauer, 2009).
Sialic acids rarely occur freely in nature. They are more commonly found as
components of oligosaccharide chains of mucins, glycoproteins, and glycolipids. They
usually occupy terminal, non-reducing positions of oligosaccharide chains of complex
carbohydrates on outer and inner membrane surfaces in various linkages, mainly to
galactose, N-acetylgalactosamine, and other sialic acid moieties, where they are highly
exposed and functionally important. Sialic acids consist of a family of 43 naturally
occurring derivatives of the nine-carbon sugar neuraminic acid (5-amino-3, 5-dideoxy-

13
D-glycero-D-galactononulsonic acid). One branch of the sialic acid family is N-
acetylated to form N-acetylneuraminic acids (Neu5Ac, NANA, Sia), which are the
most widespread form of sialic acid and almost the only form found in human. The
other branch is based on N-glycolylneuraminic acids (Neu5Gc) where the amino group
is substituted with N-glycolyl group. These are found commonly in many animal
species (best investigated in porcine tissues), but not found in humans except in the
case of a particular cancer (Suzuki et al., 2000, Wang and Brand-Miller, 2003). Two
most common forms of sialic acid are N-acetyl neuraminic acid (Neu5Ac) and N-
glycolylneuraminic acid (Neu5Gc) as shown in Figure 1.5.
Figure 1.5 a. The two most common sialic acids are N-acetyl neuraminic acid (Neu5Ac)
and N-glycolylneuraminic acid (Neu5Gc). b. Sialic acids are attached to carbohydrate
chains on glycoproteins and glycolipids via different glycosidic linkages. The most
common linkage types are α2, 3-linkage to a galactose residue, α2,6-linkage to a
galactose moiety or to an N-acetylgalactosamine moiety, and α2,8-linkage to another
sialic acid moiety on a glycan (Stencel-Baerenwald et al., 2014).
Neuraminidase is an exo-glycoside hydrolase that hydrolyzes terminal sialic
acid residues from any glycoconjugate, including viral glycoprotein. In general,
glycoside hydrolases (GH) are a group of enzyme which catalyze the hydrolysis of the
glycosidic bond between two or more carbohydrates or between carbohydrates and

14
non-carbohydrates moiety. This group is classified in families based on amino acid
sequence similarities. As of July 2015, CAZy (Carbohydrates-Active Enzyme)
database describes the present knowledge of 133 glycoside hydrolase families.
Neuraminidase, either from bacteria or viruses, belong to glycoside hydrolase family
33, 34, 83 (Cantarel et al., 2009, Lombard et al., 2014). Hydrolysis of neuraminidase
substrate was solvent-mediated and involved a sialosyl cation transition state
intermediate. The pathway of neuraminidase consists of four major steps. The first step
is the binding stage where the carboxylate group transforms from the axial position
into a pseudo-equatorial position due to the charge-charge interactions to Arg 118,
Arg292, and Arg371 and steric constraints with residue at the base of the active site,
such as Tyr406. The following step involves proton donation from solvent and
formation of the endocyclic sialocyl cation transition-state intermediate. The hydrogen
bonding network of water molecules and protein residues leading from a charged
group on the protein surface to water molecules could facilitate proton donation. Asp
151 and Arg 152, and to a certain extent, for Glu 227, are believed to contribute to the
stability of the cationic intermediate. The active site of neuraminidase with its
important residues is presented in Figure 1.6. The final two steps are the formation and
release of Neu5Ac. The expulsion of the product from the active site is favored by the
mutarotation of the initial β-anomer to the more thermodynamically stable α-anomer
for Neu5Ac in solution as shown in Scheme 1.1 (Gong et al., 2007).

15
Figure 1.6 Neuraminidase active site consists of functional amino acid residues
Arg118, Asp151, Arg152, Arg224, Glu 276, Arg292, Arg371, and Tyr406, which are
in direct contact with sialic acid, and structural amino acids residue Glu119, Arg156,
Trp178, Ser179, Asp (or Asn in N7 and N9)198, Ile222, Glu227, Glu277, Asp293, and
Glu42 (Protein Data Bank ID: 2BAT www.rcsb.org) (Varghese et al., 1992) .
Scheme 1.1 Reaction steps and corresponding intermediates of catalytic pathway of
neuraminidase (Gong et al., 2007).
1
2
3
4

16
1.2.4.3 Neuraminidase Inhibitor
The importance role of neuraminidase in the life cycle of influenza virus as
well as the conversed nature of the neuraminidase active site among influenza viral
strains have resulted the enzyme to be considered as an excellent target for antiviral
drug design. Several approaches have led to the discovery of neuraminidase inhibitors
through random screening or development and modifications of the functional groups
of original substrate (Itzstein and Thomson, 2009).
Neuraminidase cleaves sialic acid residues on the host cell receptor to which
the newly formed virion attached, enabling the virus to be released and invade the new
host cells and continue the infections. Neuraminidase inhibitors mimic the natural
substrate of neuraminidase and bind to the active site. It works by blocking the activity
of viral neuraminidase preventing the enzyme from cleaving the cell receptors.
Without the activity of neuraminidase, virus infection would be limited to only one
round of replication, rarely enough to cause disease (Moscona, 2009).
Figure 1.7 Mechanism of Action of Neuraminidase Inhibitors. Panel A shows the
action of neuraminidase in the continued replication of virions in influenza infection.
The replication is blocked by neuraminidase inhibitors (Panel B), which prevent them
from being released from the surface of infected cells (Moscona, 2005).

17
The ability of transition-state analogues of sialic acids in inhibiting the activity
of influenza neuraminidase was first discovered in 1970s (Air, 2012), and the design
of highly effective inhibitors became feasible when analysis of three dimensional
structure of influenza neuraminidase disclosed the location and structure of catalytic
site (Moscona, 2009). Neuraminidase inhibitors, zanamivir (Relenza) and oseltamivir
(Tamiflu) have been approved by the US FDA in 1999 as antiviral drugs for influenza
treatment and prophylaxis (Boltz et al., 2010, Moscona, 2009). Zanamivir mimics the
natural substrate closely, fits into the active site’s pocket of neuraminidase and
interacts with the protein in the most favorable way. Zanamivir is administered by oral
inhalation which delivers the drug to the respiratory tract directly, while oseltamivir
was developed through modifications to the sialic acids analogue framework
(including the addition of lipophilic side chain) which allow the drug to be used orally
(Moscona, 2009). Neuraminidase crystal structure in complex with zanamivir reveals
the active site of neuraminidase with its important residues and their interaction with
zanamivir (Figure 1.8). Asp151 is hydrogen bonded via one of the carboxyl oxygens
to the secondary guanidinyl nitrogen of zanamivir, and the main-chain carbonyl
oxygen interacts with one of the guanidino NH2 groups of the inhibitor. Arg152 also
forms hydrogen bond with the carbonyl oxygen of the N-acetyl group of zanamivir.
Val149 undergoes a Ctranslation of about 7.0 Å, as observed in the recent H5N1 NA
structure. The side chain of Glu119 also adopts a different orientation, to point away
from Glu227, interacting with Arg156 instead to accommodate the 4-guanidino group
of zanamivir. Other conserved interactions among all other NAs include that of the
carboxyl group of zanamivir with three conserved arginine residues, Arg118, Arg292,
and Arg371, and that of the two terminal hydroxyl groups on the glycerol side chain
on the C-6 position with the carboxylate of Glu276 (Xu et al., 2008).

18
Figure 1.8 Neuraminidase crystal structure in complex with zanamivir (PDB ID: 3B7E)
(Xu et al., 2008).
1.3 Computational Methods for Drug Discovery
The advanced technologies in the field of molecular biology, such as high-
throughput protein purification, crystallography and nuclear magnetic resonance
spectroscopy techniques have contributed greatly to the increase of structural data of
proteins and protein-ligand complexes (Meng et al., 2011). These structural discovery
also allow the computational methodologies to become a crucial components for drug
discovery and development strategies, from hit identification to lead optimization, and
approaches such as ligand- or structure based virtual screening techniques (Kitchen et
al., 2004). Compared with traditional experimental high-throughput screening (HTS)
which has been applied to generate and screen large compound libraries, virtual
screening is a more direct and rational drug discovery approach and has the advantage

19
of faster, more economical and effective screening (Moitessier et al., 2008, Meng et
al., 2011).
Virtual screening can be classified into ligand-based and structure-based
method. Ligand-based methods, such as pharmacophore modelling and quantitative
structure activity relationship (QSAR) methods, can be employed when a set of active
ligand molecules is known and no or little structural information is available for targets.
As to structure-based drug design, molecular docking is the most common method
which has been widely used ever since the early 1980s (Meng et al., 2011). It remains
a field of vigorous research, having become a useful tool in drug discovery efforts, and
primary component in many drug discovery program (Sousa et al., 2006). Molecular
docking, which is usually performed between a small molecule and a target
macromolecule, is often referred to as ligand-protein docking. This method allows us
to characterize the behaviour of small molecules (ligands) in the binding site of a target
(protein, DNA, or RNA macromolecules) as well as to elucidate fundamental
biochemical processes, to predict molecular recognition, both structurally, finding
likely binding modes, and to predict binding affinity (Morris and Lim-Wilby, 2008,
Meng et al., 2011). Molecular docking has a wide variety of uses and applications in
drug discovery, including structure–activity studies, lead optimization, finding
potential leads by virtual screening, providing binding hypotheses to facilitate
predictions for mutagenesis studies, assisting x-ray crystallography in the fitting of
substrates and inhibitors to electron density, chemical mechanism studies, and
combinatorial library design. Virtual screening on the basis of molecular descriptors
and physicochemical properties of (in)active ligands has great usefulness in finding
hits and leads through library enrichment for screening (Morris and Lim-Wilby, 2008,
Pozzan, 2006).

20
The docking process involved two basic steps: prediction of the ligand
conformation as well as its position and orientation within the site and assessment of
binding affinity. Docking can be achieved through two interrelated steps; first by
sampling conformations of the ligand in the active site of the protein; then ranking
these conformations via a scoring function and thus give the prediction of the ligand-
receptor complex structure (Meng et al., 2011). There are various docking programs,
such as AutoDock, DOCK, GOLD, ZDOCK, M-ZDOCK, MS DOCK, FLEXX,
Surflex, MCDOCK, and others, based on specific search algorithm (Dias and de
Azevedo Jr, 2008).
AutoDock is one of the most popular docking programs developed to provide
an automated procedure for predicting the interaction of ligand with biomolecular
targets (Morris et al., 2002, Sousa et al., 2006). All docking methods require a scoring
function to rank the various candidate binding modes, and a search method to explore
the state variables. Scoring functions can be empirical, force field based, or knowledge
based, whereas search methods fall into two major categories: systematic and
stochastic. Systematic search methods sample the search space at predefined intervals,
and are deterministic. Stochastic search methods iteratively make random changes to
the state variables until a user-defined termination criterion is met, so the outcome of
the search varies. Search methods can also be classified by how broadly they explore
the search space, as either local or global. Local search methods tend to find the nearest
or local minimum energy to the current conformation, whereas global methods search
for the best or global minimum energy within the defined search space. Hybrid global–
local search methods have been shown to perform even better than global methods
alone, being more efficient and able to find lower energies. In AutoDock 4, for
example, there are choices of two local search methods (Solis and Wets and Pattern

21
Search); two global search methods: Monte Carlo (MC) simulated annealing (SA) and
the genetic algorithm (GA); and one hybrid global–local search method, the
Lamarckian GA (LGA) (Morris and Lim-Wilby, 2008, Sousa et al., 2006).
Scheme 1.2 Typical docking workflow. This flowchart shows the key steps common
to all docking protocols. The 3D structures for the target macromolecule and the small
molecule must first be chosen, and then each structure must be prepared in accordance
with the requirements of the docking method being used. Following the docking, the
results must be analyzed, selecting the binding modes with the best scores (Morris and
Lim-Wilby, 2008).
AutoDock 4.2 uses a semi empirical free energy force field to evaluate
conformation during docking simulations. The force field was parameterized using a
large number of protein-inhibitor complexes for which both structure and inhibition
constant, or Ki are known.

22
Figure 1.9 Mechanism of ligand interactions in the receptor binding site (Morris et al.,
2010)
The force field evaluates the binding in two steps. The ligand and protein start
in an unbound conformation. In the first step, the intramolecular energetics are
estimated for the transition from these unbound states to the conformation of the ligand
and protein in the bound state. The second step then evaluates the intermolecular
energetics of combining the ligand and protein in their bound conformation (Figure
1.9). The force field includes six pair-wise evaluation (V) and an estimate of the
conformational entropy lost upon binding (Sconf):
Equation 1
where L refers to the ‘ligand’ and P refers to the ‘protein’ in a ligand-protein docking
calculation. Each of the pair-wise energetic terms includes evaluations for
dispersion/repulsion, hydrogen bonding, electrostatics, and desolvation:
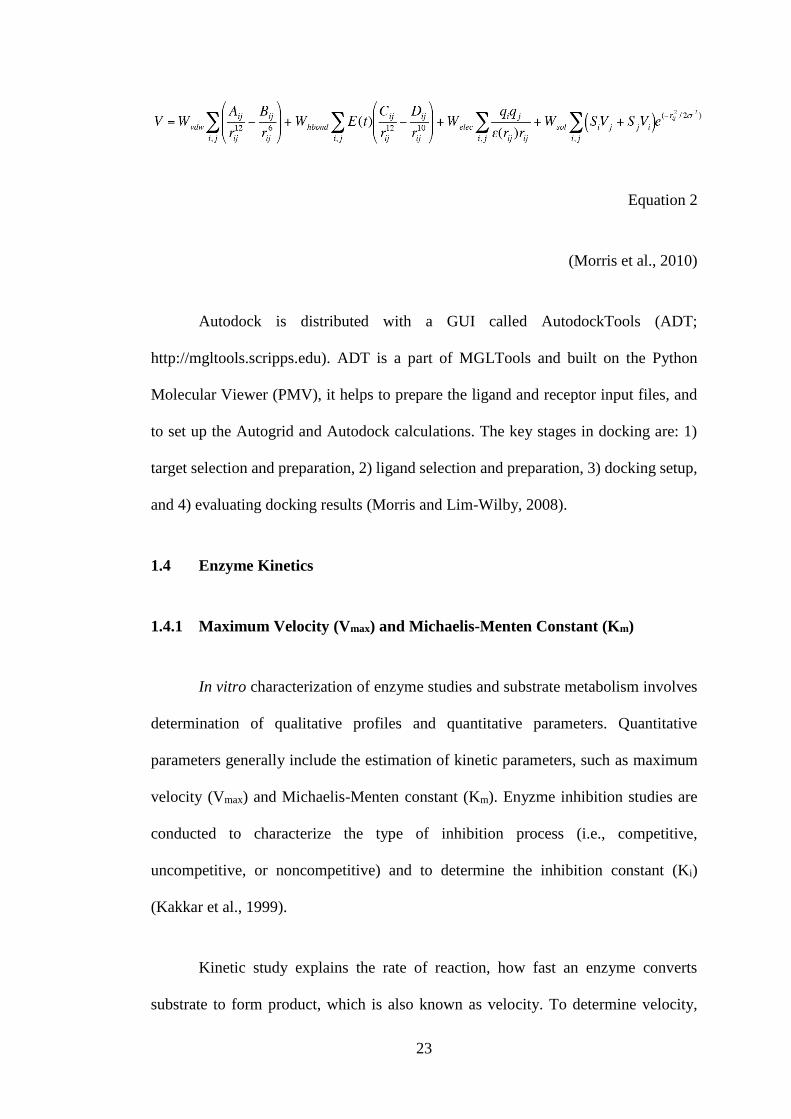
23
Equation 2
(Morris et al., 2010)
Autodock is distributed with a GUI called AutodockTools (ADT;
http://mgltools.scripps.edu). ADT is a part of MGLTools and built on the Python
Molecular Viewer (PMV), it helps to prepare the ligand and receptor input files, and
to set up the Autogrid and Autodock calculations. The key stages in docking are: 1)
target selection and preparation, 2) ligand selection and preparation, 3) docking setup,
and 4) evaluating docking results (Morris and Lim-Wilby, 2008).
1.4 Enzyme Kinetics
1.4.1 Maximum Velocity (Vmax) and Michaelis-Menten Constant (Km)
In vitro characterization of enzyme studies and substrate metabolism involves
determination of qualitative profiles and quantitative parameters. Quantitative
parameters generally include the estimation of kinetic parameters, such as maximum
velocity (Vmax) and Michaelis-Menten constant (Km). Enyzme inhibition studies are
conducted to characterize the type of inhibition process (i.e., competitive,
uncompetitive, or noncompetitive) and to determine the inhibition constant (Ki)
(Kakkar et al., 1999).
Kinetic study explains the rate of reaction, how fast an enzyme converts
substrate to form product, which is also known as velocity. To determine velocity,

24
product (or substrate) concentration and time have to be measured. Velocity is the
slope of a plot of product (or substrate) concentration against time (Figure 1.12)
(Gilbert, 2000).
Figure 1.10 Velocity of product formation or substrate disappearance is defined as the
change in product concentration per unit time. Velocity is the slope of a plot of product
concentration against time (Gilbert, 2000).
The Michaelis-Menten constant, Km, can be described as the equilibrium
constant of the reversible combination of an enzyme with its substrate. It takes the state
where a substrate S binds reversibly to an enzyme E to form an enzyme-substrate
complex ES, which reacts irreversibly to generate a product P and also regenerates free
enzyme E. This system can be represented as follows:
Equation 3
The Michaelis-Menten equation for this system is:
Equation 4