potential relationships between urban development and the
TRANSCRIPT

Potential Relationships between Urban Development and the Trophic Status of Tampa Bay Tributaries and Lake Thonotosassa, Further the Potential Effect on Public Health
Max J. Moreno Madriñán
Mohammad Z. Al-Hamdan
Douglas L. Rickman
Maury Estes
American Public Health Association's 138th Annual Meeting and Exposition in Denver, CO, November 10, 2010
LT50170412009034EDC00 2009/02/03

Presenter Disclosures
(1) The following personal financial relationships with commercial interests relevant to this presentation existed during the past 12 months:
<Max Jacobo Moreno Madriñán>
< “No relationships to disclose” >

Outline• Background – Public Health• Hypothesis• Objectives• Land Cover/Land Use change (LC/LU)
using Coastal Change Analysis Program (C-CAP) - NOAA product
• Water Quality (WQ) analysis with emphasis on Turbidity - Analysis of relationship between Remotely Sensed (RS) data from MODIS and in situ data from the Environmental Protection Commission of Hillsborough County (EPCHC) on turbidity on TB
• Preliminary conclusions
http://www.networkedblogs.com/p22486755 http://www.brennanbail.com/images/tampa-bail-bond.jpg

Tampa Bay WatershedThe 5,700 Km2 Tampa Bay watershed (TBW) lies within the Counties of Hillsborough, Pinellas, and Manatee and extends to parts of Sarasota, Pasco, and Polk Counties.Tampa Bay (TB), is the largest open-water estuary in Florida. Stretches 1,030.81 km2 at high tide.Average depth: 3.4 mMore than 128.75 km of deep-water shipping channels –the largest 13 m deep.Three ports: $15 billion to the local economy and support 130,000 jobs.
Pinellas
Pasco
Hillsborough Polk
Manatee
Sarasota

Water Quality
• Improving since the early 80’s - effective environmental management strategies - upgrade to tertiary level in the waste water treatment plant • Ecological importance allowing the supportive function of ecosystems • Sport fishing, boating, kayaking, and wildlife watching support tourism and leisure of locals• Public health
Fort De Soto
Fort De Soto
Fort De Soto

Hypotheses
• Change in LC/LU affects the WQ of Tampa Bay tributaries, Lake Thonotosassa and the Bay itself
• Both the LC/LU and WQ can be estimated with RS as well as the effect of their interaction
Objectives• Analyze for possible effects that LC/LU changes may cause
in WQ of TB tributaries and Lake Thonotosassa– Evaluate LC/LU change in TB using RS– Estimate turbidity in TB water using RS– Estimate association between LC/LU and WQ
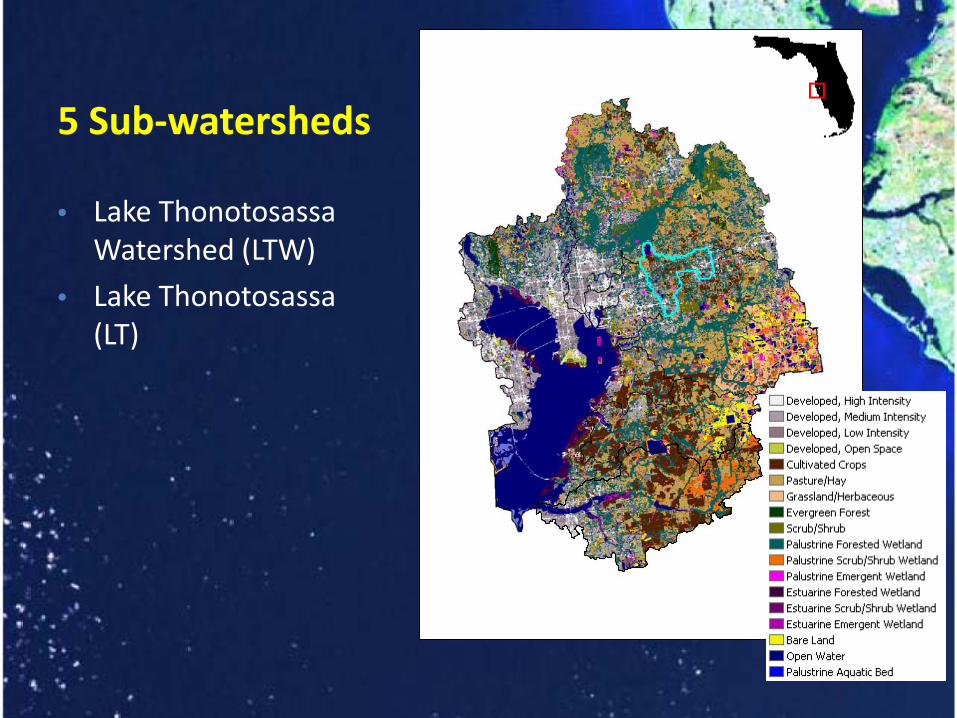
5 Sub-watersheds
• Lake Thonotosassa Watershed (LTW)
• Lake Thonotosassa (LT)
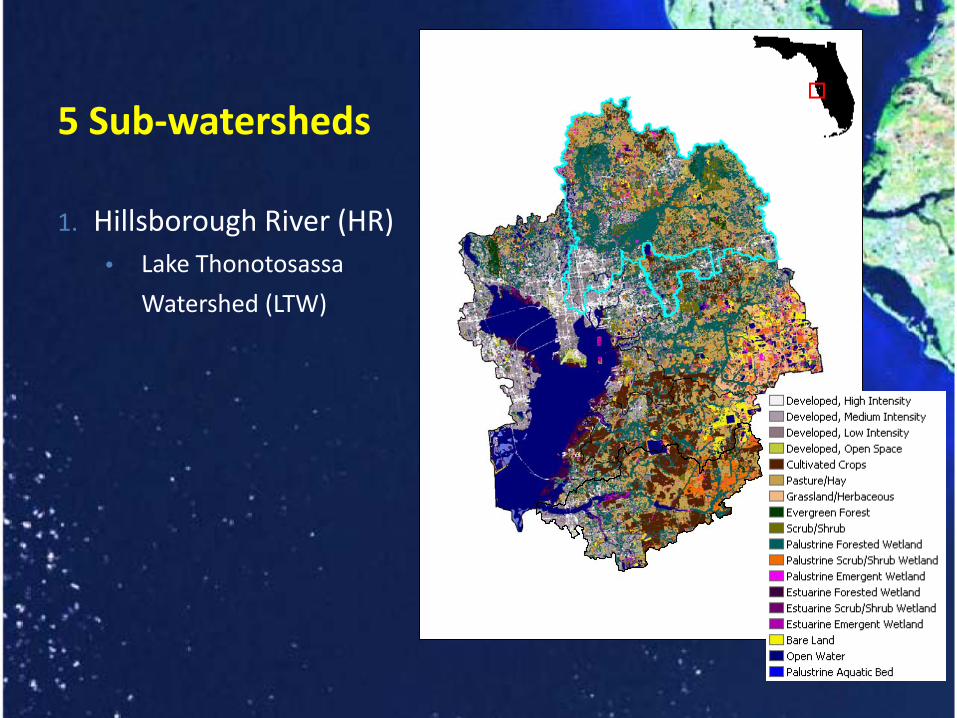
1. Hillsborough River (HR)• Lake Thonotosassa
Watershed (LTW)
5 Sub-watersheds

1. Hillsborough River (HR)• Lake Thonotosassa
Watershed (LTW)
2. Alafia River (AR)
5 Sub-watersheds

1. Hillsborough River (HR)• Lake Thonotosassa
Watershed (LTW)
2. Alafia River (AR)
3. Little Manatee River (LMR)
5 Sub-watersheds

1. Hillsborough River (HR)• Lake Thonotosassa
Watershed (LTW)
2. Alafia River (AR)
3. Little Manatee River (LMR)
4. Manatee River (MR)
5 Sub-watersheds

1. Hillsborough River (HR)• Lake Thonotosassa
Watershed (LTW)
2. Alafia River (AR)
3. Little Manatee River (LMR)
4. Manatee River (MR)
5. Tampa Bay watershed (TBw)• TB West• TB N. East• TB. East• TB. S. East• TB
5 Sub-watersheds

1. Hillsborough River (HR)
2. Alafia River (AR)
3. Little Manatee River (LMR)
4. Manatee River (MR)
5. Tampa Bay watershed (TBw)
5 Sub-watersheds

C-CAP 1996: TBW
Class name
Area in all TBW in Km2
Change
1996 2001 Km2 Percent
Develop. 1264 1410 146 11.5
Agr./Grass 1617 1517 -46 -2.9
Forest 48 51 3.5 7.3
Scrub 247 156 -9.1 -36.8
Wetland 2348 2314 -34.4 -1.5
Uncons. 0.5 0.4 -0.1 -19.5
Bare Land 67 94 27 39
Water 1056 1052 -4 -0.4

C-CAP 2001: TBW
Class name
Area in all TBW in Km2
Change
1996 2001 Km2 Percent
Develop. 1264 1410 146 11.5
Agr./Grass 1617 1517 -46 -2.9
Forest 48 51 3.5 7.3
Scrub 247 156 -9.1 -36.8
Wetland 2348 2314 -34.4 -1.5
Uncons. 0.5 0.4 -0.1 -19.5
Bare Land 67 94 27 39
Water 1056 1052 -4 -0.4

C-CAP 2006: TBW
Class name
Area in all TBW in Km2
Change
2001 2006 Km2 Percent
Develop. 1410 1439 29 2.1
Agr./Grass 1517 1513 -58 -3.7
Forest 51 50 -1 -2.9
Scrub 156 152 -4 -2.4
Wetland 2314 2272 -41 -1.8
Uncons. 0.4 0.4 0.0 1.7
Bare Land 94 126 32 34.5
Water 1052 1095 44 4.1

Class name
Area in Tampa Bay Watershed in Km2 Change
in Km2
Pct. Change
1996 2006
Develop. 1264 1439 175 13.8
Agr./Grass 1617 1513 -105 -6.5
Forest 48 50 2 4.2
Scrub 247 152 -94 -38.2
Wetland 2348 2272 -76 -3.2
Uncons. 0.5 0.4 -0.1 -18.1
Bare Land 67 126 59 87.3
Water 1056 1095 39 3.7
Change in Land Cover/Land Use (LC/LU)in the Tampa Bay Watershed
0
500
1000
1500
2000
2500
km2
1996
2001
2006
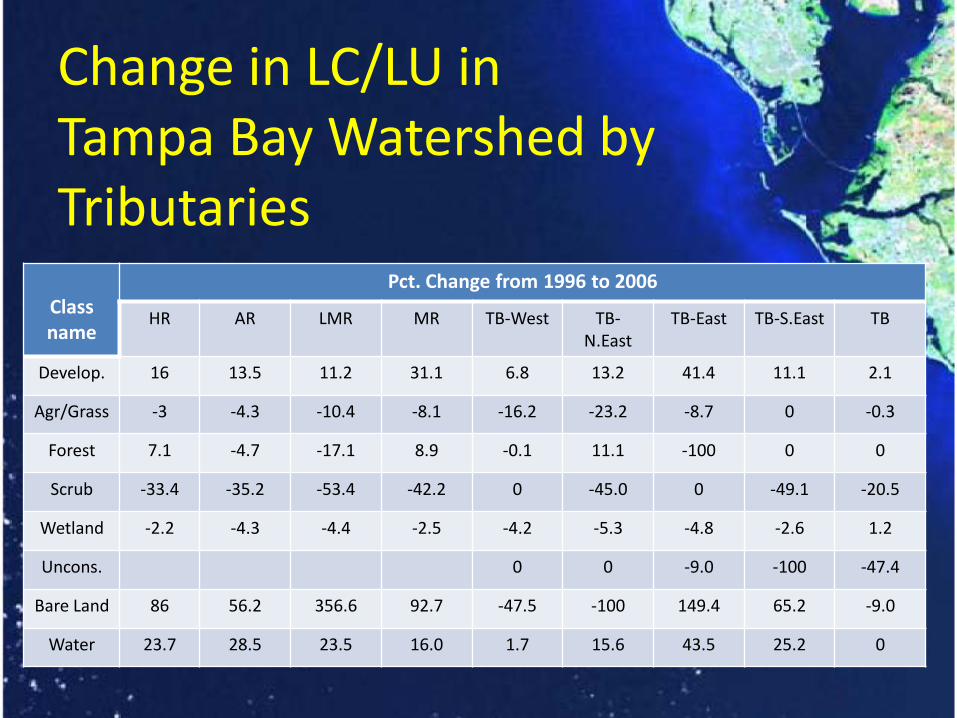
Class name
Pct. Change from 1996 to 2006
HR AR LMR MR TB-West TB-N.East
TB-East TB-S.East TB
Develop. 16 13.5 11.2 31.1 6.8 13.2 41.4 11.1 2.1
Agr/Grass -3 -4.3 -10.4 -8.1 -16.2 -23.2 -8.7 0 -0.3
Forest 7.1 -4.7 -17.1 8.9 -0.1 11.1 -100 0 0
Scrub -33.4 -35.2 -53.4 -42.2 0 -45.0 0 -49.1 -20.5
Wetland -2.2 -4.3 -4.4 -2.5 -4.2 -5.3 -4.8 -2.6 1.2
Uncons. 0 0 -9.0 -100 -47.4
Bare Land 86 56.2 356.6 92.7 -47.5 -100 149.4 65.2 -9.0
Water 23.7 28.5 23.5 16.0 1.7 15.6 43.5 25.2 0
Change in LC/LU in Tampa Bay Watershed by Tributaries

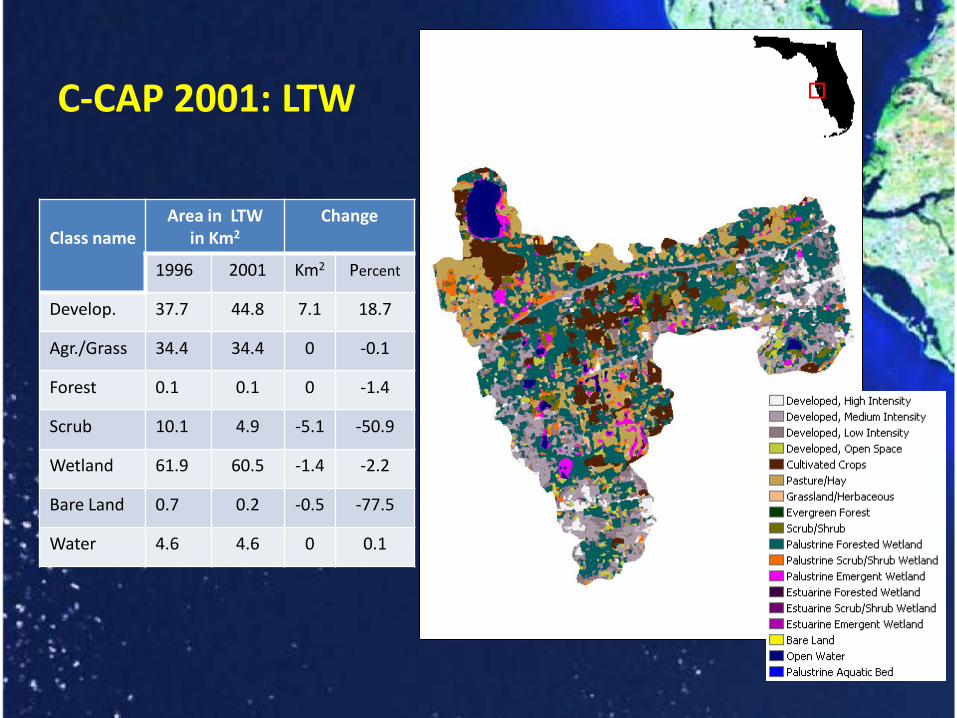
Class nameArea in LTW
in Km2Change
1996 2001 Km2 Percent
Develop. 37.7 44.8 7.1 18.7
Agr./Grass 34.4 34.4 0 -0.1
Forest 0.1 0.1 0 -1.4
Scrub 10.1 4.9 -5.1 -50.9
Wetland 61.9 60.5 -1.4 -2.2
Bare Land 0.7 0.2 -0.5 -77.5
Water 4.6 4.6 0 0.1
C-CAP 1996: LTW
Watershed: 150 Km2
Lake: 2.5 km long, 1.5 km wide, and 2.5 m depth
Class Ill: Rule 62-302.400, Florida Administrative Code (F.A.C.), human recreation and propagation of fish and wildlife.
Class nameArea in LTW
in Km2Change
1996 2001 Km2 Percent
Develop. 37.7 44.8 7.1 18.7
Agr./Grass 34.4 34.4 0 -0.1
Forest 0.1 0.1 0 -1.4
Scrub 10.1 4.9 -5.1 -50.9
Wetland 61.9 60.5 -1.4 -2.2
Bare Land 0.7 0.2 -0.5 -77.5
Water 4.6 4.6 0 0.1
C-CAP 2001: LTW

Class nameArea in LTW
in Km2Change
2001 2006 Km2 Percent
Develop. 44.8 45.4 0.6 1.4
Agr./Grass 34.4 34 -0.4 -1.1
Forest 0.1 0.1 0 -10.3
Scrub 4.9 4.9 -0.1 -1.5
Wetland 60.5 59.7 -0.8 -1.3
Bare Land 0.2 0.4 0.3 174.9
Water 4.6 5.0 0.4 8
C-CAP 2006: LTW

Change in Land Cover/Land Use (LC/LU)in Lake Thonotosassa Watershed
Class name
Area in Thonotosassa
Watershed in Km2Change
in Km2
Pct. Change
1996 2006
Develop. 37.7 45.4 7.7 20.3
Agr./Grass 34.4 34 -0.4 -1.2
Forest 0.1 0.1 0 -11.6
Scrub 10.1 4.9 -5.2 -51.6
Wetland 61.9 59.7 -2.2 -3.5
Bare Land 0.7 0.4 -0.3 -38.1
Water 4.6 5.0 0.4 8.1
0
10
20
30
40
50
60
70
Km2
1996
2001
2006

Population Growth in the Tampa Bay Metropolitan Area
0
500,000
1,000,000
1,500,000
2,000,000
2,500,000
3,000,000
1990
1991
1992
1993
1994
1995
1996
1997
1998
1999
2000
2001
2002
2003
2004
2005
2006
Popu
lati
on
Year
US Bureau of the Census (1990 – 2000)
http://www.census.gov/popest/metro/CBSA-est2006-annual.html
That number is expected to grow by nearly 19 percent by the year 2015, as approximately 500 people move to one of the three counties each week.http://www.tbep.org/estuary.html

Chlorophyll-α concentrationin Tampa Bay Water (1981- 2007)
Data from the Environmental Protection Commission of Hillsborough County

Mean Annual Concentration of Four Parameters of WQ in Water from Hillsborough River from 1996 to
2006
00.20.40.60.8
11.21.4
1996 1998 2000 2002 2004 2006
Mea
n A
nnua
lTN
(mg/
L)
Year
0
0.05
0.1
0.15
0.2
0.25
0.3
1996 1998 2000 2002 2004 2006
Mea
n A
nnua
l TP
(mg/
L)
Year
0
5
10
15
20
25
30
1996 1998 2000 2002 2004 2006
Mea
n A
nnua
l Clo
roph
yll-α
(µg/
L)
Year
0
1
2
3
4
5
1996 1998 2000 2002 2004 2006Mea
n A
nnua
lTur
bidi
ty(N
TU)
Year
The same procedure was followed with each one of the other 4 tributaries of TB

Mean Annual Ratio of TN:TP in Water from Hillsborough River and Lake Thonotosassa from 1996 to 2006
Decreasing ratios of TN:TP in inflow water may be a concern for potential favorable conditions leading to abundance of cyanobacteria in receiving water bodies
Scaled Rate: -82.5 = 0.000165/-0.000002
0.00016
0.000165
0.00017
0.000175
0.00018
0.000185
0.00019
0.000195
1996 1998 2000 2002 2004 2006
Rati
o TN
:TP
YearHR LT
Scaled Rate: -10.6 = 3.5/-0.3309
0
2
4
6
8
10
12
1996 1998 2000 2002 2004 2006
Ratio
TN
:TP
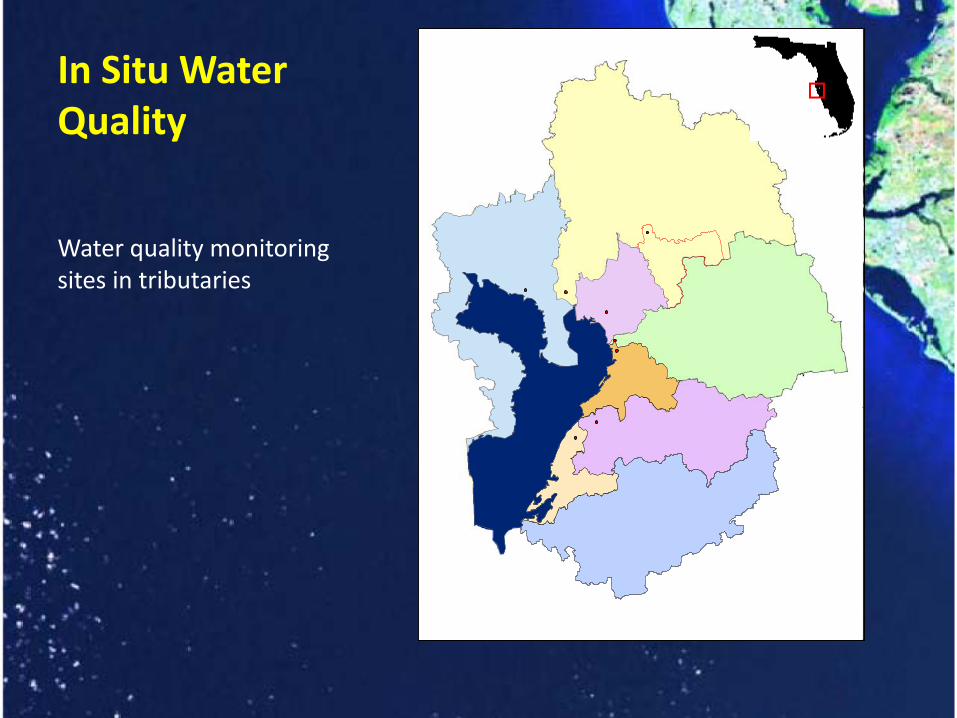
In Situ Water Quality
Water quality monitoring sites in tributaries

Watershed Change km2
1996-2006Pct. Change 1996-2006
Scaled Rate: Range/Slope
Turbidity Chlorophyll-α TN:TP Ratio
HR 53.1 16 -43.9 34 -10.6
AR 18.4 13.5 -18 2343 -19.2
LMR 4.8 11.2 -16.8 -21.8 -25.4
MR 38.9 31.1 -71.2 25.7
TB West 30.8 6.8 -24.7 -7.2 -13.3
TB N. East 15.6 13.2 30.7 9.9 31.7
TB East 11.1 41.1 -260 -657 -29.7
TB S. East 2.9 11.1 -44.6 -48.6 -1714
TB 0.2 2.1 -13.7 (Site 14) 6875 (Site 14) -4 (Site 14)
LT 7.7 20.3 -42.4 118.7 -82.5
Percent change in developing land in watersheds of TB tributaries and their corresponding trend in mean annual WQ variables. Trends are obtained from plotting annual means
Change in Developing Land andRegression Slopes of Water Qualityin Tampa Bay Tributaries
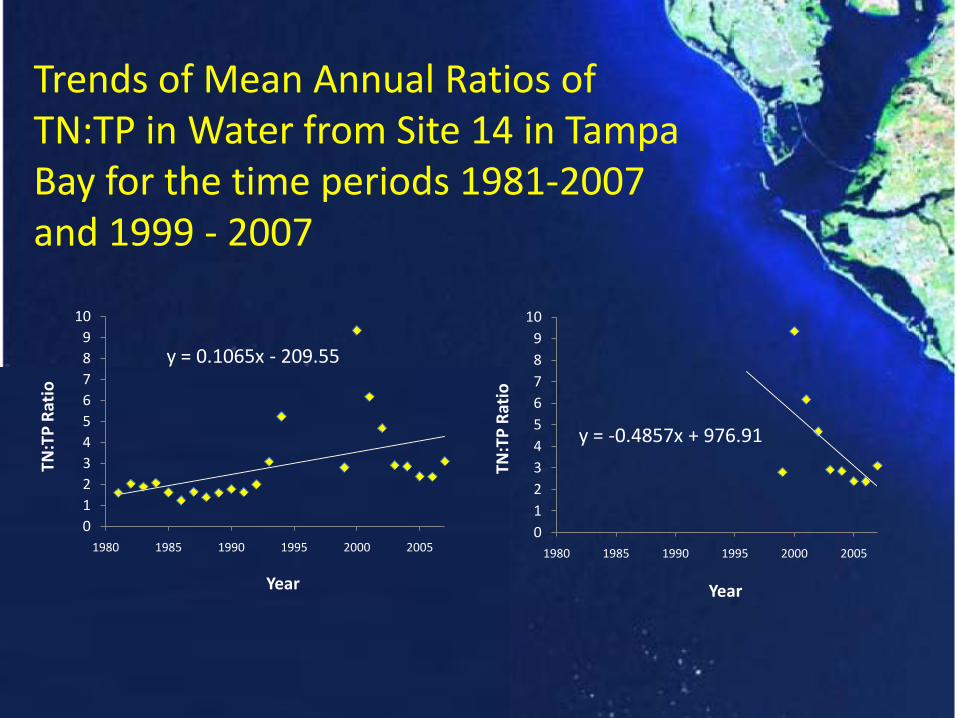
Trends of Mean Annual Ratios of TN:TP in Water from Site 14 in Tampa Bay for the time periods 1981-2007 and 1999 - 2007
y = 0.1065x - 209.55
0123456789
10
1980 1985 1990 1995 2000 2005
TN:T
P Ra
tio
Year
y = -0.4857x + 976.91
0123456789
10
1980 1985 1990 1995 2000 2005
TN:T
P Ra
tio
Year

Estimating Turbidity withRemotely Sensed Data
• Surface reflectance MODIS Terra daily product (MOD09GQ) Band 1 (620 – 670 nm) 250 m• Corrected for atmospheric effect• Turbidity • Criteria:1. Matching with a good quality satellite
image of the same day2. No mixed pixels3. Water depth ≥ 2.4 m to avoid bottom
reflectance contamination. • Ultimately, 294 data values from 33
stations (in red) out of 5,262 from 56 stations (red and yellow)
• In situ data provided by the Environmental Protection Commission of Hillsborough County (EPCHC)

Relationships between in situturbidity (NTU) and Rrs from MOD09GQ
Number of Days
R2 Equation n
8 0.76 165.93 Rrs + 1.213 347 0.69 157.96 Rrs + 1.4746 606 0.55 161.43 Rrs + 1.6089 875 0.48 160.42 Rrs + 2.1492 1144 0.47 162.94 Rrs + 1.9947 1333 0.35 143.39 Rrs + 1.9064 1952 0.35 144.19 Rrs + 1.8696 2221 0.32 143.64 Rrs + 1.8413 2600 0.32 142.28 Rrs + 1.7944 294
Cumulative analysis starting with all the matching pairs of data available according to the criteria and gradually decreasing the data set by increasing one day after rain event until eventually having only the matching pairs with 8 days or more after a rain event. All relationships were significant (P<0.0001) if normality is assumed.

Relationships between in situ turbidity (NTU) and Rrs from MOD09GQ (cont’d)
8 days after rain eventSame day of a rain event (cloud free sky)
y = 165.93x + 1.213R² = 0.7567
n = 34
0
2
4
6
8
10
12
14
0.00 0.02 0.04 0.06 0.08
In S
ituTu
rbid
ity (N
TU)
Rrs (645)
y = 12.053x + 2.269R² = 0.003
n = 32
0
1
2
3
4
5
6
7
0 0.005 0.01 0.015 0.02 0.025
In S
ituTu
rbid
ity (N
TU)
Rrs (645)

Summary Table of Time Series from 2000 to 2007 in Tampa Bay water
Slopes of the Trends
≥ 8 days after rain
Reflectance -0.000003
In situ Turbidity(NTU)
-0.001
In situ Chlorophyll-α(mg/L)
-0.0004
In situ Total Nitrogen (TN)(mg/L)
-0.0003
In situ Total Phosphorus (TP) (mg/L)
-0.00003
These trends were calculated using both RS and in situ data from the same dates.

Summary statistics for Time Period 2000-2007
Sub-RegionsAverageTurbidity
(NTU)
SD-Turbidity
(NTU)
AverageBottom
Depth (m)
SD -Bottom
Depth (m)
Average Color (Pt-Co Units)
SD -Color (Pt-Co Units)
n
Hillsborough Bay 4.8 3.0 3.8 1.0 10.0 5.4 38
Old Tampa Bay 2.9 2.2 3.5 1.0 8.7 3.7 37
Middle Tampa Bay 3.2 1.9 6.2 2.0 7.9 4.4 135
Low Tampa Bay 3.9 2.7 6.4 2.6 4.4 2.0 84
Summary statistics of in situ data variables for the time period 2000-2007 by sub-regions of the Tampa Bay and using only data matched up with Remotely Sensed Data

Preliminary Conclusions• Areas covered with developed land, bare land, and open water
increased in the TBW for the time period 1996-2006.
• The Sub-watershed with the greater percentage of increase in developed land was Manatee River followed by Hillsborough River, Alafia River, Little Manatee River, and Tampa Bay tributary.
• Areas covered with agriculture, wetlands, and scrub/shrub decreased for the same time period.
• The sub-watershed with the greater decrease in wetlands was Little Manatee River followed by Alafia River, Tampa Bay tributary, Manatee River, and Hillsborough River.
• Lake Thonotosassa watershed showed an increase in developed land and a decrease in land classes agriculture, scrub, and wetland.

Preliminary Conclusions• Except for Manatee River and few minor tributaries
within the Tampa Bay watershed, ratios of TN to TP in the remaining tributaries suggest a decreasing trend. This may be a concern in regard to potential for cyanobacteria abundance.
• Turbidity is better estimated with RS with more days after rainfall.
• Turbidity and concentration of TN, TP, and chlorophyll-α slightly decreased in TB water for the time period 2000- 2006.
• The Surface reflectance MODIS Terra daily product (MOD09GQ) showed to be operable to estimate turbidity in TB but not in Lake Thonotosassa.

?Presenter:• Max Jacobo Moreno Madriñán, PhD, MEM• NASA Postdoctoral Program fellow/ORAU
Global Hydrology and Climate Center NSSTC/MSFC/NASA320 Sparkman DriveHuntsville, AL 35805
• [email protected]• Office: 256-961-7742• Cell: 813-505-9305