potomac-raritan-magothy (prm) system · °f = 1.8 (°c) + 32 sea level: in this report "sea...
TRANSCRIPT

WATER QUALITY OF THE POTOMAC-RARITAN-MAGOTHY AQUIFER SYSTEM IN THE
COASTAL PLAIN, WEST-CENTRAL NEW JERSEY
By Elisabeth M. Ervin, Lois M. Voronin, and Thomas V. Fusillo
U.S. GEOLOGICAL SURVEY
Water-Resources Investigations Report 94-4113
Prepared in cooperation with the
NEW JERSEY DEPARTMENT OF ENVIRONMENTAL PROTECTION AND ENERGY
West Trenton, New Jersey 1994

U.S. DEPARTMENT OF THE INTERIOR
BRUCE BABBITT, Secretary
U.S. GEOLOGICAL SURVEY
Gordon P. Eaton, Director
For additional information write to:
District ChiefU.S. Geological SurveyMountain View Office Park810 Bear Tavern RoadSuite 206West Trenton, NJ 08628
Copies of this report can be purchased from:
U.S. Geological SurveyEarth Science Information CenterOpen-File Reports SectionBox 25286, MS 517Denver Federal CenterDenver, CO 80225

CONTENTS
Page
Abstract............................................................. 1Introduction......................................................... 2
Purpose and scope............................................... 2Well-numbering system........................................... 4Previous studies ................................................ 4Acknowledgments................................................. 5
Hydrogeologic setting................................................ 5Geologic formations of the New Jersey Coastal Plain............. 5Potomac-Raritan-Magothy aquifer system.......................... 7
Aquifer characteristics.................................... 10Predevelopment ground-water flow........................... 10Present-day ground-water flow.............................. 14
Water quality........................................................ 19Regional variations............................................. 24
Hydrochemical facies....................................... 25Areal distribution of chemical constituents................ 40
Dissolved solids...................................... 40Sodium................................................ 57Chloride.............................................. 58Iron. ................................................. 59Manganese............................................. 61Hydrogen-ion activity (pH)............................ 62Trace elements........................................ 63Nitrogen.............................................. 63
Presence of saline water........................................ 65Downdip saline water....................................... 65Intrusion of saline water from the Delaware River estuary.. 69
Effects of human activities..................................... 71Effect of ground-water pumpage on the migration of contaminants from the Pennsylvania side of the aquifersystem.................................................... 71
Presence of purgeable organic compounds and locations ofhazardous-waste sites ..................................... 79
Summary and conclusions .............................................. 89References cited..................................................... 93
ILLUSTRATIONS
Figure 1. Map showing location of the study area................... 32. Generalized hydrogeologic section A-A' through the study
area................................................... 83-5. Maps showing simulated and (or) interpreted predevelop-
ment potentiometric surfaces in the:3. Upper aquifer, Potomac-Raritan-Magothy aquifer
system, 1983....................................... 114. Middle aquifer, Potomac-Raritan-Magothy aquifer
system, 1983....................................... 125. Lower aquifer, Potomac-Raritan-Magothy aquifer
system, 1983....................................... 13
111

ILLUSTRATIONS - -Continued
Page
Figure 6. Graphs showing average yearly ground-water withdrawals from the Potomac-Raritan-Magothy aquifer system in Burlington, Camden, and Gloucester Counties, 1920-80... 15
7-9. Maps showing potentiometric surfaces in the:7. Upper aquifer, Potomac-Raritan-Magothy aquifer
system, 1983....................................... 168. Middle aquifer, Potomac-Raritan-Magothy aquifer
system, 1983....................................... 179. Lower aquifer, Potomac-Raritan-Magothy aquifer
system, 1983....................................... 1810-12. Maps showing location of wells for which water-quality
data are available:10. Upper aquifer, Potomac-Raritan-Magothy aquifer
system............................................. 2011. Middle aquifer, Potomac-Raritan-Magothy aquifer
system............................................. 2112. Lower aquifer, Potomac-Raritan-Magothy aquifer
system............................................. 2213. Diagrams showing chemical evolution of ground water
along section B'-B................................. 2614-16. Maps showing cation facies (calcium plus magnesium as
percentage of sum of major cations), and associated Stiff diagrams, in water from the:
14. Upper aquifer, Potomac-Raritan-Magothy aquifersystem, 1980-86.................................... 28
15. Middle aquifer, Potomac-Raritan-Magothy aquifersystem, 1980-86.................................... 30
16. Lower aquifer, Potomac-Raritan-Magothy aquifersystem, 1980-86.................................... 32
17-19. Maps showing anion facies (chloride plus sulfate as percentage of sum of major anions), and associated Stiff diagrams, in water from the:
17. Upper aquifer, Potomac-Raritan-Magothy aquifersystem, 1980-86.................................... 34
18. Middle aquifer, Potomac-Raritan-Magothy aquifersystem, 1980-86.................................... 36
19. Lower aquifer, Potomac-Raritan-Magothy aquifersystem, 1980-86.................................... 38
20-22. Maps showing generalized distribution of dissolved solids in water from the:
20. Upper aquifer, Potomac-Raritan-Magothy aquifersystem, 1980-86.................................... 41
21. Middle aquifer, Potomac-Raritan-Magothy aquifersystem, 1980-86.................................... 42
22. Lower aquifer, Potomac-Raritan-Magothy aquifersystem, 1980-86.................................... 43
23-25. Maps showing generalized distribution of dissolved sodium in water from the:
23. Upper aquifer, Potomac-Raritan-Magothy aquifersystem, 1980-86.................................... 44
IV

ILLUSTRATIONS--Continued
Page
Figure 24. Middle aquifer, Potomac-Raritan-Magothy aquifersystem, 1980-86.................................... 45
25. Lower aquifer, Potomac-Raritan-Magothy aquifersystem, 1980-86.................................... 46
26-28. Maps showing generalized distribution of dissolved chloride in water from the:
26. Upper aquifer, Potomac-Raritan-Magothy aquifersystem, 1980-86.................................... 47
27. Middle aquifer, Potomac-Raritan-Magothy aquifersystem, 1980-86.................................... 48
28. Lower aquifer, Potomac-Raritan-Magothy aquifersystem, 1980-86.................................... 49
29-31. Maps showing generalized distribution of dissolved iron in water from the:
29. Upper aquifer, Potomac-Raritan-Magothy aquifersystem, 1980-86.................................... 50
30. Middle aquifer, Potomac-Raritan-Magothy aquifersystem, 1980-86................................... 51
31. Lower aquifer, Potomac-Raritan-Magothy aquifersystem, 1980-86................................... 52
32-34. Maps showing areal variations in pH of water from the:32. Upper aquifer, Potomac-Raritan-Magothy aquifer
system, 1980-86.................................... 5333. Middle aquifer, Potomac-Raritan-Magothy aquifer
system, 1980-86.................................... 5434. Lower aquifer, Potomac-Raritan-Magothy aquifer
system, 1980-86.................................... 5535-37. Maps showing:
35. Concentrations of dissolved ammonia and nitrate in water from the upper aquifer, Potomac-Raritan- Magothy aquifer system, 1980-86.................... 66
36. Concentrations of dissolved ammonia and nitrate in water from the middle aquifer, Potomac-Raritan- Magothy aquifer system, 1980-86.................... 67
37. Concentration of dissolved ammonia in water from the lower aquifer, Potomac-Raritan-Magothy aquifer system, 1980-86.................................... 68
38. Stiff diagrams showing ionic composition of water from the Ragovin well, Cumberland County, New Jersey, and of seawater............................................ 70
39-43. Maps showing:39. Concentrations of dissolved solids in water from the
lower aquifer, Potomac-Raritan-Magothy aquifer system, Philadelphia-Camden area, 1980-86.......... 73
40. Concentrations of dissolved iron in water from the lower aquifer, Potomac-Raritan-Magothy aquifer system, Philadelphia-Camden area, 1980-86.......... 74
41. Concentrations of dissolved manganese in water from the lower aquifer, Potomac-Raritan-Magothy aquifer system, Philadelphia-Camden area, 1980-86.......... 75
v

ILLUSTRATIONS--Continued
Page
Figure 42. Areal variations in pH of water from the loweraquifer, Potomac-Raritan-Magothy aquifer system,PhiladeIphia-Camden area, 1980-86.................. 76
43. Concentrations of dissolved sulfate in water fromthe lower aquifer, Potomac-Raritan-Magothy aquifer system, Philadelphia-Camden area, 1980-86.......... 77
44. Graphs showing temporal changes in selected water-qualitycharacteristics of water from well 15-323.......... 78
45-47. Maps showing concentrations of total purgeable organic compounds in water from the:
45. Upper aquifer, Potomac-Raritan-Magothy aquifersystem, 1980-86.................................... 80
46. Middle aquifer, Potomac-Raritan-Magothy aquifersystem, 1980-86.................................... 81
47. Lower aquifer, Potomac-Raritan-Magothy aquifersystem, 1980-86.................................... 82
48-52. Maps showing distribution of:48. Chlorinated solvents, aromatic organic compounds,
and trihalomethanes in water from the upper aquifer, Potomac-Raritan-Magothy aquifer system, 1980-86............................................ 83
49. Chlorinated solvents in water from the middleaquifer, Potomac-Raritan-Magothy aquifer system, 1980-86............................................ 84
50. Aromatic organic compounds and trihalomethanes in water from the middle aquifer, Potomac-Raritan- Magothy aquifer system, 1980-86.................... 85
51. Chlorinated solvents in water from the lower aquifer,Potomac-Raritan-Magothy aquifer system, 1980-86.... 86
52. Aromatic organic compounds and trihalomethanes in water from the lower aquifer, Potomac-Raritan- Magothy aquifer system, 1980-86.................... 87
53. Map showing National Priority List sites and otherhazardous-waste sites within 1 mile of the Potomac- Raritan-Magothy outcrop area in New Jersey............. 90
TABLES
Table 1. Geologic and hydrogeologic units in the study area........ 62. Records of wells sampled, Potomac-Raritan-Magothy aquifer
system, 1985-86......................................... 983. Changes in Potomac-Raritan-Magothy aquifer codes since
1984 for selected wells................................. 1004. Statistical summary of analyses of water from the Potomac-
Raritan-Magothy aquifer system, 1985-86................. 235-8. Results of analyses of ground-water samples for:
5. Common constituents and physical characteristics,1985-86.............................................. 101
6. Dissolved trace elements, 1985-86...................... 1077. Dissolved nutrients, 1985-86........................... Ill
VI

TABLES--Continued
Page
Table 8. Purgeable organic compounds, 1985-86................... 1139. Trace elements in water from the Potomac-Raritan-Magothy
aquifer system, 1980-86, in relation to laboratory detection limits and U.S. Environmental Protection Agency Maximum Contaminant Levels....................... 64
10. Summary of data on purgeable organic compounds in water from the Potomac-Raritan-Magothy aquifer system, 1980-86................................................. 88
VII

CONVERSION FACTORS, VERTICAL DATUM, AND ABBREVIATED WATER-QUALITY UNITS
Multiply By.
inch (in.) 25.4 foot (ft) 0.3048 mile (mi) 1.609 square mile (mi 2 ) 2.590 foot per second (ft/s) 0.3048 gallon per minute 0.2070per foot (gal/min)/ft
gallons per minute (gal/min) 0.000063 foot squared per day (ft 2 /d) 0.0929 million gallons per day 3785
(Mgal/d)
To Obtain
millimetermeterkilometersquare kilometermeter per secondliter per second permeter of drawdown
cubic meters per second meters squared per day cubic meter per day
Temperature is given in degrees Celsius (°C), which can be converted to degrees Fahrenheit (°F) by the following equation:
°F = 1.8 (°C) + 32
Sea level: In this report "sea level" refers to the National Geodetic Vertical Datum of 1929--a geodetic datum derived from a general adjustment of the first-order level nets of the United States and Canada, formerly called Sea Level Datum of 1929.
Abbreviated water-quality units used in this report: Chemical concentrations and water temperature are given in metric units. Chemical concentration is given in milligrams per liter (mg/L) or micrograms per liter (/^g/L) . Milligrams per liter is a unit expressing the concentration of chemical constituents in solution as weight (milligrams) of solute per unit volume (liter) of water. One thousand micrograms per liter is equivalent to one milligram per liter. For concentrations less than 7,000 mg/L, the numerical value is the same as for concentrations in parts per million.
Concentrations of major ions represented in Stiff diagrams in some of the illustrations are in milliequivalents per liter (meq/L).
Specific electrical conductance of water is expressed in microsiemens per centimeter (juS/cm) at 25 °C (degrees Celsius). This unit is equivalent to micromhos per centimeter (jumho/cm) at 25 °C, formerly used by the U.S. Geological Survey.
Readers who are unfamiliar with hydrologic terms are directed to the following glossaries and sources of information: Heath (1984), Freeze and Cherry (1979), and Lohman and others (1972).
Vlll

WATER QUALITY OF THE POTOMAC-RARITAN-MAGOTHY AQUIFER SYSTEM IN THE COASTAL PLAIN, WEST-CENTRAL NEW JERSEY
By Elisabeth M. Ervin, Lois M. Voronin, and Thomas V. Fusillo
ABSTRACT
The Potomac-Raritan-Magothy aquifer system includes some of the most productive and extensive aquifers in the Coastal Plain of New Jersey. In 1983, 68 percent of all water withdrawn from the Coastal Plain aquifers was from this aquifer system. This study, started in 1980 and conducted by the U.S. Geological Survey in cooperation with the New Jersey Department of Environmental Protection and Energy, was designed to define the areal and vertical distribution of chemical constituents, to determine downdip water quality, and to identify possible threats to the aquifer system as a result of pumping and other human activities. The study area comprises parts of Mercer, Burlington, Camden, Gloucester, and Salem Counties.
Predevelopment ground-water flow was from recharge areas along the outcrop of the Potomac-Raritan-Magothy aquifer system in Mercer and Middlesex Counties through the aquifer system; ground water ultimately discharged to the Delaware River. Pumping has altered this flow pattern. A large cone of depression is centered on Camden, N.J. As a result, the direction of ground- water flow has reversed in some parts of the Potomac-Raritan-Magothy aquifer system, particularly along the Delaware River, allowing estuarine water to flow into the aquifer system.
Ground-water quality in the Potomac-Raritan-Magothy aquifer system results from a combination of predevelopment and present-day flow patterns. Hydrochemical facies correlate to a large extent with prepumping flow patterns; water near the recharge areas is enriched with calcium, magnesium, and sulfate. Downdip, a zone of bicarbonate and sodium and potassium-rich water is present where the sediments of the Potomac-Raritan-Magothy aquifer system have not been flushed with fresh recharge water.
Concentrations of many constituents and values of chemical properties, such as dissolved solids, dissolved sodium, dissolved chloride, and dissolved iron, and pH, reflect the predevelopment regional recharge and discharge patterns. Water downdip in the Potomac-Raritan-Magothy aquifer system tends to contain higher concentrations of dissolved solids than water in the outcrop area and is, therefore, less desirable for human consumption. High concentrations of dissolved iron in the outcrop area (greater than 0.3 milligrams per liter) have resulted in the abandonment of many wells.
Potential threats to the quality of water in the Potomac-Raritan-Magothy aquifer system include flow of downdip saline water toward areas of large ground-water withdrawals; intrusion of salty or saline water from the Delaware River as a result of drought or rising sea level; possible migration of poor- quality water from Philadelphia in response to changes in potentiometrie-head relations; and continued contamination of the aquifer system, especially by purgeable organic compounds, in and near the outcrop area.

INTRODUCTION
The confined sand and gravel aquifers of the Potomac Group and Raritan and Magothy Formations that comprise the Potomac-Raritan-Magothy aquifer system are used extensively as sources of water in much of the Atlantic Coastal Plain of New Jersey. Withdrawals of more than 220 Mgal/d from these aquifers during 1983 for publie-supply, industrial, commercial, and agricultural use represent approximately 68 percent of total ground-water withdrawals from the Coastal Plain aquifers in New Jersey. The greatest water use in 1983 was in Camden County (fig. 1), where 97 percent of all pumped water came from the Potomac-Raritan-Magothy aquifer system (C.L. Quails, U.S. Geological Survey, oral commun., 1986).
Total withdrawal from the Potomac-Raritan-Magothy aquifer system in New Jersey has increased significantly since the early 1900's; withdrawals nearly doubled from 1956 to 1973 (Luzier, 1980, p. 2). The increased withdrawal has caused the potentiometric surface to decline over much of the aquifer system. Declines in the potentiometric surface have, in turn, resulted in the movement of poor-quality water 1 toward areas of major ground-water withdrawal. Potential sources of poor-quality water include saline water from the Delaware River estuary, water from industrially contaminated reaches of the Delaware River, water from contaminated parts of the aquifer system, and naturally occurring saline water in downdip parts of the aquifer system (Harbaugh, 1980, p. 2).
The U.S. Geological Survey (USGS), in cooperation with the New Jersey Department of Environmental Protection (NJDEP), collected, analyzed, and compiled water-quality data for the Potomac-Raritan-Magothy aquifer system in parts of Burlington, Camden, Gloucester, and Salem Counties in west central New Jersey to determine water quality in the aquifer system and to examine the effects of pumping and human activities on water quality. The study area (fig. 1) encompasses approximately 880 mi 2 . Emphasis was on water quality in the downdip part of the aquifer system, defined as the area of the aquifer system outside and southeast of the generalized outcrop area of the Potomac Group and the Raritan and Magothy Formations (fig. 1).
Purpose and Scope
This report describes the areal and vertical distribution of chemical constituents in the aquifer system in relation to past and present ground- water-flow conditions, the quality of water in the downdip part of the aquifer system, and the effects of human activities on water quality.
The report is based on water-quality data collected from 1980-86 in the study area. Data from 1985 and 1986 were collected during this study, whereas data from 1980-84 were compiled from other reports (Fusillo and Voronin, 1981; Fusillo and others, 1984).
1 In this report, poor-quality water is water that is not suitable for human consumption because of elevated concentrations of one or more chemical constituents that exceed State/Federal drinking-water regulations.

75°30' 75°00' 74°00'
Study-area boundary MERCER21-
21-12V'' MONMOUTH , -' V 25-362
PENNSYLVANIA
EXPLANATION
DELAWARE OUTCROP AREA OF THE POTOMAC GROUP, RARITAN FORMATION, AND MAGOTHY FORMATION (from Owens, 1967, sheet 2)
A' Location of section shown in figures 2 and 13
5-440. LOCATION OF WELL--Number shown is well number listed in table 2
02468 MILESI I I I
I I I I 02468 KILOMETERS
Base modified from U.S. Geological Survey digital data, 1:100,000, 1983, Universal Transverse Mercator projection, zone 18
Figure 1.--Location of the study area.

We11-Numbering System
The well-numbering system used in this report is based on the numbering system used by the USGS in New Jersey and Pennsylvania. The well number consists of the county code and the sequence number of the well within the county. New Jersey county codes are numerical two digit codes: Burlington (05), Camden (07), Gloucester (15), Mercer (21), and Salem (33). Pennsylvania county codes are two-letter codes. In this report the only Pennsylvania county code used is for Philadelphia (PH). Examples of well numbers are 15- 137 for the 137th well in Gloucester County, N.J., and PH-19 for the 19th well in Philadelphia County, Pa.
Previous Studies
The numerous studies on the ground-water resources of the Potomac- Raritan-Magothy aquifer system in New Jersey and surrounding areas include several countywide ground-water studies and regional studies that involved ground-water modeling. An overview of previous studies is presented below.
Thompson (1932) studied ground-water supplies, pumping rates, and the effect of pumping on ground-water quality of the Camden area. Graham and Kammerer (1952) studied the ground-water resources in the area of the U.S. Naval Base in Philadelphia and defined three aquifers and water-quality problems in the aquifers. Barksdale and others (1958) reported on the quality of water in the outcrop region of the aquifer system as compared to downdip water quality, especially in relation to cations and anions; these authors also discussed the occurrence and flow of highly mineralized ground water in Philadelphia and Camden Counties. Greenman and others (1961) studied the ground-water resources of the Coastal Plain in southeastern Pennsylvania and defined a gradual decline in the water quality of the aquifers in the Raritan and Magothy Formations (currently called the Potomac-Raritan-Magothy aquifer system) in Philadelphia County.
Vecchioli and Palmer (1962) studied the ground-water resources of Mercer County and reported on the water quality of the aquifer system. Rush (1968) described the water quality in Burlington County and recharge from the Delaware River to the aquifer system. Rosenau and others (1969) reported that the water quality in the Potomac-Raritan-Magothy aquifer system was highly variable in Salem County. Hardt and Hilton (1969) observed that water in the Potomac-Raritan-Magothy aquifer system in Gloucester County was suitable for public use in most of the county, owing to generally low concentrations of dissolved solids. Langmuir (1969) investigated the distribution of iron in the ground water of the Magothy and Raritan Formations in Camden and Burlington Counties. Farlekas and others (1976) reported that the water quality of the Potomac-Raritan-Magothy aquifer system in Camden County had changed over time (1923-70) as a result of human activities.
The intrusion of saline water has been a concern in and near the study area since the late 1950's, when Barksdale and others (1958) studied the potential for saltwater intrusion in the southern Coastal Plain. Other authors, including Seaber (1963), Parker and others (1964), Hardt and Hilton (1969), Rosenau and others (1969), Luzier (1980), and Schaefer (1983) have discussed this problem in relation to the Potomac-Raritan-Magothy aquifer system.

The Delaware Valley Regional Planning Commission (1979) listed 48 potential sources of ground-water contamination in the outcrop area of the aquifer system in Burlington, Camden, and Gloucester Counties; the 48 sites consisted of landfills, lagoons, and industrial storage areas. Luzier (1980) developed a single-layer, two-dimensional finite-difference digital model to simulate the response of the Potomac-Raritan-Magothy aquifer system to pumping stress. Harbaugh and others (1980) used Luzier's model of the Potomac- Raritan-Magothy aquifer system to simulate the effects of supplementing ground-water supplies with water from the Delaware River. McAuley and Kendall (1989) used data on the stable isotopes deuterium and oxygen-18 to trace induced recharge from the Delaware River into the Potomac-Raritan-Magothy aquifer system in the Camden area.
Acknowledgments
The authors are grateful for the cooperation of public officials, industry representatives, and individuals who provided information on their wells and allowed access for the collection of water samples.
HYDROGEOLOGIC SETTING
The Atlantic Coastal Plain in New Jersey is a region of mostly low relief that is characterized by broad plains and gently sloping hills and ridges. The Coastal Plain is underlain by a wedge-shaped mass of unconsolidated, stratified sediments composed of gravel, sand, silt, and clay. These sediments dip toward the Atlantic Ocean and range in thickness from nearly zero at the updip limit of the sediments at the Fall zone to 6,500 ft in Cape May County (Gill and Farlekas, 1976).
Geologic Formations of the New Jersey Coastal Plain
The formations of the Coastal Plain range in age from Cretaceous to Holocene, and lie unconformably on a basement complex composed largely of Precambrian and lower Paleozoic crystalline rocks. The geologic units of primary interest to this study are the Potomac Group, the Raritan and Magothy Formations, the Merchantville Formation, and the Woodbury Clay, all of Cretaceous age (table 1). These deposits, the oldest in the Coastal Plain, overlie the crystalline rocks of the Precambrian Wissahickon Formation and consist of sand and gravel interbedded with silt and clay units. The formations are exposed at or near the surface in a narrow band along the Delaware River in New Jersey and Pennsylvania (fig. 1). The sediments average 250 ft in thickness near the outcrop area and attain a maximum thickness in excess of 4,000 ft at Cape May (Gill and Farlekas, 1976). The formations contain a relatively high percentage of sand near the outcrop area (57 to 67 percent) in Camden County and less sand (37 percent) downdip (Farlekas and others, 1976, p. 18).
The Potomac Group is present at the base of the Coastal Plain strati- graphic section and in the Delaware River Valley from Trenton to Salem, N.J.; its geology and depostional history are similar to those of the overlying Raritan Formation (both are fluvial-continental deposits). The Potomac Group consists of alternating layers of unconsolidated sand, clay, and gravel.

Table 1.-Geologic and hydrogeologic units in the study area[Modified from Zapecza, 1989, table 2]
SYSTEM
Quaternary
£ CD
ft
Cretaceous
SERIES
Holocene
Pleistocene
Miocene
Oligocene
Eocene
Paleocene
Upper Cretaceous
Lower Cretaceous
Pre-Cretaceous
GEOLOGIC UNIT
Alluvial deposits
Beach sand and gravel
Cape May Formation
Pensauken Formation
Bridgeton Formation
Beacon Hill Gravel
Cohansey Sand
Kirkwood Formation
Piney Point Formation 1 s^
,/Shark River ./ Formation
Manasquan Formation
Vincentown Formation
Homerstown Sand
Tinton Sand
Red Bank Sand
Navesink Formation
Mount Laurel Sand
Wenonah Formation
Marshalltown Formation
Englishtown Formation
Woodbury Clay
Merchantville Formation
Magothy Formation
Raritan Formation
Potomac Group
Bedrock
LITHOLOGY
Sand, silt, and black mud
Sand, quartz, light-colored, medium- to coarse-grained, pebbly
Sand, quartz, light-colored, heterogeneous, clayey, pebbly
Gravel, quartz, light-colored, sandy
Sand, quartz, light-colored, medium- to coarse-grained, pebbly; local clay beds
Sand, quartz, gray and tan, very fine- to medium-grained, micaceous, and dark-colored diatomaceous clay
Sand, quartz and glauconite, fine- to coarse-grained
Clay, silty and sandy, glauconitic, green, gray, and brown, contains fine-grained quartz sand
Sand, quartz, gray and green, fine- to coarse-grained, glauconitic, and brown clayey, very fossiliferous, glauconite and quartz calcarenite
Sand, clayey, glauconitic, dark green, fine- to coarse-grained
Sand, quartz, and glauconite, brown and gray, fine- to coarse-grained, clayey, micaceous
Sand, clayey, silty, glauconitic, green and black, medium- to coarse-grained
Sand, quartz, brown and gray, fine- to coarse-grained, slightly glauconitic
Sand, very fine- to fine-grained, gray and brown, silty, slightly glauconitic
Clay, silty, dark greenish-gray, glauconitic quartz sand
Sand, quartz, tan and gray, fine- to medium-grained; local clay beds
Clay, gray and black, micaceous silt
Clay, glauconitic, micaceous, gray and black; locally very fine-grained quartz and glauconitic sand
Sand, quartz, light-gray, fine- to coarse-grained. Local beds of dark-gray lignitic clay. Includes Old Bridge Sand Member
Sand, quartz, light-gray, fine- to coarse-grained pebbly arkosic; contains red, white, and variegated clay. Includes Farrington Sand Member
Alternating clay, silt, sand, and gravel
Precambrian and Lower Paleozic crystalline rocks, metamorphic schist and gneiss; locally Triassic sandstone and shale and Jurassic diabase are present
HYDROGEOLOGIC UNIT
Undifferentiated
Kirkwood-Cohansey aquifer system
Confining unit
Ro Grande water-bearing zone
Confining unit
Atlantic City 800-foot sand
Composite confining unit
Piney Point aquifer
Vincentown aquifer
Red Bank Sand
Wenonah- Mount Laurel aquifer
Marshalltown-Wenonah confining unit
Englshtown aquifer system
Merch c
1- o
-Raritan-Mag jifer system
«SE co 0oQ.
antville-Woodbury onfining unit
Upper aquifer
Confining unit
Middle aquifer
Confining unit
Lower aquifer
Bedrock confining unit
HYDROLOGIC CHARACTERISTICS
Surficial material, commonly hydraulically connected to underlying aquifers. Locally some units may act as confining units. Thicker sands are capable of yielding large quantities of water
A major aquifer system. Ground water occurs generally under water-table conditions. In Cape May County the Cohansey Sand is under artesian conditions
Thick diatomaceous clay bed occurs along coast and for a short distance inland. A thin water-bearing sand is present in the middle of this unit
A major aquifer along the coast
Poorly permeable sediments
Yields moderate quantities of water
Poorly permeable sediments
Yields small to moderate quantities of water in and near its outcrop area
Poorly permeable sediments
Yields small quantities of water in and near its outcrop area
Poorly permeable sediments
A major aquifer
A leaky confining unit
A major aquifer. Two sand units in Monmouth and Ocean Counties
A major confining unit. Locally the Mechantville Formation may contain a thin water-bearing sand
A major aquifer system. In the northern Coastal Plain, the upper aquifer is equivalent to the Old Bridge aquifer and the middle aquifer is equivalent to the Farrington aquifer. In the Delaware River Valley, three aquifers are recognized. In the deeper sub surface, units below the upper aquifer are Undifferentiated
No wells obtain water from these consolidated rocks, except along Fall Line
of Olsson and others, 1980

The Raritan Formation overlies the Potomac Group and is typically composed of light-colored, medium- to coarse-grained quartzose sand that contains some gravel and clay (Barksdale and others, 1958). The Woodbridge Clay is the predominant clay in this formation. In the outcrop area, adjacent to the Delaware River, the sediments of the Raritan Formation are highly variable vertically and horizontally.
The Magothy Formation, which lies unconformably on the Raritan Formation, typically consists of marine and nearshore deposits of dark-gray or black clay that contains alternating beds of white micaceous fine-grained sand (Barksdale and others, 1958).
The Merchantville Formation lies unconformably on the Magothy Formation and is conformably overlain by the Woodbury Clay. The Merchantville Formation is typically a green to black glauconitic micaceous clay that contains beds and lenses of quartzose or glauconitic sandy clay. The Woodbury Clay is composed of dark-gray to black clay. The unit is distinguished from the Merchantville Formation by a greater concentration of clay and a much lower concentration of glauconitic sand. Fossil evidence indicates that both formations are of marine origin (Owens and Sohl, 1969). The combined thickness of the Merchantville Formation and the Woodbury Clay is approximately 100 ft in the outcrop and more than 300 ft near the Atlantic Coast (Luzier, 1980).
Potomac-Raritan-Magothy Aquifer System
Many of the geologic formations in the Coastal Plain contain aquifers capable of yielding moderate to large quantities of water; however, the Potomac-Raritan-Magothy aquifer system is the largest and most productive of these. The aquifers contained in the Potomac Group and the Raritan and Magothy Formations generally are confined; however, the aquifers can be unconfined in parts of the outcrop area. The aquifers and the confining units might not correspond exactly to the geologic formations of similar names. At the Ocean and Atlantic County coastlines, a minimum of 2,000 ft of sediment separates the bottom of the Atlantic Ocean from the top of the Potomac- Raritan-Magothy aquifer system (Martin, 1990).
The Potomac-Raritan-Magothy aquifer system in the study area (fig. 1) has been subdivided into a major confining layer--the Merchantville-Woodbury confining unit--and three aquifer units, termed upper, middle, and lower aquifers (Zapecza, 1989; E.O. Regan, U.S. Geological Survey, written commun., 1986). A generalized hydrologic section through the aquifer system is shown in figure 2.
The Merchantville-Woodbury confining unit is poorly permeable and forms an extensive confining layer throughout the Coastal Plain. Significant volumes of water can be transmitted through the confining unit, however, if large differences in potentiometric head exist between overlying and underlying aquifers. This unit separates the Potomac-Raritan-Magothy aquifer system from the overlying Englishtown aquifer system. Where the Englishtown aquifer system is absent, the Merchantville-Woodbury confining unit separates the Wenonah-Mount Laurel aquifer from the Potomac-Raritan-Magothy aquifer system.

FE
ET
P
hila
del
ph
ia
100^
Sea
_le
vel
100 -
200-
300
400
50
0
60
0-
700
800
/De
law
are
R
iver
/Pa
Cam
den
W
ell
7-7
8
Ha
dd
on
field
Ch
erry
Hill
We
ll7-3
03
Co
op
er
Riv
er
Well
7-1
30
EX
PL
AN
AT
ION
7-7
8
We
ll an
d gam
ma-r
ay
log
on w
hic
h s
ect
ion i
s b
ase
d
Gam
ma-r
ay
log
ra
dia
tio
n
incre
ases
*~
12
MIL
ES
0
1 2
KIL
OM
ET
ER
S
VE
RT
ICA
L S
CA
LE G
RE
ATL
Y E
XA
GG
ER
ATE
D
Se
a
leve
l
PO
TO
MA
C-
RA
RIT
AN
-
MA
GO
TH
Y
AQ
UIF
ER
S
YS
TE
M
Figu
re 2
.--G
ener
aliz
ed
hydr
pgeo
logi
c se
ctio
n A
-A'
thro
ugh
the
stud
y ar
ea.
(Loc
atio
n of
sec
tion
show
n in
fig
. 1.
)

The upper aquifer is the most extensive of the three aquifers, and most nearly corresponds to the Magothy Formation. It crops out in a narrow band east of the Delaware River from Trenton to Penns Grove, N.J. In this area it is unconfined and is recharged directly by precipitation and by vertical leakage from discontinuous overlying post-Cretaceous sands and gravels. The upper aquifer is composed of coarse-grained sediments and thin, localized, clay beds. East of the outcrop, the upper aquifer is confined beneath the Merchantville-Woodbury confining unit. The thickness of the upper aquifer ranges from 100 ft near the outcrop in Salem County to 350 ft in the northeastern Coastal Plain (Zapecza, 1989).
The confining unit between the upper and middle aquifers ranges in thickness from 20 ft in Camden and Gloucester Counties to 50 ft in Burlington County. The general thickness of the confining unit is 50 ft in the outcrop area; in the southeastern part of the study area, the thickness ranges from 150 to 200 ft (Zapecza, 1989).
The middle aquifer crops out in a narrow band adjacent to and beneath the Delaware River. This aquifer is unconfined in Burlington County and in Pennsylvania; elsewhere in New Jersey, it is confined. The percentage of sand and the thickness of the middle aquifer are variable. The unit also contains silt and clay layers (Zapecza, 1989). The middle aquifer ranges in thickness from a few feet to 230 ft and the sand content ranges from 60 to 100 percent.
The confining unit between the middle and the lower aquifers consists of very fine-grained silts and clays; it is generally less than 50 ft thick over half of its mappable extent (Zapecza, 1989). Near the river, the silts and clays of this unit are less than 50 ft thick (H.E. Gill and G.M. Farlekas, U.S. Geological Survey, written commun., 1970). The confining unit thickens downdip in a nonuniform manner, as a result of lensing, to a total thickness of greater than 100 ft (Zapecza, 1989). The limited extent of this confining unit and the similarity in heads in the middle and lower aquifers (Walker, 1983) indicate the presence of a hydraulic connection between the two aquifers.
The lower aquifer contains sediments of the Raritan Formation and the Potomac Group. In Salem County, the lower aquifer appears to be equivalent to the lower hydrologic zone of the Potomac Group (Zapecza, 1989). This aquifer is the most limited in extent of the three aquifers, and it is not known to crop out in New Jersey. E.G. Regan (U.S. Geological Survey, written commun., 1986) confirmed that the lower aquifer is present beneath the Delaware River and provides a connection between the Potomac-Raritan-Magothy aquifer system in Pennsylvania and New Jersey. In the northern part of the study area, near Mount Holly, N.J., the lower aquifer thins and pinches out against the crystalline basement rock. The updip extent of the lower aquifer is shown on plates 1C-7C. The percentage of sand ranges from 37 to 100, and the average sand content exceeds 70 percent. The lower aquifer attains a maximum thickness of 250 ft in Camden and Gloucester Counties (Zapecza, 1989).

Aquifer Characteristics
The Potomac-Raritan-Magothy aquifer system yielded more than 80 x 10 9 gallons throughout the Coastal Plain in 1983 (C.L. Quails, U.S. Geological Survey, oral commun., 1986). The average yield of 106 large-diameter wells (diameter 12 inches or greater) in Camden County is 1,085 gal/min, and the average specific capacity is 29.3 (gal/min)/ft (Farlekas and others, 1976, p. 38). The results of aquifer tests in Burlington, Camden, and Gloucester Counties indicate that the transmissivity of individual aquifers ranges from 2,300 to 31,000 ft 2 /d (Hantush, 1960). The storage coefficient ranges from 3.3 x 10" s to 4.0 x 10" 3 (Gill and Farlekas, 1976).
Predevelopment Ground-Water Flow
Regional ground-water flow before development was controlled by recharge to two areas of the outcrop at high altitudes in Mercer and Middlesex Counties (figs. 3 and 4) (Barksdale and others, 1958) and by areally distributed leakage from the Englishtown Formation through the Merchantville-Woodbury confining unit (H.E. Gill and G.M. Farlekas, U.S. Geological Survey, written commun., 1969). Maps of the simulated predevelopment potentiometric surfaces are shown in figures 3 to 5 for the upper, middle, and lower aquifers, respectively. These maps are based on results from the Regional Aquifer System Analysis (RASA) model (Martin, 1990). Water-level altitudes exceeded 70 ft above sea level in the middle and upper units in the recharge areas. In the outcrop area, local flow patterns were complex because of variations in topography and geology. Much of the precipitation entering the unconfined aquifer in low-lying areas was discharged into streams crossing the outcrop area.
The simulated predevelopment flow patterns in the Potomac-Raritan-Magothy aquifer system are supported by carbon-14 dating (Winograd and Farlekas, 1974). The distribution of carbon-14 concentrations within the aquifer system approximated the prepumping potentiometric contours shown in figures 3 to 5.
Before development, leakage through the Merchantville-Woodbury confining unit was the major source of recharge to the aquifer system between Trenton, N.J., and Wilmington, Del. (H.E. Gill and G.M. Farlekas, U.S. Geological Survey, written commun., 1969). Simulated heads in the overlying Englishtown and Wenonah-Mount Laurel aquifers are greater than 80 and 100 ft above sea level, respectively, near Lindenwold, Camden County (Martin, 1990). Downward vertical flow through the Merchantville-Woodbury clay would be possible as a result of the potentiometric-head differences of 60 and 80 ft between the Englishtown aquifer system and Wenonah-Mount Laurel aquifer, respectively, and the Potomac-Raritan-Magothy aquifer system. Under predevelopment conditions, potentiometric heads in the three aquifers of the Potomac-Raritan-Magothy aquifer system were within 10 feet of each other (Martin, 1990); therefore, under the prepumping scenerio, the aquifers can be considered as a single hydrologic unit.
In predevelopment flow-budget simulations for the upper aquifer (Martin 1990), discharge to the Delaware River is exceeded only slightly by downward flow to the middle aquifer. Similar simulations demonstrate that discharge to the Delaware River exceeds all other outflow from the middle and lower aquifers.
10

APPROXIMATE SEAWARD LIMIT
OF FRESHWATER
IN TH
E
UPPER POTONAC-RARITAN-MAGOTIIY AQUIFER AS
DELINEATED
8Y CHLORIDE CONCENTRATIONS
OF 10,000 MILLIGRAMS PER UTER
10
15
Ml
LES
30
-s
-40-
i i
r0
5 10
15
K
I LO
ME
TE
RS
OU
TC
RO
P A
RE
A O
F T
HE
MA
GO
TH
Y F
OR
MA
TIO
N
SIM
ULA
TE
D P
OT
EN
TIO
ME
TR
IC C
ON
TO
UR
--S
how
s al
titud
e of
sim
ulat
ed p
repu
mpi
ng p
ote
ntio
metr
ic s
urfa
ce.
Con
tour
rnt
erva
l 10
fee
t. D
atum
is
sea
leve
l
INT
ER
PR
ET
ED
PO
TE
NT
IOM
ET
RIC
CO
NT
OU
R--
Sho
ws
altit
ude
of in
terp
rete
d pr
epum
ping
pot
entio
met
ric s
urfa
ce.
Con
tour
int
erva
l 20
fee
t. D
atum
is
sea
leve
l
Inte
rpre
ted
prep
umpi
ng p
oten
tiom
etric
con
tour
s fr
om Z
apec
za a
nd
othe
rs (
1987
, fig
. 4)
.Lo
catio
n of
10,
000-
mill
igra
ms-
per-
liter
chl
orid
e-co
ncen
trat
ion
line
base
d on
Mei
sler
(19
80,
fig.
4).
Figu
re 3
.--S
imul
ated
an
d in
terp
rete
d pr
edev
elop
men
t po
tent
iom
etric
sur
face
s th
e up
per
aqui
ferjn
P
otom
ace-
Rar
itan-
Mag
othy
aqu
ifer
syst
em,
1983
. (M
odifi
ed f
rom
M
artin
, 19
90,
fig.
32)

DE
LA
WA
RE
EX
PLA
NA
TIO
NO
UT
CR
OP
AR
EA
OF
TH
E P
OT
OM
AC
GR
OU
P A
ND
RA
RIT
AN
F
OR
MA
TIO
N
SIM
ULA
TE
D P
OT
EN
TIO
ME
TR
IC C
ON
TO
UR
-Sh
ow
s al
titud
e of
sim
ulat
ed p
repu
mpi
ng p
ote
ntio
me
tric
sur
face
. C
onto
ur
inte
rval
10
fee
t. D
atum
is
sea
leve
l
Loca
tion
of 1
0,00
0-m
illig
ram
s-pe
r-lit
er c
hlor
ide-
conc
entr
atio
n lin
e ba
sed
on M
eisl
er (
1980
, fig
. 4)
.
5 10
15
K
I LO
UE
TE
RS
Figu
re 4
.--S
imul
ated
pre
deve
lopm
ent
pote
ntio
met
ric s
urfa
ce i
n th
e m
iddl
e aq
uife
r, P
otom
ac-R
arita
n-M
agot
hy a
quife
r sy
stem
, 19
83.
(Mod
ified
fro
m M
artin
, 19
90,
fig.
31)

DE
LA
WA
RE
EX
PLA
NA
TIO
NS
IMU
LATE
D P
OT
EN
TIO
ME
TR
IC C
ON
TO
UR
-Sho
ws
altit
ude
of s
imul
ated
pre
pum
ping
pot
entio
met
ric s
urfa
ce.
Con
tour
inte
rval
10
feet
. D
atum
is s
ea le
vel
Loca
tion
of 1
0,00
0-m
illig
ram
s-pe
r-lit
er c
hlor
ide-
conc
entr
atio
n lin
e ba
sed
on M
eisl
er (
1980
, fig
. 4)
.0
5 10
15
K
ILO
ME
TE
RS
Figu
re 5
.--S
imul
ated
pr
edev
elop
men
t po
tent
iom
etric
sur
face
in
the
lo
wer
aqu
ifer,
Pot
omac
-Rar
itan-
Mag
othy
aqu
ifer
syst
em,
1983
. (M
odifi
ed f
rom
M
artin
, 19
90,
fig.
30)

Present-Day Ground-Water Flow
Ground-water withdrawals have significantly changed the distribution of potentiometrie heads in the aquifer system. Average yearly withdrawals from the upper, middle and lower aquifers from 1920-80 in Burlington, Camden, and Gloucester Counties are shown in figure 6. These ground-water withdrawals have reversed the flow patterns in much of the aquifer system, especially in and near the outcrop area.
The potentiometric surfaces in the upper, middle, and lower aquifers in 1983 are shown in figures 7 to 9. In the upper and middle aquifers, the potentiometric surface in the recharge area in Mercer and Middlesex Counties is above sea level and has changed little since 1900 (figs. 3 to 5). A regional cone of depression--the result of ground-water withdrawals for public supply, industry, and irrigation--is present in all three aquifers of the Potomac-Raritan-Magothy aquifer system in central Camden and southwestern Burlington Counties. This cone is located where overlying aquifers, such as the Englishtown aquifer system, appear to be leaking. The associated potentiometric heads at this location in the aquifer system are more than 80 ft below sea level. The decline in potentiometric heads in this area represents a change of 90 to 100 ft from simulated predevelopment conditions (figs. 3 to 5).
Another major cone of depression is in the middle aquifer in southwestern Salem County, where water levels have declined to 70 ft below sea level near Artificial Island. Several smaller cones of depression (figs. 7 to 9) indicate locally large withdrawals from the aquifer system.
Changes in the distribution of potentiometric heads have resulted in a reversal of the predevelopment ground-water-flow directions adjacent to the Delaware River. The 1983 potentiometric surfaces and data from other sources (Greenman and others, 1961; Barksdale and others, 1958) indicate that flow patterns have changed and that ground water presently is flowing southeast from the river into the aquifer system, especially in areas of extensive pumping. Changes in flow directions in the upper, middle, and lower aquifers also are evident from simulations of 1978 ground-water-flow conditions (Martin, 1990). Results of these simulations demonstrate that the aquifer system receives recharge from the Delaware River and verify that pumping is responsible for most of the outflow from the aquifer system.
Results of simulations by Vowinkel and Foster (1981) indicate that the area of greatest inflow from the Delaware River during 1973-78 was the area adjacent to Camden, where recharge to the aquifer system was approximately 39 ft 3/s in 1973 and 42 ft3 /s in 1978. In addition, inflow along the river in the northeastern part of Gloucester County was approximately 34 ft3 /s in 1973 and in 1978.
Reversal of flow directions--especially near the Potomac-Raritan-Magothy aquifer system outcrop area--affects the quality of water in the aquifer system. Contaminated water could be drawn into these aquifers from parts of the outcrop area on the New Jersey and Philadelphia sides of the river. The inflow of water from the Delaware River to the aquifer system could dilute contaminated water being drawn in from the outcrop area.
14

WITHDRAWALS, IN MILLION GALLONS PER DAY
_» _i IV)en o in o
(Q
§
s0) ^
al gi. §1
0)QWO :*
li(D
eg o o ^ 330)
(Q
Q) .Q
WITHDRAWALS, IN MILLION GALLONS PER DAY\
\
\
WITHDRAWALS. IN MILLION GALLONS PER DAY
o o r- > O 2£ o O m3 zm 3D
SD D
m| -Tlm3D

75°30' 75°00' 74°00'
PENNSYLVANIA
NEW JEftSEY
LOUGESTER '*, /
\\ V
EXPLANATION
DELAWARE OUTCROP AREA OF THE POTOMAC GROUP, RARITAN FORMATION, AND MAGOTHY FORMATION (from Owens, 1967, sheet 2)
40 POTENTIOMETRIC CONTOUR-Shows altitude at which water would have stood in tightly cased wells. Dashed where approximate. Interval 10 feet. Datum is sea level
02468 MILESI LI I
i i l i 02468 KILOMETERS
Base modified from U.S. Geological Survey digital data, 1:100,000, 1983, Universal Transverse Mercator projection, zone 18
Figure 7.--Potentiometric surface in the upper aquifer, Potomac-Raritan-Magothy aquifer system, 1983. (Modified from Eckel and Walker, 1986, pi. 3.)
16

75°30' 75°00' 74<W
EXPLANATION
OUTCROP AREA OF THE POTOMAC GROUP, RARITAN FORMATION, AND MAGOTHY FORMATION (from Owens, 1967, sheet 2)
POTENTIOMETRIC CONTOUR-Shows altitude at which water would have stood in tightly cased wells. Dashed where approximate. Interval 10 feet. Datum is sea level
02468 MILESI I I I
II II 02468 KILOMETERS
Base modified from U.S. Geological Survey digital data, 1:100,000, 1983, Universal Transverse Mercator projection, zone 18
Figure 8.--Potentiometric surface in the middle aquifer, Potomac-Raritan-Magothy aquifer system, 1983. (Modified from Eckel and Walker, 1986, pi. 4.)
17

75°30' 75°00' 30' 74°00'
40° 30'
40° Off
30'
39° 00'
PENNSYLVANIA
EXPLANATION
OUTCROP AREA OF THE POTOMAC GROUP, 1 RARITAN FORMATION, AND MAGOTHY * FORMATION (from Owens, 1967, sheet 2)
40 POTENTIOMETRIC CONTOUR-Shows altitude at which water would have stood in tightly cased wells. Dashed where approximate. Interval 10 feet. Datum is sea level
02466 MILESI I I I II II II02468 KILOMETERS
Base modified from U.S. Geological Survey digital data, 1:100,000, 1983, Universal Transverse Mercator projection, zone 18
Figure 9.~Potentiometric surface in the lower aquifer, Potomac-Raritan-Magothy aquifer system, 1983. (Modified from Eckel and Walker, 1986, pi. 5.)
18

The Potomac-Raritan-Magothy aquifer system can be divided into two regimes of flow--the active-flow area and an area of little flow in the downdip area. The active-flow area is that part of the aquifer system in which formation water has been flushed by fresh regional recharge in the predevelopment flow system. Flow paths downdip are long relative to the flow paths updip and little flushing of the formation water has occurred. Water in this downdip zone of little flow has been in the aquifers for a longer time than water in the recharge areas and contains higher concentrations of dissolved solids than does water in the active-flow area.
WATER QUALITY
Water-quality data for the Potomac-Raritan-Magothy aquifer system used in this report were collected during three sampling periods: June through December 1980, July through December 1982, and July 1985 through January 1986. A total of 356 wells was sampled; because some wells were sampled several times, a total of 503 water samples were collected. The wells sampled are in the outcrop area of the Potomac-Raritan-Magothy aquifer system from Trenton to Pennsville, as well as downdip in the confined part of the aquifer system.
The water samples collected during 1980-86 were analyzed for major and common inorganic ions, dissolved metals, nutrients, dissolved organic carbon (DOC), and purgeable organic compounds (POC's) at the USGS Central Laboratory in Arvada, Colo. Water samples were scanned for POC's by use of a gas chromatograph according to methods 601 and 602 of the U.S. Environmental Protection Agency (USEPA) (U.S. Environmental Protection Agency, 1982) at the USGS laboratory in Trenton, N.J. Water samples in which one or more compounds were detected were sent to the USGS Central Laboratory for additional analysis of POC's by means of gas chromatography/mass spectrometry.
The ground-water-quality data collected during 1980-82, as well as historic data for the study area, are reported in Fusillo and Voronin (1981) and Fusillo and others (1984). The latter report also summarizes chloride- concentration and specific-conductance data for wells sampled more than once. Surface-water-quality data are published in Hochreiter (1982).
Records of wells sampled in 1985 and 1986 for this study are listed in table 2 (at end of report). Some wells were previously assigned to different aquifers; changes in aquifer codes from those previously published by Fusillo and others (1984), based on later hydrostratigraphic studies of the Potomac- Raritan-Magothy aquifer system (E.O. Regan, U.S. Geological Survey, written commun., 1986; Zapecza, 1989), are listed in table 3 (at end of report). A statistical summary of water-quality data collected from 1985-86 is presented in table 4. Water-quality data for the sampling period 1985-86 (common constituents, trace elements, nutrients, and POC's) are listed in tables 5-8 (at end of report). The locations of wells at which samples were collected from the upper, middle, and lower aquifers are shown in figures 10-12. Water- quality data are stored in the USGS National Water-Data Storage and Retrieval System (WATSTORE).
19

40° 15'
40° 00'
39°45'
75°30' 15'
EXPLANATION
OUTCROP AREA OF THE POTOMAC GROUP, RARITAN FORMATION, AND MAGOTHY FORMATION (from Owens, 1967, sheet 2)
15-617- LOCATION OF WELL-Number shown is well numberlisted in table 2
75°00' 74°45'
BUCKS:.5-731
.-/ > :,-,a5-39. .
10 MILES PHILADELPHIA:
.5-768
'.5-77 .5-446
.5-778 * 5-745
.5-212
-5-441
10 KILOMETERS Xif:";--.,;.
: 7-555:/ .V.-.'.*7-575
5-317«
.5-729 5;310
5-229
.5-289
BURLINGTON.5-201
.7-160- .,5-301
DELAWARE» «.,
. 55-415 7-2O.17-143
*7-14B\
7-13*3 7-193 .7.279' 7' 13 7-316 7-426
7-410*
.5-707
.5-258
.5-252
.5-251
5-165 5-167NEW JERSEY
< .'15-564 ?15-540'
133-345"','.'*'
' ' '33-361
.15-332
;X'' 15-284 15-281 X '
15*348. 15-2*76.15-16'* ' J 5-275 15-9 . .7'252 7. 18 15-194. *15-274 V 7-249 ."J9° 15-192 "15-193 / -.
101" "15-8 ic'ofvr 191 "15-189 15-267 "
15-342 "i5-236"15"392 "15-131 15-261
15-129 15-130
l5-345'.«15-366 15-363
CAMDEN
15-337
- 15-334
15-231, V ' 33-126
<< / 33-117 SALEM
15-63 15-60*
15-361
GLOUCESTER*15-3
"15-1 |
.7-477
ATLANTIC
Base modified from U.S. Geological Survey digital data, 1:100,000, 1983, Universal Transverse Mercator projection, Zone 18
Figure 10.--Location of wells for which water-quality data are available, upper aquifer, Potomac-Raritan-Magothy aquifer system.
20

75°30' 75°00' 74°45'
EXPLANATION
OUTCROP AREA OF THE POTOMAC GROUP, RARITAN FORMATION, AND MAGOTHY FORMATION (from Owens, 1967, sheet 2)
15-24. LOCATION OF WELL-Number shown is well numberlisted in table 2
10 KILOMETERS, , '5-661
-804 -5-777/5-653 \ :-- ''
5-144 v>vf 5-647 5-637
PHTT ADFT PHT \ ' r 1 1 1 L, /\ u c. L, r 1 1 1 A
*5-290
BURLINGTON
,5-261
NEW JERSEY
Base modified from U.S. Geological Survey digital data, 1:100,000, 1983, Universal Transverse Mercator projection. Zone 18
Figure 11.-Location of wells for which water-quality data are available, middle aquifer, Potomac-Raritan-Magothy aquifer system.
21

75°30' 75°00' 74°45'
Base modified from U.S. Geological Survey digital data, 1:100,000, 1983, Universal Transverse Mercator projection, Zone 18
Figure 12.--Location of wells for which water-quality data are available, lower aquifer, Potomac-Raritan-Magothy aquifer system.
22

Table 4.-- Statistical summary of analyses of water from the Potomac-Raritan-Magothv aquifer system. 1985-86
[°C, degrees Celsius; /xS/cm, microsiemens per centimeter at 25 degrees Celsius; /x9/L, micrograms per liter; *, residue on evaporation at 180 degrees Celsius; **, sum of constituents; <, less than; concentrations in milligrams per liter of dissolved constituent except as noted]
Dissolved Number constituent or of characteristic samples
Temperature (°C) Specific conductance, field (/xS/cm)Specific conductance, lab (/xS/cm)pH, field (units)pH, lab (units)
Alkalinity, field (as CaCOa)Alkalinity, lab (as CaCOs)Dissolved oxygenHardness (CaCOs)Hardness, noncarbonate (as CaCOs)
SodiumPotassiumCalciumMagnesiumSilica
ChlorideSulfateFluorideIron, total (/xg/OIron, dissolved (/xg/L)
Manganese, total (/xg/L)Manganese, dissolved (/xg/L)Dissolved organic carbonPhenol (/xg/L)Dissolved solids *
Dissolved solids **Aluminum (/xg/L)Arsenic (/xg/L)Barium (/xg/L)Beryllium (/x9/L)
Cadmium (/xg/L)Chromium (/xg/L)Chromium, hexavalent (/xg/L)Cobalt (/xg/L)Copper (M9/L)
Lead (/xg/L)Lithium (/xg/L)Molybdenum (/xg/L)Strontium (/x9/L)Vanadium (/xg/L)
Zinc (/xg/L)Nitrate and nitrite nitrogen (as N)Nitrite nitrogen as NNitrogen,dissolved as NAmmonia nitrogen (as N)
Ammonia and organic nitrogen (as N)Ammonia nitrogen (as NH4)Orthophosphate phosphorus (as P)
117 107116117116
11111611311667
116116116116116
116116116112115
111115104108115
113116115116116
116116116116116
116116115116116
11611611644116
115109114
Minimum
13.00 84.0058.004.203.90
0<1.00011.000
2.501.302.80.44
1.50
1.30<.20< 10
<10.00<3.00
<10.00<1.00
.40<1.0055.00
32.00<10.00<1.0016.00<.50
<1.00<10.00<1.00<3.00
<10.00
<10.00<4.00
<10.0036.00<6.00
<3.00<. 10<.01.30
<.01
< 10!oi
<.01
25th Percent! le
14.50 178.00184.256.005.82
37.0017.00
.2031.001.00
7.223.107.402.707.92
6.429.70< 10
110.0030.00
20.0022.00<1.00<1.00113.00
110.00<10.00<1.0040.00<.50
<1.00<10.00<1.00<3.00
<10.00
<10.00<4.00
<10.00130.00<6.00
5.00<. 10< 011.57.08
.30
.13<.01
Median
15.50 252.00259.006.706.60
82.0068.50
.362.0024.00
16.505.1516.004.608.75
16.5023.00
.20445.00300.00
70.0057.001.503.00
148.00
150.0020.00<1.0064.00<.50
<1.00<10.00<1.00<3.00
<10.00
<10.007.00
<10.00330.00<6.00
13.50
< 013.75.21
.40
.28
.02
75th Percent! le
16.50 520.00508.25
7.657.40
137.00124.00
.5591.5044.00
48.756.6025.009.1710.00
41.7542.00
.47250.00100.00
480.00430.00
2.625.00
274.00
295.0030.00<1.0088.25
.80
<1.00<10.00<1.006.00
<10.00
<10.0011.00
<10.00725.00<6.00
33.25.96
6i20.61
1.00.88.07
Maximum
22.00 1,210.001,080.00
9.309.00
456.00438.00
8.70448.00240.00
230.0032.0096.0065.0024.00
170.00210.00
2.1054,000.0058,000.00
7,500.007,400.00
15.0068.00634.00
3,600.00750.0049.00510.00
4.00
6.00960.00980.00130.00110.00
30.0047.00<10.00
4,200.008.00
240.0023.001.20
43.0025.00
28.0032.00
.33
23

Water-quality data presented in this report were subject to standard laboratory quality-assurance procedures (Friedman and Erdmann, 1982; D.B. Peart, U.S. Geological Survey, written commun., 1985). Data collected before 1985 were subjected to similar quality-assurance techniques, as described in Fusillo and others (1984). All data were examined by means of quality- assurance checks, as described in Friedman and Erdmann (1982), Hem (1985), and Fishman and Friedman (1989).
Ten replicate samples were collected as part of the quality-assurance program. The data for these samples are presented along with the other water- quality data in tables 5 to 8. In addition, three USGS Standard Reference Water Samples (SRWS) were sent to the Central Laboratory as water-quality samples from this project. These SRWS consisted of two trace-elements standards and one standard for major constituents. On the basis of results of duplicate samples and SRWS, the analyses of water-quality samples collected during 1985-86 were considered acceptable.
Regional Variations
The chemical quality of the water in the Potomac-Raritan-Magothy aquifer system is affected by the chemical composition of precipitation, the mineral composition of the aquifers and confining units, the past and present ground- water-flow patterns, the residence time in the aquifer, and human activities.
The earliest recorded chemical analysis of water from the Potomac- Raritan-Magothy aquifer system was done in 1899 on water from the "Camden Supply" (Myers, 1899, p. 148), presumably from the Morris well field of the Camden City Water Department. This analysis showed that the water contained 32 mg/L of total solids, 5.7 mg/L of chloride, and 0.02 mg/L of nitrate nitrogen. Thompson (1932) reported results of a chemical analysis of water from the Morris well field in 1924, in which concentrations of 77 mg/L of total dissolved solids, 7.0 mg/L of chloride, and 2.7 mg/L of nitrate nitrogen were determined. The increase in concentrations of all three constituents in the water from the Morris well field probably resulted from induced infiltration of water from the adjacent Delaware River. Few additional data are available on the predevelopment water quality of the aquifer system; however, the current (1988) water quality in the confined, pumped parts of the aquifer system is assumed to be similar to predevelopment water quality in many areas because (1) the sources of water for the wells tapping the confined part of the aquifer generally are either the deep part of the system or the regional recharge areas, (2) newly recharged water from the Delaware River generally is intercepted by well fields before it can migrate downdip, and (or) (3) newly recharged water from the Delaware River has not had time to reach downdip wells.
Differences in the major-ion chemistry between young ground water near predevelopment recharge areas in Mercer and Middlesex Counties and old water farther from these predevelopment recharge areas are illustrated by ground- water data for wells along section B'-B (fig. 1) . The relative ages of the water from these wells were calculated by carbon-14 dating techniques (Winograd and Farlekas, 1974). Natural conditions were approximated by selection of wells minimally affected by present-day pumping.
24

Stiff diagrams (Hem, 1985) of the ionic composition of water from these wells illustrate changes in water chemistry along section B'-B (fig. 13). The most recent data are diagrammed for each well. Concentrations of dissolved solids generally increase with time as water flows through the system. Water near the regional recharge areas in Mercer and Middlesex Counties is a sodium- calcium- sulf ate water that contains low concentrations of dissolved solids, as represented by water from well 21-25 (fig. 13). As the water flows through the aquifer, the dissolved-solids concentration increases. In addition, calcium carbonate dissolves from shells and calcareous deposits (such as clay marls), and the water becomes a calcium bicarbonate type, as represented by water from well 5-384 (fig. 13). Regional trends discussed by Winograd and Farlekas (1974) indicate that pH also increases with the relative age of the water as a result of the dissolution of calcium carbonate in the aquifer.
The subcrop of the Potomac-Raritan-Magothy aquifer system south of Trenton, N.J., acted as a regional discharge area under prepumping conditions. With development in the upper and middle aquifers, shallow, local ground- water-flow systems were superimposed on the regional system. These local systems have a greater effect on water quality in the subcrop area than in the confined-aquifer areas. Water samples from wells in this area contained low concentrations of dissolved solids (<150 mg/L) as a result of local recharge and short residence times in the aquifer, compared to the long residence times that are characteristic of a regional flow path.
Hydrochemical Facies
Hydrochemical facies provide an indication of the chemical character of surface water and ground water (Back, 1966, p. All); they commonly are used to characterize regional ground-water quality, especially in relation to ground- water-flow patterns. Cation facies are defined as the percentage of calcium and magnesium compared to the sum of the major cations. Anion facies are defined as the percentage of chloride and sulfate compared to the sum of the major anions (Back, 1966, p. A15). Hydrochemical facies are expressed in milliequivalents per liter. Facies are affected by the ground-water-flow system, residence time of water in the aquifer, and chemical interactions between water and aquifer material. In addition, facies can be affected by the introduction of contaminants into the ground-water system and by microbial processes.
Hydrochemical facies for the upper, middle, and lower aquifers of the Potomac-Raritan-Magothy aquifer system are shown in figures 14-19. Data for hydrochemical-facies maps are from the 1980-86 sampling period and represent the most recent data from wells sampled more than once during that period. Hydrochemical-facies maps were contoured according to the definition of hydrochemical facies given in Back (1966, p. A15). Hydrochemical facies were subdivided further to include 25-percent and 75-percent cation or anion contours. Stiff diagrams were constructed from the same data set for selected wells within each facies designation.
Five zones of fairly distinct ground-water chemistry related to hydrologic regimes are defined by the hydrochemical facies in the study area. These correspond to (1) zones of recharge, (2) zones of active ground-water flow, (3) zones of discharge, (4) zones of saltwater intrusion, and (5) a zone of little flow. A transition zone is present in some areas between the zone of active ground-water flow and the zone of little flow.
25

2.0 1.0 0 1.0
MILLIEQUIVALENTS PER LITER
EXPLANATION
STIFF DIAGRAM-Shows distribution of major-ion concentrations, in milliequivalents per liter. Number beside diagram is well number and local identifier name
Figure 13.--Chemical evolution of ground water along section B'-B, (Location of section shown in fig. 1.)
26

Back (1966, p. A15) characterized the predevelopment recharge zones in Mercer and Middlesex Counties as dominated by a cation facies of calcium and magnesium (>90 percent Ca + Mg) and by an anion facies of chloride and sulfate (>90 percent Cl + S0 4 ). In this study, it was found that anion facies for recharge areas also can range from 50 to 90 percent Cl and S0 4 . Although most of the regional recharge areas are outside the study area, some evidence of recharge water from Mercer and Middlesex Counties exists, as illustrated in the cation-facies maps in figures 14-16. Water from wells near Georgetown, Burlington County, in the upper aquifer (fig. 14)--where cation facies are greater than 90 percent--could indicate the recharge zone. In the middle aquifer, calcium and magnesium also dominate in the same area, although they do not exceed 90 percent (fig. 15).
The zone of active ground-water flow underlies a large area that includes most of northwestern Burlington County and the northwestern half of Camden County. In the zone of active ground-water flow, cation facies are characterized mainly by the calcium and sodium facies (50-90 percent Ca + Mg) in all three aquifers. Anions are characterized by a bicarbonate, chloride, and sulfate facies (10-50 percent Cl + S0 4 ). This zone becomes slightly smaller in area from the upper to the lower aquifer.
Ground water in regional discharge zones has been characterized by Back (1966, p. A15) as consisting mainly of the bicarbonate facies (<10 percent Cl + S0 4 ). Before flow patterns were disturbed by development, the regional discharge area was along the Delaware River. Post-development ground-water- quality data, however, provide little evidence of hydrochemical facies typical of discharge zones in these areas. The lack of discharge-zone facies is mainly a result of induced recharge from the Delaware River into the aquifers. The areas thought to be former discharge zones currently (1988) are characterized by anion facies typical of a recharge area: chloride, sulfate, and bicarbonate (50-90 percent Cl + S0 4 ), and chloride and sulfate, (>90 percent Cl + SO), and cation facies typical of active ground-water flow, calcium and sodium, (50-90 percent Ca + Mg). Back (1966, p. A5) notes that bicarbonate might increase as a result of dissolution of calcareous material as water flows through the Tertiary sediments near the regional recharge areas.
The zone of saltwater intrusion consists of areas that have been affected by salty and brackish water in the Delaware River and its estuary. Constituent concentrations in water from wells 15-140 and 15-118 in Gloucester County, shown in figures 15 and 16, respectively, are evidence of saltwater intrusion along the estuary. The sodium and potassium facies (<10 percent Ca + Mg) is the dominant cation facies in these areas. The chloride and sulfate facies is the dominant anion facies (>90 percent Cl + S0 4 ). In addition to the intrusion of saltwater into the Potomac-Raritan-Magothy aquifer system, ion-exchange processes could be partially responsible for the presence of sodium facies in this zone (Back, 1966, A15).
The zone of little flow is evident far downdip on the cation-facies maps for the upper, middle, and lower aquifers (figs. 14-16); it also can be seen on the anion-facies map for the upper aquifer (fig. 17) as an area of bicarbonate-rich water (<10 percent Cl + S0 4 ). The dominant cation facies is sodium and potassium (<10 percent Ca + Mg). Few data are available in this
27

40° 15'
40° 00'
39° 45'
75°30' 15'
EXPLANATION
OUTCROP AREA OF THE POTOMAC GROUP, RARITAN FORMATION, AND MAGOTHY FORMATION (from Owens, 1967, sheet 2)
75°00' 74°45'
BUCK.S- LOCATION OF WELL
10-- CATION HYDROCHEMICAL-FACIES CONTOUR-- Represents fades in terms of calcium plus magnesium as percentage of sum of major cations. Dashed where approximate. Interval variable
Base modified from U.S. Geological Survey digital data, 1:100,000, 1983, Universal Transverse Mercator projection, Zone 18
Figure 14.--Cation facies (calcium plus magnesium as percentage of sum of major cations), and associated Stiff diagrams, in water from the upper aquifer, Potomac-Raritan- Magothy aquifer system, 1980-86.
28

10 505
MILLIEQUIVALENTS PER LITER
EXPLANATION
STIFF DIAGRAM-Shows distribution of major-ion concentrations, in milliequivalents per liter. Number beside diagram is well number
29

40° 15'
40° 00'
39°45'
75°30' 15' 75°00'
EXPLANATION
OUTCROP AREA OF THE POTOMAC GROUP, RARITAN FORMATION, AND MAGOTHY FORMATION (from Owens, 1967, sheet 2)
LOCATION OF WELL
10-- CATION HYDROCHEMICAL-FACIES CONTOUR-Represents fades in terms of calcium plus magnesium as percentage of sum of major cations. Dashed where approximate. Interval variable
74°45'
BUCKS:
10 MILES .PHILADELPHIA:-: ; -
Base modified from U.S. Geological Survey digital data, 1:100,000, 1983, Universal Transverse Mercator projection, Zone 18
Figure 15.--Cation facies (calcium plus magnesium as percentage of sum of major cations), and associated Stiff diagrams, in water from the middle aquifer, Potomac-Raritan- Magothy aquifer system, 1980-86.
30

10
MILLIEQUIVALENTS PERLITER
EXPLANATION
F+NCL
31

40° 15'
40° 00'
39°45'
75°30' 15' 75°00'
EXPLANATION
OUTCROP AREA OF THE POTOMAC GROUP, RARITAN FORMATION, AND MAGOTHY FORMATION (from Owens, 1967, sheet 2)
LOCATION OF WELL
10-- CATION HYDROCHEMICAL-FACIES CONTOUR-Represents fades in terms of caldum plus magnesium as percentage of sum of major cations. Dashed where approximate. Interval variable
74°45'
BUCKS :
10 MILES
10 KILOMETERS
DELAWARE
\PENNsyj_
BURLINGTON
NEW JERSEY
25-N ^5-0
CAMDEN
GLOUCESTER
-' ATLANTIC 1
Base modified from U.S. Geological Survey digital data, 1:100,000, 1983, Universal Transverse Mercator projection, Zone 18
Figure 16.--Cation facies (calcium plus magnesium as percentage of sum of major cations), and associated Stiff diagrams, in water from the lower aquifer, Potomac-Raritan- Magothy aquifer system, 1980-86.
32

10 505
MILLIEQUIVALENTS PER LITER
EXPLANATION
STIFF DIAGRAM-Shows distribution of major-ion concentrations, in milliequivalents per liter. Number beside diagram is well number
33

75°30' 75°00' 74°45'
EXPLANATION
OUTCROP AREA OF THE POTOMAC GROUP, RARITAN FORMATION, AND MAGOTHY FORMATION (from Owens, 1967, sheet 2)
LOCATION OF WELL
10-- ANION HYDROCHEMICAL-FACIES CONTOUR-Represents facies in terms of chloride plus sulfate as percentage of sum of major anions. Dashed where approximately located. Interval variable
PHILADELPHIA
BURLINGTON
5 10 KILOMETERS
DELAWARE NEW JERSEY
CAMDEN
GLOUCESTER
ATLANTIC
Base modified from U.S. Geological Survey digital data, 1:100,000, 1983, Universal Transverse Mercator projection, Zone 18
Figure 17.--Anion facies (chloride plus sulfate as percentage of sum of major anions), and associated Stiff diagrams, in water from the upper aquifer, Potomac- Raritan-Magothy aquifer system, 1980-86.
34

10 505
MILLIEQUIVALENTS PER LITER
EXPLANATION
STIFF DIAGRAM-Shows distribution of major-ion concentrations, in milliequivalents per liter. Number beside diagram is well number
35

75°30' 75°00' 74°45'
EXPLANATION
OUTCROP AREA OF THE POTOMAC GROUP, RARITAN FORMATION, AND MAGOTHY FORMATION (from Owens, 1967, sheet 2)
LOCATION OF WELL
10-- ANION HYDROCHEMICAL-FACIES CONTOUR-Represents facies in terms of chloride plus sulfate as percentage of sum of major anions. Dashed where approximate. Interval variable
PHILADELPHIA
BURLINGTON
DELAWARE
NEW JERSEY
CAMDEIN
GLOUCESTER
ATLANTIC
Base modified from U.S. Geological Survey digital data, 1:100,000, 1983, Universal Transverse Mercator projection, Zone 18
Figure 18.--Anion facies (chloride plus sulfate as percentage of sum of major anions), and associated Stiff diagrams, in water from the middle aquifer, Potomac- Raritan-Magothy aquifer system, 1980-86.
36

10 505
MILLIEQUIVALENTS PER LITER
EXPLANATION
STIFF DIAGRAM-Shows distribution of major-ion concentrations, in milliequivalents per liter. Number beside diagram is well number
37
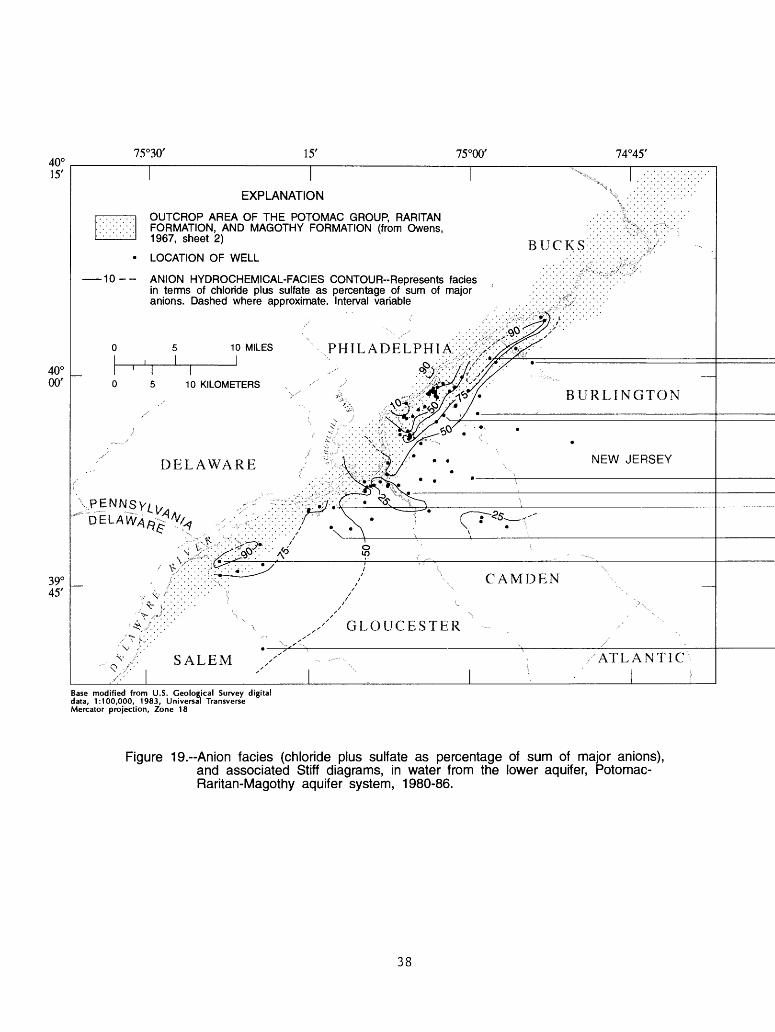
40° 15'
40° 00'
39° 45'
75°30' 15' 75°00'
EXPLANATION
OUTCROP AREA OF THE POTOMAC GROUP, RARITAN FORMATION, AND MAGOTHY FORMATION (from Owens, 1967, sheet 2)
LOCATION OF WELL
10-- ANION HYDROCHEMICAL-FACIES CONTOUR-Represents fades in terms of chloride plus sulfate as percentage of sum of major anions. Dashed where approximate. Interval variable
74°45'
BUCKS :
10 MILES PHILADELPHIA:::^"
S GLOUCESTER
Base modified from U.S. Geological Survey digital data, 1:100,000, 1983, Universal Transverse Mercator projection, Zone 18
Figure 19.--Anion facies (chloride plus sulfate as percentage of sum of major anions), and associated Stiff diagrams, in water from the lower aquifer, Potomac- Raritan-Magothy aquifer system, 1980-86.
38

10 505
MILLIEQUIVALENTS PER LITER
EXPLANATION
Na+K Ca Mg
Fe
STIFF DIAGRAM-Shows distribution of major-ion concentrations, in milliequivalents per liter. Number beside diagram is well number
39

zone to define the quality of this downdip water because the water generally is not of suitable quality for drinking. The Stiff diagrams for water from wells 7-477 and 15-131 in Camden and Gloucester Counties, respectively (fig. 14), illustrate the major-ion chemistry of the zone of little flow.
A transition zone might exist between the zone of active ground-water flow and the zone of little flow. This zone is evident in figures 14 through 16 as a band of water enriched in the sodium and calcium cation facies (10-50 percent Ca + Mg) in the northeastern part of Gloucester County, the central part of Camden County, and the central and southwestern parts of Burlington County.
In general, cations trend from calcium- and magnesium-rich recharge waters updip to sodium- and potassium-rich waters downdip. Anions trend from sulfate- and chloride-rich recharge waters updip to bicarbonate-rich waters downdip. Water near recharge areas tends to be enriched in calcium and magnesium and to contain some sulfate. As the water moves through the active- flow system, concentrations of sodium and bicarbonate increase, whereas concentrations of sulfate, calcium, and magnesium decrease. Water at the end of a long flow path or far downdip in the aquifer tends to be sodium- and bicarbonate - rich.
Areal Distribution of Chemical Constituents
Areal distribution patterns for dissolved solids, dissolved sodium, dissolved chloride, dissolved iron, and pH in the upper, middle, and lower aquifers of the Potomac-Raritan-Magothy aquifer system are shown in figures 20 through 34, respectively. Data illustrated were collected from 1980 through 1986 and represent the most recent data from wells sampled more than once during that period. Statistical summaries are included in the discussion of each constituent. These statistics might be spatially autocorrelated because well locations are biased toward cities and public-supply wells. In addition, because the data are not normally distributed, the median probably is a better representation of the central tendency than is the mean.
Dissolved Solids
The concentration of dissolved solids is used widely as a general indicator of the amount of soluble material, including inorganic salts, organic material, and other residue in water (Hem, 1985, p. 157). Concen trations of dissolved solids in ground water are affected by interactions with aquifer material, by chemical and biological processes, by the length of time the water is in the flow system, or by contamination from human activities. Commonly, the longer the water is in contact with the aquifer matrix and confining units, the higher the dissolved-solids concentration is. In general, elevated concentrations of dissolved solids resulting from local ground-water contamination are considerably different from regional background concentrations and are relatively easy to identify. The USEPA Secondary Maximum Contaminant Level (SMCL) for dissolved solids in drinking water is 500 mg/L (U.S. Environmental Protection Agency, 1986). The distribution of dissolved solids in each aquifer is shown in figures 20-22.
40

40° 15'
40° 00'
39° 45'
75°30' 15'
EXPLANATION
OUTCROP AREA OF THE POTOMAC GROUP, RARITAN FORMATION, AND MAGOTHY FORMATION (from Owens, 1967, sheet 2)
LOCATION OF WELL
-100-- LINE OF EQUAL DISSOLVED-SOLIDS CONCENTRATION-- Dashed where approximately located. Interval, in milligrams per liter, is variable
75°00' 74°45'
BUCKSx:x-:-xl^'-
BURLINGTON
NEW JERSEY
150-
200-G^rMTTEN A
%,GLOWESTh^R
/ATLANTIC 1-
Base modified from U.S. Geological Survey digital data, 1:100,000, 1983, Universal Transverse Mercator projection, Zone 18
Figure 20.--Generalized distribution of dissolved solids in water from the upper aquifer, Potomac-Raritan-Magothy aquifer system, 1980-86.
41

40° 15'
40° 00'
39°45'
75°30' 15'
EXPLANATION
OUTCROP AREA OF THE POTOMAC GROUP, RARITAN FORMATION, AND MAGOTHY FORMATION (from Owens, 1967, sheet 2)
LOCATION OF WELL
100-- LINE OF EQUAL DISSOLVED-SOLIDS CONCENTRATION-- Dashed where approximately located. Interval, in milligrams per liter, is variable
75°00' 74°45'
BUCKS:
10 MILES
IPHILADELPHIA:
10 KILOMETERS
ARLINGTON
DELAWARE
NEW JERSEY
DELAVV^^ g
/ATLANTIC
Base modified from U.S. Geological Survey digital data, 1:100,000, 1983, Universal Transverse Mercator projection, Zone 18
Figure 21 .--Generalized distribution of dissolved solids in water from the middle aquifer, Potomac-Raritan-Magothy aquifer system, 1980-86.
42

40° 15'
40° 00'
39° 45'
75°30' 15'
EXPLANATION
OUTCROP AREA OF THE POTOMAC GROUP, RARITAN FORMATION, AND MAGOTHY FORMATION (from Owens, 1967, sheet 2)
LOCATION OF WELL
-500-- LINE OF EQUAL DISSOLVED-SOLIDS CONCENTRATION-- Dashed where approximately located. Interval, in milligrams per liter, is variable
75°00'
10 MILES
10 KILOMETERS
74°45'
BUCKS:
PHILADELPHIA-: :;>H>: : -^": >
BURLINGTON
NEW JERSEY
CAMDEN
GLOUCESTER ATLANTIC
Base modified from U.S. Geological Survey digital data, 1:100,000, 1983, Universal Transverse Mercator projection, Zone 18
Figure 22.--Generalized distribution of dissolved solids in water from the lower aquifer, Potomac-Raritan-Magothy aquifer system, 1980-86.
43

40° 15'
40° 00'
39°45'
75°30' 15' 75°00'
EXPLANATION
OUTCROP AREA OF THE POTOMAC GROUP, RARITAN FORMATION, AND MAGOTHY FORMATION (from Owens, 1967, sheet 2)
LOCATION OF WELL
10-- LINE OF EQUAL DISSOLVED-SODIUM CONCENTRATION- Dashed where approximately located. Interval, in milligrams per liter, is variable
74°45'
BUCKS . : . :
^ ' '
X \GLOUCESTER
Base modified from U.S. Geological Survey digital data, 1:100,000, 1983, Universal Transverse Mercator projection, Zone 18
Figure 23.--Generalized distribution of dissolved sodium in water from the upper aquifer, Potomac-Raritan-Magothy aquifer system, 1980-86.
44

40° 15'
40° 00'
39°45'
75°30' 15'
EXPLANATION
OUTCROP AREA OF THE POTOMAC GROUP, RARITAN FORMATION, AND MAGOTHY FORMATION (from Owens, 1967, sheet 2)
LOCATION OF WELL
-25-- LINE OF EQUAL DISSOLVED-SODIUM CONCENTRATION- Dashed where approximately located. Interval, in milligrams per liter, is variable
75°00' 74°45'
10 MILES
J
BURLINGTON
NEW JERSEY
CAMDEN
GLOUCESTER/ATLANTIC^
Base modified from U.S. Geological Survey digital data, 1:100,000, 1983, Universal Transverse Mercator projection, Zone 18
Figure 24.--Generalized distribution of dissolved sodium in water from the middle aquifer, Potomac-Raritan-Magothy aquifer system, 1980-86.
45

40° 15'
40° 00'
39° 45'
25--
75°30' 15'
EXPLANATION
OUTCROP AREA OF THE POTOMAC GROUP, RARITAN FORMATION, AND MAGOTHY FORMATION (from Owens, 1967, sheet 2)
LOCATION OF WELL
LINE OF EQUAL DISSOLVED-SODIUM CONCENTRATION- Dashed where approximately located. Interval, in milligrams per liter, is variable
75°00' 74°45'
BUCKS:
BURLINGTON
JV NEW JERSEY
>/ SALEM ATLANTIC
Base modified from U.S. Geological Survey digital data, 1:100,000, 1983, Universal Transverse Mercator projection, Zone 18
Figure 25.--Generalized distribution of dissolved sodium in water from the lower aquifer, Potomac-Raritan-Magothy aquifer system, 1980-86.
46

40° 15'
40° 00'
39° 45'
75°30' 15' 75°00'
EXPLANATION
OUTCROP AREA OF THE POTOMAC GROUP, RARITAN FORMATION, AND MAGOTHY FORMATION (from Owens, 1967, sheet 2)
LOCATION OF WELL
10-- LINE OF EQUAL DISSOLVED-CHLORIDE CONCENTRATION-- Dashed where approximately located. Interval, in milligrams per liter, is variable
74°45'
BUCKS:
BI/RLJNGTON
PHILADELPHIA
NEW JERSEY
/ATLANTIC
Base modified from U.S. Geological Survey digital data, 1:100,000, 1983, Universal Transverse Mercator projection, Zone 18
Figure 26.--Generalized distribution of dissolved chloride in water from the upper aquifer, Potomac-Raritan-Magothy aquifer system, 1980-86.
47

75°30' 75°00' 74°45'
EXPLANATION
OUTCROP AREA OF THE POTOMAC GROUP, RARITAN FORMATION, AND MAGOTHY FORMATION (from Owens, 1967, sheet 2)
LOCATION OF WELL
25-- LINE OF EQUAL DISSOLVED-CHLORIDE CONCENTRATION-- Dashed where approximately located. Interval, in milligrams per liter, is variable
10 KILOMETERS
DELAWARE
Base modified from U.S. Geological Survey digital data, 1:100,000, 1983, Universal Transverse Mercator projection, Zone 18
Figure 27.--Generalized distribution of dissolved chloride in water from the middle aquifer, Potomac-Raritan-Magothy aquifer system, 1980-86.
48

40° 15'
40° 00'
39°45'
10--
75°30' 15'
EXPLANATION
OUTCROP AREA OF THE POTOMAC GROUP, RARITAN FORMATION, AND MAGOTHY FORMATION (from Owens, 1967, sheet 2)
LOCATION OF WELL
LINE OF EQUAL DISSOLVED-SODIUM CONCENTRATION-- Dashed where approximately located. Interval, in milligrams per liter, is variable
75°00' 74°45'
BUCKS:
^v
Downdip limit of freshwater (less than 250 milligrams per liter chloride concentration) in the lower aquifer of the Potomac- Raritan-Magothy aquifer system; Farlekas and Gill, 1976).
& . .-fe$$: : X;H^' '
:^
BURLINGTON
NEW JERSEY
Base modified from U.S. Geological Survey digital data, 1:100,000, 1983, Universal Transverse Mercator projection, Zone 18
Figure 28.--Generalized distribution of dissolved chloride in water from the lower aquifer, Potomac-Raritan-Magothy aquifer system, 1980-86.
49

40° 15'
40° 00'
39°45'
75°30' 15'
EXPLANATION
OUTCROP AREA OF THE POTOMAC GROUP, RARITAN FORMATION, AND MAGOTHY FORMATION (from Owens, 1967, sheet 2)
LOCATION OF WELL
15-- LINE OF EQUAL DISSOLVED-IRON CONCENTRATION-- Dashed where approximately located. Interval, in micrograms per liter, is variable
75°00' 74°45'
BUCKS:
JERSEY
Base modified from U.S. Geological Survey digital data, 1:100,000, 1983, Universal Transverse Mercator projection, Zone 18
Figure 29.--Generalized distribution of dissolved iron in water from the upper aquifer, Potomac-Raritan-Magothy aquifer system, 1980-86.
50

75°30 75°00' 74°45'
EXPLANATION
OUTCROP AREA OF THE POTOMAC GROUP, RARITAN FORMATION, AND MAGOTHY FORMATION (from Owens, 1967, sheet 2)
LOCATION OF WELL
100-- LINE OF EQUAL DISSOLVED-IRON CONCENTRATION Dashed where approximately located. Interval, in micrograms per liter, is variable
10 KILOMETERS
DELAWARENEW JERSEY
CAMDEN
GEOUCESTRR
ATLANTIC
Base modified from U.S. Geological Survey digital data, 1:100,000, 1983, Universal Transverse Mercator projection, Zone 18
Figure 30.--Generalized distribution of dissolved iron in water from the middle aquifer, Potomac-Raritan-Magothy aquifer system, 1980-86.
51

75°30' 75°00' 74°45'
EXPLANATION
OUTCROP AREA OF THE POTOMAC GROUP, RARITAN FORMATION, AND MAGOTHY FORMATION (from Owens 1967, sheet 2)
LOCATION OF WELL
LINE OF EQUAL DISSOLVED-IRON CONCENTRATION- Dashed where approximately located. Interval, in micrograms per liter, is variable
PHILADELPHIA
10 KILOMETERS
BURLINGTON
DELAWARENEW JERSEY
CAMDEN
GLOUCESTER
-ATLANTIC
Base modified from U.S. Geological Survey digital data, 1:100,000, 1983, Universal Transverse Mercator projection, Zone 18
Figure 31 .--Generalized distribution of dissolve iron in water from the lower aquifer, Potomac-Raritan-Magothy aquifer system, 1980-86.
52

40° 15'
40° 00'
39° 45'
75°30' 15'
EXPLANATION
OUTCROP AREA OF THE POTOMAC GROUP, RARITAN FORMATION, AND MAGOTHY FORMATION (from Owens, 1967, sheet 2)
LOCATION OF WELL
8.0-- LINE OF EQUAL pH-Dashed where approximately located. Interval 0.5 pH unit
75°00' 74°45'
BUCKS:
LINGTON
NEW JERSEY
ATLANTIC^
Base modified from U.S. Geological Survey digital data, 1:100,000, 1983, Universal Transverse Mercator projection, Zone 18
Figure 32.~Areal variations in pH of water from the upper aquifer, Potomac-Raritan-Magothy aquifer system, 1980-86.
53

40° 15'
40° 00'
39° 45'
75°30' 15'
EXPLANATION
OUTCROP AREA OF THE POTOMAC GROUP, RARITAN FORMATION, AND MAGOTHY FORMATION (from Owens, 1967, sheet 2)
LOCATION OF WELL
75°00' 74°45'
-8.0-- LINE OF EQUAL pH-Dashed where approximately located. Interval 0.5 pH unit
CAMDEN
SALEMGLOUCESTER
INGTON
PHILADELPHIA:;
NEW JERSEY
ATLANTIC
Base modified from U.S. Geological Survey digital data, 1:100,000, 1983, Universal Transverse Mercator projection, Zone 18
Figure 33.--Areal variation in pH of water from the middle aquifer, Potomac-Raritan-Magothy aquifer system, 1980-86.
54

40° 15'
40° 00'
39° 45'
75°30' 15'
EXPLANATION
OUTCROP AREA OF THE POTOMAC GROUP, RARITAN FORMATION, AND MAGOTHY FORMATION (from Owens, 1967, sheet 2)
LOCATION OF WELL
75°00' 74°45'
BUCKS:
-8.0-- LINE OF EQUAL pH--Dashed where approximately located. Interval 0.5 pH unit
BURLINGTON
NEW JERSEY
CAMDHN
GLOUCESTERATLANTIC
Base modified from U.S. Geological Survey digital data, 1:100,000, 1983, Universal Transverse Mercator projection, Zone 18
Figure 34.--Areal variations in pH of water from the lower aquifer, Potomac-Raritan-Magothy aquifer system, 1980-86.
55

Water from wells in the upper aquifer of the Potomac-Raritan-Magothy aquifer system can contain greater than 500 mg/L dissolved solids. In general, dissolved-solids concentrations, which ranged from 100 to 150 mg/L in Burlington and Camden Counties, increased southwestward to 250 to 500 mg/L in Gloucester County. This pattern is largely the result of the direction of ground-water flow. Water from several wells in or near the outcrop area of the upper aquifer, particularly from wells 15-390 and 5-731, contained elevated concentrations of dissolved solids that probably result from contamination as a result of human activities.
The distribution pattern of dissolved solids in the middle aquifer of the Potomac-Raritan-Magothy aquifer system is similar to that in the upper aquifer; concentrations increased, in approximately the same ranges, from Burlington and Camden Counties southwestward to Gloucester County. Leakage from the upper aquifer to the middle aquifer could affect water quality in northern Camden and northwestern Burlington Counties in the area where dissolved-solids concentrations were less than 75 mg/L. Contamination from human activities could cause the elevated dissolved-solids concentrations at some wells (7-562, 7-564, 7-566) that tap the middle aquifer near the Delaware River that were anomalously high in relation to concentrations at surrounding wells. These anomalous concentrations were near a landfill in Camden, and in Logan Township, Gloucester County.
Concentrations of dissolved solids in the lower aquifer tended to increase from northeast to southwest in the study area, from 150 mg/L in Burlington County to greater than 500 mg/L in southwestern Gloucester and Salem Counties. Possible leakage from overlying aquifers could be the cause of an area of dissolved-solids concentrations less than 100 mg/L in northern Burlington County and northern Camden County. This area (fig. 22) directly underlies an area of relatively low dissolved-solids concentrations in the middle aquifer. In Gloucester and Salem Counties, near the Delaware River, areas affected by saline-water intrusion are characterized by dissolved-solids concentrations greater than 500 mg/L. It is unclear whether this area of high concentration is the result of intrusion of brackish water from the Delaware Estuary or flow of saline water from downdip in the aquifer.
A statistical summary of dissolved-solids-concentration data is presented below.
Concentration of dissolved solids Number ______in milligrams per liter________
of Aquifer analyses Minimum Mean Maximum Median
Upper 107 52 293 4,480 146Middle 125 25 305 6,060 147Lower 116 46 260 1,530 188
56

Of the 107 dissolved-solids concentrations determined for water from the upper aquifer, 5.6 percent exceeded the SMCL of the USEPA (1986) of 500 mg/L. For the upper aquifer, less than 1 percent of the samples contained concentrations greater than 1,000 mg/L. For the middle and lower aquifers, 13.6 percent and 12.9 percent of the samples, respectively, contained concentrations greater than 500 mg/L. For the middle and lower aquifers, concentrations in 4.8 percent and 1.7 percent of the samples, respectively, exceeded 1,000 mg/L.
Sodium
Sodium is a common dissolved constituent in ground waters. Natural sources of sodium are saltwater intrusion; ion exchange of calcium for sodium on clays; geologic sources, such as evaporite deposits; and weathering of rocks. Human-related inputs of sodium include road salt, septic-tank effluents, some industrial wastes, and some agricultural chemicals and wastes. A limit of 50 mg/L is recommended by the State of New Jersey (1982) as a secondary standard (NJGW2) for ground-water quality.
The distribution of dissolved sodium in each aquifer is shown in figures 23-25. Several patterns are evident in all three aquifers of the Potomac- Raritan-Magothy aquifer system. In Burlington County, dissolved-sodium concentrations were low, generally below 5 mg/L, in water from the confined part of the aquifer system. In Camden County, concentrations in water from the confined part of the system increased to 25 mg/L. In the outcrop areas of Burlington and Camden Counties, concentrations of dissolved sodium were higher than confined parts of the aquifer, possibly as a result of human activity or inflow from the Delaware River. For all aquifers in the Potomac-Raritan- Magothy aquifer system, the 25-mg/L equal-concentration line for dissolved sodium corresponded closely to the northern part of the Camden-Gloucester County line. Water from areas in all three aquifers was found to contain sodium concentrations that exceeded 50 mg/L.
In water from the upper aquifer in central Gloucester County, sodium concentrations ranged from 50 mg/L to greater than 100 mg/L; although variable, concentrations generally were less than 50 mg/L. In water from the middle aquifer, sodium concentrations in most of Salem County were greater than 50 mg/L, except in the northeastern corner of the county and in and near the outcrop area. Water from other areas of the middle aquifer generally contained sodium in concentrations less than 50 mg/L. Isolated areas of elevated sodium concentrations were apparent near wells 15-98 and 15-380 (fig. 24). In water from the lower aquifer, sodium concentrations greater than 50 mg/L appeared to be more extensive than in the other aquifers. Water from wells in the lower aquifer in Salem and Gloucester Counties contained sodium concentrations greater than 50 mg/L, with the exception of some wells in northeastern Gloucester County. Water from wells in the lower aquifer in the Philadelphia area also contained elevated concentrations of dissolved sodium, possibly related to contamination from human activity. A statistical summary of dissolved-sodium-concentration data shown in figures 23-25 is presented below.
57

Concentration of dissolved sodium
Aquifer
Upper aquifer Middle aquifer Lower aquifer
Number of
analyses
108 125 119
in
Minimum
1.8 1.8 2.4
milligrams per liter
Mean
40 35.8 47.5
Maximum
230 670 540.0
Median
15 12 21.0
The percentages of water samples containing dissolved-sodium concentrations greater than 50 mg/L are 29.6, 20.8, and 19.3 percent for the upper, middle, and lower aquifers, respectively.
Chloride
Chloride is one of the major anions in ground water. Sources are similar to those for sodium and generally are natural; however, chloride in ground water can result from human activity such as sewage disposal and road salting. The SMCL of the USEPA (1986) for chloride is 250 mg/L (U.S. Environmental Protection Agency, 1986). The distribution of dissolved chloride in each aquifer is shown in figures 26-28. Chloride-distribution patterns generally are similar for all three aquifers in Burlington and Camden Counties. In the confined part of the aquifer system in these areas, chloride concentrations were low, typically less than 5 mg/L. In the outcrop areas, chloride concentrations were slightly higher than confined areas of the aquifer. The chloride distribution was variable among aquifers in Gloucester and Salem Counties, and in other areas where localized contamination is possible.
In the upper aquifer, dissolved-chloride concentrations did not exceed 250 mg/L anywhere within the study area. In the central part of Gloucester County, however, chloride concentrations in some water samples from the upper aquifer were greater than 100 mg/L. Concentrations in Salem County were less than 50 mg/L.
The water in the middle aquifer indicated possible contamination at several wells, notably well 7-562 and well 7-48 (in the City of Camden), both in Camden County; and well 15-163 in Logan Township, in Gloucester County. Water from these wells contained chloride in concentrations higher than those in the surrounding area. With the exception of these wells, chloride concentrations exceeded the SMCL of the USEPA (1986) in only a few places in the middle aquifer. An area of low chloride concentration (less than 10 mg/L) was evident in the upper and the middle aquifers in southwestern Gloucester County and northeastern Salem County. The low chloride concentrations could result from leakage between the upper and middle aquifers and (or) a localized, anomalously high rate of ground-water recharge. More rainfall may be infiltrating in this area. Rainwater, which generally ranges in chloride concentration from less than 1 to 10 mg/L (Feth, 1981, p. 11), may be causing a dilution effect in chloride concentrations relative to the more typical chloride range in that area of 10-50 mg/L.
58

In the lower aquifer, dissolved-chloride concentrations increased from northeast to the southwest in the study area and exceeded 100 mg/L in Gloucester and Salem Counties; however, chloride concentrations exceeded the SMCL of the USEPA (1986) in only one area in the southwestern corner of Gloucester County. Unlike the upper and middle aquifers, the lower aquifer is not characterized by an area of low chloride concentration (less than 10 mg/L) in or near the outcrop area in southwestern Gloucester County and northeastern Salem County.
A statistical summary of dissolved-chloride-concentration data for the aquifer system is presented below.
Concentration of dissolved chloride
Aquifer
Upper aquiferMiddle aquiferLower aquifer
Numberof
analyses
110141123
in
Minimum
0.7.7
1.9
milligrams
Mean
22.845.356.1
per liter
Maximum
170780830
Median
101622
In the upper aquifer, none of the chloride concentrations in water from the wells sampled exceeded 250 mg/L. In the middle and lower aquifers, chloride concentrations in 3.5 and 4.1 percent of the samples, respectively, exceeded 250 mg/L.
Iron
The solubility of iron in ground water depends on the pH and theoxidation state of the water. Dissolved iron can be found in two oxidation states, ferrous (Fe 2 ) or ferric (Fe 3 ), but iron in ground water generally is in the reduced, ferrous state. Ferric iron commonly forms compounds of low solubility, whereas ferrous iron is soluble under ground-water conditions where the iron ion can gain orbital elections (a reduction reaction).
Elevated dissolved-iron concentrations are responsible for the most persistent water-quality problems associated with ground water from the Potomac-Raritan-Magothy aquifer system. Iron concentrations in ground water can be increased indirectly by contamination. Microbiological decomposition of organic wastes from sources, such as leaky sewers, septic systems, landfills, and municipal and industrial wastewater disposal, consumes oxygen (Langmuir, 1969, p. 21) and leads to reducing conditions in the ground water; under these conditions, dissolved iron concentrations can be as high as 1,000 mg/L. The decomposition process also can release hydrogen ions into the ground-water system, lowering the pH and thereby promoting the leaching of iron from iron-bearing minerals in the aquifer matrix. Dissolved-iron concentrations exceeding 0.3 mg/L also can be found in some outcrop areas where (1) normally oxygen-rich waters have been depleted in oxygen by the presence of clay layers and (or) (2) infiltration of oxygen-rich precipitation has been hindered by impervious surfaces, such as pavement and roads.
59

Confinement of ground water enhances the development of reducing conditions and the production of highly soluble ferrous ions (Paulachok, 1991). The USEPA (1986) SMCL for iron is 0.3 mg/L (U.S. Environmental Protection Agency, 1986).
The distribution of dissolved iron in water from each aquifer is shown in figures 29-31. Water from most outcrop areas of the three aquifers contained iron in concentrations greater than 0.3 mg/L. Many wells have been abandoned as a result of clogging screens and pumps by iron. Dissolved-iron concentrations less than 0.3 mg/L were found in water from the downdip, confined parts of the aquifers in Burlington, Camden, Gloucester, and Salem Counties.
In northwestern Burlington County and northeastern Camden County, concentrations of dissolved iron were lower in water from the unconfined parts of the middle and lower aquifers near the outcrop area than in water from other parts of the aquifer system. Water from the middle aquifer contained iron in concentrations less than 0.1 mg/L, mostly in the outcrop area. The concentration in water from the lower aquifer also was less than 0.1 mg/L, but these low concentrations extended farther downdip in the confined part of the system than in the middle aquifer. Few wells are screened in the upper aquifer in northeastern Camden and northwestern Burlington Counties, but several wells screened in the upper aquifer yielded water with lower concentrations of dissolved iron than wells screened in the rest of the aquifer.
The area of water with low concentrations of dissolved iron corresponds to an area of high concentrations of dissolved oxygen, low concentrations of dissolved solids, and low pH in the middle and lower aquifers (figs. 30 and 31). In water from the middle aquifer in this location, concentrations of dissolved oxygen ranged from 1.0 mg/L to 8.5 mg/L. In water from the lower aquifer, concentrations of dissolved oxygen were similar to concentrations in the middle aquifer, but were as high as 9.3 mg/L. Because dissolved-oxygen concentration is measured in the field and the samples are subject to oxygenation during pumping, dissolved-oxygen concentrations less than 0.5 mg/L associated with high iron concentrations are suspect.
Low iron concentrations in this area appear to result from the mixing of anoxic ground water containing high iron concentrations with oxygen-rich ground water leaking downward through confining units that are thin or otherwise ineffective barriers to ground-water flow, as discussed previously in "Hydrogeologic Setting." The oxidation of dissolved iron in ground water causes precipitation of iron oxides (such as Fe(OH) 3 ) and release of hydrogen ions, which results in a lowering of pH.
60

A statistical summary of dissolved-iron-concentration data for water from the aquifer system is presented below.
Concentration of dissolved solids
Aquifer
Upper aquifer Middle aquifer Lower aquifer
Number of
analyses
107 125 119
in milligrams Der liter
Minimum
<0.003 <.003 <.003
Mean
6.3 15.5 7.9
Maximum
220.0 360.0 70.0
Median
0.3 .99
2.20
Dissolved-iron concentrations in 50 percent of the 107 water samples from the upper aquifer analyzed for iron exceeded the SMCL of the USEPA (1986). Concentrations in 64 and 70 percent, respectively, of the 125 and 119 water- quality samples from the middle and lower aquifers exceeded the SMCL of the USEPA (1986).
Manganese
The chemistry of manganese is similar to that of iron. In general, as the concentration of dissolved iron in ground water increases, the concentration of dissolved manganese increases. Manganese oxides and hydroxides commonly are present in sediments during deposition. The SMCL of the USEPA (1986) for dissolved manganese is 50 pg/L (U.S. Environmental Protection Agency, 1986).
Maps illustrating the distribution of dissolved manganese were not prepared for the entire study area, although a discussion of the manganese distribution in the Camden-Philadelphia area is presented in "Effects of human activities." Summary statistics for water-quality data for iron and manganese are presented below.
61

[Fe, dissolved iron; Mn, dissolved manganese; 300, U.S. Environmental Protection Agency (1986) Secondary Maximum Contaminant Level, in micrograms per liter, for dissolved iron; 50, U.S. Environmental Protection Agency (1986) Secondary Maximum Contaminant Level, in micrograms per liter, for dissolved manganese; >, greater than; <, less than]
Number and percentage of ground-water samples in which concentrations of iron and manganese were above or below indicated concentrations
Aquifer
Upper Middle Lower
Number of
analy ses
98 127 125
Fe >300 Mn >50
Num- Per- ber cent
26 26 70 55 73 58
Fe >300 Mn <50
Num- Per- ber cent
26 26 12 9 16 12
Fe <300 Mn >50
Num- Per- ber cent
5 5 24 19 18 14
Fe <300 Mn <50
Num- Per- ber cent
41 42 21 16 18 14
Water samples from more than 50 percent of the sampled wells tapping the middle and lower aquifers contained concentrations of dissolved iron greater than the SMCL of the USEPA (1986) of 300 jug/L; water from these wells also contained dissolved manganese in concentrations greater than the SMCL of the USEPA (1986) of 50 jug/L. Although various processes affect the relation between these two chemical species, elevated concentrations of dissolved iron are found in conjunction with high concentrations of dissolved manganese in many instances.
Hydrogen-ion activity (pH)
pH is the negative base-10 logarithm of the hydrogen-ion activity, expressed as moles per liter (Hem, 1985, p. 61). In most natural ground waters, pH ranges from 6.0 to 8.5. The SMCL of the USEPA (1986) for pH is a range of 6.5 to 8.5 (U.S. Environmental Protection Agency, 1986). The chemical reaction of dissolved carbon dioxide with water is one of the principle reactions that affects pH. The atmosphere is a major source of carbon dioxide in ground water. Carbon dioxide reacts with water and hydrogen ions to produce carbonic acid, bicarbonate, and carbonate. Species produced from this reaction depend on the initial pH of the water and its buffering capacity (Stumm and Morgan, 1981, p. 558). Temperature also has a strong effect on hydrogen-ion activity: As temperature increases, pH decreases.
The distribution of pH in water from each aquifer is shown in figures 17- 19. These maps illustrate field-measured pH values. Generally, pH increased with increasing distance downdip from the outcrop area. A pH of less than 6.5 was not found at distances greater than 2 mi downdip from the outcrop area in water from any of the three aquifers. Values of pH above and below the SMCL of the USEPA (1986) can be found in part of the outcrop area as a result of contamination from human activity.
62

A statistical summary of pH data for the aquifer system is presented below.
Aquifer
Upper aquiferMiddle aquiferLower aquifer
Numberof
analyses
100103118
Minimum
4.23.94.1
pH
Maximum
9.38.28.9
Median
7.56.06.6
The percentages of samples that exceeded the SMCL of the USEPA (1986) for pH are 14.5, 66.0, and 43.2 percent for water from the upper, middle, and lower aquifers, respectively. The median pH of water from the upper aquifer (7.5) indicates that water from the upper aquifer is more alkaline than waters from the other two aquifers. In addition, the median pH of water from the middle aquifer was more acidic than the lower limit of the SMCL of the USEPA (1986).
Trace elements
Trace elements commonly are present at concentrations of less than 1.0 mg/L in ground water, in contrast to the major ions, which commonly are present at higher concentrations. Contamination from human activity can account for elevated concentrations of trace elements. USEPA Maximum Contaminant Levels (MCL's) exist for some of these constituents.
Concentrations of trace elements in water from the aquifers of the Potomac-Raritan-Magothy aquifer system typically were less than the MCL of the USEPA (1986), as shown in table 9. The trace element that most frequently exceeded the MCL is cadmium. Percentages of samples from the upper, middle, and lower aquifers in which MCL's were exceeded, however, were small (1.1, 1.5, and 4.0 percent, respectively). Elevated concentrations could be related to localized contamination.
NitrogenThe anionic forms of nitrogen are nitrite (N0 2 ) and nitrate (N0 3 ~). The
major cationic form of nitrogen is ammonium (NH 4 ). Chemical properties of the above species differ greatly. In ground water, nitrate is more stable than is nitrite; nitrate commonly is transported along with ground-water flow. Ammonium cations tend to sorb onto mineral surfaces and form strong soluble complexes with metal ions, which are common in wastewater.
Sources of nitrogen in ground water include precipitation, fossil-fuel- combustion products, fertilizers, and industrial and domestic wastewaters. Transformations among the nitrogen species in ground water commonly are mediated by microbial action. The MCL of USEPA (1986) for nitrate nitrogen is 10 mg/L (U.S. Environmental Protection Agency, 1986). Although no MCL or SMCL for ammonia in drinking-water supplies has been promulgated by the USEPA, the State of New Jersey (1982) set the secondary standard (NJGW2) for ammonia at 0.5 mg/L.
63

Table 9.--Trace elements in water from the Potomac-Rarltan-Magothv aquifersystem, 1980-86, in relation toEnvironmental Protection Agency
[MCL, U.S. Environmental Protection Agency
Laboratory detection USEPA
Constituent limit MCL
Arsenic 1 /ug/L 50 Mg/L
Upper aquifer Middle aquifer Lower aquifer
Barium 2 ,ug/L 1,000 /ug/L
Upper aquifer Middle aquifer Lower aquifer
Cadmium 1 ;ug/L 10 Mg/L
Upper aquifer Middle aquifer Lower aquifer
Chromium 1 ;ug/L 50 Mg/L (hexavalent)
Upper aquifer Middle aquifer Lower aquifer
Lead 10 /ug/L 50 /*g/L
Upper aquifer Middle aquifer Lower aquifer
laboratory detection limits and U.S.Maximum Contaminant Levels
limits ;
Totalnumber ofanalyses
57 91 92
83 98 85
88 132 99
51 81 80
86 122 96
Mg/L, micrograms per liter]
Numberabovelaboratory detectionlimit
35 45 46
83 98 84
46 72 56
3 12 11
23 31 30
Numberabove USEPAMCL
0 1 0
0 0 0
1 2 4
0 2 1
0 2 0
64

In water from the Potomac-Raritan-Magothy aquifer system, nitrate concentrations greater than the MCL of USEPA (1986) are uncommon, but concentrations of ammonia greater than the NJGW2 are common in and near the outcrop of the aquifer system, as shown in figures 35 through 37. The upper aquifer is tapped by the fewest wells at which nitrate and ammonia concentrations exceeded the MCL of USEPA (1986) and the NJGW2 standard, respectively (fig. 35). The percentages of nitrate concentrations in water from wells in the middle aquifer (fig. 36) that exceeded the MCL of USEPA (1986) were larger than those in water from wells in the other aquifers, especially in Gloucester County. Ammonia concentrations greater than 10 mg/L were found in water from wells near the City of Camden and in Gloucester County. Data for water from the lower aquifer (fig. 37) indicate no wells at which nitrate concentrations were greater than the MCL of USEPA (1986); ammonia concentrations greater than 10 mg/L in water from the lower aquifer generally were found in wells located in the outcrop area in Camden County and northeastern Gloucester County.
Presence of Saline Water
Saline water is introduced into the Potomac-Raritan-Magothy aquifer system by (1) migration of water containing high concentrations of dissolved solids from downdip in the aquifer system as a result of differences in recharge and changes in tidal fluctuations (Feth, 1981, p. 6) and as a result of pumping, and (2) induced infiltration of saline water from the Delaware River estuary. Schaefer (1983) identified four locations near the study area as areas where saline water has a significant effect on ground-water quality: Woodstown Borough and surrounding areas, Clayton Borough and surrounding areas, the area between Paulsboro and Gibbstown, and the area between Penns Grove and Salem City (fig. 1). Updip flow of saline water in response to changes in recharge rate and pumping stresses is the likely cause of the presence of saline ground water in Woodstown and Clayton Boroughs; intrusion of saline water from the Delaware River estuary is the cause in the other areas.
Downdip Saline Water
The interface between fresh and saline water is characterized by a broad transition zone in which chloride concentrations range from 250 to 18,000 mg/L. In the Coastal Plain of New Jersey, the transition zone is approximately 1,500 ft thick vertically, and extends, in map view, 10 to 15 mi from the 5,000-mg/L isochlor (line of equal chloride concentration) to the 18,000-mg/L isochlor (Meisler and others, 1984, p. 16). The location of the 250-mg/L isochlor in the southern Coastal Plain for the lower aquifer of the Potomac-Raritan-Magothy aquifer system is shown in figure 28. The interface is farther inland in the lower and middle aquifers than in the upper aquifer because the upper aquifer has been more thoroughly flushed with freshwater recharge than have the middle or lower aquifers (Meisler and others, 1984, p. 6).
Back (1966) presented several theories on the origin of the saline waters in the northern Atlantic Coastal Plain. In marine formations such as the Magothy Formation, which was deposited under nearshore conditions and corresponds to the upper aquifer of the Potomac-Raritan-Magothy aquifer system, incomplete flushing of the sediments by recharge water could produce
65

40° 15'
75°30'
40° 00'
39°45/
15'
EXPLANATION
75°00' 74°45'
OUTCROP AREA OF THE POTOMAC GROUP, RARITAN -X-X-X'X-X-X-XFORMATION, AND MAGOTHY FORMATION (from Owens, X-:-X-:-X:feXX-!X-.1967, sheet 2) B UCKS X : X : X : X : X : : :: "
. LOCATION OF WELL WHERE GROUND WATER HAS A NITRATE X^X^xlx^x''* CONCENTRATION GREATER THAN 10 MILLIGRAMS PER LITER ' : :-: : : : :^'4'Lv^^ : '
LOCATION OF WELL WHERE GROUND WATER HAS A DISSOLVED X :: X : XX : X : X 0 AMMONIA CONCENTRATION FROM 0.5 TO 0.9 MILLIGRAMS : XXXXvX-X
PER LITER . ; : . ; ::,;;;<rX;:: x :
o 5 10 MILES X PHiLADELPHiA-: : ;x'i: ;:: : x : x : x'- ;_____I v- x-xxx-x-x-: "x,;
-- : -X'X-'-x-x-x' x,0 5 10 KILOMETERS ' X.^-!^.X : xV
_ } f " f .;:;x : :;|:;:;x'x : x ""'< BURLINGTON
DELAWARE / ;;/:^:|.:;.:jffi: : - :
x;S:.;|;:x«x :: ' :: '' '\, NEW JERSEY
V/ "' X X .-XXX'^' ' v
x : : : x''' 1 © I CAMDEN
SALEMGLOUCESTER ATLANTIC
Base modified from U.S. Geological Survey digital data, 1:100,000, 1983, Universal Transverse Mercator projection, Zone 18
Figure 35.--Concentrations of dissolved ammonia and nitrate in water from the upper aquifer, Potomac-Raritan-Magothy aquifer system, 1980-86.
66

40° 15'
40° 15'
39° 45'
75°30' 15' 75°00'
EXPLANATION
OUTCROP AREA OF THE POTOMAC GROUP, RARITAN FORMATION, AND MAGOTHY FORMATION (from Owens, 1967, sheet 2)
LOCATION OF WELL WHERE GROUND WATER HAS A NITRATE CONCENTRATION GREATER THAN 10 MILLIGRAMS PER LITER
LOCATION OF WELL WHERE GROUND WATER HAS A DISSOLVED AMMONIA CONCENTRATION FROM 0.5 TO 0.9 MILLIGRAMS PER LITER
74°45'
BUCKS:
LOCATION OF WELL WHERE GROUND WATER HAS A DISSOLVED. AMMONIA CONCENTRATION FROM 1.0 TO 9.9 . v ,v MILLIGRAMS PER LITER . .^
LOCATION OF WELL WHERE GROUND WATER HAS A DISSOLVED AMMONIA CONCENTRATION < GREATER THAN 10.0 MILLIGRAMS *sPER LITER ,vv .
10 MILES
10 KILOMETERS
DELAWARE
BURLINGTON
NEW JERSEY
CAMDEN
GLOUCESTER
SALEM "'ATLANTIC
Base modified from U.S. Geological Survey digital data, 1:100,000, 1983, Universal Transverse Mercator projection, Zone 18
Figure 36.~Concentratipns of dissolved ammonia and nitrate in water from the middle aquifer, Potomac-Raritan-Magothy aquifer system, 1980-86.
67

40° 15'
40° 00'
39°45'
75°30' 15'
EXPLANATION
OUTCROP AREA OF THE POTOMAC GROUP, RARITAN FORMATION, AND MAGOTHY FORMATION (from Owens, 1967, sheet 2)
75°00' 74°45'
BUCKS:o LOCATION OF WELL WHERE GROUND WATER HAS A DISSOLVED
AMMONIA CONCENTRATION FROM 0.5 TO 0.9 MILLIGRAMS PER LITER
. LOCATION OF WELL WHERE GROUND WATER HAS A DISSOLVED AMMONIA CONCENTRATION GREATER THAN 10.0 MILLIGRAMS PER LITER ; ;
10 MILESPHILADELPHIA;*:;
' ' ; W'-V ' ' '
10 KILOMETERS
DELAWARE
BURLINGTON
NEW JERSEY
CAMDEN
GLOUCESTER
SALEM ATLANTIC
Base modified from U.S. Geological Survey digital data, 1:100,000, 1983, Universal Transverse Mercator projection, Zone 18
Figure 37.~Concentrations of dissolved ammonia in water from the lower aquifer, Potomac-Raritan-Magothy aquifer system, 1980-86.
68

higher concentrations of dissolved solids downdip than are present in seawater. Other sources of saline water are mineral dissolution and ion concentration by clay filtration (Back, 1966, p. A9) and intrusion of saline water as a result of sea-level fluctuations (Back, 1966; Meisler and others, 1984).
The composition of the downdip saline water is different from that of seawater. Meisler and others (1984, p. 22) noted that saline waters in the Northern Atlantic Coastal Plain contain much larger concentrations of calcium, sodium, and chloride and smaller concentrations of potassium, sulfate, and bicarbonate than does seawater. The chemistry of downdip saline water from the New Jersey part of the Coastal Plain is similar to that of water in the Northern Atlantic Coastal Plain, except that it contains less calcium.
Meisler and others (1984, p. 22) describe the waters that constitute the transition zone in the Coastal Plain from Virginia to New Jersey as a mixture of sodium bicarbonate-type freshwater, sodium calcium chloride brine, and seawater. Deviation from mixing curves, in which chloride concentration is plotted as a function of various major ions, indicates that the third source could be seawater (Meisler and others, 1984, p.22). Ion exchange also might affect the chemistry of water in the transition zone.
Facies maps of the study area (figs. 14-19) illustrate, as previously mentioned, a downdip zone of little flow. Water in this zone in the upper aquifer (fig. 14) is characterized by the sodium- and potassium-cation facies and the bicarbonate-anion facies. Wells in the lower aquifer are near the freshwater/saline-water interface because of the shape of the interface, and the quality of water from some of these wells indicates an increased contribution from saline water. The concentration of dissolved chloride was greater than that of bicarbonate in water from wells 15-283 and 33-183 (fig. 16). In contrast, bicarbonate predominated over dissolved chloride in water from well 15-131 in the upper aquifer (fig. 14) in Harrison Township, Gloucester County. These data indicate that the downdip water could be mixing with saline water to form a transition zone in this area. Stiff diagrams for the Ragovin well, which is located outside the study area in Cumberland County (fig. 1), and for seawater are shown in figure 38. In water collected from the Potomac-Raritan-Magothy aquifer system from this multiple-screen well, sodium, potassium, and chloride were the dominant ions, but some magnesium also was present. Concentrations of sodium, potassium, and chloride were greater than those in seawater. Water samples from the Ragovin well contained less calcium than the sodium calcium chloride brine described by Meisler and others (1984) as one end member of waters in the transition zone.
Intrusion of Saline Water From the Delaware River Estuary
In many estuaries, freshwater floats on the saline water, which forms a blunt wedge thinning toward the upstream part of the estuary as a result of density differences. In the Delaware River estuary, however, waters are fairly well mixed by tides and by ship propellers, and a blunt wedge-shaped front probably does not exist (Parker and others, 1964). Differences in salinity of only 5 to 10 percent between the surface and the bottom waters of the estuary are common.
69

Ragovin well
600 300 0 300
MILLIEQUIVALENTS PER LITER
600
EXPLANATION
Cl
HCO3+CO3 SO4 F+NCL
STIFF DIAGRAM-Shows distribution of major-ion concentrations, in milliequivalents per liter.
Figure 38.--Stiff diagrams showing ionic composition of water from the Ragovin well, Cumberland County, New Jersey, and of seawater.
70

Freshwater contributions--from reservoirs and flow control on the upper Delaware River and input from streams--keep the saltwater front, which is defined as the 250-mg/L isochlor by the Delaware River Basin Commission (1983), near the Pennsylvania-Delaware State line most of the time. Under drought conditions in November 1964, the 250-mg/L isochlor encroached as far upstream as the Cities of Camden and Philadelphia (Anderson and others, 1972). During this time, saline water was adjacent to aquifer recharge areas and appears to have entered the Potomac-Raritan-Magothy aquifer system. Although no long-term effect on the City of Camden's water supply was noted, this episode is indicative of the vulnerability of the aquifer system to the intrusion of saline water from the estuary. One objective of the Delaware River Basin Commission is to maintain a sufficiently high freshwater flow in the Delaware River estuary so that the maximum 30-day average salinity of the river does not exceed 180 mg/L at river mile 98.0 (Delaware River Basin Commission, 1983). River mile 98.0 is about 6 miles upstream from the confluence with the Schuylkill River. Results of flow simulation (Luzier, 1980; Vowinkel and Foster, 1981) indicate that the Delaware River is recharging the Potomac-Raritan-Magothy aquifer system along some reaches. If regulation of freshwater flows on the upper Delaware River during drought or rising sea level is insufficient to maintain the saltwater front at its current position, ground-water contamination by saline-water intrusion could result where aquifer recharge areas are adjacent to the river.
Major factors affecting the position of the saltwater front in the Delaware River estuary are surface-water withdrawals, sea-level changes, tides, wind conditions, and the geometry of the river channel. A postulated sea level rise of 1.25 to 1.7 ft by the year 2075 (Hoffman and others, 1983) also could cause the position of the saltwater front to move upriver.
Effects of Human Activities
The effects of human activities on the water quality of the Potomac- Raritan-Magothy aquifer system have been caused by changes to the ground- water-flow system resulting from pumpage (previously discussed) and the introduction of contaminants to the aquifers from point and nonpoint sources. Areas of local contamination are in the outcrop area (H.E. Gill and G.M. Farlekas, U.S. Geological Survey, written commun., 1969) and near pumping centers where cones of depression are well-developed. Elevated concentrations of dissolved solids, sodium, chloride, trace elements, and nitrogen in the three aquifers, inferred to be the result of contamination from human activity, were discussed in the section on "Dissolved Constituents."
Effect of Ground-Water Pumpage on the Migration of Contaminants from the Pennsylvania Side of the Aquifer System
Ground-water withdrawals from the Potomac-Raritan-Magothy aquifer system have not only created large, regional cones of depression in all three aquifers, but also have caused the reversal of flow directions adjacent to the Delaware River. In the late 1950's, Barksdale and others (1958, p. 121) predicted that contaminated ground water would move under the Delaware River to New Jersey if pumping ceased at the U.S. Naval Base in Philadelphia (fig. 1). Farlekas and others (1976, p. 48) noted that, in 1966, the U.S. Naval
71

Base substantially decreased withdrawals from the Potomac-Raritan-Magothy aquifer system, and the direction of flow changed. At present (1988), ground water in the Potomac-Raritan-Magothy aquifer system flows southeast from Philadelphia toward New Jersey (Eckel and Walker, 1986).
Predevelopment water quality in the wells at the U.S. Naval Base in Philadelphia and well 15-323 in New Jersey was similar. Over time, however, water on the Philadelphia side of the Delaware River became progressively more contaminated from industrial sources, as noted by Greenman and others (1961, p. 74). At the Naval Base, the concentration of dissolved sulfate in water from well PH-6 decreased by 30 percent during 1956-67, but increased substantially downdip in the aquifer system, possibly because of the development of the cones of depression and reversal of flow directions in the aquifer system in New Jersey. Results of recent (1980-86) water-quality analyses indicate that concentrations of some chemical constituents-- in particular, sulfate and iron--have increased in water from wells in New Jersey near the Delaware River. Paulachok (1991) attributes a 30-percent increase in the average iron concentration in water from the lower aquifer of the Potomac- Raritan-Magothy aquifer system in Philadelphia from 1945-58 to 1979-80 to ongoing ground-water contamination.
The distributions of concentrations of dissolved solids, dissolved iron, dissolved manganese, dissolved sulfate, and pH in water from the lower aquifer of the Potomac-Raritan-Magothy aquifer system in the PhiladeIphia-Camden area for 1980-86 are illustrated in figures 39-43, respectively. These maps are more detailed than the corresponding maps in figures 20-34 and include additional water-quality data from wells in the Philadelphia area. Most of the data for wells in the Philadelphia area are from Paulachok (1991) for the period 1979-80.
The distribution map of dissolved sulfate (fig. 43) shows that the 25- mg/L sulfate-concentration line extends downdip from the generalized outcrop area of the Potomac-Raritan-Magothy aquifer system in New Jersey. Farlekas and others (1976) place the 25-mg/L sulfate-concentration contour line just slightly into New Jersey on the basis of data collected from 1966 through 1971. Trends in constituent concentration over time for water from well 15- 323 (fig. 1) are shown in figure 44. This well is in New Jersey, directly across the Delaware River from the U.S. Naval Base in Philadelphia; the period of water-quality record for this well is one of the longest for wells in the area. The graphs show that concentrations of all dissolved constituents have increased substantially; pH has decreased slightly.
In addition to the migration of contaminants from the Philadelphia side of the aquifer, increases in constituent concentrations could be partly a result of downward leakage of contaminated water through the outcrop area on the New Jersey side of the aquifer system.
72

75° 15 75°00'
P H I L A D E L P H T A
C A M D E N
LOUCESTER
EXPLANATION
OUTCROP AREA OF THE POTOMAC GROUP RARITAN FORMATION, AND MAGOTHY FORMATION (from Owens, 1967, sheet 2)
WELL LOCATION
LINE OF EQUAL DISSOLVED-SOILIDSCONCENTRATION-Dashed where approximately located. Interval, in milligrams per liter, is variable
Base modified from U.S. Geological Survey digital data, 1:100,000, 1983, Universal Transverse Mercator projection, Zone 18
(Contours in Philadelphia, Pennsylvania, modified from Paulachok, 1991)
Figure 39.--Concentrations of dissolved solids in water from the lower aquifer, Potomac- Raritan-Magothy aquifer system, Philadelphia-Camden area, 1980-86.
73

75°00'
P H I L A D E L P H T A
^ " -
G L O U C E S T E R
EXPLANATION
OUTCROP AREA OF THE POTOMAC GROUP, RARITAN FORMATION, AND MAGOTHY FORMATION (from Owens, 1967, sheet 2)
WELL LOCATION
LINE OF EQUAL DISSOLVED-IRON CONCENTRATION-Dashed where approximately located. Interval, in micrograms per liter, is variable
Base modified from U.S. Geological Survey digital data, 1:100,000, 1983, Universal Transverse Mercator projection, Zone 18
(Contours in Philadelphia, Pennsylvania, modified from Paulachok, 1991)
Figure 40.--Concentrations of dissolved iron in water from the lower aquifer, Potomac- Raritan-Magothy aquifer system, Philadelphia-Camden area, 1980-86.
74

75°15' 75°00'
P H I I, A D E L P H T A
..... . . »<. . .'V,. x.uut^Kij .rj.f .a ... . . . . . .-. .-^f^. ' xcsjw........ TS, . . . "s^^Sl ^' i.l' ......... _-^^: t ̂ \^ :
.'.'.'.'.'.'.'.'.'.'.' *L.' .;<^' ' _ ̂ ^ " ' i i i' " '- ** J^r^t V'_ v
C A M D E N
G L O U C E S T E R
EXPLANATION
OUTCROP AREA OF THE POTOMAC GROUP, RARITAN FORMATION, AND MAGOTHY FORMATION (from Owens, 1967, sheet 2)
WELL LOCATION
LINE OF EQUAL DISSOLVED-MANGANESECONCENTRATION-Dasned where approximately located. Interval, in micrograms per liter, is variable
Base modified from U.S. Geological Survey digital data, 1:100,000, 1983, Universal Transverse Mercator projection, Zone 18
(Contours in Philadelphia, Pennsylvania, modified from Paulachok, 1991)
Figure 41 .--Concentrations of dissolved manganese in water from the lower aquifer, Potomac- Raritan-Magothy aquifer system, Philadelphia-Camden area, 1980-86.
75

75° 15' 75°00'
P H I L A D E L P H T
G L O U C B S 1
EXPLANATION
OUTCROP AREA OF THE POTOMAC GROUP, RARITAN FORMATION, AND MAGOTHY FORMATION (from Owens, 1967, sheet 2)
WELL LOCATION
_ LINE OF EQUAL pH--Dashed whereapproximately located. Interval 0.5 pH unit
50' ^~
39 _______________________45 Base modified from U.S. Geological Survey digital
data, 1:100,000, 1983, Universal Transverse Mercator projection, Zone 18
(Contours in Philadelphia, Pennsylvania, modified from Paulachok, 1991)
Figure 42.-- Areal variations in pH of water from the lower aquifer, Potomac-Raritan- Magothy aquifer system, Philadelphia-Camden area, 1980-86.
76

75° 15' 39° 40'
10' 5'' 75°00'
55'
50'
P II I L A D E L P H T A x ; : : : v^
GLOUCESTERV
/ EXPLANATION
o 1i I
V
4 MILES25
0 1 3 4 KILOMETERS
OUTCROP AREA OF THE POTOMAC GROUP, RARITAN FORMATION, AND MAGOTHY FORMATION (from Owens, 1967, sheet 2)
WELL LOCATION
LINE OF EQUAL DISSOLVED-SULFATE CONCENTRATION-Dashed where approximately located. Interval, in milligrams per liter, is variable
45 Base modified from U.S. Geological Survey digital data, 1:100,000, 1983, Universal Transverse Mercator projection, Zone 18
(Contours in Philadelphia, Pennsylvania, modified from Paulachok, 1991)
Figure 43.--Concentrations of dissolved sulfate in water from the lower aquifer, Potomac-Raritan- Magothy aquifer system, Philadelphia-Camden area, 1980-86.
77

200
a:UJt 150
co
O CO CO
100
= 50
1960 1963 1966 1969 1972 1975 1978 1961 1984
DATE SAMPLED
O
§K
2 UJ O O.
I!O C5 CO Ijo =!
CO COo
600
500
400
300
200
? 100
1960 1963 1966 1969 1972 1975 1978 1981 1984
DATE SAMPLED
IjjjUJ QC
gK 8^
IIS5
20,000
15,000
10,000
5,000
co COo
1960 1963 1966 1969 1972 1975 1978 1981 1984
DATE SAMPLED
g 300
Z £ 250
^^R uj 200
so 2
oCOco o
150
100
50
1960 1963 1966 1969 1972 1975 1978 1981 1984
DATE SAMPLED
1960 1963 1966 1969 1972 1975 1978 1981 1984
DATE SAMPLED
Figure 44.~Temporal change in selected water-quality characteristics of water from well 15-323. (Location of well shown in fig. 10.)
78

Presence of Purgeable Organic Compounds and Locations of Hazardous -Waste Sites
POC's are an operationally defined subset of compounds on the USEPA priority pollutant list (Keith and Telliard, 1979) that can be isolated and concentrated by purge and trap devices. Sources of POC's to ground water in the study area include surface spills of hazardous materials, waste lagoons, storage-tank leaks, landfills, ground-water recharge from contaminated surface water, and overland runoff. Data on POC's in ground water are presented on an aquiferwide basis in this report. Site-specific incidences of contamination are not examined; rather, an overview of the general distribution of POC's in the aquifer system is provided.
Wells in the Potomac-Raritan-Magothy aquifer system were sampled by the USGS for POC's in 1980, 1982, 1985, and 1986. Fusillo and others (1985) describe the distribution of these compounds in the aquifers in relation to the outcrop area of the aquifer system for the period 1980-82. The distribution of POC's was found to be limited mainly to water from the outcrop area of the aquifer system. Twenty percent of the water samples collected from 315 wells during 1980-82 contained detectable concentrations of POC's. The highest percentage of detections among the aquifers, 28 percent, was found in the lower aquifer. Detectable concentrations of POC's were found in 22 percent of the water samples from the middle aquifer and in 10 percent of the water samples from the upper aquifer. Concentrations of POC's greater than 100 jug/L in water from the lower aquifer were attributed to the aquifer's position beneath the most heavily urbanized part of the outcrop area. In addition, contaminants are contributed through leakage from the middle aquifer, as indicated by superposition of concentrations greater than 100 /Jg/L in the lower and middle aquifers. The outcrop of the upper aquifer is the least urbanized; and water samples from this area contained little or no contamination.
Water from 27 wells of the 103 wells sampled during 1985-86 contained detectable concentrations of POC's. Results similar to those found by Fusillo and others (1985) were obtained when these data were subdivided by aquifer. Detectable concentrations of POC's were found in water samples from 13 wells screened in the lower aquifer, 9 wells screened in the middle aquifer, and 5 wells screened in the upper aquifer. Distribution of total POC's in water from each aquifer in 1980-86 are shown in figures 45-47. Few samples from the middle and lower aquifers in which POC's were detected were from outside the outcrop area, whereas four samples from the the upper aquifer in which POC's were detected were from the downdip, confined part of the system. Distributions of trihalomethanes, aromatic organic compounds, and chlorinated solvents in water from the upper, middle, and lower aquifers are shown in figures 48-52.
A summary of data on POC's for 1980-86 is given in table 10. Compounds detected in water samples are trichloroethylene, chlorobenzene, benzene, and ethyl benzene. By comparison, Fusillo and others (1985) found that trichloroethylene, tetrachloroethylene, and benzene were the most frequently detected compounds in water from wells sampled during 1980-82. Differences in the spatial distribution -of the data sets might account for variations in the most commonly found POC's. Sampling in 1980-82 was concentrated in and near
79

40° 15'
40° 00'
39° 45'
75°30' 15' 75°00'
EXPLANATION
OUTCROP AREA OF THE POTOMAC GROUP, RARITAN FORMATION, AND MAGOTHY FORMATION (from Owens, 1967, sheet 2)
LOCATION OF WELL WHERE GROUND WATER HAS A CONCENTRATION OF PURGEABLE ORGANIC COMPOUNDS FROM 1 TO 100 MICROGRAMS PER LITER
74°45'
BUCKS.
0 LOCATION OF WELL WHERE GROUND WATER HAS A CONCENTRATION OF PURGEABLE ORGANIC COMPOUNDS FROM 100 TO 1,000 MICROGRAMS PER LITER ,.-.-'. ^£<
10 MILES PHILADELPHIA
10 KILOMETERS
DELAWARE
BURLINGTON
NEW JERSEY
CAMDEN
GLOUCESTER
>./ SALEM ATLANTIC
Base modified from U.S. Geological Survey digital data, 1:100,000, 1983, Universal Transverse Mercator projection, Zone 18
Figure 45.--Concentrations of total purgeable organic compounds in water from the upper aquifer, Potomac-Raritan-Magothy aquifer system, 1980-86.
80

40° 15'
75°30'
40° 00'
39° 45'
15'
EXPLANATION
75°00' 74°45'
OUTCROP AREA OF THE POTOMAC GROUP, RARITAN FORMATION, AND MAGOTHY FORMATION (from Owens, 1967, sheet 2)
_ LOCATION OF WELL WHERE GROUND WATER HAS A CONCENTRATION * OF PURGEABLE ORGANIC COMPOUNDS FROM 1 TO 100 MICROGRAMS
PER LITER
0 LOCATION OF WELL WHERE GROUND WATER HAS A CONCENTRATION: OF PURGEABLE ORGANIC COMPOUNDS FROM 100 TO 1,000 MICROGRAMS PER LITER ,.-. : :££#
BUCKS:
LOCATION OF WELL WHERE GROUND WATER HAS A CONCENTRATION OF PURGEABLE ORGANIC COMPOUNDS GREATER THAN 1,000 ^V MICROGRAMS PER LITER or^
10 MILES
10 KILOMETERS
DELAWARE
BURLINGTON
NEW JERSEY
CAMDEN
GLOUCESTER
SALEM /ATLANTIC
Base modified from U.S. Geological Survey digital data, 1:100,000, 1983, Universal Transverse Mercator projection, Zone 18
Figure 46.~Concentratipns of total purgeable organic compounds in water from the middle aquifer, Potomac-Raritan-Magothy aquifer system, 1980-86.
81

40° 15'
40° 00'
39°45'
75°30' 15' 75°00'
EXPLANATION
OUTCROP AREA OF THE POTOMAC GROUP, RARITAN FORMATION, AND MAGOTHY FORMATION (from Owens, 1967, sheet 2) BUCKS
LOCATION OF WELL WHERE GROUND WATER HAS A CONCENTRATION -' : <'' ' OF PURGEABLE ORGANIC COMPOUNDS FROM 1 TO 100 MICROGRAMS ... .-:-:->X-:PER LITER ::: ::: r::-
74°45'
0 LOCATION OF WELL WHERE GROUND WATER HAS A CONCENTRATION ' ' ' OF PURGEABLE ORGANIC COMPOUNDS FROM 100 TO 1,000 1: MICROGRAMS PER LITER . ; : : :-: ^
LOCATION OF WELL WHERE GROUND WATER HAS A CONCENTRATION OF PURGEABLE ORGANIC <n COMPOUNDS GREATER THAN 1,000 <AJ> MICROGRAMS PER LITER OX-T
10 MILES
10 KILOMETERS
DELAWARE
BURLINGTON
NEW JERSEY
CAMDEN
GLOUCESTER
SALEM ATLANTIC
Base modified from U.S. Geological Survey digital data, 1:100,000, 1983, Universal Transverse Mercator projection, Zone 18
Figure 47.--Concentrations of total purgeable organic compounds in water from the lower aquifer, Potomac-Raritan-Magothy aquifer system, 1980-86.
82

40° 15'
40° 00'
39° 45'
75°30' 15' 75°00'
EXPLANATION
OUTCROP AREA OF THE POTOMAC GROUP, RARITAN FORMATION, AND MAGOTHY FORMATION (from Owens, 1967, sheet 2)
LOCATION OF WELL WHERE GROUND WATER CONTAINS DETECTABLE CONCENTRATION OF CHLORINATED VOLATILE ORGANIC COMPOUNDS
LOCATION OF WELL WHERE GROUND WATER CONTAINS DETECTABLE CONCENTRATION OF AROMATIC VOLATILE ORGANIC COMPOUNDS
LOCATION OF WELL WHERE GROUND WATER CONTAINS DETECTABLE CONCENTRATION OF TRIHALOMETHANE VOLATILE ORGANIC COMPOUNDS ,\
10 MILES ^ .-'.A
10 KILOMETERS
DELAWARE
74°45'
BUCKS:
O
BURLINGTON
NEW JERSEY
GLOUCESTER CAMDEN
SALEM ATLANTIC
Base modified from U.S. Geological Survey digital data, 1:100,000, 1983, Universal Transverse Mercator projection, Zone 18
Figure 48.~Chlorinated solvents, aromatic organic compounds, and trihalomethanes in water from the upper aquifer, Potomac-Raritan-Magothy aquifer system, 1980-86.
83

40° 15'
40° 00'
39°45'
75°30' 15'
EXPLANATION
OUTCROP AREA OF THE POTOMAC GROUP, RARITAN FORMATION, AND MAGOTHY FORMATION (from Owens, 1967, sheet 2)
75°00' 74°45'
BUCKS:
10 MILES
10 KILOMETERS
DELAWARE
BURLINGTON
NEW JERSEY
CAMDHN
GLOUCESTER
SALEM ATLANTIC
Base modified from U.S. Geological Survey digital data, 1:100,000, 1983, Universal Transverse Mercator projection. Zone 18
Figure 49.--Chlorinated solvents in water from the middle aquifer, Potomac- Raritan-Magothy aquifer system, 1980-86.
84

40° 15'
40° 00'
39° 45'
75°30' 15' 75°00'
EXPLANATION
OUTCROP AREA OF THE POTOMAC GROUP, RARITAN FORMATION, AND MAGOTHY FORMATION (from Owens, 1967, sheet 2)
LOCATION OF WELL WHERE GROUND WATER CONTAINS DETECTABLE CONCENTRATION OF AROMATIC VOLATILE ORGANIC COMPOUNDS
LOCATION OF WELL WHERE GROUND WATER CONTAINS (DETECTABLE CONCENTRATION OF TRIHALOMETHANEVOLATILE ORGANIC COMPOUNDS . :
10 MILES
5 10 KILOMETERS
DELAWARE
74°45'
BURLINGTON
NEW JERSEY
GLOUCESTER CAMDEN
SALEM ATLANTIC"-
Base modified from U.S. Geological Survey digital data, 1:100,000, 1983, Universal Transverse Mercator projection, Zone 1B
Figure 50.--Aromatic organic compounds and trihalomethanes in water from the middle aquifer, Potomac-Raritan-Magothy aquifer system, 1980-86.
85

40° 15'
40° 00'
39° 45'
75°30' 15' 75°00'
EXPLANATION
OUTCROP AREA OF THE POTOMAC GROUP, RARITAN FORMATION, AND MAGOTHY FORMATION (from Owens, 1967, sheet 2)
LOCATION OF WELL WHERE GROUND WATER CONTAINS DETECTABLE CONCENTRATION OF CHLORINATED SOLVENTS
74°45'
BUCKS:
10 MILES
I10 KILOMETERS PHILADELPHIA:
DELAWARE
BURLINGTON
NEW JERSEY
GLOUCESTER CAMDEN
SALEM ATLANTIC
Base modified from U.S. Geological Survey digital data, 1:100,000, 1983, Universal Transverse Mercator projection, Zone 18
Figure 51 .--Chlorinated solvents in water from the lower aquifer, Potomac- Raritan-Magothy aquifer system, 1980-86.
86

40° 15'
40° 00'
39° 45'
~ u
75°30' 15' 75°00'
EXPLANATION
OUTCROP AREA OF THE POTOMAC GROUP, RARITAN FORMATION, AND MAGOTHY FORMATION (from Owens, 1967, sheet 2)
LOCATION OF WELL WHERE GROUND WATER CONTAINS DETECTABLE CONCENTRATION OF AROMATIC VOLATILE ORGANIC COMPOUNDS
LOCATION OF WELL WHERE GROUND WATER CONTAINS DETECTABLE CONCENTRATION OF TRIHALOM ETHANE VOLATILE ORGANIC COMPOUNDS ..-.-:
74°45'
BUCKS:
LOCATION OF WELL WHERE GROUND WATER CONTAINS DETECTABLE CONCENTRATION OF TRIHALOMETHANE \ VOLATILE ORGANIC COMPOUNDS-Analysis ^y performed at Trenton, N.J., laboratory <\V. ',^:-
10 MILES
5 10 KILOMETERS
DELAWARE
BURLINGTON
NEW JERSEY
GLOUCESTER CAMDEN
SALEM /ATLANTIC'
Base modified from U.S. Geological Survey digital data, 1:100,000, 1983, Universal Transverse Mercator projection, Zone 18
Figure 52.--Aromatic organic compounds and trihalomethanes in water from the lower aquifer, Potomac-Raritan-Magothy aquifer system, 1980-86.
87

Table 10.--Summary of data on purgeable organic compounds in water from the Potomac-Raritan-Magothy aquifer system. 1980-86
[POC, purgeable organic compound; detection limit is 3 micrograms per liter; /zg/L, micrograms per liter]
Samples containing POC
Compoundname
BenzeneCarbon TetrachlorideChlorobenzeneChloroethaneChloroformDichlorobromome thaneEthlybenzeneMethylenechlorideTetrachloroethyleneTolueneTrichloroethyleneTrichlorofluorome thaneVinyl Chloride1 , 1-Dichloroethylene1 , 1-Dichloroethane1,1, 1 -Tr ichloroethane1 , 2 - Dichloroethane1, 2-Dichloropropane1,2- Dichloroethylene
Totalnumber
ofsamples
356355198178354355199355355356355198178198355355355198355
concentrationsgreater
detectionthanlimit
Number Percentage
314
191
172
17212925462
13101615244
30
8.71.19.6
<14.8
<18.55.98.27.0
1317.35.04.54.26.828.4
POCconcentration ,in microgramsper
Median
57.014519<38.46.8
4327121826142110.5231929.519.530.5
literMaximum
43,000380620
72,700
8.8680
3,800820
12,0005,040
25393120200
1,6001,200
305,480

the outcrop area of the Potomac-Raritan-Magothy aquifer system, whereas sampling in 1985-86 extended farther downdip. The six most prevalent POC's in ground water in the Philadelphia area, in descending order of concentration, are 1,1,1-trichloroethane, chloroform, tetrachloroethylene, trichloroethylene, 1,2-dichloroethane, and 1,2-dichloropropane (Paulachok, 1991).
The most extensively industrialized part of the study area overlies the outcrop of the Potomac-Raritan-Magothy aquifer system along the Delaware River. Aquifers beneath the outcrop area are among the most vulnerable to contamination in the aquifer system, because confining beds are thin or absent (Zapecza, 1984) and because potentiometric-head gradients are generally downward into the confined parts of the aquifers (Eckel and Walker, 1986).
The locations of seven National Priority List (NPL) sites, also known as Superfund sites, are shown in figure 53. Also shown are 105 additional hazardous-waste sites documented in New Jersey State files as of 1986 (Britton, 1984). Additional sites of potential ground-water contamination exist in the study area; the sites shown, however, have the potential for the greatest effect on the quality of water in the aquifers of the Potomac- Raritan-Magothy aquifer system because of their location in or near the outcrop area. Potential sites of ground-water contamination in Pennsylvania are not shown in figure 53; however, any such sites located in the outcrop area on the Pennsylvania side of the Delaware River also could potentially affect the quality of water in the aquifer system in New Jersey.
SUMMARY AND CONCLUSIONS
This report describes the regional ground-water quality in the upper, middle, and lower aquifers of the Cretaceous Potomac-Raritan-Magothy aquifer system in west-central New Jersey and documents vertical differences in water quality in the three aquifers.
Five types of ground-water zones were located by use of Back's (1966) concept of hydrochemical facies: zones of ground-water recharge, zones of active ground-water flow, zones of ground-water discharge, zones of salt-water intrusion, and a zone of little flow. These zones are related to the regional flow patterns in the Potomac-Raritan-Magothy aquifer system.
Distribution of selected chemical constituents (dissolved solids, dissolved sodium, dissolved chloride, dissolved iron) and pH in water from each aquifer were examined areally. In general, the water in the aquifer system was found to be suitable for human consumption and most other uses, except in areas where contamination is localized and in areas where dissolved- iron concentrations in and near the outcrops are elevated.
The distribution of sodium in water from the Potomac-Raritan-Magothy aquifer system indicates increasing concentrations toward the southwestern part of the study area. Water from wells in Burlington and Camden Counties generally contained low concentrations of sodium (<25 mg/L), although some samples from the outcrop area contained higher concentrations, indicating possible contamination and (or) saltwater intrusion. Areas in which concentrations exceeded the NJGW2 standard of 50 mg/L include parts of Gloucester County, Salem County, and Philadelphia. The largest extent of sodium concentrations greater than 50 mg/L was found in the lower aquifer.
89

40° 15'
40° 00'
39° 45'
75°30' 15'
EXPLANATION
OUTCROP AREA OF THE POTOMAC GROUP, RARITAN FORMATION, AND MAGOTHY FORMATION (from Owens, 1967, sheet 2)
LOCATION OF SUPERFUND SITES
LOCATION OF NON-NATIONAL PRIORITY LIST SITES
75°00'
10 MILES
10 KILOMETERS PHILADELPHIA;;:-
DELAWARE
.-. ,>; :, v-o.
M& :*-'.-ox-.-:*
:;SP-
74°45'
. X-X-'l'l&X-'X-cy:BUCK$-x-:-^.:-V.-"yo
k^~;®
' $ .;. o "'o
BURLINGTON
NEW JERSEY
CAMDEN
GLOUCESTER
>,X° SALEM ATLANTIC
Base modified from U.S. Geological Survey digital data, 1:100,000, 1983, Universal Transverse Mercator projection, Zone 18
Figure 53.~National Priority List sites and other hazardous-waste sites within 1 mile of the Potomac-Raritan-Magothy outcrop area in New Jersey.
90

Chloride and dissolved-solids concentrations in a few samples in the study area exceeded the SMCL of the USEPA (1986) of 250 and 500 mg/L, respectively. Like concentrations of dissolved sodium, chloride and dissolved solids concentrations were elevated in water from wells in Gloucester and Salem Counties and in areas of possible contamination and (or) saltwater intrusion.
Dissolved-iron concentrations exceeded the SMCL of the USEPA (1986) of 300 pg/L in many of the water samples from the Potomac-Raritan-Magothy aquifer system, particularly those from the outcrop area. These high iron concentrations are a major ground-water-quality problem, and many wells have been abandoned in affected areas because screens or pumps have become clogged by iron. In general, dissolved-iron concentrations greater than 300 Mg/L also indicate high dissolved-manganese concentrations in the water from the confined parts of the Potomac-Raritan-Magothy aquifer system. This relation holds true for the middle and lower aquifers.
The areal distribution of pH in water from the Potomac-Raritan-Magothy aquifer system shows that, in general, pH increases with increasing distance downdip from the outcrop area. Water in the upper aquifer is more alkaline than the water in the other aquifers and has fewer samples outside the SMCL of the USEPA (1986) range of 6.5 to 8.5. The pH of the majority of water samples from the middle and lower aquifers is less than 6.5 and, therefore, is outside the SMCL of the USEPA (1986) range.
Examination and interpretation of ground-water chemistry, ground-water- flow, and potentiometric-head relations reveals an anomalous area in the middle and lower aquifers in northeastern Camden County and northwestern Burlington County, where water is characterized by low dissolved-solids concentrations, low pH, high dissolved-oxygen concentrations, and low dissolved-iron concentrations. Vertical leakage of oxygen-rich ground water through the confining unit in the ground-water-flow system appears to be greater in this location than elsewhere in the study area. This oxygen-rich ground water probably is mixing with anoxic ground water and causing the precipitation of iron.
Examination of trace-element concentrations in water from the Potomac- Raritan-Magothy aquifer system indicates that these elements generally were present in concentrations less than MCL of USEPA (1986)'s. The most common trace-element contaminant was cadmium; however, the number of wells at which cadmium concentrations exceeded the MCL of USEPA (1986) was less than 5.
Nitrate concentrations greater than the MCL of USEPA (1986) of 10 mg/L were not common in water from the Potomac-Raritan-Magothy aquifer system; however, ammonia concentrations greater than 10 mg/L were common in samples. Most of the samples that contained ammonia concentrations greater than 10 mg/L are in or near the outcrop of the Potomac-Raritan-Magothy aquifer system and are indicative of localized contamination.
Elevated concentrations of dissolved manganese, dissolved iron, dissolved sulfate, and dissolved solids, and decreased pH values were found in water from the lower aquifer near Red Bank and Gloucester City, N.J., across the Delaware River from the U.S. Naval Base in Philadelphia. Poor-quality water could be migrating from the Philadelphia area under the Delaware River to the
91

New Jersey parts of the aquifers in response to changes in potentiometric head distribution, although the exact origin of the elevated concentrations is unknown. Other possible sources of elevated concentrations of dissolved manganese, dissolved iron, and dissolved solids include leaching of constituents from the aquifer matrix by ground water containing low concentrations of dissolved oxygen and low pH values and (or) downward migration of chemical constituents in ground water in the Potomac-Raritan- Magothy aquifer system outcrop.
Results of analyses for POC's in water from the Potomac-Raritan-Magothy aquifer system indicate that most samples in which POC's were detected were from wells in or near the outcrop of the aquifer system. Water samples from the lower aquifer had a higher incidence of POC with concentrations greater than 100 /^g/L than did samples from the other aquifers. This contamination is a result of the location of the outcrop of the aquifer beneath the most extensively urbanized section of the area, and leakage from the upper and middle aquifers through discontinuous confining units. Seven NPL sites are located in or within 1 mile of the generalized Potomac-Raritan-Magothy aquifer system outcrop.
Potential threats to the quality of the ground water in the Potomac- Raritan-Magothy aquifer system in the study area include (1) the flow of saline, downdip water toward production wells as a result of pumping; (2) the intrusion of saline water from the Delaware River estuary in response to drought or rising sea level; (3) the possible migration of poor-quality water underneath the Delaware River from Philadelphia in response to the regional cone of depression and changes in potentiometric-head relations; and (4) continued contamination of ground water in and near the outcrop as a result of human activities.
92

REFERENCES CITED
Anderson, P.W., Faust, S.D., and McCall, J.E., 1972, Impact of drought on New Jersey's water resources: Journal of the Irrigation and Drainage Division, American Society of Civil Engineers, v. 98, no. IR3, Proceedings Paper 9205, p. 375-385.
Back, William, 1966, Hydrochemical facies and ground-water flow patterns in the northern part of Atlantic Coastal Plain: U.S. Geological Survey Professional Paper 498-A, 42 p.
Barksdale, H.C., Greenman, D.W., Lang, S.M., Hilton, G.S., and Outlaw, D.E., 1958, Ground-water resources in the tri-state region adjacent to the lower Delaware River: New Jersey Department of Conservation and Economic Development Special Report 13, 190 p.
Britton, C.L., compiler, 1984, New Jersey ground-water pollution index:September 1974 - April 1984: New Jersey Geological Survey Open-File Report 84-1, 143 p.
Delaware River Basin Commission, 1983, Resolution 83-11--A resolution to amend the Comprehensive Plan relating to criteria for defining drought warning and drought conditions, and to a schedule of phased reductions in diversions, releases and flow objectives during such periods: West Trenton, N.J., Delaware River Basin Commission, June 29, 1983.
Delaware Valley Regional Planning Commission, 1979, 208 water qualitymanagement report on alternatives, Burlington, Camden and Gloucester Counties, New Jersey: Philadelphia, Pa., Delaware Valley Regional Planning Commission, 137 p.
Eckel, J.A., and Walker, R.L., 1986, Water levels in the major artesianaquifers of the New Jersey Coastal Plain, 1983: U.S. Geological Survey Water-Resources Investigations Report 86-4028, 62 p.
Farlekas, G.M., Nemickas, Bronius, and Gill, H.E., 1976, Geology and ground- water resources of Camden County, New Jersey: U.S. Geological Survey Water-Resources Investigations Report 76-76, 146 p.
Feth, J.H., 1981, Chloride in natural continental water--A review: U.S. Geological Survey Water-Supply Paper 2176, 30 p.
Fishman, M.J., and Friedman, L.C., 1989, Methods for determination ofinorganic substances in water and fluvial sediments: U.S. Geological Survey Techniques of Water-Resources Investigations, book 5, chap. Al, 545 p.
Freeze, R.A., and Cherry, J.A., 1979, Ground water: Englewood Cliffs, N.J., Prentice-Hall, 604 p.
Friedman, L.C., and Erdmann, D.E., 1982, Quality assurance practices for the chemical and biological analysis of water and fluvial sediments: U.S. Geological Survey Techniques of Water-Resources Investigations, book 5, chap. A6, 181 p.
93

REFERENCES CITED- -Continued
Fusillo, T.V., and Voronin, L.M., 1981, Water-quality data for the Potomac-Raritan-Magothy aquifer system, Trenton to Pennsville, New Jersey: U.S. Geological Survey Open-File Report 81-814, 38 p.
Fusillo, T.V., Hochreiter, J.J., Jr., and Lord, D.G., 1984, Water-quality data for the Potomac-Raritan-Magothy aquifer system in southwestern New Jersey, 1923-83: U.S. Geological Survey Open-File Report 84-737, 127 p.
____ 1985, Distribution of volatile organic compounds in a New Jersey Coastal Plain aquifer system: Ground Water, v. 23, no. 3, p. 354-360.
Graham, J.B., and Kammerer, J.C., 1952, Ground-water resources of the United States Naval Base, Philadelphia, Pennsylvania: U.S. Geological Survey Open-File Report, unnumbered, 137 p.
Greenman, D.W., Rima, D.R., Lockwood, W.N., andMeisler, Harold, 1961, Ground- water resources of the Coastal Plain area of southeastern Pennsylvania: Pennsylvania Geological Survey Bulletin, 4th series, W 13, 375 p.
Hantush, M.S., 1960, Modification of the theory of leaky aquifers: Journal of Geophysical Research, v. 65, no. 11, p. 3713-3725.
Hardt, W.F., and Hilton, G.S., 1969, Water resources and geology of Gloucester County, New Jersey: New Jersey Department of Conservation and Economic Development Special Report 30, 130 p.
Harbaugh, A.W., Luzier, J.E., and Stellerine, Flavian, 1980, Computer-modelanalysis of the use of Delaware River water to supplement water from the Potomac-Raritan-Magothy aquifer system in southern New Jersey: U.S. Geological Survey Water-Resources Investigations Report 80-31, 41 p.
Heath, R.C., 1984, Basic ground-water hydrology: U.S. Geological Survey Water-Supply Paper 2220, 84 p.
Hem, J.D., 1985, Study and interpretation of the chemical characteristics of natural water (3d ed): U.S. Geological Survey Water-Supply Paper 2254, 263 p.
Hochreiter, J.J., Jr., 1982, Chemical-quality reconnaissance of the water and surficial bed material in the Delaware River estuary and adjacent New Jersey tributaries, 1980-81: U.S. Geological Survey Water-Resources Investigations Report 82-36, 41 p.
Hoffman, J.S., Keyes, D., and Titus, J.G., 1983, Predicting future sea level rise: Methodology, estimates to the year 2100, and research needs, 2d ed.: Environmental Protection Agency, Office of Policy and Resource Management, 121 p.
Keith, L.H., and Telliard, W.A., 1979, Priority pollutants I - a perspective view: Environmental Science and Technology, v. 13, no. 4, April 1979, p. 416-419.
94

REFERENCES CITED--Continued
Langmuir, Donald, 1969, Iron in ground waters of the Magothy and RaritanFormation in Camden and Burlington Counties, New Jersey: State of New Jersey Department of Conservation and Economic Development, Division of Water Policy and Supply Water Resources Circular 19, 49 p.
Lohman, S.W., and others, 1972, Definitions of selected ground-water terms- Revisions and conceptual refinements: U.S. Geological Survey Water- Supply Paper 1988, 21 p.
Luzier, J.E., 1980, Digital-simulation and projection of head changes in the Potomac-Raritan-Magothy aquifer system, Coastal Plain, New Jersey: U.S. Geological Survey Water-Resources Investigations Report 80-11, 72 p.
Martin, Mary, 1990, Ground-water flow in the New Jersey Coastal Plain aquifers: U.S. Geological Survey Open-File Report 87-528, 182 p.
McAuley, S.D., and Kendall, Carol, 1989, Use of deuterium and oxygen-18 totrace the induced infiltration of Delaware River water into the Potomac- Raritan-Magothy aquifer system, Camden area, New Jersey, in Pederson, G.L., and Smith, M.M., compilers, U.S. Geological Survey Second National Symposium on Water Quality--Abstracts of the technical sessions, Orlando, Florida, November 12-17, 1989: U.S. Geological Survey Open-File Report 89-409, p. 56.
Meisler, Harold, Leahy P.P., and Knobel, L.L., 1984, Effect of eustatic sea- level changes on saltwater-freshwater relations in the northern Atlantic Coastal Plain: U.S. Geological Survey Water-Supply Paper 2255, 28 p.
Meisler, Harold, 1989, The occurrence and geochemistry of salty ground water in the northern Atlantic Coastal Plain: U.S. Geological Survey Professional Paper 1404-D, 51 p.
Myers, W.S., 1899, Chlorine in the natural waters of the State, in Smock, J.C., ed., Annual report of the State Geologist for the year of 1899, Geological Survey of New Jersey, 192 p.
Owens, J.P., 1967, Engineering geology of the northeast corridor, Washington, D.C., to Boston, Massachusetts--Coastal Plain and surficial deposits: U.S. Geological Survey Miscellaneous Geologic Investigations Map I-514-B, scale 1:250,000 and 1:1,500,000, 8 sheets.
Owens, J.P., and Sohl, N.F., 1969, Shelf and deltaic paleo-environments in the Cretaceous-Tertiary formations of the New Jersey Coastal Plain, in Subitzky, Seymour, ed., Geology of the selected areas in New Jersey and eastern Pennsylvania and guidebook of excursions--Geological Society of America and associated societies, November 1969, Annual Meeting, Atlantic City, N.J.: New Brunswick, N.J., Rutgers University Press, p. 235-278.
Parker, G.G., Hely, A.G, Keighton, W.B., Olmsted, F.H., and others, 1964, Water resources of the Delaware River basin: U.S. Geological Survey Professional Paper 381, 200 p.
95

REFERENCES CITED--Continued
Paulachok, G.N., 1991, Geohydrology and ground-water resources ofPhiladelphia, Pennsylvania: U.S. Geological Survey Professional Paper 2346, 79 p.
Rosenau, J.C., Lang, S.M., Hilton, G.S., and Rooney, J.G., 1969, Geology and ground-water resources of Salem County, New Jersey: New Jersey Department of Conservation and Economic Development Special Report 33, 142 p.
Rush, F.E., 1968, Geology and ground-water resources of Burlington County, New Jersey: New Jersey Department of Conservation and Economic Development, Division of Water Policy and Supply Special Report 26, 65 p.
Schaefer, F.L., 1983, Distribution of chloride concentrations in the principal aquifers of the New Jersey Coastal Plain, 1977-81: U.S. Geological Survey Water-Resources Investigations Report 83-4061, 56 p.
Seaber, P.R., 1963, Chloride concentrations of water from wells in theAtlantic Coastal Plain of New Jersey, 1923-61: New Jersey Department of Conservation and Economic Development, Division of Water Policy and Supply Special Report 22, 250 p.
Stumm, Werner, and Morgan, J.J., 1981, Aquatic chemistry--An introductionemphasizing chemical equilibria in natural waters: New York, John Wiley and Sons, 780 p.
Thompson, D.G., 1932, Ground-water supplies of the Camden area, New Jersey:New Jersey Department of Conservation and Economic Development, Division of Water Policy and Supply Bulletin 39, 80 p.
U.S. Environmental Protection Agency, 1982, Methods for organic chemical analysis of municipal and industrial wastewater: Environmental Monitoring and Support Laboratory, USEPA 600/4-82-057 (unpaged).
____ 1986, Quality criteria for water, 1986: Washington, D.C., U.S. Environmental Protection Agency, Office of Water Regulations and Standards, USEPA-440/5-86-001, 398 p.
Vecchioli, John, and Palmer, M.M., 1962, Ground-water resources of MercerCounty, New Jersey: New Jersey Department of Conservation and Economic Development Special Report 19, 71 p.
Vowinkel, E.F., and Foster, W.K., 1981, Hydrogeologic conditions in theCoastal Plain of New Jersey: U.S. Geological Survey Open-File Report 81-405, 39 p.
Walker, R.L., 1983, Evaluation of water levels in major aquifers of the New Jersey Coastal Plain, 1978: U.S. Geological Survey Water-Resources Investigations Report 82-4077, 56 p.
96

REFERENCES CITED- - Continued
Winograd, I.J., and Farlekas, G.M., 1974, Problems in 14 C dating of water from aquifers of deltaic origin--An example from the New Jersey Coastal Plain, in Isotope techniques in ground water hydrology: Vienna, International Atomic Energy Agency, v. 2, p. 69-93.
Zapecza, O.S., 1989, Hydrogeologic framework of the New Jersey Coastal Plain: U.S. Geological Survey Professional Paper 1404-B, 49 p., 24 pis.
97

Table 2.--Records of wells sampled. Potomac-Raritan-Magothy aquifer system. 1985-86
Well number
5- 395- 405- 605- 765- 89
5- 915- 975-1005-1245-125
5-1675-1875-2615-2845-393
5-6585-6675-7585-7805-822
5-8237- 87- 127- 187- 30
7- 467- 647- 987-1227-124
7-1347-1437-1477-1837-189
7-2217-2497-2737-2747-278
7-2837-3027-3047-3157-329
7-3417-3457-3507-3547-367
7-3697-3727-3797-3867-412
7-4777-5277-5287-5457-555
7-5667-5677-5717-5867-602
Local well identifier
NJ WC-DEL VALLEY WC 15NJ WC-DEL VALLEY WC 16BURLINGTON CITY WC 2HEAL, CHARLESTENNECO CHEM 7
TENNECO CHEM 4HERCULES POWDER 1HERCULES POWDER 2NJ WC-DEL VALLEY WC-STPHENNJ WC-DEL VALLEY WC 11
EVESHAM MUA 5FLORENCE TWP WD 4USGS-MEDFORD 5 DBSMOORESTOWN TWP WD 4RIVERSIDE INDUSTRY 39
WILLINGBORO MUA 7WILLINGBORO MUA 5TENNECO CHEM 10WASTE RESOURCE DBS 6MT LAURAL MUA 3
MT LAURAL MUA 4BELMAWR BORO WD 1BELMAWR BORO WD 3BERLIN BORO WD 9SJ PORT COMM NY SHIP 5A
CAMDEN CITY WD-CITY 11CAMDEN CITY WD-CITY 17NEW JERSEY WC-CAMDEN 52NEW JERSEY WC-BROWN 44NEW JERSEY WC-BROWN 45
NEW JERSEY WC-OLD ORCH 37NEW JERSEY WC-ELLISBG 16NEW JERSEY WC-KINGSTN 25NEW JERSEY WC-GIBBSBO 43NEW JERSEY WC-GIBBSBO 41
USGS-GLOUC CTY CG BASE 1GARDEN ST WC-BLACKWOOD 3NEW JERSEY WC-OTTERBK 29NEW JERSEY WC-OTTERBK 39NEW JERSEY WC-HADDON 15
NEW JERSEY WC-EGBERT DBSHADDONFLD BORO WD-RULONH ADDON FLD BORO WD-LAKE STNEW JERSEY WC-MAGNOLIA 16MERCH-PENN WCOM- BROWN 2A
MERCH-PENN WCOM-DEL GN 2MERCH-PENN WCOM-PARK 5MERCH-PENN WCOM-PARK 2PETTY ISLAND DBSCAMDEN CITY WD-PUCHACK
CAMDEN CITY WD-DELAIR 2MERCH-PENN WCOM- NAT HWY 1CAMDEN CITY WD- MORRIS 10CAMDEN CITY WD- MORRIS 3ANEW JERSEY WC-ELM TREE 2
USGS-NEW BROOKLYN PK 2 DBSCAMDEN CITY WD-CITY 18CAMDEN CITY WD-PUCHACK 7CAMDEN CITY WD-MORRIS 11PENLER ANODIZING CO 1
NJDEP-HARRISON AVE 6NJDEP-HARRISON AVE 7PENNSAUKN LANDFILL MON 4CAMDEN CITY WD-MORRIS 12MERCH-PENN WCOM HWY 2
Municipal ity
BEVERLY CITYBEVERLY CITYBURLINGTON CITYBURLINGTON TWPBURLINGTON TWP
BURLINGTON TWPBURLINGTON TWPBURLINGTON TWPCINNAMINSON TWPCINNAMINSON TWP
EVESHAM TWPFLORENCE TWPMEDFORD TWPMOORESTOWN TWPRIVERSIDE TWP
WILLINGBORO TWPWILLINGBORO TWPBURLINGTON TWPCINNAMINSON TWPMOUNT LAUREL TWP
MOUNT LAUREL TWPBELLMAWR BOROBELLMAWR BOROBERLIN BOROCAMDEN CITY
CAMDEN CITYCAMDEN CITYCAMDEN CITYCHERRY HILL TWPCHERRY HILL TWP
CHERRY HILL TWPCHERRY HILL TWPCHERRY HILL TWPGIBBSBORO BOROGIBBSBORO BORO
GLOUCESTER CITYGLOUCESTER TWPGLOUCESTER TWPGLOUCESTER TWPHADDON HGTS BORO
HADDON HGTS BOROHADDONFIELD BOROHADDONFIELD BOROMAGNOLIA BOROPENNSAUKEN TWP
PENNSAUKEN TWPPENNSAUKEN TWPPENNSAUKEN TWPPENNSAUKEN TWPPENNSAUKEN TWP
PENNSAUKEN TWPPENNSAUKEN TWPPENNSAUKEN TWPPENNSAUKEN TWPVOORHEES TWP
WINSLOW TWPCAMDEN CITYPENNSAUKEN TWPPENNSAUKEN TWPCAMDEN CITY
CAMDEN CITYCAMDEN CITYPENNSAUKEN TWPPENNSAUKEN TWPPENNSAUKEN TWP
Lati tude
400404400405400538400324400409
400418400524400535395906395929
395247400703395525395936400212
400201400250400418400106395620
395615395146395221394738395447
395512395546395715395252395252
395353395441395455394945395003
395356394754395030395030395238
395246395319395404395134395628
395800395758395802395811395840
395851395902395919395933394922
394215395550395835395900395850
395718395718395912395914395917
Altitude of land Screened
Longi- surface interval tude (feet) (feet)
745520745517745053745152745247
745250744951744941750006745922
745157744832745025745452745748
745308745321745255745915745529
7455127505427506377456141750711
750640750533750519745943745943
745708750104745929745855745851
750738750343750347750347750316
750434750140750202750229750406
750417750120750118750556750307
7503557501537503027502297456301
7456171750537750302750325750230
750605750605750248750324750125
1218215010
1422223079
5030725915
1939104035
3575354511
1334188077
6840447065
1181606065
2325507816
3920121110
540161048
1140201050
1515211025
47393359100
82105105221239
45811974029854
179230
30592
59038033165087
124230147684483
4541873099231022
162426612269452
445523307428110
115248232
127
1091957573
1082
82925814010275
201024786182
- 57- 51- 49- 80- 130
- 112- 135- 135- 267- 281
- 548- 134- 750- 338- 67
- 255*- 256
114**- 50- 642
- 640- 557*- 359- 713- 104
- 154- 265- 198- 741*- 626*
- 488- 220- 367-1011-1097
- 170- 447- 712- 349- 594
- 455- 572- 372*- 510- 140
- 145- 288- 25778**- 175
- 144- 230*- 115- 103-1092
- 839- 288- 180- 144- 80
- 40- 122- 48- 117*- 206
Aqui - Year fer 2
drilled unit
19511910195219551971
19641946194619701959
19731948196719591952
19581958
19781974
19741966195619551940
19421954196519741973
19681957196119721972
19661956196519681956
19621956196719641965
19541948194319491924
19301967196019531963
19611976197519791968
19801980197919811982
MRPAUMRPAMMRPAUMRPAUMRPAM
MRPAMMRPAMMRPAMMRPALMRPAM
MRPAUMRPAMMRPAMMRPAMMRPAM
MRPAMMRPAMMRPAMMRPAMMRPAL
MRPALMRPALMRPALMRPAUMRPAU
MRPAMMRPALMRPALMRPALMRPAM
MRPAMMRPAUMRPAMMRPALMRPAL
MRPALMRPAUMRPALMRPAUMRPAL
MRPALMRPALMRPALMRPAMMRPAM
MRPAMMRPALMRPALMRPALMRPAL
MRPALMRPALMRPALMRPALMRPAL
MRPAUMRPALMRPALMRPALMRPAU
MRPAMMRPALMRPAMMRPALMRPAL
Use _ of 3 site
WWWWW
WWWWW
WW0WW
WWW0W
WWWu0
WWWWW
WWWWW
0WWWW
0WuuuWWW0W
WWWW0
0Wuuu000Wu
Use of 4 water
PPPIN
NNNPP
PPUPN
PPNUP
PPPPU
PPPPP
PPPPP
UPPPP
UPPPP
PPPUP
PPPPU
uPPPN
UUUPP
98

Table 2.--Records of wells sampled. Potomac-Raritan-Magothy aquifer system. 1985-86--Continued
Well number
15- 115- 2415- 2815- 6315- 69
15- 7915- 9715-10915-11815-130
15-19215-21015-25315-27615-282
15-28315-30815-31215-31415-323
15-33115-34215-34715-34815-374
15-38515-39015-41715-43115-439
33-187PH- 6PH -12PH -15PH -19
PH- 86H -820
Local well identifier
CLAYTON BORO WD 3DEPTFORD TWP MUA 4E GREENWICH TWP WD 2GLASSBORO BORO WD 4GREENWICH TWP WD 3
El DUPONT REPAUNO 6HERCULES CHEM GIBB 8 DBSMOBIL OIL-GREENWICH 40MOBIL OIL-GREENWICH 47SO JERSEY WC 3
MANTUA MUA 5PAULSBORO WD 6-1973WASHINGTON TWP MUA 6-64W DEPTFORD TWP WD 4W DEPTFORD TWP 5
SHELL CHEM CO 3PENWALT CORP TW 8W DEPTFORD TWP WD 6TEXACO EAGLE PT 6-PRODTEXACO EAGLE PT 3-OBS
WOODBURY WD RAILROAD 5DEL MONTE CORP 10GREENWICH TWP WD 5GREENWICH TWP WD 6DEPTFORD TWP MUA 6
PITMAN WD 4GLOUCESTER CO SEW AUTH 1S&S AUCTION HOUSE 1 1978WOODBURY CITY WD 6-81ESSEX CHEM-OLIN 2-1970
USGS-POINT AIRY DBSUS NAVY 6US NAVY 12US NAVY 15US NAVY 19
US NAVAL HOSPITALDEL VAL FISH CO INC
Municipality
CLAYTON BORODEPTFORD TWPE GREENWICH TWPGLASSBORO BOROGREENWICH TWP
GREENWICH TWPGREENWICH TWPGREENWICH TWPGREENWICH TWPHARRISON TWP
MANTUA TWPPAULSBORO BOROWASHINGTON TWPWEST DEPTFORD TWPWEST DEPTFORD TWP
WEST DEPTFORD TWPWEST DEPTFORD TWPWEST DEPTFORD TWPWEST DEPTFORD TWPWEST DEPTFORD TWP
WOODBURY CITYWOOLWICH TWPGREENWICH TWPE GREENWICH TWPDEPTFORD TWP
PITMAN BOROWEST DEPTFORD TWPLOGAN TWPWOODBURY CITYPAULSBORO BORO
PILESGROVE TWPPHILADELPHIAPHILADELPHIAPHILADELPHIAPHILADELPHIA
PHILADELPHIAPHILADELPHIA
Lati tude
393913395115394755394308394920
394944395000395027395036394408
394641394921394437394821394913
394919395044395107395153395235
394955394438394932394910394843
394345395020394820395034395048
394037395348395342395326395314
395429395633
Altitude of land Screened
Longi- surface interval 1 tude (feet) (feet)
750517750706751327750702751619
751734751636751503751501751330
751109751417750249751026751105
751256751242750946750946750950
750908751914751722751541750728
750804751340751833750842751401
751914751059751021751015751010
751050750949
133407015010
105
202035
8815
1526055
3010201520
3560202050
12510103010
72108108
835
746282191549108
84102226220234
315185584242388
358231322280255
40519282105430
9161
211215
664138
59242
11735
- 800*- 345- 216- 599- 168
- 109- 107- 259- 240- 265
- 337- 227*- 652- 288- 450
- 383- 271- 372- 318- 275
- 457- 279- 117- 135- 486
520**- 106- 71- 305- 235
- 672- 163
101- 69- 247
- 142- 55
Aqui- Year fer 2
drilled unit
19561971195619611959
19671954194619531953
19571973196419631973
19621969197319491948
19601967197719781979
19801971197819801970
19581942194419451946
19421979
MRPAUMRPAMMRPAUMRPAUMRPAM
MRPAMMRPAMMRPALMRPALMRPAU
MRPAUMRPAMMRPAUMRPAUMRPAL
MRPALMRPALMRPALMRPALMRPAL
MRPALMRPAUMRPAMMRPAUMRPAM
MRPAUMRPAUMRPAMMRPAMMRPAL
MRPALMRPALMRPAMMRPAUMRPAL
MRPALMRPAL
Use of 3 site
WWWWW
W0WWW
WWWWW
WTWW0
WWWWW
WWWWW
Wu0TT
UW
Use of 4 water
PPPPP
NUNNP
PPPPP
NUPNU
PFPPP
PNNPN
RUUUU
UQ
1 Screened interval* Multiple screens in well.
** Well depth, screened interval unknown.
2 Aquifer unitMRPAU, Potomac-Raritan-Magothy aquifer system upper aquifer. MRPAM, Potomac-Raritan-Magothy aquifer system middle aquifer. MRPAL, Potomac-Raritan-Magothy aquifer system-- lower aquifer.
3 Use of siteW, withdrawal 0, observation T, test U, unused
4 Use of waterP, public supplyI, irrigationN, industrialU, unusedF, fire ProtectionR, recreationQ, aquaculture
99

Table 3.--Changes in Potomac-Ran'tan-Magothy aquifer codes since 1984 for selected wells
Well number
5-1305-1395-1435-2745-330
5-3325-3335-3355-3365-337
5-3445-3885-3925-6515-653
5-7775-7805-7815-7887- 8
7-2117-3047-3237-3267-339
7-3407-5207-5597-5607-562
7-5667-5687-57115-10215-103
15-10715-35715-39515-41715-439
21- 9221- 9321-14721-20221-203
21-207
Local well identifier
NJ WC-DEL VALLEY WC 13HOLIDAY LAKE WORTHINGTONNJ WC-DEL VALLEY WC 23CAMPBELL SOUP 1 OBSUS ARMY-FT DIX 4
US ARMY-FT DIX 5US ARMY-FT DIX 2US AIR FORCE-MCGUIRE DUS AIR FORCE-MCGUIRE CUS AIR FORCE-MCGUIRE A
HOFFMAN-LA ROCHE CO 1974US ARMY-FT DIX 6RIVERSIDE PUB SCHOOL 1WILLINGBORO MUA 3WILLINGBORO MUA 4
HOLIDAY LK ICE CREAM STDWASTE RESOURCE OBS 6WASTE RESOURCE OBS 5C R ENGLAND COBELLMAWR BORO WD 4
GLOUCESTER CITY WD 2HADDONFLD BORO WD-LAKE STSTEVENS AND STEVENS 1MERCH-PENN WCOM-BROWN 1PREDCO PREC PANELS
MERCH-PENN WCOM-DEL GN 1BROOKLAWN BORO WD 3-61MEADOWBROOK SWIM CLUBMERCH-PENN WCOM-WDBINE 2NJDEP-HARRISON AVE 2
NJDEP-HARRISON AVE 6PENNSAUKEN LANDFILL MON 1PENNSAUKEN LANDFILL MON 4El DUPONT REPAUNO 20El DUPONT REPAUNO H
El DUPONT REPAUNO CEl DUPONT REPAUNO 7 OBSREPAUPO FIRE CO 30-1972S&S AUCTION HOUSE 1 1978ESSEX CHEM-OLIN 2-1970
CHAMPALE INC-YARDSIDEROEBLING & SONSPUB SERV E-G-DUCK ISL 1HAMILTON SQUARE WC 6CHAMPALE INC-OLD WELL
HAND WILLIAM 1-1930
Municipality
CINNAMINSON TWPDELANCO TWPDELRAN TWPMOORESTOWN TWPNEW HANOVER TWP
NEW HANOVER TWPNEW HANOVER TWPNEW HANOVER TWPNEW HANOVER TWPNEW HANOVER TWP
NORTH HANOVER TWPPEMBERTON TWPRIVERSIDE TWPWILLINGBORO TWPWILLINGBORO TWP
EDGEWATER PK TWPCINNAMINSON TWPCINNAMINSON TWPBURLINGTON TWPBELLMAWR BORO
GLOUCESTER CITYHADDONFIELD BOROPENNSAUKEN TWPPENNSAUKEN TWPPENNSAUKEN TWP
PENNSAUKEN TWPBROOKLAWN BOROPENNSAUKEN TWPMRCHNTVILLE BOROCAMDEN CITY
CAMDEN CITYPENNSAUKEN TWPPENNSAUKEN TWPGREENWICH TWPGREENWICH TWP
GREENWICH TWPGREENWICH TWPGREENWICH TWPLOGAN TWPPAULSBORO BORO
TRENTON CITYTRENTON CITYHAMILTON TWPHAMILTON TWPTRENTON CITY
WEST WINDSOR TWP
Lati tude
400002400204400105395841395949
400106400129400141400150400216
400546395939400158400139400152
400203400106400059400540395146
395345395404395608395627395743
395752395251395815395652395709
395718395921395912395016395021
395025394957394801394820395048
401152401156401026401353401153
401607
Altitude of land Screened
Longi- surface interval tude (feet) (feet)
750044745541745734745905743655
743720743656743525743428743607
743446743742745710745325745435
745532745915745924744847750542
750653750202750438750404750448
750411750732750150750307750615
750605750210750248751738751730
751757751737751759751833751401
744528744506744344743953744527
743553
70253640140
150131110102122
136160202828
4040374575
1150182532
5010505015
15262132
24
201010
273010
10027
100
167-188-118-241-1056-
1064-1030-1012-1036-992-
783-1090-
90-203-177-
40-30-30-45-
380-
141-307-74-
107-
97-307-97-196-26-
20-59-47-73-83-
75-
93-61-
215-
70-125-43-
90-
1981981682621086
11041051107510891055
814*1140100304*280
50505053
557*
171372*84137108**
12332710722646
406048103103
105105**11371
235
8014763228**90**
95
Old Updated Year aquifer 2 aquifer 2
drilled unit unit
19631958196419581943
19691941195319531953
19741970196519591958
19781978197819721966
19291967195619591962
19551961196319791980
19801979197919401945
19451945197919781970
19611940197719501950
1930
MRPA-MMRPA-MMRPA-MMRPA-MMRPA-L
MRPA-LMRPA-LMRPA-LMRPA-LMRPA-L
MRPA-MMRPA-LMRPA-MMRPAMRPA
MRPAMRPAMRPAMRPAMRPA
MRPA-UMRPA-MMRPA-UMRPA-LMRPA-M
MRPA-MMRPA-UMRPA-UMRPA-MMRPA
MRPAMRPAMRPAMRPA-MMRPA-M
MRPA-MMRPA-MMRPA-UMRPA-UMRPA
MRPAMRPAMRPAMRPAMRPA
MRPA
MRPA-LMRPA-LMRPA-LMRPA-LMRPA
MRPAMRPAMRPAMRPAMRPA
MRPAMRPA-UMRPA -2MRPA-MMRPA-M
MRPA-MMRPA-MMRPA-MMRPA-UMRPA-L
MRPA-MMRPA-LMRPA -2MRPA-MMRPA-L
MRPA-LMRPA-LMRPA-MMRPA-LMRPA-M
MRPA-MMRPA-MMRPA-MMRPA-LMRPA-L
MRPA-LMRPA-LMRPA-MMRPA-MMRPA-L
MRPA-MMRPA-MMRPA-MMRPA-MMRPA-M
MRPA-M
* Cr raanarl in+-<an\/al
* Multiple screens in well. ** Well depth, screened interval unknown.
Aquifer unitsMRPA, Potomac-Raritan-Magothy aquifer system--undifferentiated. MRPA-U, Potomac-Raritan-Magothy aquifer system upper aquifer. MRPA-M, Potomac-Raritan-Magothy aquifer system middle aquifer. MRPA-L, Potomac-Raritan-Magothy aquifer system-- lower aquifer.<$ MRPA-2, Indicates well screened in more than one unit of the Potomac-Raritan-Magothy aquifer system
100

Table 5.--Results of analyses of ground-water samples for common constituents and physical characteristics. 1985-86
[°C, degrees Celsius: dashes indicate missing data; /*S/cm, microsiemens per centimeter at 25 degrees Celsius; concentrations in milligrams per liter, except as noted; <, less than; /*g/L, micrograms per liter]
Well number
5- 395- 405- 605- 765- 76
5- 895- 915- 975-1005-124
5-1255-1675-1675-1675-187
5-2615-2615-2845-2845-284
5-3935-6585-6675-7585-780
5-8225-8237- 87- 127- 18
7- 307- 467- 467- 467- 64
7- 987-1227-1247-1347-143
7-1477-1837-1897-2217-249
7-2737-2747-2787-2837-302
7-3047-3157-3297-3417-345
7-3507-3547-3677-3697-372
7-3797-3867-4127-4777-527
Local well identifier
NJ WC-DEL VALLEY WC 15NJ WC-DEL VALLEY WC 16BURLINGTON CITY WC 2HEAL, CHARLESHEAL, CHARLES
TENNECO CHEM 7TENNECO CHEM 4HERCULES POWDER 1HERCULES POWDER 2NJ WC-DEL VALLEY WC-STPHEN
NJ WC-DEL VALLEY WC 10EVESHAM MUA 5EVESHAM MUA 5EVESHAM MUA 5FLORENCE TWP WD 4
USGS- MED FORD 5 OBSUSGS-MEDFORD 5 OBSMOORESTOWN TWP WD 4MOORESTOWN TWP WD 4MOORESTOWN TWP WD 4
RIVERSIDE INDUSTRY 39WILLINGBORO MUA 7WILLINGBORO MUA 5TENNECO CHEM 10WASTE RESOURCE OBS 6
MT LAURAL MUA 3MT LAURAL MUA 4BELMAWR BORO WD 4BELMAWR BORO WD 3BERLIN BORO WD 9
SJ PORT COMM NY SHIP 5ACAMDEN CITY WD-CITY 11CAMDEN CITY WD-CITY 11CAMDEN CITY WD-CITY 11CAMDEN CITY WD-CITY 17
NEW JERSEY WC- CAMDEN 52NEW JERSEY WC-BROWN 44NEW JERSEY WC-BROWN 45NEW JERSEY WC-OLD ORCH 37NEW JERSEY WC-ELLISBG 16
NEW JERSEY WC-KINGSTN 25NEW JERSEY WC-GIBBSBO 43NEW JERSEY WC-GIBBSBO 41USGS-GLOUC CTY CG BASE 1GARDEN ST WC-BLACKWOOD 3
NEW JERSEY WC-OTTERBK 29NEW JERSEY WC-OTTERBK 39NEW JERSEY WC-HADDON 15NEW JERSEY WC-EGBERT OBSHADDONFLD BORO WD-RULON
HADDONFLD BORO WD-LAKE STNEW JERSEY WC-MAGNOLIA 16MERCH-PENN WCOM-BROWN 2AMERCH-PENN WCOM-DEL GN 2MERCH-PENN WCOM-PARK 5
MERCH-PENN WCOM-PARK 2PETTY ISLAND OBSCAMDEN CITY WD-PUCHACKCAMDEN CITY WD-DELAIR 2MERCH-PENN WCOM-NAT HWY 1
CAMDEN CITY WD- MORRIS 10CAMDEN CITY WD-MORRIS 3ANEW JERSEY WC-ELM TREE 2USGS-NEW BROOKLYN PK 2 OBSCAMDEN CITY WD-CITY 18
Date of sample Temper-
collection ature (yr-mo-dy) (°C)
1985081419850814198509091985090419850904
1985091019850910198507021985070219850802
1985081419850815198508151985081519850702
1985100219851002198508161985081619850816
1985081619850703198507031985091019851008
1985090319850903198507151985071519850815
1985101519850829198508291985082919850829
1985080719850808198508081985080819850813
1985081319850711198507111985091819850815
1985080919850809198508071985100119850716
1985071619850809198507091985071019850731
1985073119851112198508061985071719850801
1985071719850806198509191985092319850829
14.516.513.013.013.0
14.514.014.014.014.0
14.019.019.018.014.5
16.016.014.514.515.0
16.514.014.013.015.5
17.516.516.516.520.0
16.015.515.515.515.0
14.517.016.517.015.0
16.022.022.015.516.5
17.516.016.015.017.0
16.016.014.515.516.0
15.014.514.516.015.0
15.014.519.520.014.5
Specific conductance US/cm)Field
212242192252252
17034021113596
84222222200244
174174172172172
27896142
1,100 1
204370212
520178234237212
212174211575194
178176185198225
223186120310104
118560295322135
398775162432
Lab
210246205219214
17038017416895
79223225225292
162163153153151
29558138232,080
175174184355212
347533525535500
529224190236203
211163201490198
189177191185210
200190117304104
110518186268134
289639151434427
pH (units)
Field
5.606.306.906.406.40
4.506.006.506.104.90
5.007.807.807.506.50
7.807.806.606.606.60
5.206.705.705.206.90
6.706.807.907.707.70
7.306.206.206.205.80
6.207.607.206.907.10
6.907.507.507.208.10
7.807.907.508.007.60
7.207.605.007.205.40
5.006.605.607.104.80
7.006.408.109.305.70
Lab
5.906.506.805.505.10
4.506.005.306.005.00
5.107.507.507.306.60
7.307.406.506.606.50
5.506.205.205.406.60
6.706.707.707.207.70
7.606.306.206.206.00
6.307.107.407.306.60
6.507.107.406.807.70
7.507.407.207.207.10
6.707.305.406.905.30
5.106.805.806.704.90
6.506.307.509.005.80
Alkalinity (as CaCOs) Field Lab
1653703737
0622773
291919188
7171858585
64023
145
59676414893
21512512512560
12185828681
666773
22991
657565
94
651
1173
32592280
17629663
54
145263<1.0<1.0
<1.0616.08.02.0
2.085868670
6464595959
9.0162.05.0
111
56576812887
13312410212458
9479708576
706770
21583
6969676575
64672.0
1134.0
3.023821663.0
11422063
23154
Dis solved oxygen
3.62.2
.6
.6
02.2.2
2.8
8.5.2.2.2
1.2
00.2.2.2
3.9.4
3.98.73.5
.3
.3
.2
.4
.3
.2
.4
.4
.4
.3
.2
.2
.3
.3
.4
.2
.3
.1
.3
.2
.2
.2
.1
.2
.4
.34.63.23.8
1.8.1
1.7.2
3.5
.5
.4
.1
.1
.5
Hardness (as CaCOs)
Total
6689763131
47120504925
19909090110
6363646464
73183785190
65665613056
95190190190140
14086659985
88424216044
3956625075
82632611027
28130507033
842104415
120
Non- carbonate
50366
<1<1
4758244222
17<1<1<119
<1<1<1<1<1
67<1358242
6<1<1<1<1
<160606075
241
<1134
22<1<1<1<1
<1<1<1<1<1
18<125<124
25<128<130
<1<1<1<166
101

Table 5.--Results of analyses of ground-water samples for common constituents and physical characteristics. 1985-86-'Cont i nued
Wellnumber
5- 395- 405- 605- 765- 76
5- 895- 915- 975-1005-124
5-1255-1675-1675-1675-187
5-2615-2615-2845-2845-284
5-3935-6585-6675-7585-780
5-8225-8237- 87- 127- 18
7- 307- 467- 467- 467- 64
7- 987-1227-1247-1347-143
7-1477-1837-1897-2217-249
7-2737-2747-2787-2837-302
7-3047-3157-3297-3417-345
7-3507-3547-3677-3697-372
7-3797-3867-4127-4777-527
Local wellidentifier
NJ WC-DEL VALLEY WC 15NJ WC-DEL VALLEY WC 16BURLINGTON CITY WC 2HEAL, CHARLESHEAL, CHARLES
TENNECO CHEM 7TENNECO CHEM 4HERCULES POWDER 1HERCULES POWDER 2NJ WC-DEL VALLEY WC-STPHEN
NJ WC-DEL VALLEY WC 10EVESHAM MUA 5EVESHAM MUA 5EVESHAM MUA 5FLORENCE TWP WD 4
USGS-MEDFORD 5 DBSUSGS-MEDFORD 5 DBSMOORESTOWN TWP WD 4MOORESTOWN TWP WD 4MOORESTOWN TWP WD 4
RIVERSIDE INDUSTRY 39WILLINGBORO MUA 7WILLINGBORO MUA 5TENNECO CHEM 10WASTE RESOURCE OBS 6
MT LAURAL MUA 3MT LAURAL MUA 4BELMAWR BORO WD 4BELMAWR BORO WD 3BERLIN BORO WD 9
SJ PORT COMM NY SHIP 5ACAMDEN CITY WD-CITY 11CAMDEN CITY WD-CITY 11CAMDEN CITY WD-CITY 11CAMDEN CITY WD-CITY 17
NEW JERSEY WC-CAMDEN 52NEW JERSEY WC- BROWN 44NEW JERSEY WC- BROWN 45NEW JERSEY WC-OLD ORCH 37NEW JERSEY WC-ELLISBG 16
NEW JERSEY WC-KINGSTN 25NEW JERSEY WC-GIBBSBO 43NEW JERSEY WC-GIBBSBO 41USGS-GLOUC CTY CG BASE 1GARDEN ST WC-BLACKWOOD 3
NEW JERSEY WC-OTTERBK 29NEW JERSEY WC-OTTERBK 39NEW JERSEY WC-HADDON 15NEW JERSEY WC-EGBERT OBSHADDONFLD BORO WD-RULON
HADDONFLD BORO WD-LAKE STNEW JERSEY WC-MAGNOLIA 16MERCH-PENN WCOM- BROWN 2AMERCH-PENN WCOM-DEL GN 2MERCH-PENN WCOM-PARK 5
MERCH-PENN WCOM-PARK 2PETTY ISLAND OBSCAMDEN CITY WD-PUCHACKCAMDEN CITY WD-DELAIR 2MERCH-PENN WCOM- NAT HWY 1
CAMDEN CITY WD- MORRIS 10CAMDEN CITY WD- MORRIS 3ANEW JERSEY WC-ELM TREE 2USGS-NEW BROOKLYN PK 2 OBSCAMDEN CITY WD-CITY 18
Date of sample
collection(yr-mo-dy)
1985081419850814198509091985090419850904
1985091019850910198507021985070219850802
1985081419850815198508151985081519850702
1985100219851002198508161985081619850816
1985081619850703198507031985091019851008
1985090319850903198507151985071519850815
1985101519850829198508291985082919850829
1985080719850808198508081985080819850813
1985081319850711198507111985091819850815
1985080919850809198508071985100119850716
1985071619850809198507091985071019850731
1985073119851112198508061985071719850801
1985071719850806198509191985092319850829
Dissolvedsodium
11128.36.46.4
7.0218.88.24.8
4.45.75.85.9
11
3.93.92.92.82.8
232.57.25.1
96
5.95.6
131719
1822212140
275.07.93.74.9
3.415231623
21119.8148.6
2.79.19.3135.9
5.91412188.7
12259.8
10030
Dis solvedpotassium
4.23.92.01.41.4
2.23.91.91.92.0
1.89.29.19.22.7
6.66.74.03.83.9
4.31.31.73.1
29
5.65.67.89.78.9
4.26.16.16.16.0
5.49.98.39.15.9
7.16.76.68.36.6
6.46.38.06.67.9
6.68.32.22.82.1
2.45.42.83.52.0
5.6126.14.95.9
Dissolvedcalcium
1020207.17.2
9.92512105.5
4.625252523
1919181818
144.68.5
1437
2020163614
2446464634
3325192925
2612124312
1116181422
24185.8
276.4
6.73211187.2
2042135.0
31
Dis solvedmagnesium
109.56.23.13.2
5.3144.95.92.6
1.86.56.56.512
3.53.54.54.64.5
9.31.63.71223
3.43.53.68.65.1
8.517171712
155.34.06.15.2
5.22.62.8
123.3
2.73.63.93.34.6
5.14.12.7
102.6
2.6125.56.03.5
8.2252.7.44
10
Dissolvedsi lica
128.36.2
1313
9.07.1
11118.0
7.48.28.28.28.2
7.87.9
111111
7.1109.78.47.3
9.39.57.59.38.8
7.31.51.51.5
11
7.67.98.88.79.1
8.79.39.36.88.4
9.08.58.68.29.0
8.48.3155.412
14246.67.99.2
9.45.99.21311
Dissolvedchloride
14127.9
1314
1532111511
8.62.22.01.9
20
2.42.32.93.12.9
325.7
151295
3.63.13.0
121.3
2926272645
432.03.82.03.1
2.26.18.4
242.0
8.81.74.25.44.6
1.93.2141913
1512213415
22353.74.0
35
Dissolvedsulfate
4250226767
3881763711
1.824232327
1212302930
47281558
160
2123203219
8196969699
5827183025
309.6193714
1015201927
3620268.35.5
6.013223216
2.3807.75.6
80
Dissolvedf luoride
<0.1<.1.1
1.3<.1
<.1<.1<.1<.1<.1
<.1<.1.2.2
<-1
.2
.2<.1.2.2
<.1<.1.1
<.1<.1
<.1<.1.2.3.3
.3<.1<.1<.1<.1
.3
.2
.1<.1.1
.1
.3
.2
.4
.5
.3
.4
.3
.2
.2
.1
.3<.1.2
<.1
<.1.3
<.1.1
<.1
.6
.6
.2
.5
.1
102

Table 5.--Results of analyses of ground-water samples for common constituents and physical characteristics. 1985-86--Cont i nued
Wellnumber
5- 395- 405- 605- 765- 76
5- 895- 915- 975-1005-124
5-1255-1675-1675-1675-187
5-2615-2615-2845-2845-284
5-3935-6585-6675-7585-780
5-8225-8237- 87- 127- 18
7- 307- 467- 467- 467- 64
7- 987-1227-1247-1347-143
7-1477-1837-1897-2217-249
7-2737-2747-2787-2837-302
7-3047-3157-3297-3417-345
7-3507-3547-3677-3697-372
7-3797-3867-4127-4777-527
Local wellidentifier
NJ WC-DEL VALLEY WC 15NJ WC-DEL VALLEY WC 16BURLINGTON CITY WC 2HEAL, CHARLESHEAL, CHARLES
TENNECO CHEM 7TENNECO CHEM 4HERCULES POWDER 1HERCULES POWDER 2NJ WC-DEL VALLEY WC-STPHEN
NJ WC-DEL VALLEY WC 10EVESHAM MUA 5EVESHAM MUA 5EVESHAM MUA 5FLORENCE TWP WD 4
USGS-MEDFORD 5 DBSUSGS-MEDFORD 5 DBSMOORESTOWN TWP WD 4MOORESTOWN TWP WD 4MOORESTOWN TWP WD 4
RIVERSIDE INDUSTRY 39WILLINGBORO MUA 7WILLINGBORO MUA 5TENNECO CHEM 10WASTE RESOURCE DBS 6
MT LAURAL MUA 3MT LAURAL MUA 4BELMAWR BORO WD 4BELMAWR BORO WD 3BERLIN BORO WD 9
SJ PORT COMM NY SHIP 5ACAMDEN CITY WD-CITY 11CAMDEN CITY WD-CITY 11CAMDEN CITY WD-CITY 11CAMDEN CITY WD-CITY 17
NEW JERSEY WC-CAMDEN 52NEW JERSEY WC- BROWN 44NEW JERSEY WC- BROWN 45NEW JERSEY WC-OLD ORCH 37NEW JERSEY WC-ELLISBG 16
NEW JERSEY WC-KINGSTN 25NEW JERSEY WC-GIBBSBO 43NEW JERSEY WC-GIBBSBO 41USGS-GLOUC CTY CG BASE 1GARDEN ST WC-BLACKWOOD 3
NEW JERSEY WC-OTTERBK 29NEW JERSEY WC-OTTERBK 39NEW JERSEY WC-HADDON 15NEW JERSEY WC-EGBERT DBSHADDONFLD BORO WD-RULON
HADDONFLD BORO WD-LAKE STNEW JERSEY WC-MAGNOLIA 16MERCH-PENN WCOM-BROWN 2AMERCH-PENN WCOM-DEL GN 2MERCH-PENN WCOM-PARK 5
MERCH-PENN WCOM-PARK 2PETTY ISLAND DBSCAMDEN CITY WD-PUCHACKCAMDEN CITY WD-DELAIR 2MERCH-PENN WCOM-NAT HWY 1
CAMDEN CITY WD-MORRIS 10CAMDEN CITY WD-MORRIS 3ANEW JERSEY WC-ELM TREE 2USGS-NEW BROOKLYN PK 2 DBSCAMDEN CITY WD-CITY 18
Date ofsample
col lection(yr-mo-dy)
1985081419850814198509091985090419850904
1985091019850910198507021985070219850802
1985081419850815198508151985081519850702
1985100219851002198508161985081619850816
1985081619850703198507031985091019851008
1985090319850903198507151985071519850815
1985101519850829198508291985082919850829
1985080719850808198508081985080819850813
1985081319850711198507111985091819850815
1985080919850809198508071985100119850716
1985071619850809198507091985071019850731
1985073119851112198508061985071719850801
1985071719850806198509191985092319850829
Totaliron(M9/L)
340
2,20043,00042,000
1,400270
11,000360100
29010011012050
1,0001,1009,200
9,200
6012,000
190480780
1,8005,400
65020080
54,000202030290
820770740
1,0004,000
850440380
200
300210880
1,0001,600
4,0002406026030
18022,000
<1010,000
40
30,00049,000
960620170
Dissolvedi ron(M9/D
<3<3
14042,00042,000
1,30099
11,000290
8
727243421
760760
9,2009,4009,100
1312,000
1205510
1,4005,300
330110
5
58,00032312812
760640680990
3,500
690
34023,000
130
300180770870
1,500
4,10023056
13010
9523,000
611,000
8
29,00049,000
5101794
Totalmanganese(M9/L)
20
2,500500480
2001,600
1002030
3020202020
303010040110
708050
<105,300
13070204020
640660650670290
3,50040505070
604030
20
3030406050
7040120
1,30080
100610170
2,00050
7,5007,100
10180
Dis solvedmanganese(M9/D
330
2,100460460
1901,700
903027
1910101022
4747878788
46784627
4,800
1308718426
650670690680290
3,40039455261
553630
4307
3012394444
6327120
1,30083
100600170
1,90062
7,4006,100
501
170
Dissolvedorganiccarbon
1.21.7
1.6
.41.31.01.1.6
1.01.1.8
1.41.3
.7
.71.5.5
.75.81.2.5
11
.5
.8
1.4
4.32.22.42.31.6
2.4
3.12.4.7
.9
.91.34.01.1
1.12.8.7.4
1.1
1.0
1.41.5.4
.56.21.93.1.7
3.611
.81.41.3
Dissolved solids
Phenol
1131
45521
32412
51043
1513
11
11
<1<14
32443
55
<112
2<1<184
1124
<1
25231
11
<132
41313202
Residueat 180°C
115144120144141
9922514810975
58130135131182
9799105116116
1875594137634
108108115208128
200296298302330
303127113134127
126106
262135
106110119116122
1221128315681
7822211016580
18038688
270256
Sum ofconstituents
1306,150
120170170
882301409549
51140140140170
100100130130130
1708784140660
110110110220130
370300300300290
290130120140130
120120130330130
110110110110140
13011076
16064
6935010018079
22047091
270250
103
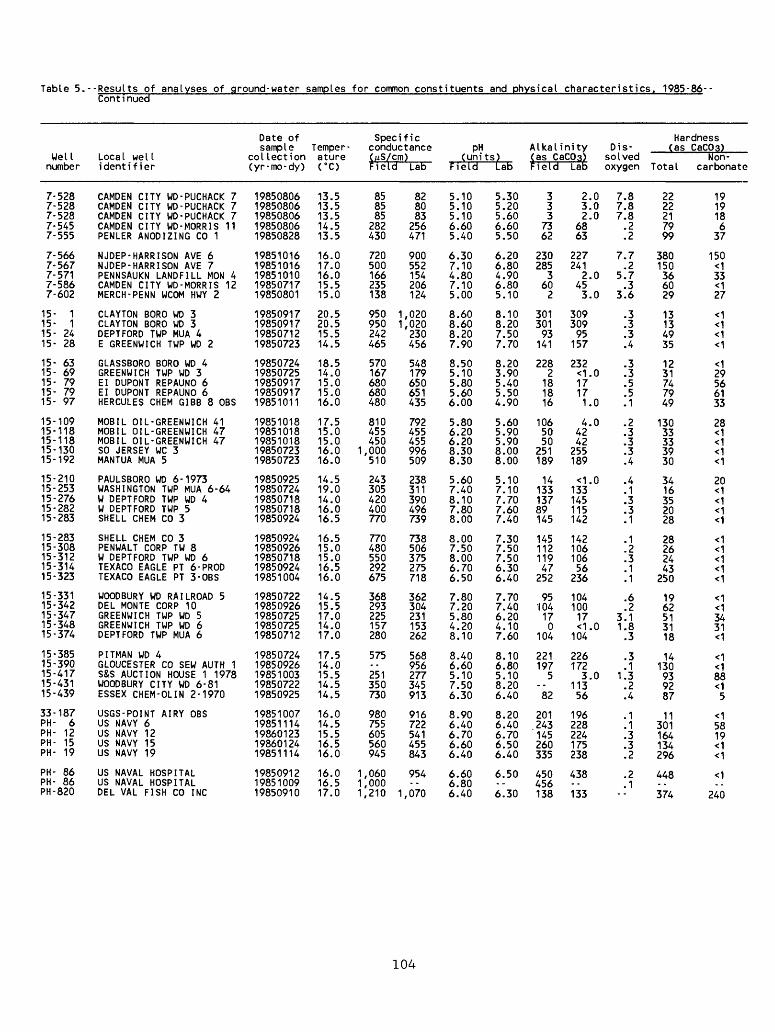
Table 5.--Results of analyses of ground-water samples for common constituents and physical characteristics. 1985-86--Continued
Wellnumber
7-5287-5287-5287-5457-555
7-5667-5677-5717-5867-602
15- 115- 115- 2415- 28
15- 6315- 6915- 7915- 7915- 97
15-10915-11815-11815-13015-192
15-21015-25315-27615-28215-283
15-28315-30815-31215-31415-323
15-33115-34215-34715-34815-374
15-38515-39015-41715-43115-439
33-187PH- 6PH- 12PH- 15PH- 19
PH- 86PH- 86PH-820
Local wellidentifier
CAMDEN CITY WD-PUCHACK 7CAMDEN CITY WD-PUCHACK 7CAMDEN CITY WD-PUCHACK 7CAMDEN CITY WD- MORRIS 11PENLER ANODIZING CO 1
NJDEP-HARRISON AVE 6NJDEP-HARRISON AVE 7PENNSAUKN LANDFILL MON 4CAMDEN CITY WD- MORRIS 12MERCH-PENN WCOM HWY 2
CLAYTON BORO WD 3CLAYTON BORO WD 3DEPTFORD TWP MUA 4E GREENWICH TWP WD 2
GLASSBORO BORO WD 4GREENWICH TWP WD 3El DUPONT REPAUNO 6El DUPONT REPAUNO 6HERCULES CHEM GIBB 8 DBS
MOBIL OIL-GREENWICH 41MOBIL OIL-GREENWICH 47MOBIL OIL-GREENWICH 47SO JERSEY WC 3MANTUA MUA 5
PAULSBORO WD 6-1973WASHINGTON TWP MUA 6-64W DEPTFORD TWP WD 4W DEPTFORD TWP 5SHELL CHEM CO 3
SHELL CHEM CO 3PENWALT CORP TW 8W DEPTFORD TWP WD 6TEXACO EAGLE PT 6- PRODTEXACO EAGLE PT 3-OBS
WOODBURY WD RAILROAD 5DEL MONTE CORP 10GREENWICH TWP WD 5GREENWICH TWP WD 6DEPTFORD TWP MUA 6
PITMAN WD 4GLOUCESTER CO SEW AUTH 1S&S AUCTION HOUSE 1 1978WOODBURY CITY WD 6-81ESSEX CHEM-OLIN 2-1970
USGS-POINT AIRY DBSUS NAVY 6US NAVY 12US NAVY 15US NAVY 19
US NAVAL HOSPITALUS NAVAL HOSPITALDEL VAL FISH CO INC
Date of sample
col lection(yr-mo-dy)
1985080619850806198508061985080619850828
1985101619851016198510101985071719850801
19850917198509171985071219850723
1985072419850725198509171985091719851011
1985101819851018198510181985072319850723
1985092519850724198507181985071819850924
1985092419850926198507181985092419851004
1985072219850926198507251985072519850712
1985072419850926198510031985072219850925
1985100719851114198601231986012419851114
198509121985100919850910
Specific Temper- conductanceaturerc>
13.513.513.514.513.5
16.017.016.015.515.0
20.520.515.514.5
18.514.015.015.016.0
17.515.015.016.016.0
14.519.014.016.016.5
16.515.015.016.516.0
14.515.517.014.017.0
17.514.015.514.514.5
16.014.515.516.516.0
16.016.517.0
US/cm)Field
858585
282430
720500166235138
950 1950 1242465
570167680680480
810455450
1,000510
243305420400770
770480550292675
368293225157280
575
251350730
980755605560945
1,0601,0001,210 1
Lab
828083
256471
900552154206124
,020,020230456
548179650651435
792455455996509
238311390496739
738506375275718
362304231153262
568956277345913
916722541455843
954
,070
PH Alkalinity(units)
Field
5.105.105.106.605.40
6.307.104.807.105.00
8.608.608.207.90
8.505.105.805.606.00
5.806.206.208.308.30
5.607.408.107.808.00
8.007.508.006.706.50
7.807.205.804.208.10
8.406.605.107.506.30
8.906.406.706.606.40
6.606.806.40
Lab
5.305.205.606.605.50
6.206.804.906.805.10
8.108.207.507.70
8.203.905.405.504.90
5.605.905.908.008.00
5.107.107.707.607.40
7.307.507.506.306.40
7.707.406.204.107.60
8.106.805.108.206.40
8.206.406.706.506.40
6.50
6.30
(as CaCOa)Field
3337362
230285
3602
30130193
141
2282
181816
1065050
251189
1413313789145
14511211947252
95104170
104
221197
5
82
201243145260335
450456138
Lab
2.03.02.0
6863
227241
2.0453.0
30930995157
232<1.017171.0
4.04242255189
<1.0133145115142
14210610656
236
10410017<1.0104
2261723.0
11356
196228224175238
438
133
Dissolvedoxygen
7.87.87.8.2.2
7.7.2
5.7.3
3.6
.3
.3
.3
.4
.3
.3
.5
.5
.1
.2
.3
.3
.3
.4
.4
.1
.3
.3
.1
.1
.2
.3
.1
.1
.6
.23.11.8.3
.3
.11.3.2.4
.1
.1
.3
.3
.2
.2
.1
Hardness (as CaCOs)
Total
2222217999
380150366029
13134935
1231747949
13033333930
3416352028
28262443250
1962513118
14130939287
11301164134296
448
374
Non-carbonate
191918637
150<133<127
<1<1<1<1
<129566133
28<1<1<1<1
20<1<1<1<1
<1<1<1<1<1
<1<13431<1
<1<188<15
<15819<1<1
<1
240
104

Table 5.--Results of analyses of ground-water samples for common constituents and physical characteristics. 1985-86--Cont i nued
Well number
7-5287-5287-5287-5457-555
7-5667-5677-5717-5867-602
15- 115- 115- 2415- 2815- 63
15- 6915- 7915- 7915- 9715-109
15-11815-11815-13015-19215-210
15-25315-27615-28215-28315-283
15-30815-31215-31415-32315-331
15-34215-34715-34815-37415-385
15-39015-41715-43115-43933-187
PH- 6PH- 12PH- 15PH- 19PH- 86
PH- 86PH-820
Local well identifier
CAMDEN CITY WD-PUCHACK 7CAMDEN CITY WD-PUCHACK 7CAMDEN CITY WD-PUCHACK 7CAMDEN CITY WD- MORRIS 11PENLER ANODIZING CO 1
NJDEP-HARRISON AVE 6NJDEP-HARRISON AVE 7PENNSAUKN LANDFILL MON 4CAMDEN CITY WD- MORRIS 12MERCH-PENN WCOM HWY 2
CLAYTON BORO WD 3CLAYTON BORO WD 3DEPTFORD TWP MUA 4E GREENWICH TWP WD 2GLASSBORO BORO WD 4
GREENWICH TWP WD 3El DUPONT REPAUNO 6El DUPONT REPAUNO 6HERCULES CHEM GIBB 8 OBSMOBIL OIL-GREENWICH 41
MOBIL OIL-GREENWICH 47MOBIL OIL-GREENWICH 47SO JERSEY WC 3MANTUA MUA 5PAULSBORO WD 6-1973
WASHINGTON TWP MUA 6-64W DEPTFORD TWP WD 4W DEPTFORD TWP 5SHELL CHEM CO 3SHELL CHEM CO 3
PENWALT CORP TW 8W DEPTFORD TWP WD 6TEXACO EAGLE PT 6- PRODTEXACO EAGLE PT 3-OBSWOODBURY WD RAILROAD 5
DEL MONTE CORP 10GREENWICH TWP WD 5GREENWICH TWP WD 6DEPTFORD TWP MUA 6PITMAN WD 4
GLOUCESTER CO SEW AUTH 1S&S AUCTION HOUSE 1 1978WOODBURY CITY WD 6-81ESSEX CHEM-OLIN 2-1970USGS-POINT AIRY OBS
US NAVY 6US NAVY 12US NAVY 15US NAVY 19US NAVAL HOSPITAL
US NAVAL HOSPITALDEL VAL FISH CO INC
Date of sample
collection (yr-mo-dy)
1985080619850806198508061985080619850828
1985101619851016198510101985071719850801
1985091719850917198507121985072319850724
1985072519850917198509171985101119851018
1985101819851018198507231985072319850925
1985072419850718198507181985092419850924
1985092619850718198509241985100419850722
1985092619850725198507251985071219850724
1985092619851003198507221985092519851007
1985111419860123198601241985111419850912
1985100919850910
Dis solved sodium
4.14.03.81249
40108.3
128.8
2302303183120
1078815383
73731909525
647197140150
9468354167
39177.3
53120
1404.6
29150200
2727234838
66
Dis solved potas sium
1.61.71.72.94.2
5.23.85.92.11.8
8.39.15.75.55.4
2.24.34.63.94.5
2.22.28.86.23.1
5.75.63.13.43.5
3.53.84.29.83.3
5.45.52.63.85.8
7.87.26.45.14.7
4.45.1
435.54.4
12
Dis solved calcium
5.15.14.91918
96356.0
156.3
2.82.8
149.32.8
5.716171230
8.58.4
108.07.0
3.99.75.87.77.7
7.36.912675.5
17114.75.13.4
362427243.0
5639326272
77
Dis solved magne sium
2.22.22.17.6
13
33165.05.43.2
1.31.43.12.71.1
3.98.28.84.514
2.72.73.32.33.9
1.52.51.31.91.9
1.71.52.9
191.2
4.65.64.71.31.3
9.78.05.76.2.84
3916133465
44
Dis solved si lica
9.08.98.76.53.6
105.46.36.39.2
9.69.47.89.58.7
148.78.7189.4
8.68.68.48.49.3
8.88.38.48.88.8
8.68.3
12158.6
106.8127.88.7
136.38.9
117.6
1713151418
_ m
14
Dis solved chloride
7.47.57.7
1988
6116171914
1401406.0
4536
14949512092
1101101604431
223381140140
7946243844
1322101544
902822130170
2349323855
. m
98
Dis solved sulfate
7.77.67.7
3520
150.4
312514
<.2<.2
178.61.7
4210010017
200
15125.14.147
5.05.47.79.39.2
109.0
42857.3
2433356.81.8
1604116
1704.3
100663.4
13017..
210
Dis solved f luoride
<0.1<.1<.1.2
<.1
<.11.4<.1.2
<.1
1.71.6.8
1.11.8
<.1<.1<.1<.1.6
.2
.11.41.5.2
1.01.11.62.11.7
1.61.2.3.1
1.0
.3<.1.1
1.12.0
1.0<.1.9
1.52.1
.1
.7
.3
.2
.3
<.1
105

Table 5.--Results of analyses of ground-water samples for common constituents and physical characteristics. 1985-86--Continued
Wellnumber
7-5287-5287-5287-5457-555
7-5667-5677-5717-5867-602
15- 115- 115- 2415- 2815- 63
15- 6915- 7915- 7915- 9715-109
15-11815-11815-13015-19215-210
15-25315-27615-28215-28315-283
15-30815-31215-31415-32315-331
15-34215-34715-34815-37415-385
15-39015-41715-43115-43933-187
PH- 6PH- 12PH- 15PH- 19PH- 86
PH- 86PH-820
Local wellidentifier
CAMDEN CITY WD-PUCHACK 7CAMDEN CITY WD-PUCHACK 7CAMDEN CITY WD-PUCHACK 7CAMDEN CITY WD- MORRIS 11PENLER ANODIZING CO 1
NJDEP-HARRISON AVE 6NJDEP-HARRISON AVE 7PENNSAUKN LANDFILL MON 4CAMDEN CITY WD-MORRIS 12MERCH-PENN WCOM HWY 2
CLAYTON BORO WD 3CLAYTON BORO WD 3DEPTFORD TWP MUA 4E GREENWICH TWP WD 2GLASSBORO BORO WD 4
GREENWICH TWP WD 3El DUPONT REPAUNO 6El DUPONT REPAUNO 6HERCULES CHEM GIBB 8 OBSMOBIL OIL-GREENWICH 41
MOBIL OIL-GREENWICH 47MOBIL OIL-GREENWICH 47SO JERSEY WC 3MANTUA MUA 5PAULSBORO WD 6-1973
WASHINGTON TWP MUA 6-64W DEPTFORD TWP WD 4W DEPTFORD TWP 5SHELL CHEM CO 3SHELL CHEM CO 3
PENWALT CORP TW 8W DEPTFORD TWP WD 6TEXACO EAGLE PT 6-PRODTEXACO EAGLE PT 3-OBSWOODBURY WD RAILROAD 5
DEL MONTE CORP 10GREENWICH TWP WD 5GREENWICH TWP WD 6DEPTFORD TWP MUA 6PITMAN WD 4
GLOUCESTER CO SEW AUTH 1S&S AUCTION HOUSE 1 1978WOODBURY CITY WD 6-81ESSEX CHEM-OLIN 2-1970USGS-POINT AIRY OBS
US NAVY 6US NAVY 12US NAVY 15US NAVY 19US NAVAL HOSPITAL
US NAVAL HOSPITALDEL VAL FISH CO INC
Date ofsample
col lection(yr-mo-dy)
1985080619850806198508061985080619850828
1985101619851016198510101985071719850801
1985091719850917198507121985072319850724
1985072519850917198509171985101119851018
1985101819851018198507231985072319850925
1985072419850718198507181985092419850924
1985092619850718198509241985100419850722
1985092619850725198507251985071219850724
1985092619851003198507221985092519851007
1985111419860123198601241985111419850912
1985100919850910
Totaliron<*J/L>
405050
7,100450
41022,000
705,800
30
14011024053070
6,200390370
14,00042,000
3,9003,700
10040
7,900
609040
340360
4,80070
2,30016,000
10
2605101104070
9,800800
11,0006,600
19,00047,00050,00047,00015,000
180
Dissolvediron(09/L)
10610
7,100230
1022,000
116,200
9
4052
26017029
5,900400390
11,00046,000
3,8003,800
784
7,800
1111035
310300
1,10038
2,20016,000
4
1005101101430
10,000340540
10,000250
21,00049,00054,00048,0002,000
<3
Totalmanganese<09/L>
202030
3,800210
1,5007,200
5401,200
40
<10<10102010
340740710350
1,200
80701010
130
<10<10102020
6010
240<10
3010090<1010
160370
150110
5,900930640
3,5003,000
20
Dis solvedmanganese(09/L)
262525
3,800200
1,5006,800
5001,200
39
22
135
<1
320720760330
1,200
66
33
110
<14
111213
399
57230
1584998
1303802010039
6,200890580
3,5002,900
22
Dissolvedorganic
carbon
.52.25.4
7.37.41.21.9.5
2.42.22.42.39.3
1.92.0.6
15
1.81.82.11.81.2
6.41.71.3
.9
1.31.7.9
3.64.2
1.02.41.71.45.8
6.91.41.52.72.7
6.05.07.58.08.4
9.21.4
Dissolved solids
Phenol
<13
54
4<123
<1
862
<12
3666
68
57214
<162
2
42184
75223
53
229
371
17
115
Residueat 180°C
636664148270
6102249011578
588592147274346
102377383248495
243243555288140
210241276407410
271208162437210
16713698165347
570162195532527
435294255551545
691
Sum ofconstituents
535353160230
5503108713072
140250320
100360360250550
250250540280140
190220260400410
280220160450190
180130
150320
590160190560520
440430390590538
622
106

Table 6.--Results of analyses of ground-water samples for dissolved trace elements. 1985-86
[Concentrations in micrograms per liter; Dashes indicate missing data; <, less than]
Wellnumber
5- 395- 405- 605- 765- 76
5- 895- 915- 975-1005-124
5-1255-1675-1675-1675-187
5-2615-2615-2845-2845-284
5-3935-6585-6675-7585-780
5-8225-8237- 87- 127- 18
7- 307- 467- 467- 467- 64
7- 987-1227-1247-1347-143
7-1477-1837-1897-2217-249
7-2737-2747-2787-2837-302
7-3047-3157-3297-3417-345
7-3507-3547-3677-3697-372
Local wellidentifier
NJ WC-DEL VALLEY WC 15NJ WC-DEL VALLEY WC 16BURLINGTON CITY WC 2HEAL, CHARLESHEAL, CHARLES
TENNECO CHEM 7TENNECO CHEM 4HERCULES POWDER 1HERCULES POWDER 2NJ WC-DEL VALLEY WC-STPHEN
NJ WC-DEL VALLEY WC 10EVESHAM MUA 5EVESHAM MUA 5EVESHAM MUA 5FLORENCE TWP WD 4
USGS-MEDFORD 5 DBSUSGS-MEDFORD 5 OBSMOORESTOWN TWP WD 4MOORESTOWN TWP WD 4MOORESTOWN TWP WD 4
RIVERSIDE INDUSTRY 39WILLINGBORO MUA 7WILLINGBORO MUA 5TENNECO CHEM 10WASTE RESOURCE OBS 6
MT LAURAL MUA 3MT LAURAL MUA 4BELMAWR BORO WD 4BELMAWR BORO WD 3BERLIN BORO WD 9
SJ PORT COMM NY SHIP 5ACAMDEN CITY WD-CITY 11CAMDEN CITY WD-CITY 11CAMDEN CITY WD-CITY 11CAMDEN CITY WD-CITY 17
NEW JERSEY WC-CAMDEN 52NEW JERSEY WC-BROWN 44NEW JERSEY WC-BROWN 45NEW JERSEY WC-OLD ORCH 37NEW JERSEY WC-ELLISBG 16
NEW JERSEY WC-KINGSTN 25NEW JERSEY WC-GIBBSBO 43NEW JERSEY WC-GIBBSBO 41USGS-GLOUC CTY CG BASE 1GARDEN ST WC-BLACKWOOD 3
NEW JERSEY WC-OTTERBK 29NEW JERSEY WC-OTTERBK 39NEW JERSEY WC-HADDON 15NEW JERSEY WC-EGBERT OBSHADDONFLD BORO WD-RULON
HADDONFLD BORO WD-LAKE STNEW JERSEY WC-MAGNOLIA 16MERCH-PENN WCOM -BROWN 2AMERCH-PENN WCOM-DEL GN 2MERCH-PENN WCOM- PARK 5
MERCH-PENN WCOM-PARK 2PETTY ISLAND OBSCAMDEN CITY WD-PUCHACKCAMDEN CITY WD-DELAIR 2MERCH-PENN WCOM-NAT HWY 1
Date of sample
(yr-mo-dy)
1985081419850814198509091985090419850904
1985091019850910198507021985070219850802
1985081419850815198508151985081519850702
1985100219851002198508161985081619850816
1985081619850703198507031985091019851008
1985090319850903198507151985071519850815
1985101519850829198508291985082919850829
1985080719850808198508081985080819850813
1985081319850711198507111985091819850815
1985080919850809198508071985100119850716
1985071619850809198507091985071019850731
1985073119851112198508061985071719850801
Aluminum Arsenic
30 <110 <1
<10 <1<10 2<10 2
10 <1<10 <1100 1100 <1<10 <1
20 <130 <140 <110 <1
100 <1
<10 <120 <1
<10 <1<10 <1<10 <1
<10 <1100 <1
<100 <1<10 <150 <1
<10 <1<10 <110 <110 <120 <1
<10 6<10 <1<10 <1<10 <1<10 <1
30 <120 <120 <1
<10 <110 <1
30 <130 <120 <1
40 <1
<10 <120 <120 <130 <120 <1
<10 <120 <180 <1<10 <130 <1
20 <110 1920 <1
<10 <140 <1
Barium
10067165354
6452836461
4914014014057
8586898989
915811060100
7783537984
2523232364
120794312078
95303418080
2868404050
11052906136
38240498960
Hexa- valent
Beryllium Cadmium Chromium chromium
0.7 2 <10 <1<.5 <1 <10 <11 <1 <10 <1<.5 4 10 <1.5 5 <10 <1
1 <1 <10 <11 <1 <10 <1<.5 <1 20 <1.6 <1 10 <1
<.5 <1 <10 <1
1 <1 <10 <1<.5 <1 <10 <1<.5 <1 <10 1.8 <1 <10 <1
<.5 <1 <10 <1
<.5 <1 <10 <1<.5 <1 <10 <1<.5 <1 <10 <1.5 1 <10 <1
<,5 1 <10 <1
.5 <1 <10 <1<.5 2 <10 2<.5 <1 <10 12 <1 <10 <1.5 3 10 <1
< 5 <1 <10 <1<\5 1 10 <1<.5 <1 <10 <1<.5 <1 <10 <12 <1 <10 <1
<.5 6 <10 <1.9 1 <10 <1
<.5 1 <10 <1<.5 1 <10 <1.7 <1 <10 <1
<.5 <1 <10 1<.5 <1 <10 1.6 <1 10 2
1 <1 <10 1.8 <1 <10 <1
<.5 1 <10 1
!6 <1 10 1.5 2 <10 <1
<.5 <1 <10 <1
.8 <1 <10 11 <1 <10 2<.5 <1 10 <1.8 <1 10 <1
<.5 <1 10 <1
<.5 <1 10 <11 <1 <10 <1.8 <1 <10 <1
<.5 <1 <10 <1<.5 <1 <10 <1
.5 <1 <10 <1<.5 1 <10 <1<i5 <1 780 390.5 2 <10 1
107

Table 6.--Results of analyses of ground-water samples for dissolved trace elements. 1985-86--Continued
Well number
5- 395- 405- 605- 765- 76
5- 895- 915- 975-1005-124
5-1255-1675-1675-1675-187
5-2615-2615-2845-2845-284
5-8225-8235-3935-6585-667
5-7585-7807- 87- 127- 18
7- 307- 467- 467- 467- 64
7- 987-1227-1247-1347-143
7-1477-1837-1897-2217-249
7-2737-2747-2787-2837-302
7-3047-3157-3297-3417-345
7-3507-3547-3677-3697-372
Date of Local well sample identifier (yr-mo-dy)
NJ WC-DEL VALLEY WC 15NJ WC-DEL VALLEY WC 16BURLINGTON CITY WC 2HEAL, CHARLESHEAL, CHARLES
TENNECO CHEM 7TENNECO CHEM 4HERCULES POWDER 1HERCULES POWDER 2NJ WC-DEL VALLEY WC-STPHEN
NJ WC-DEL VALLEY WC 10EVESHAM MUA 5EVESHAM MUA 5EVESHAM MUA 5FLORENCE TWP WD 4
USGS-MEDFORD 5 DBSUSGS-MEDFORD 5 DBSMOORESTOWN TWP WD 4MOORESTOWN TWP WD 4MOORESTOWN TWP WD 4
MT LAURAL MUA 3MT LAURAL MUA 4RIVERSIDE INDUSTRY 39WILLINGBORO MUA 7WILLINGBORO MUA 5
TENNECO CHEM 10WASTE RESOURCE DBS 6BELMAWR BORO WD 4BELMAWR BORO WD 3BERLIN BORO WD 9
SJ PORT COMM NY SHIP 5ACAMDEN CITY WD-CITY 11CAMDEN CITY WD-CITY 11CAMDEN CITY WD-CITY 11CAMDEN CITY WD-CITY 17
NEW JERSEY WC- CAMDEN 52NEW JERSEY WC-BROWN 44NEW JERSEY WC-BROWN 45NEW JERSEY WC-OLD ORCH 37NEW JERSEY WC-ELLISBG 16
NEW JERSEY WC-KINGSTN 25NEW JERSEY WC-GIBBSBO 43NEW JERSEY WC-GIBBSBO 41USGS-GLOUC CTY CG BASE 1GARDEN ST WC-BLACKWOOD 3
NEW JERSEY WC-OTTERBK 29NEW JERSEY WC-OTTERBK 39NEW JERSEY WC-HADDON 15NEW JERSEY WC-EGBERT DBSHADDONFLD BORO WD-RULON
HADDONFLD BORO WD-LAKE STNEW JERSEY WC-MAGNOLIA 16MERCH-PENN WCOM-BROWN 2AMERCH-PENN WCOM-DEL GN 2MERCH-PENN WCOM-PARK 5
MERCH-PENN WCOM-PARK 2PETTY ISLAND DBSCAMDEN CITY WD-PUCHACKCAMDEN CITY WD-DELAIR 2MERCH-PENN WCOM-NAT HWY 1
1985081419850814198509091985090419850904
1985091019850910198507021985070219850802
1985081419850815198508151985081519850702
1985100219851002198508161985081619850816
1985090319850903198508161985070319850703
1985091019351008198507151985071519850815
1985101519850829198508291985082919850829
1985080719850808198508081985080819850813
1985081319850711198507111985091819850815
1985080919850809198508071985100119850716
1985071619850809198507091985071019850731
1985073119851112198508061985071719850801
Cobalt
<3<3<3<3<3
37
<35
<3
<3<3<3<3<3
<3<3<3<3<3
<3<3<3<33
<320<38
<3
<3<3548
70<3<3<3<3
<3<3<3<3<3
<3<3<3<3<3
<3<38
206
6<35
804
Molyb- Stron- Copper Lead Lithium denum tium
<10 <10 <4<10 <10 <4<10 <10 <4<10 20 9<10 20 7
<10 <10 7<10 <10 7<10 30 2410 <10 1410 <10 8
40 10 12<10 <10 8<10 <10 7<10 <10 8<10 <10 4
<10 <10 10<10 <10 11<10 <10 19<10 <10 19<10 <10 18
<10 <10 7<10 <10 <4<10 <10 10<10 <10 1420 <10 26
30 <10 <4<10 <10 <4<10 <10 7<10 <10 5<10 <10 10
<10 <10 5<10 10 5<10 20 6<10 20 950 10 19
<10 <10 19<10 <10 <4<10 <10 <4<10 <10 5<10 <10 9
<10 <10 5<10 <10 5<10 <10 6<10 <10 5<10 <10 7
<10 <10 <4<10 <10 <4<10 10 7<10 <10 <4<10 <10 <4
<10 <10 4<10 <10 <410 <10 30
<10 <10 <410 10 18
110 20 22<10 <10 <410 <10 8
<10 <10 540 10 11
<10 88<10 95<10 79<10 36<10 37
<10 64<10 140<10 140<10 86<10 62
<10 63<10 630<10 630<10 630<10 150
<10 860<10 870<10 430<10 430<10 430
<10 940<10 970<10 68<10 85<10 78
<10 85<10 160<10 930<10 2,300<10 410
<10 160<10 280<10 280<10 280<10 780
<10 450<10 1,400<10 1,100<10 1,400<10 640
<10 1,200<10 730<10 760<10 1,800<10 430
<10 710<10 640<10 1,100<10 880<10 1,200
<10 1,100<10 1,000<10 81<10 300<10 110
<10 130<10 210<10 140<10 120<10 99
Vana dium
<6<6<6<6<6
<6<6<6<6<6
<6<6<6<6<6
<6<6<6<6<6
<6<6<6<6<6
<6<6<6<6<6
<6<6<6<6<6
<6<6<6<6<6
<6<6<6<6<6
<6<6<6<6<6
<6<6<6<6<6
<6<6<6<6<6
Zinc
41105
<33
3514106727
17<3<3<34
<3<3<3<3<3
2160891141
1938145
<3
412111137
68131769
139544
161611<34
1610625
20
57100414
28
108

Table 6.--Results of analyses of ground-water samples for dissolved trace elements. 1985-86--Continued
Well number
7-3797-3867-4127-4777-527
7-5287-5287-5287-5457-555
7-5667-5677-5717-5867-602
15- 115- 115- 2415- 2815- 63
15- 6915- 7915- 7915- 9715-109
15-11815-11815-13015-19215-210
15-25315-27615-28215-28315-283
15-30815-31215-31415-32315-331
15-34215-34715-34815-37415-385
15-39015-41715-43115-43933-187
PH- 6PH- 12PH- 15PH- 19PH- 86
PH- 86PH-820
Local well identifier
CAMDEN CITY WD-MORRIS 10CAMDEN CITY WD-MORRIS 3ANEW JERSEY WC-ELM TREE 2USGS-NEW BROOKLYN PK 2 DBSCAMDEN CITY WD-CITY 18
CAMDEN CITY WD-PUCHACK 7CAMDEN CITY WD-PUCHACK 7CAMDEN CITY WD-PUCHACK 7CAMDEN CITY WD-MORRIS 11PENLER ANODIZING CO 1
NJDEP-HARRISON AVE 6NJDEP-HARRISON AVE 7PENNSAUKN LANDFILL MON 4CAMDEN CITY WD-MORRIS 12MERCH-PENN WCOM HWY 2
CLAYTON BORO WD 3CLAYTON BORO WD 3DEPTFORD TWP MUA 4E GREENWICH TWP WD 2GLASSBORO BORO WD 4
GREENWICH TWP WD 3El DUPONT REPAUNO 6El DUPONT REPAUNO 6HERCULES CHEM GIBB 8 DBSMOBIL OIL-GREENWICH 41
MOBIL OIL-GREENWICH 47MOBIL OIL-GREENWICH 47SO JERSEY WC 3MANTUA MUA 5PAULSBORO WD 6-1973
WASHINGTON TWP MUA 6-64W DEPTFORD TWP WD 4W DEPTFORD TWP 5SHELL CHEM CO 3SHELL CHEM CO 3
PENWALT CORP TW 8W DEPTFORD TWP WD 6TEXACO EAGLE PT 6-PRODTEXACO EAGLE PT 3-OBSWOODBURY WD RAILROAD 5
DEL MONTE CORP 10GREENWICH TWP WD 5GREENWICH TWP WD 6DEPTFORD TWP MUA 6PITMAN WD 4
GLOUCESTER CO SEW AUTH 1S&S AUCTION HOUSE 1 1978WOODBURY CITY WD 6-81ESSEX CHEM-OLIN 2-1970USGS-POINT AIRY DBS
US NAVY 6US NAVY 12US NAVY 15US NAVY 19US NAVAL HOSPITAL
US NAVAL HOSPITALDEL VAL FISH CO INC
Date of sample
(yr-mo-dy)
1985071719850806198509191985092319850829
1985080619850806198508061985080619850828
1985101619851016198510101985071719850801
1985091719850917198507121985072319850724
1985072519850917198509171985101119851018
1985101819851018198507231985072319850925
1985072419850718198507181985092419850924
1985092619850718198509241985100419850722
1985092619850725198507251985071219850724
1985092619851003198507221985092519851007
1985111419860123198601241985111419850912
1985100919850910
Aluminum Arsenic
<10 1<10 <120 <190 <120 <1
40 <140 <130 <110 <140 <1
<10 <1<10 190 <120 4
<10 <1
30 <120 <130 <110 <130 <1
90 330 <120 <110 2
460 1
<10 <1<10 <120 <110 <1
160 1
40 150 <120 <1
<10 <1<10 <1
20 <1<10 <1<10 <1<10 <130 <1
10 <140 <1750 <1<10 <130 <1
20 <190 <110 <1
120 <110 <1
10 2<10 2<10 49<10 <1<10 1
. .
10
Barium
67110333162
33272785120
54510753758
4241566726
908686
42082
7681866072
3361252525
273064
25023
12063822930
190791106533
3457
15012056
42
Beryl lium
<0.52.6.6.7
< 5'.7
.51.7
2.6
<.5<.5<.5
< 5'.5
1<.5.5
2<.5<.5.6
4
11<.5< 52
< 5'.5
<.5r2
<.5< 5is.8
<.5< 5r1<.5
< .5<.5< §2
<.5<.5<'.5
< 52
<.5
Cadmium
25
<11
<1
<1<1<1
1<1
<1<1<1<1
1
<1<1<1<1<1
1<1<1<14
11
<1<12
<11
<12
<1<1<11
<1
<1<1<1<1<1
11
<11
<1443
<1
. .<1
Hexa- va I ent
Chromium chromium
10 <1<10 <1<10 <1<10 <1<10 <1
10 <110 <110 <1
<10 <1<10 <1
10 <110 <1
960 98010 <1
<10 <1
<10 <1<10 <1<10 <1<10 <1<10 <1
10 <1<10 <1<10 <1<10 <110 <1
10 <110 <1
<10 <110 <1
<10 <1
<10 <1<10 <1<10 <1<10 <1<10 <1
<10 <1<10 <1<10 <1<10 <1<10 <1
<10 <1<10 <110 <1
<10 1<10 <1
<10 <1<10 <1<10 <1<10 <1<10 <1
<10 <1<10 <1<10 <1<10 <1<10 <1
..10 <1
109

Table 6.--Results of analyses of ground-water samples for dissolved trace elements. 1985-86--Continued
Well number
7-3797-3867-4127-4777-527
7-5287-5287-5287-5457-555
7-5667-5677-5717-5867-602
15- 115- 115- 2415- 2815- 63
15- 6915- 7915- 7915- 9715-109
15-11815-11815-13015-19215-210
15-25315-27615-28215-28315-283
15-30815-31215-31415-32315-331
15-34215-34715-34815-374
15-38515-39015-41715-43115-439
33-187PH- 6PH- 12PH- 15PH- 19
PH- 86PH- 86PH-820
Local well identifier
CAMDEN CITY WD- MORRIS 10CAMDEN CITY WD- MORRIS 3ANEW JERSEY WC-ELM TREE 2USGS -NEW BROOKLYN PK 2 OBSCAMDEN CITY WD-CITY 18
CAMDEN CITY WD-PUCHACK 7CAMDEN CITY WD-PUCHACK 7CAMDEN CITY WD-PUCHACK 7CAMDEN CITY WD- MORRIS 11PENLER ANODIZING CO 1
NJDEP-HARRISON AVE 6NJDEP-HARRISON AVE 7PENNSAUKN LANDFILL MON 4CAMDEN CITY WD-MORRIS 12MERCH-PENN WCOM HWY 2
CLAYTON BORO WD 3CLAYTON BORO WD 3DEPTFORD TWP MUA 4E GREENWICH TWP WD 2GLASSBORO BORO WD 4
GREENWICH TWP WD 3El DUPONT REPAUNO 6El DUPONT REPAUNO 6HERCULES CHEM GIBB 8 OBSMOBIL OIL-GREENWICH 41
MOBIL OIL-GREENWICH 47MOBIL OIL-GREENWICH 47SO JERSEY WC 3MANTUA MUA 5PAULSBORO WD 6-1973
WASHINGTON TWP MUA 6-64W DEPTFORD TWP WD 4W DEPTFORD TWP 5SHELL CHEM CO 3SHELL CHEM CO 3
PENWALT CORP TW 8W DEPTFORD TWP WD 6TEXACO EAGLE PT 6- PRODTEXACO EAGLE PT 3-OBSWOODBURY WD RAILROAD 5
DEL MONTE CORP 10GREENWICH TWP WD 5GREENWICH TWP WD 6DEPTFORD TWP MUA 6
PITMAN WD 4GLOUCESTER CO SEW AUTH 1S&S AUCTION HOUSE 1 1978WOODBURY CITY WD 6-81ESSEX CHEM-OLIN 2-1970
USGS-POINT AIRY OBSUS NAVY 6US NAVY 12US NAVY 15US NAVY 19
US NAVAL HOSPITALUS NAVAL HOSPITALDEL VAL FISH CO INC
Date of sample
(yr-mo-dy)
1985071719850806198509191985092319850829
1985080619850806198508061985080619850828
1985101619851016198510101985071719850801
1985091719850917198507121985072319850724
1985072519850917198509171985101119851018
1985101819851018198507231985072319850925
1985072419850718198507181985092419850924
1985092619850718198509241985100419850722
19850926198507251985072519850712
1985072419850926198510031985072219850925
1985100719851114198601231986012419851114
198509121985100919850910
Cobalt Copper Lead
30 <10 209 <10 <10
<3 <10 <10<3 <10 <109 <10 20
6 20 <107 20 <106 20 <10
130 <10 <1030 <10 <10
9 <10 <10130 <10 <1030 10 <1020 <10 <10<3 20 <10
<3 <10 <10<3 <10 <10<3 <10 <10<3 <10 <10<3 <10 <10
30 20 <107 <10 <107 <10 <10
<3 <10 <10<3 <10 <10
<3 <10 <10<3 <10 <10<3 <10 <10<3 <10 <1040 <10 <10
<3 <10 <10<3 <10 30<3 <10 <10<3 <10 <10<3 <10 <10
<3 <10 <10<3 <10 <10<3 <10 <10<3 <10 <10<3 <10 <10
<3 <10 <104 <10 10
30 20 20<3 <10 <10
<3 <10 <1020 <10 <1010 10 <10<3 <10 <1030 <10 <10
<3 <10 <10<3 <10 107 <10 20
10 <10 20<3 <10 20
<3 <10 <10
<3 30 <10
Molyb- Lithium denum
<4 <105 <104 <1012 <1021 <10
11 <1013 <1010 <105 <10
<4 <10
5 <10<4 <10<4 <10<4 <1010 <10
8 <10<4 <10<4 <109 <1016 <10
16 <109 <10
<4 <1047 <1011 <10
5 <1066 <10
<4 <1016 <10
9 <1010 <10<4 <105 <10
<4 <10
5 <10<4 <107 <106 <106 <10
11 <106 <1013 <107 <10
15 <1015 <10<4 <107 <1019 <10
<4 <106 <106 <10
<4 <1013 <10
<4 <10
8 <10
Stron tium
180260730260820
757471120110
390410438493
150150730370130
140330330470950
460460430290160
150350350480480
370330800
4,200330
5809175
320
1601,900
1301,1001,100
190400350460
1,300
380
290
Vana dium
<6<6<6<6<6
<6<6<6<6<6
<6<6<6<6<6
<6<6<6<6<6
<6<6<6<6<6
<6<6<6<6<6
<6<6<6<6<6
<6<6<6<6<6
<6<6<6<6
<6<6<6<6<6
<6<6678
<6
<6
Zinc
6321<3<311
2326272817
154
791037
22<3<3688
160363646110
402161041
21148
<34
1689
2510
229713035
<31567<312
5207
2404
11
17
110

Table 7.--Results of analyses of ground-water samples for dissolved nutrients. 1985-86
Wellnumber
5- 395- 405- 605- 765- 76
5- 895- 915- 975-1005-124
5-1255-1675-1675-1675-187
5-2615-2615-2845-2845-284
5-3935-6585-6675-7585-780
5-8225-8237- 87- 127- 18
7- 307- 467- 467- 467- 64
7- 987-1227-1247-1347-143
7-1477-1837-1897-2217-249
7-2737-2747-2787-2837-302
7-3047-3157-3297-3417-345
[Concentrations in
Local wellidentifier
NJ WC-DEL VALLEY WC 15NJ WC-DEL VALLEY WC 16BURLINGTON CITY WC 2HEAL, CHARLESHEAL, CHARLES
TENNECO CHEM 7TENNECO CHEM 4HERCULES POWDER 1HERCULES POWDER 2NJ WC-DEL VALLEY WC-STPHEN
NJ WC-DEL VALLEY WC 10EVESHAM MUA 5EVESHAM MUA 5EVESHAM MUA 5FLORENCE TWP WD 4
USGS-MEDFORD 5 DBSUSGS-MEDFORD 5 DBSMOORESTOWN TWP WD 4MOORESTOWN TWP WD 4MOORESTOWN TWP WD 4
RIVERSIDE INDUSTRY 39WILLINGBORO MUA 7WILLINGBORO MUA 5TENNECO CHEM 10WASTE RESOURCE DBS 6
MT LAURAL MUA 3MT LAURAL MUA 4BELMAWR BORO WD 4BELMAWR BORO WD 3BERLIN BORO WD 9
SJ PORT COMM NY SHIP 5ACAMDEN CITY WD-CITY 11CAMDEN CITY WD-CITY 11CAMDEN CITY WD-CITY 11CAMDEN CITY WD-CITY 17
NEW JERSEY WC-CAMDEN 52NEW JERSEY WC-BROWN 44NEW JERSEY WC-BROWN 45NEW JERSEY WC-OLD ORCH 37NEW JERSEY WC-ELLISBG 16
NEW JERSEY WC-KINGSTN 25NEW JERSEY WC-GIBBSBO 43NEW JERSEY WC-GIBBSBO 41USGS-GLOUC CTY CG BASE 1GARDEN ST WC-BLACKWOOD 3
NEW JERSEY WC-OTTERBK 29NEW JERSEY WC-OTTERBK 39NEW JERSEY WC-HADDON 15NEW JERSEY WC-EGBERT DBSHADDONFLD BORO WD-RULON
HADDONFLD BORO WD-LAKE STNEW JERSEY WC-MAGNOLIA 16MERCH-PENN WCOM-BROWN 2AMERCH-PENN WCOM-DEL GN 2MERCH-PENN WCOM-PARK 5
milligrams per liter; Dashes indicate missing data; <
Date ofsample
(yr-mo-dy)
1985081419850814198509091985090419850904
1985091019850910198507021985070219850802
1985081419850815198508151985081519850702
1985100219851002198508161985081619850816
1985081619850703198507031985091019851008
1985090319850903198507151985071519850815
1985101519850829198508291985082919850829
1985080719850808198508081985080819850813
1985081319850711198507111985091819850815
1985080919850809198508071985100119850716
1985071619850809198507091985071019850731
Nitrate andnitrite Nitritenitrogen nitrogen(as N) (as N)
3.90 <0.012.20 <.01.22 .01
<. 10 <.01<.10 <.01
2.20 <.011.40 <.01< 10 <.01'.56 <.01.56 <.01
4.40 <.01.10 <.01.10 <.01.10 <.01.10 <.01
.10 <.01
.10 <.01
.10 <.01
.10 <.01
.10 <.01
5.60 <.01< 10 <.015.00 <.014.90 <.01
23.0 1.20
.10 <.01
.10 <.01
.10 <.01
.10 <.01
.10 <.01
<.10 <.01[79 <!oi.81 <.01.77 <.01
1.90 .02
2.40 <.01<. 10 <.01< 10 <.01.10 <.01
<.10 <.01
.10 <.013.50 <.01.10 <.01.10 .02.10 <.01
.10 <.01
.10 <.01
.10 <.01
.10 .02
.10 <.01
.10 <.01
.10 <.01
.10 <.01
.10 <.013.30 <.01
Nitrogen,dissolved(as N)
4.02.3.52
2.62.9
.86
.76
4.5
4.2
5.9
5.75.4
43
6.66.96.33.2
12
.5
.33.7
3.5
Ammon i a andorganicnitrogen(as N)
<0.01<.01.34.10.10
.031.60.20.06.05
< 01!l2.12.11
1.30
.10
.14
.08
.09
.10
<.01<.01< 01".01
17.0
.03
.05
.21
.22
.39
8.507.106.707.001.10
8.30.15.24.17.13
.07
[6812.0
.34
.18
.24
.21
.18
.29
.15
.23
.174.00.02
, less than]
Ammonianitrogen(as N)
0.1.1.3.1.1
.41.5.8.3.2
.1
.3
.4
.42.1
.4
.4
.3
.4
.8
.3
.3
.7
.520
<.1<. 1.3.3.8
9.55.86.15.51.3
9.4.3.4.4.2
.2
.2
.612
.5
.2
.4
.6
.3
.4
.3
.2
.13.7.2
Ammonianitrogen(as NH4)
.44
.13
.13
.042.1.26.08.06
.15
.15
.141.7
.13
.18
.1
.12
.13
.0122
.04
.06
.27
.28
.5
119.18.69.01.4
11.19.31.22.17
.09
.01
.8815
.44
.23
.31
.27
.23
.37
.19
.3
.225.2.03
Ortho-phosphate(as P)
0.02.06.07
<.01<.01
< 01!oi.06.14
<.01
< 01!02.02.05
<.01
<.01<.01< 01.20.02
<.01<.01<.01!oi.02
<.01<.01.08.01.02
.03
.08
.03
.09
.05
<.01<.01'.02
.03
<.01!oi
<.01!09
.03
.07
.02
.02
.18
.03
.04
.03
<!oi
111

Table 7.--Results of analyses of ground-water samples for dissolved nutrients. 1985-86--Continued
Well number
7-3507-3547-3677-3697-372
7-3797-3867-4127-4777-527
7-5287-5287-5287-5457-555
7-5667-5677-5717-5867-602
15- 115- 115- 2415- 2815- 63
15- 6915- 7915- 7915- 9715-109
15-11815-11815-13015-19215-210
15-25315-27615-28215-28315-283
15-30815-31215-31415-32315-331
15-34215-34715-34815-37415-385
15-39015-41715-43115-43933-187
PH- 6PH- 12PH- 15PH- 19PH- 86
PH- 86PH-820
Local well identifier
MERCH-PENN WCOM-PARK 2PETTY ISLAND DBSCAMDEN CITY WD-PUCHACKCAMDEN CITY WD-DELAIR 2MERCH-PENN WCOM-NAT HWY 1
CAMDEN CITY WD-MORRIS 10CAMDEN CITY WD-MORRIS 3ANEW JERSEY WC-ELM TREE 2USGS- NEW BROOKLYN PK 2 DBSCAMDEN CITY WD-CITY 18
CAMDEN CITY WD-PUCHACK 7CAMDEN CITY WD-PUCHACK 7CAMDEN CITY WD-PUCHACK 7CAMDEN CITY WD-MORRIS 11PENLER ANODIZING CO 1
NJDEP-HARRISON AVE 6NJDEP-HARRISON AVE 7PENNSAUKN LANDFILL MON 4CAMDEN CITY WD-MORRIS 12MERCH-PENN WCOM HWY 2
CLAYTON BORO WD 3CLAYTON BORO WD 3DEPTFORD TWP MUA 4E GREENWICH TWP WD 2GLASSBORO BORO WD 4
GREENWICH TWP WD 3El DUPONT REPAUNO 6El DUPONT REPAUNO 6HERCULES CHEM GIBB 8 DBSMOBIL OIL-GREENWICH 41
MOBIL OIL-GREENWICH 47MOBIL OIL-GREENWICH 47SO JERSEY WC 3MANTUA MUA 5PAULSBORO WD 6-1973
WASHINGTON TWP MUA 6-64W DEPTFORD TWP WD 4W DEPTFORD TWP 5SHELL CHEM CO 3SHELL CHEM CO 3
PENWALT CORP TW 8W DEPTFORD TWP WD 6TEXACO EAGLE PT 6- PRODTEXACO EAGLE PT 3-OBSWOODBURY WD RAILROAD 5
DEL MONTE CORP 10GREENWICH TWP WD 5GREENWICH TWP WD 6DEPTFORD TWP MUA 6PITMAN WD 4
GLOUCESTER CO SEW AUTH 1S&S AUCTION HOUSE 1 1978WOODBURY CITY WD 6-81ESSEX CHEM-OLIN 2-1970USGS-POINT AIRY DBS
US NAVY 6US NAVY 12US NAVY 15US NAVY 19US NAVAL HOSPITAL
US NAVAL HOSPITALDEL VAL FISH CO INC
Date of sample
(yr-mo-dy)
1985073119851112198508061985071719850801
1985071719850806198509191985092319850829
1985080619850806198508061985080619850828
1985101619851016198510101985071719850801
1985091719850917198507121985072319850724
1985072519850917198509171985101119851018
1985101819851018198507231985072319850925
1985072419850718198507181985092419850924
1985092619850718198509241985100419850722
1985092619850725198507251985071219850724
1985092619851003198507221985092519851007
1985111419860123198601241985111419850912
1985100919850910
Nitrate and nitrite nitrogen (as N)
3.20<.101.50<.103.50
<.10.13
<.10.42
2.90
3.003.103.30.17
<.10
3.60.18.81
<.103.00
<.10<.10<.10<.10<.10
.248.407.60.95
<.10
.12<.10<.10<.10<.10
<.10<.10<.10<.10<.10
<.10<.10<.10<.10<.10
<.103.90.96
<.10<.10
<.108.10<.10<.10.15
<.10<.10<.10<.10<.10
18.0
Nitrite nitrogen (as N)
<0.01.01.01
<.01<.01
<.01.01
<.01<.01.01
<.01<.01<.01<.01.01
<.01<.01<.01<.01<.01
<.01<.01<.01<.01.02
<.01.02.02.01
<.01
<.01<.01<.01<.01<.01
<.01<.01<.01<.01<.01
<.01<.01<.01<.01<.01
<.01<.01<.01<.01<.01
.01
.03<.01.01
<.01
<.01.01.02
<.01.01
<.01
Nitrogen, dissolved (as N)
3.4
3.8
11
3.3
3.54.03.81.2
5.5241.5
3.2
.549.68.21.7
.52
--
4.51.5
8.4
1.2
18
Ammonia and organic nitrogen (as N)
0.0725.0
.25
.10
.03
2.1010.0
.13
.05
.20
<.01<.01.02
1.30.35
1.6018.0
.03
.16
.03
.69
.68
.25
.35
.36
.10
.57
.57
.202.10
.11
.06
.57
.39
.16
<.01.29.28.27.25
.23
.13
.271.30.20
.22
.50<.01.20.38
3.90.04.32.62.22
.915.0104.801.00
. ..20
Ammonia nitrogen (as N)
0.228
.52.2.3
3.411
.3
.4
.5
.9
.51.01.3
1.924
.7
.7
.2
1.9.9.2.3.3
.31.2.6.8
2.4
.4
.3
.4
.3
.2
<.1.3.3.5.4
.3
.3
.91.6.3
.3
.6
.5
.2
.5
4.2.3.6.7
1.0
.7314.09.34.51.1
.09
Ammonia nitrogen (as NH4)
0.0932
.32
.13
.04
2.713
.17
.06
.26
.01
.01
.031.7.45
2.123
.04
.21
.04
.89
.88
.32
.45
.46
.13
.73
.73
.262.7
.14
.08
.73
.5
.21
.37
.36
.35
.32
.3
.17
.351.7.26
.28
.64
.01
.26
.49
5.0.05.41.8.28
.9418125.81.4
.09
Ortho- phosphate (as P)
0.01.08.03.05
<.01
<.01.10.02
<.01.04
<.01<.01.02
<.01<.01
.01
.02<.01<.01<.01
.27
.27
.11
.25
.23
<.01<.01<.01<.01<.01
<.01<.01.21.20.04
.12
.18
.24
.22
.22
.20
.17
.05<.01.16
.02
.03<.01.28.23
.01<.01.11
<.01.33
.01
<.01<.01
...03
112

Table 8.--Results of analyses of ground-water samples for purgeable organic compounds. 1985-86
Wellnumber
5- 895- 915-1005-1245-393
5-7807- 987-3297-3457-350
7-3677-3867-4127-5277-555
7-56615- 7915- 9715-10915-253
15-30815-34215-39015-439PH- 15
PH- 86PH-820
Wellnumber
5- 895- 915-1005-1245-393
5-7807- 987-3297-3457-350
7-3677-3867-4127-5277-555
7-56615- 7915- 9715-10915-253
15-30815-34215-39015-439PH- 15
PH- 86PH-820
[Concentrations
Local wellidentifier
TENNECO CHEM 7TENNECO CHEM 4HERCULES POWDER 2
in micrograms per liter; Dashes indicate missing data; <, less than]
Date ofsample
(yr-mo-dy)
198509101985091019850702
NJ WC-DEL VALLEY WC-STPHEN 19850802RIVERSIDE INDUSTRY 39
WASTE RESOURCE OBS 6NEW JERSEY WC-CAMDEN 52MERCH-PENN WCOM- BROWN 2AMERCH-PENN WCOM-PARK 5MERCH-PENN WCOM-PARK 2
CAMDEN CITY WD-PUCHACKCAMDEN CITY WD-MORRIS 3ANEW JERSEY WC-ELM TREE 2CAMDEN CITY WD-CITY 18PENLER ANODIZING CO 1
NJDEP-HARRISON AVE 6El DUPONT REPAUNO 6HERCULES CHEM GIBB 8 OBSMOBIL OIL-GREENWICH 41WASHINGTON TWP MUA 6-64
PENWALT CORP TW 8DEL MONTE CORP 10GLOUCESTER CO SEW AUTH 1ESSEX CHEM-OLIN 2-1970US NAVY 15
US NAVAL HOSPITALDEL VAL FISH CO INC
Local wellidentifier
TENNECO CHEM 7TENNECO CHEM 4HERCULES POWDER 2NJ WC-DEL VALLEY WC-STPHENRIVERSIDE INDUSTRY 39
WASTE RESOURCE OBS 6NEW JERSEY WC-CAMDEN 52MERCH-PENN WCOM- BROWN 2AMERCH-PENN WCOM-PARK 5MERCH-PENN WCOM-PARK 2
CAMDEN CITY WD-PUCHACKCAMDEN CITY WD-MORRIS 3ANEW JERSEY WC-ELM TREE 2CAMDEN CITY WD-CITY 18PENLER ANODIZING CO 1
NJDEP-HARRISON AVE 6El DUPONT REPAUNO 6HERCULES CHEM GIBB 8 OBSMOBIL OIL-GREENWICH 41WASHINGTON TWP MUA 6-64
PENWALT CORP TW 8DEL MONTE CORP 10GLOUCESTER CO SEW AUTH 1ESSEX CHEM-OLIN 2-1970US NAVY 15
US NAVAL HOSPITALDEL VAL FISH CO INC
19850816
1985100819850807198507091985073119850731
1985080619850806198509191985082919850828
1985101619850917198510111985101819850724
1985092619850926198509261985092519860124
1985100919850910
Date of sample
(yr-mo-dy)
1985091019850910198507021985080219850816
1985100819850807198507091985073119850731
1985080619850806198509191985082919850828
1985101619850917198510111985101819850724
1985092619850926198509261985092519860124
1985100919850910
Benzene
<3.0<3.0<3.0<3.0<3.0
<3.0<5.0<3.0<3.0<3.0
<3.0<3.0<3.0<3.029
3.0<3.0<3.0
310<3.0
<3.0<3.0<3.0
160<5.0
<3.0<3.0
Methyl -bromide
<3.0<3.0<3.0<3.0<3.0
<3.0<5.0<3.0<3.0<3.0
<3.0<3.0<3.0<3.0<3.0
<3.0<3.0<3.0<3.0<3.0
<3.0<3.0<3.0<3.0<.2
<3.0<3.0
Ethyl -benzene
<3.0<3.0<3.0<3.0<3.0
<3.0<5.0<3.0<3.0<3.0
<3.0<3.0<3.0<3.0<3.0
<3.0<3.0<3.0<3.0<3.0
<3.0<3.0<3.08.5<.2
<3.0<3.0
Methylenechloride
<3.0<3.0<3.0<3.0<3.0
<3.0<5.0<3.0<3.0<3.0
<3.0<3.0<3.0<3.09.1
<3.0<3.0<3.0<3.0<3.0
<3.0<3.0<3.0<3.0<1.0
<3.0<3.0
Chloro-benezene
3.2<3.0<3.0<3.0<3.0
<3.0<5.0<3.0<3.0<3.0
<3.016<3.0<3.014
<3.03.7<3.0<3.0<3.0
<3.0<3.0<3.0
6202.3
<3.0<3.0
Vinylchloride
<3.0<3.0<3.0<3.0<3.0
<3.0<5.0<3.0<3.0<3.0
<3.04.6<3.0<3.03.0
<3.0<3.0<3.0<3.0<3.0
<3.0<3.0<3.0<3.0<.2
<3.0<3.0
Chloro-ethane
<3.0<3.0<3.0<3.0<3.0
<3.0<5.0<3.0<3.0<3.0
<3.0<3.0<3.0<3.0<3.0
<3.0<3.0<3.0<3.0<3.0
<3.0<3.0<3.0<3.0<.2
<3.0<3.0
Dichloro- bromo-methane
<3.0<3.0<3.0<3.0<3.0
<3.0<5.0<3.0<3.0<3.0
<3.0<3.0<3.0<3.0<3.0
<3.0<3.0<3.0<3.04.8
<3.0<3.0<3.0<3.0<.2
<3.0<3.0
Di- bromo-chloro-methane
<3.0
<3.0
<.2
Dichloro- dif luoro-methane
<3.0<3.0<3.0<3.0<3.0
<3.0<5.0<3.0<3.0<3.0
<3.0<3.0<3.0<3.0<3.0
<3.0<3.0<3.0<3.0<3.0
<3.0<3.0<3.0<3.0<.2
<3.0<3.0
Chloro- Chloro-methane form
<3.0<3.0<3.0<3.0<3.0
<3.0<5.0<3.0<3.0<3.0
<3.0<3.0<3.0<3.0<3.0
<3.0<3.0<3.0<3.0<3.0
<3.0<3.0<3.0<3.0<.2
<3.0<3.0
Carbon tetra-chloride
<3.0<3.0<3.0<3.0<3.0
<3.0<5.0<3.0<3.0<3.0
<3.0<3.0<3.0<3.0<3.0
<3.0<3.0<3.0<3.0<3.0
<3.0<3.0<3.0<3.0<.2
<3.0<3.0
<3.0<3.0<3.0<3.0<3.0
<3.05.2
<3.0<3.0<3.0
<3.0
<3.0<3.0<3.0
<3.03.7<3.0<3.035
<3.0<3.0<3.08.4<.2
<3.0<3.0
Tetra- chloro-
Bromo-form
<3.0<3.0<3.0<3.0<3.0
<3.0<5.0<3.0<3.0<3.0
<3.0<3.0<3.0<3.0<3.0
<3.0<3.0<3.0<3.0<3.0
<3.0<3.0<3.0<3.0<.2
<3.0<3.0
Tolu-ethylene ene
<3.0<3.0<3.0<3.09.7
<3.0<5.07.2
<3.0<3.0
<3.0<3.0<3.0158.5
<3.0130<3.0<3.0<3.0
<3.0<3.0<3.065<.2
<3.032
<3.0<3.0<3.0<3.0<3.0
<3.0<5.0<3.0<3.0<3.0
<3.0<3.0<3.0<3.0<3.0
<3.0<3.0<3.0<3.0<3.0
<3.0<3.0<3.05.83.0
<3.0<3.0
113

Table 8.--Results of analyses of ground-water samples for purgeable organic compounds. 1985-86--Continued
Wellnumber
5- 895- 915-1005-1245-393
5-7807- 987-3297-3457-350
7-3677-3867-4127-5277-555
7-56615- 7915- 9715-10915-253
15-30815-34215-39015-439PH- 15
PH- 86PH-820
Tri- 1,1,1- Date of Tri- chloro- 1,1-Di- 1,1-Di- Tri-
Local well sample chloro- fluoro- chloro- chloro- chloro-identifier (yr-mo-dy) ethylene methane ethylene ethane
TENNECO CHEM 7 19850910 4.TENNECO CHEM 4 19850910 480HERCULES POWDER 2 19850702 3.NJ WC-DEL VALLEY WC-STPHEN 19850802 <3.RIVERSIDE INDUSTRY 39 19850816 60.
WASTE RESOURCE OBS 6 19851008 <3.NEW JERSEY WC-CAMDEN 52 19850807 160MERCH-PENN WCOM- BROWN 2A 19850709 <3.MERCH-PENN WCOM-PARK 5 19850731 15.MERCH-PENN WCOM-PARK 2 19850731 3.
CAMDEN CITY WD-PUCHACK 19850806 9.CAMDEN CITY WD- MORRIS 3A 19850806 <3.NEW JERSEY WC-ELM TREE 2 19850919 <3.CAMDEN CITY WD-CITY 18 19850829 10.PENLER ANODIZING CO 1 19850828 17.
NJDEP-HARRISON AVE 6 19851016 <3.El DUPONT REPAUNO 6 19850917 8.HERCULES CHEM GIBB 8 OBS 19851011 <3.MOBIL OIL-GREENWICH 41 19851018 5.WASHINGTON TWP MUA 6-64 19850724 <3.
PENWALT CORP TW 8 19850926 <3.DEL MONTE CORP 10 19850926 <3.GLOUCESTER CO SEW AUTH 1 19850926 <3.ESSEX CHEM-OLIN 2-1970 19850925 27.US NAVY 15 19860124 <.
US NAVAL HOSPITAL 19851009 <3.DEL VAL FISH CO INC 19850910 <3.
Well Local wellnumber identifier
5- 89 TENNECO CHEM 75- 91 TENNECO CHEM 45-100 HERCULES POWDER 25-124 NJ WC-DEL VALLEY WC-STPHEN5-393 RIVERSIDE INDUSTRY 39
5-780 WASTE RESOURCE OBS 67- 98 NEW JERSEY WC-CAMDEN 527-329 MERCH-PENN WCOM-BROWN 2A7-345 MERCH-PENN WCOM-PARK 57-350 MERCH-PENN WCOM-PARK 2
7-367 CAMDEN CITY WD-PUCHACK7-386 CAMDEN CITY WD-MORRIS 3A7-412 NEW JERSEY WC-ELM TREE 27-527 CAMDEN CITY WD-CITY 187-555 PENLER ANODIZING CO 1
7-566 NJDEP-HARRISON AVE 615-79 El DUPONT REPAUNO 615- 97 HERCULES CHEM GIBB 8 OBS15-109 MOBIL OIL-GREENWICH 41
15-253 WASHINGTON TWP MUA 6-6415-308 PENWALT CORP TW 815-342 DEL MONTE CORP 1015-390 GLOUCESTER CO SEW AUTH 115-439 ESSEX CHEM-OLIN 2-1970
PH- 15 US NAVY 15PH- 86 US NAVAL HOSPITALPH-820 DEL VAL FISH CO INC
1
100
0
001
60000
09080
00002
00
<3.0<3.0<3.0<3.0<3.0
<3.0<5.0<3.0<3.0<3.0
<3.0<3.0<3.0<3.025
<3.0<3.0<3.0<3.0<3.0
<3.0<3.0<3.0<3.0<.2
<3.0<3.0
Date ofsample
(yr-mo-dy)
1985091019850910198507021985080219850816
1985100819850807198507091985073119850731
1985080619850806198509191985082919850828
19851016198509171985101119851018
1985072419850926198509261985092619850925
198601241985100919850910
<3.<3.9.
<3.<3.
<3.<5.<3.<3.<3.
<3.<3.<3.<3.<3.
<3.<3.<3.3.
<3.
<3.<3.<3.<3.<.
<3.<3.
1,2-Dichloro-
00000
00000
00000
00090
00002
00
propane
<3.0<3.0<3.0<3.0<3.0
<3.0<5.0<3.0<3.0<3.0
<3.0<3.0<3.0<3.08.8
<3.0<3.0<3.0<3.0
<3.0<3.0<3.0<3.0<3.0
<.2<3.0<3.0
<3.0<3.04.8<3.0<3.0
<3.0<5.0<3.0<3.0<3.0
<3.0<3.0<3.0<3.09.6
<3.0<3.0<3.010<3.0
<3.0<3.0<3.0<3.0<.2
<3.0<3.0
1,3-Dichloro-propene
<3.0<3.0<3.0<3.0<3.0
<3.0<5.0<3.0<3.0<3.0
<3.0<3.0<3.0<3.0<3.0
<3.0<3.0<3.0<3.0
<3.0<3.0<3.0<3.0<3.0
<.2<3.0<3.0
ethane
<3.0<3.056<3.0<3.9
<3.0<5.0<3.0<3.0<3.0
<3.0<3.08.0
<3.03.9
<3.0<3.0<3.0<3.0<3.0
<3.04.2<3.0<3.0<.2
<3.0<3.0
Trans- 1 2-Di-cnloro-ethylene
<3.0100<3.0<3.0<3.0
<3.0<5.0<3.0<3.0<3.0
4.45.3<3.0<3.158
<3.0<3.0<3.013
<3.0<3.0<3.0<3.046
<.2<3.0<3.0
1,1,2- Tri- chloro-ethane
<3.0<3.0<3.0<3.0<3.0
<3.0<5.0<3.0<3.0<3.0
<3.0<3.0<3.0<3.0<3.0
<3.0<3.0<3.0<3.0<3.0
<3.0<3.0<3.0<3.0<.2
<3.0<3.0
2-Chloro- ethyl-vinylether
<3.0<3.0<3.0<3.0<3.0
<3.0<5.0<3.0<3.0<3.0
<3.0<3.0<3.0<3.0<3.0
<3.0<3.0<3.0<3.0
<3.0<3.0<3.0<3.0<3.0
<.2<3.0<3.0
1,1,2,2 Tetra- chloro-ethane
<3.0<3.0<3.0<3.0<3.0
<3.0<5.0<3.0<3.0<3.0
<3.0<3.0<3.0<3.0<3.0
<3.0<3.0<3.0<3.0<3.0
<3.0<3.0<3.0<3.0<.2
<3.0<3.0
1,2-Di chloro-ethane
<3<3<3<3<3
<319<3<3<3
<3<3<3<6<3
<3<3<3<3<3
<3<3<3
750<
<3<3
.0
.0
.0
.0
.0
.0
.0
.0
.0
.0
.0
.0
.7
.0
.0
.0
.0
.0
.0
.0
.0
.0
.2
.0
.0
114