poverty across ethnic groups through recession and austerity · poverty across ethnic groups...
TRANSCRIPT
MARCH 2015WWW.JRF.ORG.UK
REPORT
POVERTY ACROSS ETHNIC GROUPS THROUGH RECESSION AND AUSTERITYPaul Fisher and Alita Nandi
The recent recession in the UK and the austerity measures that followed may have had different impacts on different ethnic groups. This report examines how the economic condition of different ethnic groups has changed since the onset of the ‘Great Recession’ and the austerity measures that followed (2009/10–2012/13).
The report:• compares economic well-being measures (household income, access to
goods and services for achieving a reasonable standard of living, poverty status) of different ethnic groups across the two periods;
• investigates for each ethnic group which components of income contributed to these changes;
• considers whether changes in employment rates among men and women in these groups contributed to these changes;
• compares persistent poverty across different ethnic groups and identifies factors which are associated with persistent poverty.

CONTENTS
Executive summary 04
1 Introduction 08 2 Comparing economic well-being across ethnic minority
groups before and during the period of recession and austerity 10
3 Poverty dynamics 32
Notes 46 References 47 Appendix 49 Acknowledgements 60 About the authors 61
List of figures 1 Average household income across the two periods 12 2 Median household income across the two periods 13 3 Change in average household income 14 4 Change in median household income 15 5 Proportion of students 16 6 Change in proportion in paid employment 17 7 Proportion of dual earner couples among all couples 18 8 Self-employment rate 18 9 Unemployment rate 1910 Change in unemployment rate by age group 1911 Change in hours worked among 31–59-year-old men
in paid employment 2012 Change in hours worked among 31–59-year-old women
in paid employment 2013 Relative poverty rates 2614 Change in relative poverty rates during 2009/10–
2012/13 relative to 2004/05–2007/08 2715 The very poorest and the very richest 2816 Material deprivation 2917 Child poverty 3018 Economic status by ethnic group 33

19 Age profile of the ethnic groups 3420 Education attainment by ethnic group 3521 Family type by ethnic group 3622 Persistent poverty rates by ethnic group 3823 Immigrant generation by ethnic group 3924A Household characteristics by ethnic group 4024B Household characteristics by ethnic group 4125 Poverty entry and exit rates by ethnic group 4226A English language skills by ethnic group 4326B English language skills by persistent poverty status 44
List of tables 1 Change in average income components (£ per week) 23 2 Poverty outcomes in Understanding Society (means) 36

04
EXECUTIVE SUMMARY
Since the last quarter of 2008 the UK has experienced a severe recession (often referred to as the Great Recession). In 2010 the government imposed certain austerity measures. The objective of this report is to find out what impact, if any, this period of recession and austerity had on the economic well-being of ethnic minority groups.
1 Introduction
The impact of these events has been well-documented for the UK population as a whole. But it is not clear whether all ethnic groups suffered the same fate. There could be many reasons for this difference such as increased discrimination, and differential impact on industries where some ethnic minority groups are concentrated. In the first part of this report we compare economic well-being of different ethnic groups living in Great Britain before (2004/05–2007/08) and during (2009/10–2012/13) the period of recession and austerity using income and non-income based measures. This analysis is based on data from a nationally representative (repeated) cross-sectional survey, the Family Resources Survey.
A second objective of this report is to measure and compare poverty persistence among different ethnic groups in Great Britain since 2009 and to identify characteristics (such as gender, education, age, migrant generation, disability status, English language proficiency) that are associated with poverty persistence among different ethnic groups. While being in a poor economic position and poverty is of serious concern, not being able to get out of such a state is of greater concern. During the short term, a family with low income may be able to draw on savings to fund consumption but this is not possible if the family continues to be in poverty for a long time. Therefore, the cumulative effect on well-being of spending multiple years in poverty is likely to be much greater than that for single periods.

05Executive summary
2 Comparing economic well-being across ethnic minority groups before and during the period of recession and austerity
Average net equivalised real household incomes after deducting housing costs (AHC income) fell across all ethnic groups other than the Pakistani group. For White majority, Black Caribbean and Bangladeshi groups the average AHC incomes fell by 3–4 per cent but the fall was not statistically significant for the Bangladeshi group. The average AHC income fell by 29 per cent for the Chinese followed by 9 per cent for the Black African, Indian and Other White groups.
When we compared median or ‘typical’ AHC incomes we found that Pakistani and Bangladeshi groups experienced small increases (4–5 per cent) but this was not significant for the Bangladeshi group. Chinese and Other White groups experienced decreases of 19–21 per cent, followed by 3–7 per cent for the other groups, although these changes were not significant for Black Caribbean and Black African groups.
To understand these changes we next looked at the changes in composition of income and enrolment and employment patterns.
Employment and enrolment statusWe found that student enrolment rates among 16–59-year-olds increased during the period of recession and austerity but mostly for Bangladeshi men, Chinese men and women, and Pakistani women. But note that part of the increase in student enrolment among Chinese men and women and Bangladeshi men could simply be the result of an increase in Chinese foreign-born students entering the UK rather than increased enrolment among UK-born Chinese. The country of birth information that is available since 2008/09 shows that 90 per cent of Chinese students and 74 per cent of Bangladeshi men are born outside the UK. Additionally, we found that there was an increase in single families and a drop in couple families in these groups during this period and single persons are more likely to migrate to the UK than those with families.
When we looked at employment status changes among non-students, we found that the proportion of men and women in paid employment fell for Black Caribbean, Black African and Other White groups and increased for the Pakistani group. For the other groups, this fell among men and increased among women – this gender difference being the highest for the Bangladeshi group. The proportion of dual earner couple families also increased among Pakistani, Bangladeshi and Chinese groups.
Self-employment rates increased among Black Caribbean and Other White groups and fell among the Chinese. It fell among Indian, Pakistani and Bangladeshi men and increased among women in these groups.
Unemployment rates increased but mostly for the younger age group; for the older age group hours worked per week fell.
Composition of household incomeDuring the period of recession and austerity average gross real labour market earnings was lower for most groups except for Pakistani and Bangladeshi groups; the fall was the greatest for Black Caribbean, Black African and Other White groups. Benefit incomes increased for most groups except for Indian and Bangladeshi groups and average deductions (mainly taxes) fell for most groups except Other White groups.
During this period housing costs increased for all but more for Other White and Chinese groups who were mostly private renters. This is possibly

06Poverty across ethnic groups through recession and austerity
because social rents did not increase, mortgage interest payments fell and private rents increased (Belfield, et al., 2014) and around one-third of Bangladeshi, Black Caribbean and Black African groups are social renters and around two-fifths of White majority, Indian and Pakistani are mortgage paying home-owners.
As pensioner income was more resilient during this period (Belfield, et al., 2014) and White majority, Black Caribbean, Indians, Pakistanis and Bangladeshis have higher proportions of pensioners, once pensioners were excluded, we found that the fall in AHC incomes was higher for White majority, Black Caribbean and Indians groups; but not for Pakistani and Bangladeshi groups.
As students have lower incomes and the proportion of students increased for Chinese and Bangladeshi groups, we also compared incomes after excluding students and found that the fall in AHC incomes was lower for these groups.
Poverty, material deprivation and inequalityAbsolute levels of deprivation did not change for the four poorest groups – Pakistani, Bangladeshi, Black Caribbean and Black African groups but it worsened for all other groups, less so for the White majority.
Overall within-group income inequality decreased while between-group income inequality increased.
We found that while the average overall deprivation scores hardly changed (except among Black Caribbean families) adult specific deprivation score increased for almost all groups (except for Pakistani families). In other words, it is possible that parents protected the welfare of their children during the recession at the expense of their own consumption.
Child povertyBefore the onset of the recession, Bangladeshi and Pakistani children were the most deprived followed by Black Caribbean and Black African children (using three different measures). Deprivation among children in these groups fell during the recession except for Black Caribbean children when deprivation was measured using the combined measure (based on material deprivation and relative poverty measure) – this is consistent with increased material deprivation we found in Black Caribbean families. The drop in deprivation among Bangladeshi children is the highest. This is consistent with the change in composition of this group – during the recession and austerity period the number of dependent children per household was lower.
3 Poverty dynamics
Persistent poverty among ethnic minority groupsPersistent poverty was most prevalent among the Pakistani and Bangladeshi groups, with 37 per cent of Pakistanis in poverty for two consecutive years and 14 per cent in poverty for three consecutive years. Only a third (32 per cent) of Pakistanis and Bangladeshis did not experience poverty in the period 2009 to 2012.
Although Black African and Black Caribbean groups did not have especially high poverty rates, they had high rates of persistent poverty (31 and 23 per cent, respectively). So although many were not in poverty, those falling into poverty seemed to find it hard to escape.

07Executive summary
The White majority group have relatively low rates of persistent poverty and high rates of never being poor. Nearly 72 per cent are never in poverty, 13 per cent in poverty at least twice and 5 per cent are poor in all three years in which they were observed. The Chinese and Other White groups are very similar to the White majority. Indians experience slightly higher persistent poverty rates (16 per cent) but a similar proportion was poor in all three years (6 per cent).
Characteristics of the persistently poorComparing the non-persistently poor with the persistently poor for each ethnic group we observe that: the groups in poverty tend to be younger, substantially less likely to have a degree and substantially more likely to have no qualifications, less likely to be employed and more likely to unemployed (notably so for the Mixed parentage, Other White and Black Caribbean groups). The Pakistani and Bangladeshi groups are more likely to have children and have slightly large families, although this pattern is less clear for the other ethnic groups. All of the ethnic groups in persistent poverty are more likely to live in social housing compared with the non-persistently poor and the difference is particularly large for the Mixed parentage, Other White and Black African groups. There is also a tendency for those in persistent poverty to be (first generation) immigrants – the effect is larger for Black African, Black Caribbean and Bangladeshis – although not so for the Mixed parentage and Other White groups.
English language skillsWhile we cannot determine whether low English language skills causally lead people to poverty, we could examine statistical associations between persistent poverty and English language skills whilst accounting for other factors. We found that holding other things constant having English as a first language reduces the probability of being in persistent poverty.
Among those for whom English is not their first language we found that difficulty in speaking English increases the chances of being in persistent poverty but reading English matters less. However, possibly due to smaller sample sizes these effects are not statistically significant and are imprecisely estimated.

08
1 INTRODUCTION
This report compares the economic well-being of different ethnic groups in Britain during the recent period of recession and austerity.
Evidence since the 1990s has shown that compared with the White majority group most ethnic minority groups are more economically disadvantaged (Modood, et al., 1997; Berthoud, 1998). Particularly, they experience employment and pay penalties (Modood, et al., 1997; Berthoud, 1998; Heath and Cheung, 2006; Clark and Drinkwater, 2007; Platt, 2007; Li, et al., 2008; Longhi and Platt, 2009; Machin, et al., 2009; Longhi, et al., 2013; Nandi and Platt, 2012; Brynin and Guveli, 2012). It has also been clearly established that there is wide variation across and within different ethnic minority groups (Modood, et al., 1997; Berthoud, 1998; Platt, 2007; Nandi and Platt, 2010; Hills, et al., 2010; Cheung and Heath, 2007; Clark and Drinkwater, 2007). For example, while Indian and Chinese groups fare well compared with the White majority group, Pakistani and Bangladeshi, Black African and Black Caribbean groups do not, with Pakistani and Bangladeshi groups being the most severely disadvantaged. But ethnic differences in earnings and employment rates vary by gender as well. For example, Black Caribbean women have employment rates similar to, or better than, White majority women, but Black Caribbean men have much lower employment rates than White majority men. At the other extreme are Pakistani and Bangladeshi groups – the difference in employment rates among women in these groups vis-à-vis their White majority counterpart, is much higher than that among men.
During the 1990s the employment and earnings gap between ethnic minority groups and the White majority decreased particularly for Pakistani, Bangladeshi, Black Caribbean and Black African groups (Hogarth, et al., 2009; Clark and Drinkwater, 2007). This was partly explained by increases in human capital particularly among the second generation. However, gaps in employment rate still persist as the 2011 UK Census data revealed (Nazroo and Kapadia, 2013). During this period the UK experienced a severe recession (often referred to as the Great Recession) starting in the second quarter of 2008 and the government imposed austerity measures since 2010. The objective of this report is to find out what impact, if any, these events had on the economic well-being of ethnic minority groups. The impact of these events have been well documented for the UK population
09Introduction
as a whole (Belfield, et al., 2014) but it is not clear whether all ethnic groups suffered the same fate. Some evidence of widening of the employment gap (vis-à-vis White groups) during 2008 and 2009 has been reported for Black groups but not for Asian and Mixed groups (EHRC, et al., 2009). Why should ethnicity matter in the face of such macro events? Evidence from earlier recessions in the UK has shown that ethnicity does matter – unemployment rates among many ethnic minority groups rose faster compared with the White majority during recessions but did not fall as fast at other times (Modood, et al., 1997; Leslie, et al., 2002). There could be many reasons for this difference such as differential impact on industries where some ethnic minority groups are concentrated or increased discrimination.
A second objective of this report is to understand the nature of economic disadvantage across ethnic minority groups. While being in a poor economic position and poverty is of serious concern, not being able to get out of such a state is of greater concern. This project aims to measure and compare poverty persistence among different ethnic groups in the UK since 2009 and to identify characteristics (such as gender, education, age, migrant generation, disability status, English language proficiency) that are associated with poverty persistence among different ethnic groups.
This report is divided into two sections. In the first section we compare economic well-being of different ethnic groups before and during the period of recession and austerity (2004/05–2007/08 and 2009/10–2012/13) using income and non-income measures. In the second section we compare persistent poverty across different ethnic groups over the period 2009–12 and identify characteristics that are associated with poverty persistence across different ethnic groups.

10
2 COMPARING ECONOMIC WELL-BEING ACROSS ETHNIC MINORITY GROUPS BEFORE AND DURING THE PERIOD OF RECESSION AND AUSTERITY
In this section we compare economic well-being of different ethnic minority groups during the two periods 2004 to 2008 and 2009 to 2013.
The recent recession (defined as fall in GDP growth rate for two consecutive quarters) in the UK started during the second quarter of 2008 and continued until the third quarter of 2009 although the real GDP has still not reached 2008 levels (see ONS Quarterly National Accounts Q3 2014 Dataset, ABMI series). During the 2010 budget austerity measures were announced which included tax increases such as an increase in VAT from 17.5 per cent to 20 per cent and cuts in different benefits (see Callan, et al., 2011). To understand the combined impact of both the recession and the subsequent austerity measures on the economic well-being and living standards of different ethnic groups we use data from the Family Resources Survey (and its derived dataset the Households Below Average Income (HBAI)). In this survey approximately 25,000 households from the UK are randomly selected each year (around 20,000 households in the last two survey years, 2011/12 and 2012/13) and asked about different aspects of their lives including their socio-demographic characteristics such as age, sex, ethnic group, educational qualifications as well as labour market activities

11Comparing economic well-being across ethnic minority groups
(employment status, wages, hours worked, occupation, industry and so on) and income.
In the FRS, ethnic group is based on the UK Census ethnic group question. Note that the ethnic group category names used in this report are abbreviations. For example, the complete Bangladeshi category is ‘Asian or Asian British: Bangladeshi’ (see Table A1 in the appendix for further details). We excluded the Northern Ireland sample as the wording of the ethnic group question changed over the years making it difficult to compare across years. This is not a serious concern for this analysis as ethnic minorities comprise a very small part of the population of Northern Ireland – only two per cent of the usual resident population of Northern Ireland in 2011 reported their ethnic group as something other than White majority (Nisra, 2011). We report and discuss statistics for those who reported their ethnic group as White majority, Other White groups, Black Caribbean, Black African, Indian, Pakistani, Bangladeshi, Chinese and Mixed parentage. Firstly, note that the Mixed parentage group is by definition very heterogeneous (see Table A1 in the appendix).1 In this section, we also exclude ethnically mixed families. The sizes of the ethnic group samples are shown in Table A1 in the appendix. Secondly, as the sample sizes for Bangladeshi and Chinese groups are around 500–600 in each period, it means that the statistical power of sub-group level analyses for these groups will be low. Thirdly, due to the difficulties in identifying the self-employed and measuring their incomes, the part of the analysis pertaining to these figures should be used with caution (Alzubaidi, et al., 2013).
Household income
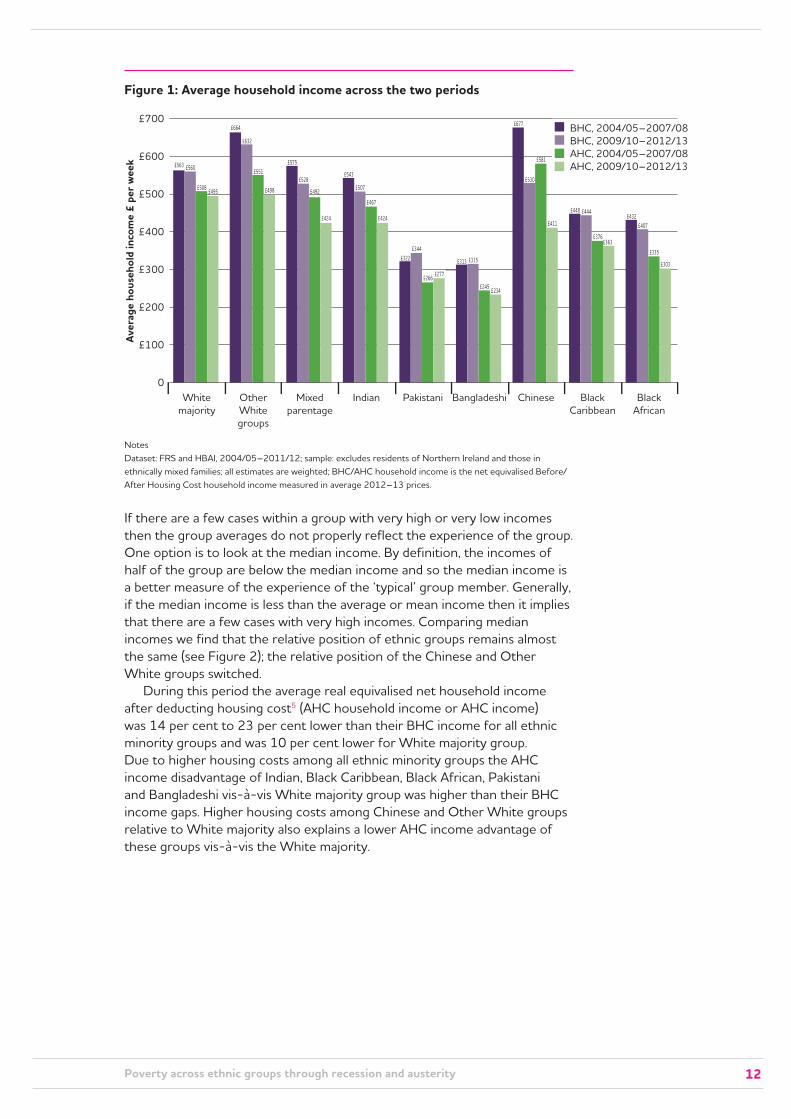
Before 2008 Before the onset of the recession (2004/05 until 2007/08) the average real2 equivalised3 net4 household income measured before deducting housing costs (BHC household income or BHC income) of Chinese and Other White group was around £100 per week higher than that of the White majority (see Figure 1). The average BHC household income of the Indian group was slightly lower (by £20 per week) than that of the White majority, while that of Black Caribbean and Black African groups were £115 and £131 per week lower than that of the White majority. Pakistani and Bangladeshi groups had the lowest incomes – these were lower by £241 and £250 per week. The low incomes among these two groups are a reflection of both low incomes (see Table A3 in the appendix which shows the average net real BHC household income before adjusting for family size and composition) and larger family sizes and higher number of dependent children (see Figures A1 and A2 in the appendix).
12Poverty across ethnic groups through recession and austerity
Figure 1: Average household income across the two periods
£400
£300
£200
£500
£600
£700
£100
0White
majorityOtherWhitegroups
Mixedparentage
Indian Pakistani Bangladeshi Chinese BlackCaribbean
BlackAfrican
Aver
age
hous
ehol
d in
com
e £
per
wee
k £563 £560
£508 £495
£664
£632
£551
£498
£575
£528
£492
£424
£543
£507
£467
£424
£322£344
£266 £277
£313 £315
£245 £234
£677
£530
£581
£411
£448 £444
£376£363
£432£407
£335
£303
BHC, 2004/05–2007/08BHC, 2009/10–2012/13AHC, 2004/05–2007/08AHC, 2009/10–2012/13
NotesDataset: FRS and HBAI, 2004/05–2011/12; sample: excludes residents of Northern Ireland and those in ethnically mixed families; all estimates are weighted; BHC/AHC household income is the net equivalised Before/After Housing Cost household income measured in average 2012–13 prices.
If there are a few cases within a group with very high or very low incomes then the group averages do not properly reflect the experience of the group. One option is to look at the median income. By definition, the incomes of half of the group are below the median income and so the median income is a better measure of the experience of the ‘typical’ group member. Generally, if the median income is less than the average or mean income then it implies that there are a few cases with very high incomes. Comparing median incomes we find that the relative position of ethnic groups remains almost the same (see Figure 2); the relative position of the Chinese and Other White groups switched.
During this period the average real equivalised net household income after deducting housing cost5 (AHC household income or AHC income) was 14 per cent to 23 per cent lower than their BHC income for all ethnic minority groups and was 10 per cent lower for White majority group. Due to higher housing costs among all ethnic minority groups the AHC income disadvantage of Indian, Black Caribbean, Black African, Pakistani and Bangladeshi vis-à-vis White majority group was higher than their BHC income gaps. Higher housing costs among Chinese and Other White groups relative to White majority also explains a lower AHC income advantage of these groups vis-à-vis the White majority.

13Comparing economic well-being across ethnic minority groups
Figure 2: Median household income across the two periods
£400
£300
£200
£500
£600
£700
£100
0White
majorityOtherWhitegroups
Mixedparentage
Indian Pakistani Bangladeshi Chinese BlackCaribbean
BlackAfrican
Med
ian
hous
ehol
d in
com
e £
per
wee
k
£463 £460
£414 £404
£499
£442
£393
£321
£435 £428
£355£334
£437£422
£373
£346
£273 £285
£217 £229
£265
£289
£206 £213
£477
£409£387
£306
£399 £390
£328£312
£359 £353
£256 £245
BHC, 2004/05–2007/08BHC, 2009/10–2012/13AHC, 2004/05–2007/08AHC, 2009/10–2012/13
Notes Dataset: FRS and HBAI, 2004/05–2011/12; sample: excludes residents of Northern Ireland and those in ethnically mixed families; all estimates are weighted; BHC/AHC household income is the net equivalised Before/After Housing Cost household income measured in average 2012–13 prices.
After 2008During the period of recession and austerity (2009/10 to 2012/13), average and median household incomes generally fell; AHC incomes fell more than BHC incomes reflecting a rise in housing costs. There was variation in income changes across ethnic groups (see Figures 3 and 4) but notall these changes were statistically significant at the 10 per cent level of significance. If a change is statistically significant at the 10 per cent level of significance then we can say that there is a 90 per cent chance that a change has happened.6 In other words, this means that there is a 10 per cent or less chance of observing a change in the sample even if there was no change in the population.
Household incomes of White majority and Black Caribbean families did not change very much.
• The average BHC and AHC household incomes of White majority families fell by £4 and £13 per week but only their AHC household income change was statistically significant. Median BHC and AHC household incomes also fell by £3 and £10 per week and both were statistically significant.
• Black Caribbean families experienced similar changes in their income as White majority families. The average BHC and AHC income of Black Caribbean families fell by £4 and £13 per week and the median BHC and AHC incomes fell by £9 and £16 per week. But none of these changes were statistically significant.
14Poverty across ethnic groups through recession and austerity
Figure 3: Change in average household income
White majority
Other White groups
Mixed parentage
Indian
Pakistani
Bangladeshi
Chinese
Black Caribbean
Black African
£ per week
AHCBHC
–200 –150 –100 –50 0 50
–4–13
–32–53
–47–68
–35–43
2212ns
2nsns
nsns
–10
–147–170
–4–13
–25–31
ns
ns
ns
Notes Dataset: FRS and HBAI, 2004/05–2011/12; sample: excludes residents of Northern Ireland and those in ethnically mixed families; all estimates are weighted; ns: not significant at 10 per cent level of significance; BHC/AHC household income is the net equivalised Before/After Housing Cost household income measured in average 2012–13 prices.
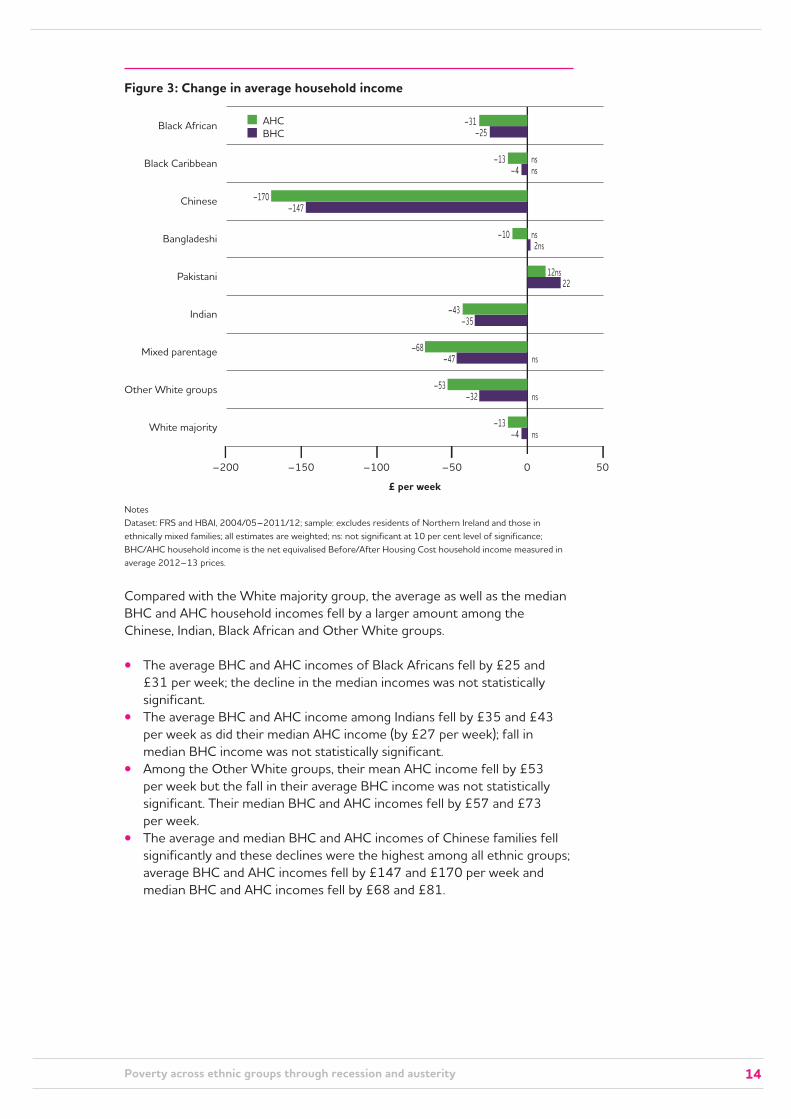
Compared with the White majority group, the average as well as the median BHC and AHC household incomes fell by a larger amount among the Chinese, Indian, Black African and Other White groups.
• The average BHC and AHC incomes of Black Africans fell by £25 and £31 per week; the decline in the median incomes was not statistically significant.
• The average BHC and AHC income among Indians fell by £35 and £43 per week as did their median AHC income (by £27 per week); fall in median BHC income was not statistically significant.
• Among the Other White groups, their mean AHC income fell by £53 per week but the fall in their average BHC income was not statistically significant. Their median BHC and AHC incomes fell by £57 and £73 per week.
• The average and median BHC and AHC incomes of Chinese families fell significantly and these declines were the highest among all ethnic groups; average BHC and AHC incomes fell by £147 and £170 per week and median BHC and AHC incomes fell by £68 and £81.

15
Average net equivalised real household incomes after deducting housing costs fell across all ethnic groups other than the Pakistani group.
Comparing economic well-being across ethnic minority groups
Figure 4: Change in median household income
White majority
Other White groups
Mixed parentage
Indian
Pakistani
Bangladeshi
Chinese
Black Caribbean
Black African
£ per week
AHCBHC
–200 –150 –100 –50 0 50
–3–10
–57–73
–7–21
–15–27
1212
24
nsns
nsns
7ns
–68–81
–9–16
–6–11
ns
ns
ns
NotesDataset: FRS and HBAI, 2004/05–2011/12; sample: excludes residents of Northern Ireland and those in ethnically mixed families; all estimates are weighted; ns: not significant at 10 per cent level of significance; BHC/AHC household income is the net equivalised Before/After Housing Cost household income measured in average 2012–13 prices.
Household incomes among Pakistani and Bangladeshi families either did not change or increased by a small amount.
• The average BHC income among Pakistani families increased by £22 per week but the increase in their average AHC income of £12 per week was not statistically significant. However, when we compared their ‘typical’ or median incomes, these had increased by £12 and the increases were statistically significant.
• The increase in average BHC income of £2 per week and the decrease in average AHC income of £10 per week among Bangladeshi families were not statistically significant. But the increase in their median BHC income of £24 per week was statistically significant.
Average net equivalised real household incomes after deducting housing costs fell across all ethnic groups other than the Pakistani group. For White majority, Black Caribbean and Bangladeshi groups the AHC incomes fell by 3–4 per cent but the fall was not statistically significant for the Bangladeshi group. The average AHC income fell by 29 per cent for the Chinese followed by 9–10 per cent for the Black African, Indian and Other White groups. When we compared median or ‘typical’ AHC incomes we found that Pakistani and Bangladeshi groups experienced small increases (4–5 per cent) but this was not significant for the Bangladeshi group. Chinese and Other White groups experienced decreases of 19–21 per cent, followed by 3–7 per cent for the other groups, although these changes were not significant for Black Caribbean and Black African groups.

16Poverty across ethnic groups through recession and austerity
To understand these changes we next looked at the changes in composition of income and enrolment and employment patterns.
Employment and enrolment status
During recessionary periods, when employment opportunities fall it may make sense to continue in (or enrol in) higher education to acquire human capital while waiting for the economy to recover. But on the other hand, incomes (and hence ability to pay tuition fees) are lower. In the US, Dellas and Sakellaris (2003) find that enrolment increases during recessionary periods. We found that student enrolment rates among 16–59-year-olds increased during the period of recession and austerity but mostly for Bangladeshi men (from 7 per cent to 16 per cent), for Chinese men and women (from around 25 per cent to 30 per cent) and Pakistani women (from 4 per cent to 8 per cent). See Figure 5 for statistics about other groups. Part of the increase in student enrolment among Chinese men and women and Bangladeshi men could simply be the result of increase in foreign-born students from these groups in Great Britain rather than increased enrolment among the UK-born. During the period 2009/10–2012/13,7 90 per cent of Chinese students and 74 per cent of Bangladeshi male students (and 88 per cent of all Chinese and 78 per cent of all Bangladeshi men) were born outside the UK. Additional support for this claim comes from the observation of an increase in single families and drop in couple families in these groups (see Figures A6 and A7 in the appendix).8 To get a clearer picture of income changes for these groups we should compare incomes of non-students across the two periods (discussed later, see Table 1).
Figure 5: Proportion of students
20%
15%
10%
25%
30%
35%
5%
0%White
majorityOtherWhite
Mixedparentage
Indian Pakistani Bangladeshi Chinese BlackCaribbean
BlackAfrican
Men 2004/05–2007/08Men 2009/10–2012/13Women 2004/05–2007/08Women 2009/10–2012/13
NotesDataset: FRS and HBAI, 2004/05–2011/12; sample: excludes residents of Northern Ireland and those in ethnically mixed families; all estimates are weighted.

17Comparing economic well-being across ethnic minority groups
During recessionary periods unemployment generally increases. We found that during this period of recession and austerity, the proportion in paid employment among 16–59-year-olds (excluding students) was lower among men of all ethnic groups except for Pakistani men. The proportion in paid employment among 16–59-year-old non-enrolled women increased among all except White majority, Other White group, Black Caribbean and Black African women (see Figure 6). Specifically, the proportion of Bangladeshi men who are employed fell by 6 percentage points while that of Bangladeshi women increased by 13 percentage points. Note this was accompanied by an 11 percentage point decrease in proportion of Bangladeshi women who are inactive in the labour market.
Figure 6: Change in proportion in paid employment
White majority
Other White groups
Mixed parentage
Indian
Pakistani
Bangladeshi
Chinese
Black Caribbean
Black African WomenMen
–10% –5% 0% 5% 10% 15%
NotesDataset: FRS and HBAI, 2004/05–2011/12; sample: excludes residents of Northern Ireland and those in ethnically mixed families; all estimates are weighted.
If non-employed women enter the labour market during the recession it may result in an increase in dual earner couple families. We found that the proportion of dual earner couple families among all couple families increased for Pakistani, Bangladeshi and Chinese groups by 7, 13 and 15 percentage points, but fell for Black Caribbean and Black African groups by 5–6 percentage points (see Figure 7). This could be one of the reasons why Pakistani and Bangladeshi groups were least adversely affected during the recession.
Self-employment is often expected to increase during periods of high unemployment. However, with some exceptions, we did not find that to be the case (see Figure 8). Self-employment rates (that is the proportion of those who are either employed or looking for work who report self-employment as their main activity) increased by 2–3 percentage points among 16–59-year-old Black Caribbean and Other White group men. It also increased by 2–4 percentage points among 16–59-year-old Indian

18Poverty across ethnic groups through recession and austerity
Figure 7: Proportion of dual earner couples among all couples
40%
30%
20%
50%
60%
70%
10%
0%
2004/05–2007/082009/10–2012/13Change
–10%White
majorityOtherWhitegroups
Mixedparentage
Indian Pakistani Bangladeshi Chinese BlackCaribbean
BlackAfrican
Notes Dataset: FRS and HBAI, 2004/05–2011/12; sample: excludes residents of Northern Ireland and those in ethnically mixed families; all estimates are weighted.
Figure 8: Self-employment rate
20%
15%
10%
25%
5%
0%White
majorityOtherWhitegroups
Mixedparentage
Indian Pakistani Bangladeshi Chinese BlackCaribbean
BlackAfrican
Men 2004/05–2007/08Men 2009/10–2012/13Women 2004/05–2007/08Women 2009/10–2012/13
NotesDataset: FRS and HBAI, 2004/05–2011/12; sample: excludes residents of Northern Ireland and those in ethnically mixed families; all estimates are weighted.
and Pakistani women. One reason could be that self-employment rates which increased over the 1980s and 1990s had started to stagnate during the 2000 (Clark and Drinkwater, 2007). In other words, opportunities for self-employment in the usual spheres had surfeited by the time this recent recession started. It is also possible that if many were engaging in self-employment over and above their main job to top-up their incomes, it would not show up in these figures as these figures pertain to the main activity.

19Comparing economic well-being across ethnic minority groups
A recent ONS report based on Labour Force Survey data show that the number of people who are self-employed has increased since 2008 but the report does not discuss differences by ethnic group (ONS, 2013).
During this period of recession and austerity unemployment rates increased by 3 to 8 percentage points among 16–59-year-old men. It only increased by one percentage point among Pakistani men. Compared with White majority men, the unemployment rate increased more among Bangladeshi, Indian, Black Caribbean and Black African men, and less among Other White groups and Pakistani men. Given the higher levels of non-participation in the labour market, female unemployment rates increased less – 2–3 percentage points among most women. Among Black Caribbean and Black African women who have higher labour market participation rates it increased by 7–8 percentage points. It fell by 13 percentage points among Bangladeshi women (see Figure 9). Note that these increases in unemployment rates are mostly driven by increases in unemployment rate among 16–21-year-olds and to a lesser extent among 22–30-year-olds (see Figure 10). Older men and women experienced much lower increases in unemployment rates, but their work hours reduced (see Figures 11 and 12).
Figure 9: Unemployment rate
20%
15%
10%
25%
30%
5%
0%White
majorityOtherWhitegroups
Mixedparentage
Indian Pakistani Bangladeshi Chinese BlackCaribbean
BlackAfrican
Men 2004/05–2007/08Men 2009/10–2012/13Women 2004/05–2007/08Women 2009/10–2012/13
Figure 10: Change in unemployment rate by age group
16–21
22–30
31–40
41–50
51–59
60+ WomenMen
0% 2% 6% 10%4% 8% 12%
Age
in y
ears

20Poverty across ethnic groups through recession and austerity
Figure 11: Change in hours worked among 31–59-year-old men in paid employment
20%
15%
10%
5%
0%
Whitemajority
OtherWhitegroups
Mixedparentage
Indian Pakistani Bangladeshi Chinese BlackCaribbean
BlackAfrican
–5%
–10%
–15%
–20%
0–20 hours21–38 hours39–45 hours46+ hours
Figure 12: Change in hours worked among 31–59-year-old women in paid employment
20%
15%
10%
5%
0%
Whitemajority
OtherWhitegroups
Mixedparentage
Indian Pakistani Bangladeshi Chinese BlackCaribbean
BlackAfrican
–5%
–10%
–15%
–20%
0–20 hours21–38 hours39–45 hours46+ hours
NotesDataset: FRS and HBAI, 2004/05–2011/12; sample: excludes residents of Northern Ireland and those in ethnically mixed families; all estimates are weighted.
To summarise, the proportion of men and women in paid employment fell for Black Caribbean, Black African and Other White groups and the proportion of men and women in paid employment increased for the

21
Unemployment rates increased but mostly for the younger age group; for the older age group hours worked per week fell.
Comparing economic well-being across ethnic minority groups
Pakistani group. For the other groups, the proportion employed fell among men and increased among women – this gender difference being the highest for the Bangladeshi group. Dual earner couple families among all couple families also increased among Pakistani, Bangladeshi and Chinese groups. Self-employment rates (as measured by main activity status) increased among Black Caribbean and Other White groups and fell among the Chinese. It fell among Indian, Pakistani and Bangladeshi men and increased among women in these groups. Unemployment rates increased but mostly for the younger age group; for the older age group hours worked per week fell.
Composition of household income
How did these changes in the labour market translate into changes in income? We separated BHC household income into the following broad components: employment earnings, profit and losses from self-employment, benefit income including tax credits, pension income and all other income (which includes investment income, receipt of maintenance payments, cash value of income in kind such as free school meals, educational grants including parental support and so on), deductions (which includes income tax payments, National Insurance contributions, maintenance and child support payments, student loan repayments and payments made by parents to students living elsewhere). Additionally, AHC household income is computed by deducting housing cost from BHC income. Housing cost includes rent (gross of housing benefit), ground rent and mortgage interest payments, water charges and structural insurance payments paid by owners. Changes in the average income components (all components are in real term and equivalised) across the two periods are reported in Table 1. For those groups with at least 10 per cent pensioner families (see Figures A5–A7 in the appendix) we also reported changes excluding pensioner families. Enrolment rates increased more for Chinese, Bangladeshi and Pakistani groups, so we also reported changes in income for these groups after excluding students.
Earnings from employment make up around two-thirds of total income for most groups but around half for Pakistani and Bangladeshi groups. The next biggest source of income is benefits. This contributes to around one-third of the income of Pakistani and Bangladeshi groups and a quarter of the income of Black Caribbean and Black African groups. The third biggest contributor is self-employment earnings for all except Black Caribbean and Black African groups.
We found some general patterns. We discuss those first and then move on to the specificities of each group separately. Compared with the period before recession, during the period of recession and austerity average gross real labour market earnings was lower for most groups except for Pakistani and Bangladeshi groups. This is consistent with changes in their employment rates. Pakistani male and female employment rates increased and the Bangladeshi female employment rate increased more than the decrease in their male employment rates. The fall in the contribution of labour earnings to total income was the greatest for Black Caribbean, Black African and Other White groups who also experienced a drop in both male and female employment rates.
During this time the only groups to experience an increase in self-employment rates, and as a result an increase in average self-employment earnings, were Black Caribbean and Other White groups. Indians, Bangladeshi and Chinese groups experienced a decline in their self-employment rates as well as their average self-employment earnings.

22Poverty across ethnic groups through recession and austerity
While increases in benefit income and decreases in taxes (deductions in general) buffered the income shocks, these changes were not enough to compensate for the fall in income entirely.
During recessions as economic circumstances worsen and earnings fall, means tested benefit payments are expected to increase. However, certain austerity measures were implemented starting in 2010/11. As incomes fall, if there is a progressive tax system (as in the UK) taxes are expected to fall as well. The question is whether benefit incomes increased and taxes fell during this period and if these changes were enough to compensate for the losses in income. Benefit income increased for most groups except for Indian and Bangladeshi groups. We found that average deductions (mainly taxes) fell for most groups except Other White groups. But while increases in benefit income and decreases in taxes (deductions in general) buffered the income shocks, these changes were not enough to compensate for the fall in income entirely.
During the recession housing costs increased for all but more for Other White groups and Chinese groups. As around one-third of Bangladeshi, Black Caribbean and Black African groups rented from the council or housing associations housing costs did not increase much for these groups during the recession (see Figure A8 in the appendix). Belfield, et al. (2014) found that during the recession mortgage interest payments fell but rent payments increased so housing costs of home-owners making mortgage payments fell while that of renters increased. Specifically, they found that the housing costs of renters increased from 26 per cent to 28 per cent of income and that of mortgage payers fell from 18 per cent to 13 per cent of income between 2007/08 and 2012/13. This explained the lower increase in housing cost among White majority, Indian and Pakistani groups who had a high proportion of owners paying a mortgage (around 40 per cent).
Belfield, et al. (2014) also found that incomes of pensioners were more resilient during the period of recession and austerity than the incomes of non-pensioners and in fact this resulted in a fall in overall income inequality. Pensioner families make up around a fifth of White majority and Black Caribbean families and around one-tenth of Other White groups, Indians, Pakistani and Bangladeshi families (see Figure A5 in the appendix). Also note that students typically earn less and during the period of recession and austerity the proportion of students among Chinese men and women and Bangladeshi men increased. To understand income changes for non-pensioner families and non-students, among these groups we also estimated income changes excluding these sub-groups (see Table 1).
White majority: Income changes for this group followed the general pattern – labour market earnings and self-employment earnings fell, benefit income increased, deductions were lower and housing costs were higher. The resulting increase in their average BHC household income (of £4 per week) and average AHC household income (of £13 per week) was not statistically significant. But once we excluded pensioners, the decrease in the BHC and AHC household incomes (of £10 and £19 per week) was higher and statistically significant. The difference was mostly explained by a greater loss in investment income among non-pensioners.9
Black Caribbean: For this group the average labour market earnings fell but the average self-employment earnings increased which was consistent with the increase in their self-employment rate. Their benefit income increased and deductions fell. These changes resulted in a small drop in their average BHC and AHC household incomes (by £4 and £13 per week) but neither change was statistically significant. After we excluded pensioner families, the decrease in net BHC and AHC household incomes was greater (£13 and £23 per week) but only the fall in average AHC household income was statistically significant.

23Comparing economic well-being across ethnic minority groups
Tabl
e 1:
Cha
nge
in a
vera
ge in
com
e co
mpo
nent
s (£
per
wee
k)#
Gro
ss
BHC
hous
ehol
d in
com
e
Net
BH
C ho
useh
old
inco
me
Net
AH
C ho
useh
old
inco
me
Labo
ur m
arke
t in
com
eSe
lf-em
ploy
men
t ea
rnin
gs
Bene
fit
inco
me
Pens
ion
&
inve
stm
ent
inco
me
Oth
er in
com
eD
educ
tion
Hou
sing
cos
t
Whi
te m
ajor
ity−1
2.3
−3.7
−13.
3−2
0.4
−2.
19.
8 0
.0 0
.4−8
.59.
6
–
no
pens
ione
rs−1
9.6
−9.8
−19.
3−1
8.5
−2.
77.
0 −
6.2
0.8
−9.8
9.4
Oth
er W
hite
gro
ups
−27.
8−3
2.1
−52.
7−4
1.5
22.
13.
2 −
9.2
−2.4
4.2
20.7
–
no
pens
ione
rs−5
5.7
−50.
1−6
5.5
−76.
2 1
8.6
12.5
−6.
5−4
.2−5
.615
.4
Mix
ed p
aren
tage
−84.
6−4
7.0
−67.
9−4
5.9
−26.
13.
3−1
8.0
2.0
−37.
720
.9
Indi
an−5
0.2
−35.
4−4
2.8
−23.
1−2
0.7
−1.5
−6.5
1.5
−14.
87.
4
–
no
pens
ione
rs−6
0.0
−42.
0−4
9.1
−23.
5−2
2.3
−4.6
−11.
2 1
.7−1
8.0
7.2
Pak
ista
ni20
.522
.111
.56.
5
0.3
3.5
2.5
7.6
−1.6
10.6
–
no
stud
ents
16.1
19.5
10.0
3.8
−0.
24.
0 2
.1 6
.3−3
.49.
4
–
no
pens
ione
rs19
.821
.211
.111
.7 −
0.9
3.9
−2.2
7.3
−1.4
10.1
–
no
pens
ione
rs, n
o st
uden
ts15
.018
.39.
49.
1−1
.54.
4−2
.95.
9−3
.38.
9
Ban
glad
eshi
−1.
51.
9−1
0.3
19.5
−16.
6−5
.2−1
0.6
11.3
−3.5
12.2
–
no
stud
ents
6.6
6.9
−3.2
26.5
−12.
60.
1−1
0.6
3.1
−0.3
10.0
–
no
pens
ione
rs12
.711
.1 0
.917
.1−1
6.6
−6.7
5.8
13.1
1.5
10.3
–
no
pens
ione
rs, n
o st
uden
ts21
.916
.7 8
.824
.6−1
2.1
−1.3
6.4
4.2
5.2
7.9
Chi
nese
−243
.1−1
46.5
−170
.2−1
40.7
−85.
715
.7−4
5.0
12.6
−96.
623
.7
–
no
stud
ents
−252
.6−1
54.5
−157
.9−1
15.1
−99.
123
.4−4
5.7
−16.
0−9
8.2
3.4
Bla
ck C
arib
bean
− 28.
1−3
.8−1
2.8
−57.
18.
716
.6 3
.4 0
.3−2
4.4
9.1
–
no
pens
ione
rs−4
1.7
−12.
8−2
3.4
−62.
59.
215
.0-4
.3 0
.7−2
9.0
10.6
Bla
ck A
fric
an−5
0.6
−25.
4−3
1.2
−67.
71.
316
.6-2
.7 1
.9−2
5.3
5.8
# A
ll in
com
e co
mpo
nent
s ar
e in
rea
l ter
ms,
that
is m
easu
red
in 2
012–
13 p
rices
and
equ
ival
ised
, tha
t is
adju
sted
for
hous
ehol
d si
ze a
nd c
ompo
sitio
n

24Poverty across ethnic groups through recession and austerity
Indian: This group experienced a decline in their average labour market earnings of a similar magnitude as the White majority but suffered a greater decline in average self-employment earnings. Unlike most groups their benefit income fell but like most groups their deductions also fell. Excluding pensioners the decline in benefit income was even higher as was the decline in their occupational pension and investment income. As a result the drop in BHC and AHC incomes (of £42 and £49 per week) for this sub-group was higher by around £7 per week than for all households. Understanding the decline in benefit income among Indians needs further investigation.
Pakistani: Unlike most ethnic groups, this group experienced an increase in their average net BHC household income during the period of recession and austerity. Their average labour market earnings grew but self-employment income hardly changed. All other income components were also higher and deductions were lower. When we excluded pensioners, the increase in labour market earnings was higher as was the decrease in investment earnings. Additionally, when we excluded students, the increase in labour market earnings was less. One major contributor to the increase in income of Pakistanis during the recession is an increase of around £6–7 per week in ‘Other income’. This increase is slightly lower in no-student sub-groups. It is difficult to explain what this means. When we broke down the ‘Other income’ further it was clear that the increase was mostly explained by an increase in ‘Miscellaneous income’ which includes, among other things, income from educational grants and scholarships and transfer payments from spouse, partner, friends, relatives or others. As this increase remained when we excluded students it is possible that most of this increase was due to increases in transfers.
Bangladeshi: Like the Pakistani group, their average BHC household income was higher during the period of recession and austerity but the change was not statistically significant. An increase in housing costs resulted in a fall in their average AHC household income. The decrease in self-employment earnings, benefit income, pension and investment income was offset by an increase in labour market earnings and ‘Other income’ and a fall in deductions. But a large part of the increase in ‘Other income’ may have been because of increases in educational grants and scholarships (note the proportion of male students increased by 15 percentage points). As a result, when we excluded students the increase in ‘Other income’ fell from £11 per week to £3 per week. Among non-students and non-pensioners, labour market earnings increased more, self-employment earnings fell less, benefit incomes fell less but deductions increased. As a result the increase in average BHC household income was higher, high enough to cover the increase in housing costs, and the average AHC household income was also higher.
To explain the increase in labour earnings of Pakistani and Bangladeshi groups and the decrease in benefit earnings among Indians we looked at occupational distribution across the two periods and found that the proportion of mangers and senior officials among Pakistani and Bangladeshi men and women increased. This requires further investigation. Another possible explanation could be that the migration pattern had changed, specifically that the educational qualifications of Pakistani (and other) immigrants increased after 2008 (when skill-based immigration laws were introduced). As the educational qualification measure, specifically whether a person had a degree, changed in the FRS in 2008/09, it cannot be used to make the comparison. A recent ONS report has revealed that recent immigrants including those born in Pakistan and Bangladesh are more likely to have higher educational qualifications than older migrants (ONS, 2014). Around 17 per cent of recent migrants in these groups had no qualifications

25Comparing economic well-being across ethnic minority groups
compared with 23–27 per cent among those who migrated 5–10 years ago. Also, recent migrants from Pakistan, Bangladesh and India included higher proportions of Level 4 or above qualified individuals.
Black African groups: The decrease in average net BHC and AHC household income (of £25 and £31 per week) for this group could be explained by the large decrease in their labour market earnings. The increase in benefit income, decrease in deductions and small increase in self-employment earnings (note their self-employment rates increased during the recession) was not enough to cover the fall in labour income.
Chinese: This group experienced the greatest fall in their average net BHC and AHC household income. As there was a large increase in the proportion of students (see earlier discussion) who typically earn less, are in less stable jobs and have higher housing costs, we excluded students and found that the fall in BHC income was even greater for non-students while the fall in average AHC income was less. These differences are possibly explained by the lower housing cost increases among non-students and greater fall in ‘Other income’. Average miscellaneous income which is part of the ‘Other income’ increased by £5 per week for the whole sample but fell by £14 per week for the non-student sample. This is consistent with higher educational grants and loans as the proportion of students increased. The main reason for the large income decline for the non-student Chinese was a large decline in labour income, self-employment earnings and investment incomes. The relatively small increases in benefit income and deductions were not enough to compensate for the loss. Note that the sample size for the Chinese group was small to begin with and as students make up around a third of the sample the non-student sample was even smaller. The statistical precision of the non-student sample is low as well.
Other White groups: This group also experienced a fall in their average labour market earnings but their self-employment earnings also increased (note their self-employment rates rose) as did their benefit income. This is the only group for whom average deductions increased. Once we excluded pensioners we found that the decrease in their labour market earnings was greater, increase in self-employment earnings was lower, and consequently the increase in their benefit income was higher, and deductions were lower. As a result the decrease in their BHC and AHC household incomes was higher; £50 and £65 per week for these sub-groups as compared to £32 and £53 for all households.
But how did these changes affect the deprived and the disadvantaged? Until now we have discussed how average and median or ‘typical’ incomes have changed during the period of recession and austerity. But there is wide variation within some groups and so the discussion until now does not tell us how those at the lower end of the income distribution were affected. We discuss changes in poverty rates and material deprivations next.
Relative poverty rates
The relative BHC/AHC poverty rate is defined as the proportion of people with real equivalised net BHC/AHC household income that is less than the relative poverty line – 60 per cent of the median BHC/AHC household income in the specific year. The poverty line is defined for the entire economy and is not group specific. Note that while the relative poverty rate provides a measure of deprivation relative to the ‘typical’ income it cannot measure absolute changes in deprivation if income changes similarly across the economy. For example, if everyone’s income falls by the same amount

26Poverty across ethnic groups through recession and austerity
the relative poverty rate will remain the same even if everyone is poorer. An alternative poverty measure that is used to measure absolute changes in deprivation is the ‘fixed’ relative poverty rate, that is, the proportion with income below the relative poverty line of a particular year. We chose the 2007/08 relative BHC/AHC poverty line as the ‘fixed’ relative BHC/AHC poverty line. As AHC poverty rates are a better measure of deprivation than BHC poverty rates, we will discuss AHC poverty rates (both AHC and BHC poverty rates are shown in the figures).
In the period before the recession relative AHC poverty rates were the highest among Bangladeshi , Pakistani and Black African groups, 67 per cent, 58 per cent and 47 per cent respectively. It was the lowest among White majority – around 20 per cent (see Figure 13). The poverty rates for the other groups varied between 30 per cent and 35 per cent. Note that although Chinese, Indian and Other White groups had higher or similar average income as the White majority, their relative poverty rates were higher than those of the White majority by 10 percentage points. This reflects a large within-group income variation in these groups relative to the White majority.
Figure 13: Relative poverty rates
40%
30%
20%
50%
60%
70%
10%
0%White
majorityOtherWhitegroups
Mixedparentage
Indian Pakistani Bangladeshi Chinese BlackCaribbean
BlackAfrican
Relative (BHC) poverty rate 2004/05–2007/08Relative (BHC) poverty rate 2009/10–2012/13Relative (AHC) poverty rate 2004/05–2007/08Relative (AHC) poverty rate 2009/10–2012/13
NotesDataset: FRS and HBAI, 2004/05–2011/12; sample: excludes residents of Northern Ireland and those in ethnically mixed families; all estimates are weighted; BHC household income is the net equivalised Before Housing Cost household income measured in average 2012–13 prices.
By comparing the difference in AHC and BHC poverty rates we can see how housing costs contribute to deprivation. The difference between BHC and AHC relative poverty rates was very high for some ethnic groups – 18 percentage points for Black Africans, 14 percentage points for Bangladeshi, 12 percentage points for Other White groups and very low for others – 2 percentage points for White majority and Indian groups.
Comparing AHC relative and AHC ‘fixed’ relative poverty rates across the two periods we found that:

27
Absolute levels of deprivation did not change for the four poorest groups – Pakistani, Bangladeshi, Black Caribbean and Black African groups but it worsened for all other groups, less so for the White majority.
Comparing economic well-being across ethnic minority groups
• Relative AHC poverty rates fell for Pakistani and Bangladeshi groups but their ‘fixed’ relative AHC poverty rates did not change. This implies that in absolute terms their levels of deprivation had not changed but that of others had worsened.
• Relative AHC poverty rates fell for White majority groups but ‘fixed’ relative AHC poverty rates increased. This implies that their absolute levels of deprivation had worsened but that of others had worsened even more.
• Relative deprivation did not change but ‘fixed’ relative AHC poverty rate increased among Indians implying that their levels of deprivation had worsened in step with others.
• Deprivation levels did not change for Black Caribbean and Black African groups.
• Deprivation levels of the Chinese and Other White groups worsened in absolute and relative terms.
To summarise, absolute levels of deprivation did not change for the four poorest groups – Pakistani, Bangladeshi, Black Caribbean and Black African groups but it worsened for all other groups, less so for the White majority.
Figure 14: Change in relative poverty rates during 2009/10–2012/13 relative to 2004/05–2007/08
15%
10%
5%
0%
Whitemajority
OtherWhitegroups
Mixedparentage
Indian Pakistani Bangladeshi Chinese BlackCaribbean
BlackAfrican
–5%
–10%
–20%
BHC relative poverty rateBHC ‘fixed’ poverty rateAHC relative poverty rateAHC ‘fixed’ poverty rate
nsns
ns nsns
nsns ns
ns
ns nsns
ns ns nsns
NotesDataset: FRS and HBAI, 2004/05–2011/12; sample: excludes residents of Northern Ireland and those in ethnically mixed families; all estimates are weighted; AHC household income is the net equivalised After Housing Cost household income measured in average 2012–13 prices.
Income inequality
To see how the very richest and the very poorest in each ethnic group fared during the recession, we estimated the proportion in each ethnic group who had incomes less than the poorest 10 per cent of the population and those with incomes higher than the richest 10 per cent (see Figure 15). As the White majority is the majority in the population these numbers will be, by construction, always around 10 per cent. Before the recession, around one-third of Pakistanis and Bangladeshis had incomes below the poorest

28Poverty across ethnic groups through recession and austerity
10 per cent of the population while one-fifth of Indian, Chinese, Black Caribbean and Black Africans did so. At the other extreme only 1–2 per cent of Pakistani, Bangladeshi, Black Caribbean and Black African groups had incomes in the top 10 per cent while around 10 per cent of Indians and 20 per cent of Chinese did so. This shows the high income variation within Indian and Chinese groups. During the recession incomes of the poorest Indian, Pakistani, Bangladeshi and Black Caribbeans, and the richest Pakistani and Chinese improved marginally.
Figure 15: The very poorest and the very richest
20%
15%
10%
25%
30%
35%
40%
5%
0%White
majorityOtherWhitegroups
Mixedparentage
Indian Pakistani Bangladeshi Chinese BlackCaribbean
BlackAfrican
Proportion with BHC household income less than the 10th percentile 2004/05–2007/08Proportion with BHC household income less than the 10th percentile 2009/10–2012/13Proportion with BHC household income greater than the 10th percentile 2004/05–2007/08Proportion with BHC household income greater than the 10th percentile 2009/10–2012/13
NotesDataset: FRS and HBAI, 2004/05–2011/12; sample: excludes residents of Northern Ireland and those in ethnically mixed families; all estimates are weighted; BHC household income is the net equivalised Before Housing Cost household income measured in average 2012–13 prices.
We also computed household income inequality within ethnic groups and across ethnic groups during the two periods using the following measures: 90:10 income ratio, 75:25 income ratio and the Gini coefficient (see Box 1 in the appendix for a description of the measures). Before the recession BHC income inequality among Chinese, Other White groups and Indian groups were higher than those among the other ethnic groups. AHC income inequality was also high for Black Africans. During the period of recession and austerity within-group BHC income inequalities generally decreased with some exceptions such as the Chinese. Within-group AHC income inequality also increased for the Pakistani group.
Overall within-group income inequality decreased while between-group income inequalities increased.
29
We found that while the average overall deprivation scores hardly changed (except among Black Caribbean families with children) adult-specific deprivation scores increased for all groups.
Comparing economic well-being across ethnic minority groups
Material deprivation
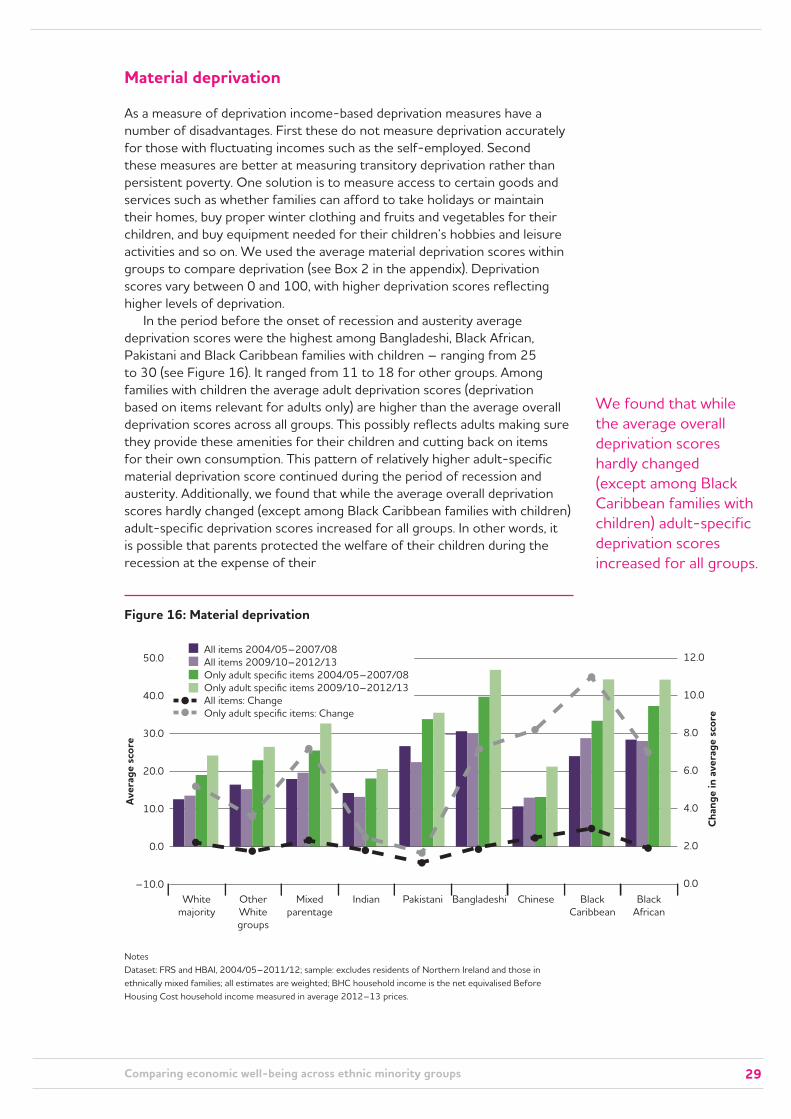
As a measure of deprivation income-based deprivation measures have a number of disadvantages. First these do not measure deprivation accurately for those with fluctuating incomes such as the self-employed. Second these measures are better at measuring transitory deprivation rather than persistent poverty. One solution is to measure access to certain goods and services such as whether families can afford to take holidays or maintain their homes, buy proper winter clothing and fruits and vegetables for their children, and buy equipment needed for their children’s hobbies and leisure activities and so on. We used the average material deprivation scores within groups to compare deprivation (see Box 2 in the appendix). Deprivation scores vary between 0 and 100, with higher deprivation scores reflecting higher levels of deprivation.
In the period before the onset of recession and austerity average deprivation scores were the highest among Bangladeshi, Black African, Pakistani and Black Caribbean families with children – ranging from 25 to 30 (see Figure 16). It ranged from 11 to 18 for other groups. Among families with children the average adult deprivation scores (deprivation based on items relevant for adults only) are higher than the average overall deprivation scores across all groups. This possibly reflects adults making sure they provide these amenities for their children and cutting back on items for their own consumption. This pattern of relatively higher adult-specific material deprivation score continued during the period of recession and austerity. Additionally, we found that while the average overall deprivation scores hardly changed (except among Black Caribbean families with children) adult-specific deprivation scores increased for all groups. In other words, it is possible that parents protected the welfare of their children during the recession at the expense of their
Figure 16: Material deprivation
40.0
30.0
20.0
50.0
10.0
0.0
Whitemajority
OtherWhitegroups
Mixedparentage
Indian Pakistani Bangladeshi Chinese BlackCaribbean
BlackAfrican
All items 2004/05–2007/08All items 2009/10–2012/13Only adult specific items 2004/05–2007/08Only adult specific items 2009/10–2012/13All items: ChangeOnly adult specific items: Change
–10.0
10.0
8.0
6.0
12.0
4.0
2.0
0.0
Aver
age
scor
e
Chan
ge in
ave
rage
sco
re
NotesDataset: FRS and HBAI, 2004/05–2011/12; sample: excludes residents of Northern Ireland and those in ethnically mixed families; all estimates are weighted; BHC household income is the net equivalised Before Housing Cost household income measured in average 2012–13 prices.

30Poverty across ethnic groups through recession and austerity
own consumption. Average adult-specific material deprivation scores hardly changed for Pakistani families with children, and increased by 3–5 points for Indian, Other White and White majority families with children, by 7–8 points for Bangladeshi, Black African and Chinese families with children, and by 11 points for Black Caribbean families with children.
Child poverty
We conclude this section by asking how children fared during the recession. We used three different measures of child poverty: relative poverty rate, ‘fixed’ 2007/08 relative poverty rate and a combined measure of deprivation and poverty line (if household income is less than 70 per cent of the median household income and if deprivation scores greater than 25).
If household incomes are lower in families with a higher number of children, then we will find that child poverty rates are higher than adult poverty rates. Even if household incomes did not vary between families with and without children, as children add to the number of dependants in the household, the equivalised household income will be lower in families with more children. So, more children will be present in poorer families. As a result child poverty rates will be higher than adult poverty rates. We find this to be the case for all ethnic groups and across both periods (see Figure 17).
Figure 17: Child poverty
40%
30%
20%
50%
60%
70%
80%
10%
0%White
majorityOtherWhitegroups
Mixedparentage
Indian Pakistani Bangladeshi Chinese BlackCaribbean
BlackAfrican
Relative (BHC) poverty rate 2004/05–2007/08Relative (BHC) poverty rate 2009/10–2012/132007/08 ‘fixed’ relative (BHC) poverty 2004/05–2007/082007/08 ‘fixed’ relative (BHC) poverty 2009/10–2012/13Combined measure 2004/05–2007/08Combined measure 2009/10–2012/13
NotesDataset: FRS and HBAI, 2004/05–2011/12; sample: excludes residents of Northern Ireland and those in ethnically mixed families; all estimates are weighted; BHC household income is the net equivalised Before Housing Cost household income measured in average 2012–13 prices.
Before the onset of the recession, Bangladeshi and Pakistani children were the most deprived followed by Black Caribbean and Black African children (by all three measures).10 Deprivation among children in these groups fell

31Comparing economic well-being across ethnic minority groups
during the recession except for Black Caribbean children when deprivation was measured using the combined measure (based on material deprivation and relative poverty measure) – this is consistent with increased material deprivation we found in Black Caribbean families. The drop in deprivation among Bangladeshi children is the highest. This is consistent with the change in composition of this group – during the recession and austerity period the number of dependent children per household was lower (see Figures A2, A6 and A7 in the appendix).

32
3 POVERTY DYNAMICS
This section explores the poverty dynamics of the main ethnic groups in Great Britain: that is, it is interested in how their experience of low income persists over time and which characteristics are associated with poverty persistence. This represents an important addition to the current pool of knowledge, which has been limited to a point-in-time analysis of poverty due to data coverage problems of relatively small ethnic minority groups.
We make use of the new longitudinal household survey – Understanding Society: the UK Household Longitudinal Study. Understanding Society is a general purpose survey of people’s socio-economic circumstances intended to be representative of the UK population. Two key features of Understanding Society, from the perspective of our analysis, is that it re-interviews people annually – meaning that we can see how an individual’s income changes over time and, secondly, that it contains an ethnic minority boost sample which provides large enough samples to perform analysis of some of the key ethnic minority groups separately.
At the time of writing, three waves of Understanding Society data are available covering the period 2009–12 and thus our evidence relates to the period of recession and austerity. We exclude Northern Ireland to maintain consistency with the first section of the report. As our interest is in poverty dynamics, requiring information on the same person in multiple years (longitudinal data), our sample is restricted to individuals completing an interview in all three Understanding Society waves (that is, three consecutive years). This selection criterion introduces a bias as certain types of individual are less likely to be present at every wave (e.g. the poor) and so get excluded from the sample. To account for this differential non-response, we adjust our estimates using the set of longitudinal weights constructed by the data producers. In so far as the weights correctly account for differential response patterns, then our results should be representative of the Great
33Poverty dynamics
Britain population. Finally, throughout this section, income is measured at the household level in real terms, net of taxes, before housing costs and adjusted for household size and composition. Poverty figures are expressed in relative terms, that is, living in a household with an income 60 per cent below the median.
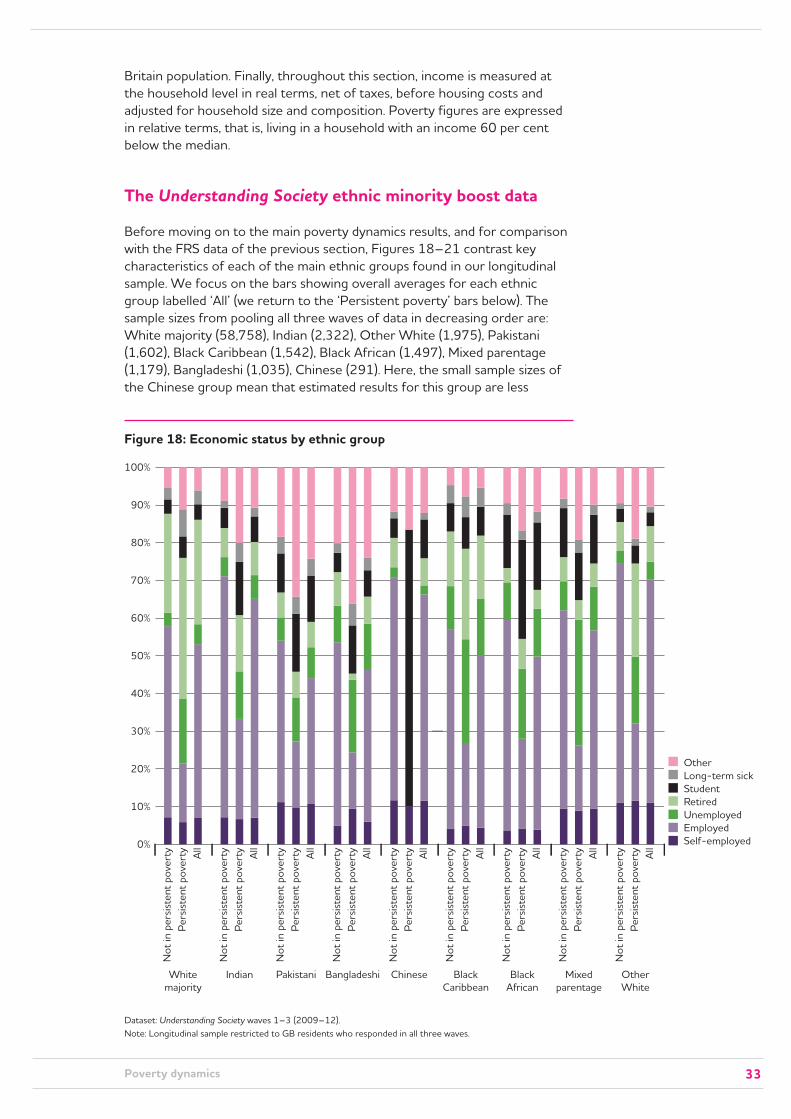
The Understanding Society ethnic minority boost data
Before moving on to the main poverty dynamics results, and for comparison with the FRS data of the previous section, Figures 18–21 contrast key characteristics of each of the main ethnic groups found in our longitudinal sample. We focus on the bars showing overall averages for each ethnic group labelled ‘All’ (we return to the ‘Persistent poverty’ bars below). The sample sizes from pooling all three waves of data in decreasing order are: White majority (58,758), Indian (2,322), Other White (1,975), Pakistani (1,602), Black Caribbean (1,542), Black African (1,497), Mixed parentage (1,179), Bangladeshi (1,035), Chinese (291). Here, the small sample sizes of the Chinese group mean that estimated results for this group are less
Figure 18: Economic status by ethnic group
40%
30%
20%
50%
60%
70%
80%
90%
100%
10%
0%
Whitemajority
Indian Pakistani Bangladeshi Chinese BlackCaribbean
BlackAfrican
Mixedparentage
OtherWhite
OtherLong-term sickStudentRetiredUnemployedEmployedSelf-employed
Not
in p
ersi
sten
t pov
erty
Pers
iste
nt p
over
ty All
Not
in p
ersi
sten
t pov
erty
Pers
iste
nt p
over
ty All
Not
in p
ersi
sten
t pov
erty
Pers
iste
nt p
over
ty All
Not
in p
ersi
sten
t pov
erty
Pers
iste
nt p
over
ty All
Not
in p
ersi
sten
t pov
erty
Pers
iste
nt p
over
ty All
Not
in p
ersi
sten
t pov
erty
Pers
iste
nt p
over
ty All
Not
in p
ersi
sten
t pov
erty
Pers
iste
nt p
over
ty All
Not
in p
ersi
sten
t pov
erty
Pers
iste
nt p
over
ty All
Not
in p
ersi
sten
t pov
erty
Pers
iste
nt p
over
ty All
Dataset: Understanding Society waves 1–3 (2009–12).Note: Longitudinal sample restricted to GB residents who responded in all three waves.

34Poverty across ethnic groups through recession and austerity
Figure 19: Age profile of the ethnic groups
40%
30%
20%
50%
60%
70%
80%
90%
100%
10%
0%
Whitemajority
Indian Pakistani Bangladeshi Chinese BlackCaribbean
BlackAfrican
Mixedparentage
OtherWhite
Age 41+Age 31–40Age 22–30Age 16–21
Not
in p
ersi
sten
t pov
erty
Pers
iste
nt p
over
ty All
Not
in p
ersi
sten
t pov
erty
Pers
iste
nt p
over
ty All
Not
in p
ersi
sten
t pov
erty
Pers
iste
nt p
over
ty All
Not
in p
ersi
sten
t pov
erty
Pers
iste
nt p
over
ty All
Not
in p
ersi
sten
t pov
erty
Pers
iste
nt p
over
ty All
Not
in p
ersi
sten
t pov
erty
Pers
iste
nt p
over
ty All
Not
in p
ersi
sten
t pov
erty
Pers
iste
nt p
over
ty All
Not
in p
ersi
sten
t pov
erty
Pers
iste
nt p
over
ty All
Not
in p
ersi
sten
t pov
erty
Pers
iste
nt p
over
ty All
Dataset: Understanding Society waves 1–3 (2009–12).Note: Sample restricted to GB residents who responded in all three waves.
precise, should be noted. Also, the low proportion of students in the Chinese group should be pointed out, which is in contrast to FRS data in the earlier section. This probably reflects our sample restriction described above and the fact that Chinese students become harder to contact as the survey ages. The effect of this would be to inflate Chinese incomes relative to the FRS sample.
We observe that on average, each of the ethnic minority groups is younger than the White majority group (average age of 49.6 years). Reflecting different migration and fertility patterns, the youngest group is the Black Africans who have an average age of 36.6 years and the oldest group is the Black Caribbeans whose average age is 45.1 years. Most ethnic minority groups tend to have high levels of education in comparison to the White majority. For example, 54.9 per cent of Indians have a degree in contrast to only 31.6 per cent of the White majority population. The exception is the Bangladeshi group – among them only 25.9 per cent have a degree and 25.4 per cent have no qualification at all (in contrast to 16.7 per cent for the White majority). A lower proportion of Bangladeshis are lone parents (2 per cent) while they are most likely to have children (57.1 per cent). All of the ethnic minority groups have higher rates of parenthood

35Poverty dynamics
Figure 20: Education attainment by ethnic group
40%
30%
20%
50%
60%
70%
80%
90%
100%
10%
0%
Whitemajority
Indian Pakistani Bangladeshi Chinese BlackCaribbean
BlackAfrican
Mixedparentage
OtherWhite
DegreeOther Higher DegreeA-levelGCSEOtherNo qualification
Not
in p
ersi
sten
t pov
erty
Pers
iste
nt p
over
ty All
Not
in p
ersi
sten
t pov
erty
Pers
iste
nt p
over
ty All
Not
in p
ersi
sten
t pov
erty
Pers
iste
nt p
over
ty All
Not
in p
ersi
sten
t pov
erty
Pers
iste
nt p
over
ty All
Not
in p
ersi
sten
t pov
erty
Pers
iste
nt p
over
ty All
Not
in p
ersi
sten
t pov
erty
Pers
iste
nt p
over
ty All
Not
in p
ersi
sten
t pov
erty
Pers
iste
nt p
over
ty All
Not
in p
ersi
sten
t pov
erty
Pers
iste
nt p
over
ty All
Not
in p
ersi
sten
t pov
erty
Pers
iste
nt p
over
ty All
Dataset: Understanding Society waves 1–3 (2009–12).Note: Sample restricted to GB residents who responded in all three waves.
than the White majority. The Black Caribbean and Black African groups have substantial levels of lone parenthood: 50.1 per cent of Black Caribbeans with children and 38.4 per cent of Black Africans with children are lone parents.
In terms of cross-sectional poverty outcomes, the ethnic minority groups typically do worse than the White majority population. Table 2 shows that Pakistani, Bangladeshi and Black African groups have the highest poverty rates (approximately 40 per cent, 30 per cent and 33 per cent) and lowest mean incomes. Indian, Black Caribbean and Mixed parentage groups follow in terms of their poverty rates (19, 24 and 18 per cent), whereas the Chinese and Other White groups actually perform slightly better than the White majority population (13 and 12 per cent). A supplement to the relative poverty measure is a score based on household ownership of goods thought to indicate material living standards. This material deprivation score may better capture sustained periods of poverty. For the ownership of eight items recorded in Understanding Society, Pakistani, Bangladeshi, Black Caribbean and Black African groups are again the worst off. The Mixed parentage group are relatively better off, while the White majority, Other White and Indian groups all show similar and much lower scores on

36Poverty across ethnic groups through recession and austerity
Figure 21: Family type by ethnic group
40%
30%
20%
50%
60%
70%
80%
90%
100%
10%
0%
Whitemajority
Indian Pakistani Bangladeshi Chinese BlackCaribbean
BlackAfrican
Mixedparentage
OtherWhite
Couple no childrenSingle no childrenCouple with childrenSingle parent
Not
in p
ersi
sten
t pov
erty
Pers
iste
nt p
over
ty All
Not
in p
ersi
sten
t pov
erty
Pers
iste
nt p
over
ty All
Not
in p
ersi
sten
t pov
erty
Pers
iste
nt p
over
ty All
Not
in p
ersi
sten
t pov
erty
Pers
iste
nt p
over
ty All
Not
in p
ersi
sten
t pov
erty
Pers
iste
nt p
over
ty All
Not
in p
ersi
sten
t pov
erty
Pers
iste
nt p
over
ty All
Not
in p
ersi
sten
t pov
erty
Pers
iste
nt p
over
ty All
Not
in p
ersi
sten
t pov
erty
Pers
iste
nt p
over
ty All
Not
in p
ersi
sten
t pov
erty
Pers
iste
nt p
over
ty All
Dataset: Understanding Society waves 1–3 (2009–12).Note: Sample restricted to GB residents who responded in all three waves.
the material deprivation index. So far these results have examined poverty measures at a point in time and not measures of how poverty may persist over time – this is discussed below.
Table 2: Poverty outcomes in Understanding Society (means)
White majority
Indian Pakistani Bangladeshi Chinese Black Caribbean
Black African
Mixed parentage
Other White
Net income 618.45 588.11 429.34 462.47 720.90 513.98 458.34 604.41 757.87
Relative poverty 15.5% 18.8% 39.8% 29.6% 12.5% 23.7% 32.6% 17.6% 12.2%
Material deprivation
14.45 13.83 28.08 29.96 10.06 29.31 33.36 22.71 14.18
Observations 58,758 2322 1602 1035 291 1542 1497 1179 1875
Dataset: Understanding Society waves 1–3 (2009–12). Notes: Sample restricted to GB residents who responded in all three waves. Weighted estimates using longitudinal weights.

37
A substantial share of Pakistani and Bangladeshis experience periods of poverty that span across multiple years. For example, a substantial 37 per cent of Pakistanis are observed in persistent poverty and 14 per cent were in poverty for all three years.
Poverty dynamics
Persistent poverty
An experience of poverty is likely to be dependent on the length of time spent in poverty. For example, for short spells of low income, a household may be able to draw on savings to fund consumption but this is not the case for longer poverty spells. Therefore, the cumulative effect on well-being of spending multiple years in poverty is likely to be much greater than for single periods. Above current living conditions, longer spells of poverty are also a concern for future life outcomes. Historically, the data available in the UK has not allowed a breakdown of persistent poverty measures by ethnic group. However, this new survey, Understanding Society, contains an ethnic minority boost sample which provides large samples of some key ethnic minority groups (Indian, Pakistani, Bangladeshi, Black Caribbean and Black African). We therefore present here new UK evidence on persistent poverty rates for different ethnic groups.
Understanding Society is a new survey and, before proceeding to the main estimates of persistent poverty, two data issues should be noted. First, there are some differences in the headline poverty rates found in Understanding Society and the FRS data of section 2 although the ranking of the ethnic groups in terms of their level of poverty is the same in both surveys. The difference is particularly sharp for the Bangladeshi group (probably reflecting the fact that this group became less willing to reveal their income over time) and results here should be treated with caution. Second, features of Understanding Society designed to improve the quality of the reported benefit income take effect from wave two and mean that in wave one the survey may underestimate incomes. In so far as poor groups are most affected by this change, it may exaggerate income growth for the poor, relative to non-poor groups.
Figure 22 summarises results for the number of times people were observed poor for each of the nine key ethnic groups. The chart shows the percentage of people never observed poor, observed poor once, observed poor twice and observed poor in all three years in which they were observed. We define persistent poverty as living in poverty for at least two out of three years in which they were observed. We see that the baseline White majority group have relatively low rates of persistent poverty and high rates of never being poor. Nearly 72 per cent are never observed poor, 13 per cent are observed poor at least two times (persistently poor) and 5 per cent are observed poor in all three years.
Moving away from the baseline case we see substantial persistent poverty differences across the ethnic groups. Most notable are the Pakistani and Bangladeshi groups. Less than 32 per cent of these groups did not experience poverty in the observation period. While the results from the previous section documented the high poverty rates of these groups, the results here reveal that a substantial share of Pakistani and Bangladeshis experience periods of poverty that span across multiple years. For example, a substantial 37 per cent of Pakistanis are observed in persistent poverty and 14 per cent were in poverty for all three years.
The next poorest in terms of persistent poverty are the Black African and the Black Caribbean ethnic groups. As for the Bangladeshi and Pakistani groups, we see that a substantial share are seen living in poverty for more than one time period. For the Black African group, the persistent poverty rate is 31 per cent and 23 per cent for the Black Caribbean group. Given the overall share of Black Caribbeans and Black Africans experiencing poverty at least once is lower than for the Bangladeshi and Pakistani groups, persistent poverty seems to be a particular problem for these groups.

38Poverty across ethnic groups through recession and austerity
Figure 22: Persistent poverty rates by ethnic group
White majority
Indian
Pakistani
Bangladeshi
Chinese
Black Caribbean
Black African
Mixed parentage
Other White groups
Three periodsTwo periodsOne periodNever poor
3.2 6.6 13.7 76.5
4.4 10.4 18.9 66.3
14.1 16.6 22.2 47.1
6.6 16.7 18.0 58.7
5.1 2.5 17.5 75.0
7.5 16.7 32.9 42.9
13.7 23.7 31.0 31.6
5.7 9.9 19.5 64.9
5.1 7.9 15.2 71.7
Dataset: Understanding Society waves 1–3 (2009–12).Note: Longitudinal sample restricted to GB residents who responded in all three waves.
A third group of ethnic minorities, Indians and Mixed parentage groups, see high persistent poverty rates relative to the baseline White majority group, but less so than for the above groups: 16 per cent of Indians and 15 per cent of the Mixed parentage group live in persistent poverty. Rates for living in poverty for all three years are more similar to the White majority group with 6 per cent for Indians and 4 per cent for the Mixed parentage group.
Interestingly, the Chinese and Other White groups appear very similar to the baseline White majority group in terms of their persistent poverty outcomes. They see very similar rates of never being observed poor, although the Chinese tend to show lower rates of persistent poverty with 8 per cent being persistently poor (compared with 13 per cent of the White majority), although the small samples sizes of the Chinese group should be noted.
Characteristics of those in persistent poverty
This section compares the observable characteristics of those in persistent poverty with those not in persistent poverty for each ethnic group. For each ethnic group, it tells us which type of individuals are in persistent poverty and reveals how the type of individuals may differ across the ethnic groups. This information is important for the targeting of poverty policy. It should be emphasised that the results do not tell us which characteristics cause persistent poverty – a much more ambitious question and beyond the scope of this study. Nevertheless, the results provide useful information on identifying who it is that is persistently poor.
Figures 18–20, 23 and 24 provide details of the characteristics associated with persistent poverty for each ethnic group and by persistent poverty status. The figures consider demographic variables likely to be

39Poverty dynamics
related with persistent poverty: age (Figure 19), generation (Figure 23), highest qualification (Figure 20), economic status (Figure 18), household size (Figure 24A), having children (Figure B, the number of children (Figure 24A) and whether living in social housing (Figure 24B). For each ethnic group, the first column shows the average of a characteristic for the non-persistently poor population and the second column shows the average for the group in persistent poverty. While the direction of the associations found is not necessarily surprising, the figures importantly reveal the magnitude of the differences between the non-persistently poor and persistently poor. Note we treat the results for the Chinese group with extreme caution as the sample of persistently poor Chinese is very small.
Figure 23: Immigrant generation by ethnic group
40%
30%
20%
50%
60%
70%
80%
90%
100%
10%
0%
Whitemajority
Indian Pakistani Bangladeshi Chinese BlackCaribbean
BlackAfrican
Mixedparentage
OtherWhite
3rd generation2nd generation1st generation
Not
in p
ersi
sten
t pov
erty
Pers
iste
nt p
over
ty All
Not
in p
ersi
sten
t pov
erty
Pers
iste
nt p
over
ty All
Not
in p
ersi
sten
t pov
erty
Pers
iste
nt p
over
ty All
Not
in p
ersi
sten
t pov
erty
Pers
iste
nt p
over
ty All
Not
in p
ersi
sten
t pov
erty
Pers
iste
nt p
over
ty All
Not
in p
ersi
sten
t pov
erty
Pers
iste
nt p
over
ty All
Not
in p
ersi
sten
t pov
erty
Pers
iste
nt p
over
ty All
Not
in p
ersi
sten
t pov
erty
Pers
iste
nt p
over
ty All
Not
in p
ersi
sten
t pov
erty
Pers
iste
nt p
over
ty All
Dataset: Understanding Society waves 1–3 (2009–12).Note: Longitudinal sample restricted to GB residents who responded in all three waves.

40Poverty across ethnic groups through recession and austerity
Figure 24A: Household characteristics by ethnic group
4
3
2
5
6
1
0
Whitemajority
Indian Pakistani Bangladeshi Chinese BlackCaribbean
BlackAfrican
Mixedparentage
OtherWhite
Household sizeNo. of children
Not
in p
ersi
sten
t pov
erty
Pers
iste
nt p
over
ty All
Not
in p
ersi
sten
t pov
erty
Pers
iste
nt p
over
ty All
Not
in p
ersi
sten
t pov
erty
Pers
iste
nt p
over
ty All
Not
in p
ersi
sten
t pov
erty
Pers
iste
nt p
over
ty All
Not
in p
ersi
sten
t pov
erty
Pers
iste
nt p
over
ty All
Not
in p
ersi
sten
t pov
erty
Pers
iste
nt p
over
ty All
Not
in p
ersi
sten
t pov
erty
Pers
iste
nt p
over
ty All
Not
in p
ersi
sten
t pov
erty
Pers
iste
nt p
over
ty All
Not
in p
ersi
sten
t pov
erty
Pers
iste
nt p
over
ty All
Dataset: Understanding Society waves 1–3 (2009–12).Note: Longitudinal sample restricted to GB residents who responded in all three waves.
Comparing the non-persistently poor with the persistently poor for each ethnic group we observe that: the groups in poverty tend to be younger, and are substantially less likely to have a degree, substantially more likely to have no qualifications and less likely to be employed (notably so for the Mixed parentage, Other White and Black Caribbean groups). The Pakistani and Bangladeshi groups are more likely to have children and have slightly large families, although this pattern is less clear for the other ethnic groups. All of the ethnic groups in persistent poverty are more likely to live in social housing compared with the non-persistently poor and the difference is particularly large for the Mixed parentage, Other White and Black African groups. There is also a tendency for those in persistent poverty to be (first generation) immigrants – the effect is larger for Black African, Black Caribbean and Bangladeshis – although not so for the Mixed parentage and Other White groups.

41Poverty dynamics
Figure 24B: Household characteristics by ethnic group
40%
30%
20%
50%
60%
70%
80%
90%
100%
10%
0
Whitemajority
Indian Pakistani Bangladeshi Chinese BlackCaribbean
BlackAfrican
Mixedparentage
OtherWhite
Social housingAny children
Not
in p
ersi
sten
t pov
erty
Pers
iste
nt p
over
ty All
Not
in p
ersi
sten
t pov
erty
Pers
iste
nt p
over
ty All
Not
in p
ersi
sten
t pov
erty
Pers
iste
nt p
over
ty All
Not
in p
ersi
sten
t pov
erty
Pers
iste
nt p
over
ty All
Not
in p
ersi
sten
t pov
erty
Pers
iste
nt p
over
ty All
Not
in p
ersi
sten
t pov
erty
Pers
iste
nt p
over
ty All
Not
in p
ersi
sten
t pov
erty
Pers
iste
nt p
over
ty All
Not
in p
ersi
sten
t pov
erty
Pers
iste
nt p
over
ty All
Not
in p
ersi
sten
t pov
erty
Pers
iste
nt p
over
ty All
Dataset: Understanding Society waves 1–3 (2009–12).Note: Longitudinal sample restricted to GB residents who responded in all three waves.
Poverty entry and exit rates
Here we set out the evidence on poverty entry and exit rates and contrast the differences across the ethnic groups. Differences in poverty levels can reflect both differences in poverty exits and/or differences in poverty entries. Knowledge of entry and exit rates for each ethnic group is therefore of importance for understanding the observed patterns in levels of poverty. Here, entry and exit rates are defined on an annual basis. A poverty entry is defined as being in poverty at a survey interview but not being in poverty at the previous survey interview. Likewise, a poverty exit is defined as not being in poverty at a survey interview but being in poverty at the previous survey interview.
Figure 25 presents the poverty entry and exit rates. Marked differences in poverty entry and exit rates are observed across the groups. Groups that are persistently poor are the groups with low poverty exit rates and high poverty entry rates: Pakistani, Bangladeshi (high exit rates to be treated with caution), Black African and Black Caribbeans.

42Poverty across ethnic groups through recession and austerity
Figure 25: Poverty entry and exit rates by ethnic group
40%
30%
20%
50%
60%
70%
10%
0%
Enter povertyExit poverty
Whitemajority
Indian Pakistani Bangladeshi Chinese BlackCaribbean
BlackAfrican
Mixedparentage
OtherWhiteG
7.6
49.8
9.7
53.6
21.9
47.3
16.3
59.4
8.3
49.3
13.3
49.5
17.0
39.9
12.3
44.6
6.5
54.6
Dataset: Understanding Society waves 1–3 (2009–12).Note: Longitudinal sample restricted to GB residents who responded in all three waves.
It was noted above that while Black African and Black Caribbean groups have similar persistent poverty rates to the Pakistani and Bangladeshi groups, persistent poverty accounts for a larger share of total poverty experiences for the Black African and Black Caribbean groups. The evidence for the entry and exit rates confirms that persistent poverty may be a particular problem for the Black African and Black Caribbean groups. For example, while Pakistanis are more likely to enter poverty than Black Africans (22 per cent versus 17 per cent), they are also more likely to escape poverty (47 per cent versus 40 per cent).
English language skills
While formal education levels for each of the ethnic groups was documented above, little is known specifically about English language skills and the relationship with poverty. If a good grasp of English is needed for success in the labour market or in accessing public services, then low English language ability may well have implications for poverty status (alternatively, the causality could operate in the other direction where, for example, being in employment allows workers to develop language skills). Understanding Society collected novel information on respondents’ English language ability. While we cannot determine whether low English language skills causally lead people to poverty, it does allow us to examine statistical associations between persistent poverty and English language skills while accounting for other factors.
Specifically, Understanding Society records whether English is the first language of a respondent and, if not, whether individuals have difficulties in ‘reading formal letters and documents in English’ and ‘speaking English to people for day-to-day activities such as shopping or taking the bus’. Figure 26A compares the English language skills of the different ethnic groups. The White majority and Black Caribbean ethnic groups almost exclusively have English as a first language and so are excluded from the figure.

43
We observe a clear association between persistent poverty and spoken English skills. The pattern holds for each ethnic group where we observe substantially higher levels of difficulties with spoken English for those in persistent poverty.
Poverty dynamics
Figure 26A: English language skills by ethnic group
40%
30%
20%
50%
60%
70%
80%
10%
0%Indian Pakistani Bangladeshi Chinese Black
AfricanMixed
parentageOtherWhiteGroups
58.4
9.211.8
64.9
18.221.0
66.5
20.422.7
60.9
4.0
11.4
52.5
6.3 6.7
15.3
0.62.0
68.9
8.0
16.1
English not first languageDifficulty speaking EnglishDifficulty reading English
Dataset: Understanding Society waves 1–3 (2009–12).Note: White majority and Black Caribbean ethnic groups almost exclusively have English as a first language and so are excluded.Longitudinal sample restricted to GB residents who responded in all three waves.
Pakistani, Bangladeshi and Other White ethnic groups are made up of the largest share of individuals not having English as a first language (65 per cent, 66 per cent, and 69 per cent, respectively), followed closely by the Indian and Chinese groups. Black Africans have slightly lower rates of not having English as a first language (52 per cent) and the Mixed parentage groups have large shares of individuals with English as a first language where only 15 per cent report not speaking English as their first language. However, the differences reported here do not directly map into difficulties speaking and reading English. For example, Pakistanis and Bangladeshis report relatively high levels of difficulties in reading and writing compared with Other White groups, while Other White groups actually have a higher percentage of non-English first language speakers.
Figure 26B shows the difference in English language skills by persistent poverty status and by ethnic group. The Chinese group is now excluded due to sample size constraints as is the White majority and Black Caribbean groups as described above. Here again we distinguish between spoken English and reading English skills as they may show different associations with poverty status. For speaking English, we observe a clear association between persistent poverty and spoken English skills. The pattern holds for each ethnic group where we observe substantially higher levels of difficulties with spoken English for those in persistent poverty, compared with those not. For example, the starkest difference is for the Indian group where we observe that those in persistent poverty are more than twice as likely to report difficulties with spoken English than those not in persistent poverty. A similar pattern emerges for reading English confirming that both spoken and reading skills are important in terms of persistent poverty outcomes. We note that for the Mixed parentage group, the difference in reading language

44Poverty across ethnic groups through recession and austerity
skills is larger than for the written language skills, suggesting that reading English skills may be important for this group.
Figure 26B: English language skills by persistent poverty status
20
15
10
25
30
35
5
0Indian Pakistani Bangladeshi Black
AfricanMixed
parentageOtherWhiteGroups
Not in persistent poverty: Difficulty speaking EnglishNot in persistent poverty: Difficulty speaking EnglishIn persistent poverty: Difficulty speaking EnglishIn persistent poverty: Difficulty reading English
Dataset: Understanding Society waves 1–3 (2009–12).Note: White majority and Black Caribbean ethnic groups almost exclusively have English as a first language and so are excluded. The Chinese ethnic group is excluded due to the small number of observations in persistent poverty.Longitudinal sample restricted to GB residents who responded in all three waves.
English language skills may be associated with poverty because they are correlated with other important variables (for example, education level) or it may be that English language skills have their own direct effect on poverty outcomes. Establishing whether English skills directly cause poverty is a complex problem – one beyond the scope of this report. However, what we are able to do is separate out the effect of English language variables on poverty while holding constant some other important confounding variables. This would go some way to improving our understanding of the language/poverty relationship.
We performed regression analysis (logit model) examining the effect of having English as a first language on being in persistent poverty holding constant education level, ethnicity and family type. Our result shows that having English as a first language reduces the probability of being in persistent poverty by a substantial five percentage points, holding education level, family type and ethnicity constant. To put this value in perspective, it represents a 13 per cent reduction in the chance of a Pakistani with English as a first language being in persistent poverty compared with Pakistani without English as a first language.
Having English as a first language is related to being born in the UK and we may worry that the positive effects of having English as a first language may reflect some advantage of being born in the UK, for example familiarity with the institutions. We performed further regression analysis which confirmed that being born in the UK has a statistically insignificant effect on being in persistent poverty holding education level, family type and ethnicity constant. Moreover, our regression models show that the positive

45Poverty dynamics
association between persistent poverty and having English as a first language remains even when holding UK born constant (for the full table of logit results see appendix Table A6).
Finally, for those who do not have English as a first language, we can examine whether reporting a difficulty in speaking or reading English is associated with persistent poverty, holding constant education level and family type. The subset of individuals without English as a first language represents a smaller sample size and so our results here suffer from a resulting reduction in statistical precision.
We find that reporting a difficulty in speaking English increases the chances of being in persistent poverty by four percentage points. For example, the magnitude of this effect is four times larger than the effect of being a single parent (relative to being single without children) on the chances of being in persistent poverty (for the full table of logit results see appendix Table A7). It should be noted that neither of these effects are significant in statistical terms and are imprecisely estimated, which may reflect the smaller sample sizes available here. The effect for reading English is smaller in magnitude than the speaking English effect and may suggest that speaking skills are more important than reading skills for persistent poverty status, although further research would be needed to confirm both of these results.

46
NOTES1 The Mixed parentage group is very heterogeneous and not all children of inter-ethnic
couples consistently report their ethnic group as mixed in every situation. In Section 2 we are forced by the available data which is cross-sectional to compare two sets of people (before and after 2008) who report their ethnic group as Mixed parentage (rather than comparing the same set of people in these two periods which we could have done with longitudinal data). In other words, we may be comparing very different sets of people in these two periods. So, we decided not to discuss the results for this group. In Section 3, where we follow the same individuals across time, we report and discuss findings for this group.
2 Real means that the income is adjusted for inflation, specifically, it is measured in 2012/13 prices.
3 Equivalised refers to the household income being adjusted for household composition and size which allows comparison of household incomes of households of different sizes and composition.
4 The net refers to the household income being net of taxes and transfers. Details are provided later in the sub-section Composition of Household Income.
5 Housing cost primarily includes rent (gross of housing benefit), ground rent and mortgage interest payments. It also includes structural insurance payments paid by owners and water charges.
6 Most empirical analysis like this one is based on sample data, where information is collected from a part of the population. It is possible that we may end up, by chance, with a sample that is very different from the population. So, how do we know that what we have observed is true of the population and not specific to the sample? To understand this we perform statistical tests to determine the statistical significance of the observed change. If we say that an observed change is statistically significant at the 10 per cent level of significance then what it means is this: if the hypothesis that there is no change in the population is true, then the possibility of obtaining a result as extreme as the one observed is only 10 per cent. In other words, the chance is quite high that the change we observed is not due to sampling error but true of the population.
7 Country of birth information was not available before 2008/09.
8 Single persons are more likely to migrate to the UK than those with families (Luthra, et al., 2014) and we did not find any marked increase in the proportion of separated and divorced individuals during the recession for any of the ethnic groups.
9 Not shown in Table 1: the difference in the decline in the average pension and investment income between pensioner and non-pensioner White majority individuals was mostly due to decline in investment income. This was also the case for the Black Caribbean and Bangladeshi groups.
10 Ethnicity is based on the ethnic group reported by the adults in the family.

47
REFERENCESAlzubaidi, H., Carr, J., Councell, R. and Johnson, G. (2013) Households below average income: An
analysis of the income distribution 1994/95–2011/12 London: Department of Works and Pensions
Belfield, C., Cribb, J., Hood, A. and Joyce, R. (2014) Living standards, Poverty and inequality in the UK: 2014. London: Institute for Fiscal Studies
Berthoud, R. (1998) ‘The incomes of ethnic minorities’. ISER Working Paper Series No. 98–1. Colchester: University of Essex.
Brynin, M. and Guveli, A. (2012) ‘Understanding the ethnic pay gap in Britain’. Work, Employment and Society, 26(4), pp. 574–87
Callan, T., Leventi, C. and Levy, H. (2011) ‘The distributional effects of austerity measures: A comparison of six EU countries’. Social Europe Research Note 2/2011. Brussels: European Commission.
Cheung, S. Y. and Heath, A. (2007) ‘Nice work if you can get it: Ethnic penalties in Great Britain’. In Unequal chances: Ethnic minorities in Western labour markets. Proceedings of the British Academy, 137, pp. 507–550. Oxford: Oxford University Press.
Clark, K. and Drinkwater, S. (2007) Ethnic minorities in the labour market: Dynamics and diversity. York: Joseph Rowntree Foundation
Dellas, H. and Sakellaris, P. (2003) ‘On the cyclicality of schooling: theory and evidence’. Oxford Economic Papers, 55, pp. 148-72. Oxford: Oxford University Press
Equality and Human Rights Commission (EHRC), Department of Works and Pensions (DWP)_ and Government and Equalities Office (GEO). (2009). Monitoring update on the impact of the recession on various demographic groups. Government Equalities Office. Available at: http://www.equalityhumanrights.com/publication/monitoring-impact-recession-various-demographic-groups
Heath, A. and Cheung, D. (2006) ‘Ethnic penalties in the labour market: Employers and discrimination’. DWP Research Report No. 341. London: Department of Works and Pensions
Hills, J., Brewer, M., Jenkins, S., Lister, R., Lupton, R., Machin, S., Mills, C., Modood, T., Rees, T. and Riddell, S. (2010) An anatomy of economic inequality in the UK: Report of the National Equality Panel. CASE Report 60. London: Centre for Analysis of Social Exclusion, London School of Economics and Political Science
Hogarth, T., Owen, D., Gambin, L., Hasluck, C., Lyonette, C. and Casey, B. (2009) The equality impacts of the current recession. Warwick: Warwick Institute for Employment Research
Leslie, D., Lindley, J. and Thomas, L. (2002). ‘Who did worse? A comparison of US and British non-white unemployment 1970 – 1998’. Applied Economics, 34, pp. 1041–53
Li, Y., Devine, F. and Heath, A. (2008) Equality group inequalities in education, employment and earnings: A research review and analysis of trends over time. EHRC Research Report 10. Manchester: Equality and Human Rights Commission
Longhi, S. and Platt, L. (2009) Pay gaps across equalities areas. EHRC Research Report 9. Manchester: Equality and Human Rights Commission.

48Poverty across ethnic groups through recession and austerity
Longhi, S., Nicoletti, C. and Platt, L. (2013) ‘Explained and unexplained wage gaps across the main ethno-religious groups in Great Britain’. Oxford Economic Papers, 65 (2), pp. 471-93
Luthra, R., Platt, L. and Salamonska, J. (2014) ‘Migrant diversity, migration motivations and early integration: the case of Poles in Germany, the Netherlands, London’. CReAM Discussion Paper Series 12/14. London: Centre for Research and Analysis of Migration
Machin, S., Murphy, R. and Soobedar, Z. (20009) Differences in labour market gains from higher education participation. Report for the National Equality Panel. London: LSE, CEP
Modood, T., Berthoud, R., Lakey, J., Nazroo, J., Smith, P., Virdee, S. and Beishon, S. (1997) Ethnic minorities in Britain: Diversity and disadvantage. London: Policy Studies Institute
Nandi, A. and Platt, L. (2012) ‘Gendered income inequalities in the UK: A comparison across ethnic groups’. Paper presented to the 32nd General Conference of the International Association for Research in Income and Wealth, Boston, MA, 9 August 2012. Available at: www.iariw.org/papers/2012/NandiPaper.pdf (accessed on 30 November 2014)
Nandi, A. and Platt, L. (2010) Ethnic minority women’s poverty and economic well-being. Report for the Government Equalities Office. London: Government Equalities Office
Nazroo, J. and Kapadia, D. (2013) Ethnic inequalities in labour market participation? Dynamics of Diversity: Evidence from the 2011 Census. Manchester: Centre on Dynamics of Ethnicity (CoDE)
Nisra (2011) Census 2011: Key Statistics for Northern Ireland. Northern Ireland Statistics and Research Agency. Available at: http://www.nisra.gov.uk/census/2011_results_key_statistics.html
Office for National Statistics.(2013) Self-employed up 367,000 in four years, mostly since 2011. Available at: http://www.google.co.uk/url?sa=t&rct=j&q=&esrc=s&source=web&cd=2&ved=0CCsQFjAB&url=http%3A%2F%2Fwww.ons.gov.uk%2Fons%2Fdcp171776_298533.pdf&ei=8828VPG9LMf3aunugPgJ&usg=AFQjCNHlhU18zi11uCwubYi1tybQzndEbQ&bvm=bv.83829542,d.d2s
Office for National Statistics. (2014) 2011 Census analysis: Social and economic characteristics by length of residence of migrant populations in England and Wales. Available at: http://www.ons.gov.uk/ons/rel/census/2011-census-analysis/social-and-economic-characteristics-by-length-of-residence-of-migrant-populations-in-england-and-wales/characteristics-by-length-of-residence-of-migrant-populations.html
Platt, L. (2007) Poverty and ethnicity in the UK. York: Joseph Rowntree Foundation

49
APPENDIXEthnic group identification is based on the responses that adult interviewees have given to the standard UK Census questions on ethnic group.
Table A1: Ethnic group categories and naming convention
Ethnic group categories used in this report
Census ethnic group categories
White majority White: British/English/Scottish/Welsh/Northern Irish
White: Irish
Other White groups White: Any other White background
Mixed parentage Mixed or multiple ethnic groups:
– White and Black Caribbean
– White and Asian
– White and Black African
– Other Mixed background
Indian Asian or Asian British: Indian
Pakistani Asian or Asian British: Pakistani
Bangladeshi Asian or Asian British: Bangladeshi
Chinese Asian or Asian British: Chinese
Black Caribbean Black or Black British: Caribbean
Black African Black or Black British: African
Note: We excluded those who self-identify their ethnic group as ‘Other ethnic group’, ‘Asian or Asian British: Any Other Asian background’, ‘Black or Black British: Any Other Black background’ as these categories are too heterogeneous to qualify as a group.
Table A2: Sample sizes by ethnic group
2004/05–2007/08 2009/10–2012/13Ethnic group Original sample# Final sample Original sample# Final sampleNorthern Ireland 13,202 13,300
Great Britain 173,337 164,923 145,752 133,209
White majority 153881 150,980 122,550 120,090
Other White groups 6,195 4,442 5,448 4,077
Mixed parentage 1,225 1,225 1,184 1,184
Indian 3,063 2,860 2,955 2,720
Pakistani 1,867 1,767 1,738 1,654
(continued overleaf)
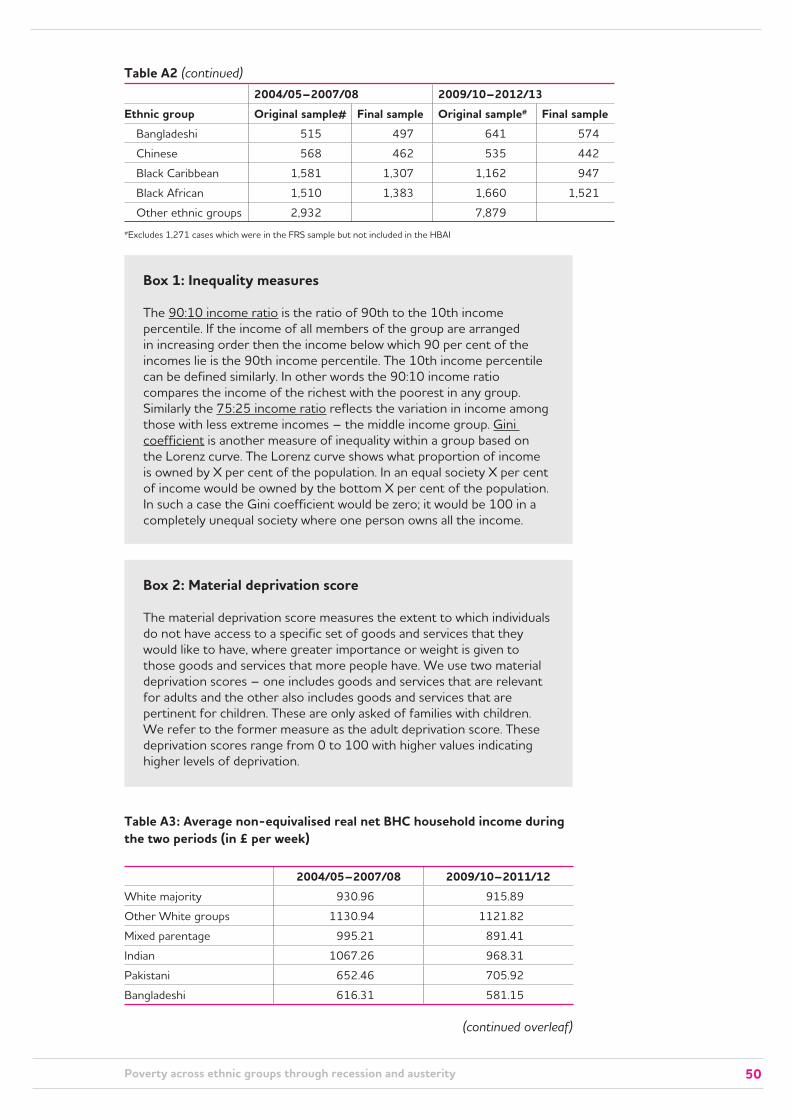
50Poverty across ethnic groups through recession and austerity
2004/05–2007/08 2009/10–2012/13Ethnic group Original sample# Final sample Original sample# Final sample Bangladeshi 515 497 641 574
Chinese 568 462 535 442
Black Caribbean 1,581 1,307 1,162 947
Black African 1,510 1,383 1,660 1,521
Other ethnic groups 2,932 7,879#Excludes 1,271 cases which were in the FRS sample but not included in the HBAI
Box 1: Inequality measures
The 90:10 income ratio is the ratio of 90th to the 10th income percentile. If the income of all members of the group are arranged in increasing order then the income below which 90 per cent of the incomes lie is the 90th income percentile. The 10th income percentile can be defined similarly. In other words the 90:10 income ratio compares the income of the richest with the poorest in any group. Similarly the 75:25 income ratio reflects the variation in income among those with less extreme incomes – the middle income group. Gini coefficient is another measure of inequality within a group based on the Lorenz curve. The Lorenz curve shows what proportion of income is owned by X per cent of the population. In an equal society X per cent of income would be owned by the bottom X per cent of the population. In such a case the Gini coefficient would be zero; it would be 100 in a completely unequal society where one person owns all the income.
Box 2: Material deprivation score
The material deprivation score measures the extent to which individuals do not have access to a specific set of goods and services that they would like to have, where greater importance or weight is given to those goods and services that more people have. We use two material deprivation scores – one includes goods and services that are relevant for adults and the other also includes goods and services that are pertinent for children. These are only asked of families with children. We refer to the former measure as the adult deprivation score. These deprivation scores range from 0 to 100 with higher values indicating higher levels of deprivation.
Table A3: Average non-equivalised real net BHC household income during the two periods (in £ per week)
2004/05–2007/08 2009/10–2011/12White majority 930.96 915.89
Other White groups 1130.94 1121.82
Mixed parentage 995.21 891.41
Indian 1067.26 968.31
Pakistani 652.46 705.92
Bangladeshi 616.31 581.15
Table A2 (continued)
(continued overleaf)

51Appendix
2004/05–2007/08 2009/10–2011/12Chinese 1202.70 788.00
Black Caribbean 686.70 650.11
Black African 735.10 692.20Dataset: 2004/05–2012/13 FRS and HBAIAll estimates are weighted.
Table A4: Household income inequality
BHC income inequality
Perioda 90:10 income ratio
75:25 income ratio
Gini coefficient
Within group
Between group
All Before 4.01 2.09 0.34 0.24 0.00
During 3.86 2.02 0.34 0.23 0.00
White majority
Before 3.90 2.05 0.34
During 3.75 2.00 0.33
Other White groups
Before 5.15 2.33 0.40
During 4.68 2.06 0.43
Mixed parentage
Before 4.38 2.23 0.39
During 4.59 2.19 0.34
Indian
Before 4.83 2.35 0.37
During 4.53 2.17 0.34
Pakistani
Before 3.33 1.81 0.30
During 3.13 1.75 0.30
Bangladeshi
Before 3.21 1.70 0.29
During 3.39 1.65 0.28
Chinese
Before 7.03 2.34 0.48
During 10.88 3.01 0.43
Black Caribbean
Before 3.74 2.00 0.30
During 3.35 1.85 0.28
Black African
Before 3.97 2.07 0.32
During 3.64 1.90 0.30
AHC income inequality
Perioda 90:10 income ratio
75:25 income ratio
Gini coefficient
Within group
Between group
All
Before 4.64 2.23 0.37 0.24 0.01
During 4.74 2.25 0.37 0.24 0.01
White majority
Before 4.46 2.17 0.36
During 4.52 2.19 0.36
Other White groups
Before 6.81 2.69 0.45
During 6.62 2.45 0.49
Mixed parentage
Before 5.53 2.58 0.43
During 5.89 2.64 0.39
Indian
Before 5.71 2.40 0.38
During 5.18 2.35 0.36
Pakistani
Before 3.84 1.83 0.33
During 3.91 1.87 0.33
Table A3 (continued)
(continued overleaf)

52Poverty across ethnic groups through recession and austerity
BHC income inequality
Perioda 90:10 income ratio
75:25 income ratio
Gini coefficient
Within group
Between group
Bangladeshi
Before 3.61 1.75 0.33
During 3.19 1.69 0.29
Chinese Before 7.27 2.49 0.52
During 7.95 3.44 0.43
Black Caribbean
Before 5.00 2.31 0.34
During 4.68 2.17 0.34
Black African Before 5.67 2.50 0.39
During 5.41 2.33 0.36a Before refers to the 4 years prior to the recent recession: 2004/05-2007/08 and During refers to the 4 years during the period of the recent recession and the austerity measures: 2009/10-2012/13
Table A5. Comparison of Understanding Society and HBAI key features
Understanding Society HBAITarget group: Private households:
General population Great Britain sampleGeneral population Northern Ireland sampleEthnic minority boost sample
Private households (Great Britain + Northern Ireland)
Small ethnic sample sizes
Adjustment for high incomes: No SPI adjustment to very high incomes
Adjustment for low incomes: No No
Excluded groups: Individuals living in institutions, such as nursing homes, student halls, barracks, prisons, and the homeless.
Individuals living in institutions, such as nursing homes, student halls, barracks, prisons, and the homeless.Removes households containing a married adult whose spouse is temporarily absent.
Fieldwork period: Interviews spread equally across two calendar years.Respondents fed forward benefit information they reported at a previous wave improving benefit data quality.
Financial year (April–March)
Dependent interviewing: No
Table A6: English language regression results
In poverty at least two waves(1) (2) (3)
UK born ––
-0.02(0.02)
0.02(0.02)
English first language −0.05** (0.02)
––
−0.06** (0.02)
Single parent 0.02(0.03)
0.03(0.03)
0.02(0.03)
Couple no kids −0.09*** (0.02)
−0.08*** (0.02)
−0.09*** (0.02)
Couple parent −0.04* (0.02)
−0.03 (0.02)
−0.04* (0.02)
Education controls Yes Yes Yes
Ethnicity group controls Yes Yes Yes
Observations 3,639 3,769 3,639Notes: Sample consists of all ethnic minority groups. Coefficients are marginal effects for a change in the variable from zero to one from logit models. A full set of ethnicity group dummy variables are included as well as a set of education level dummies. p<0.05, ** p<0.01, *** p<0.001.
Table A4 (continued)
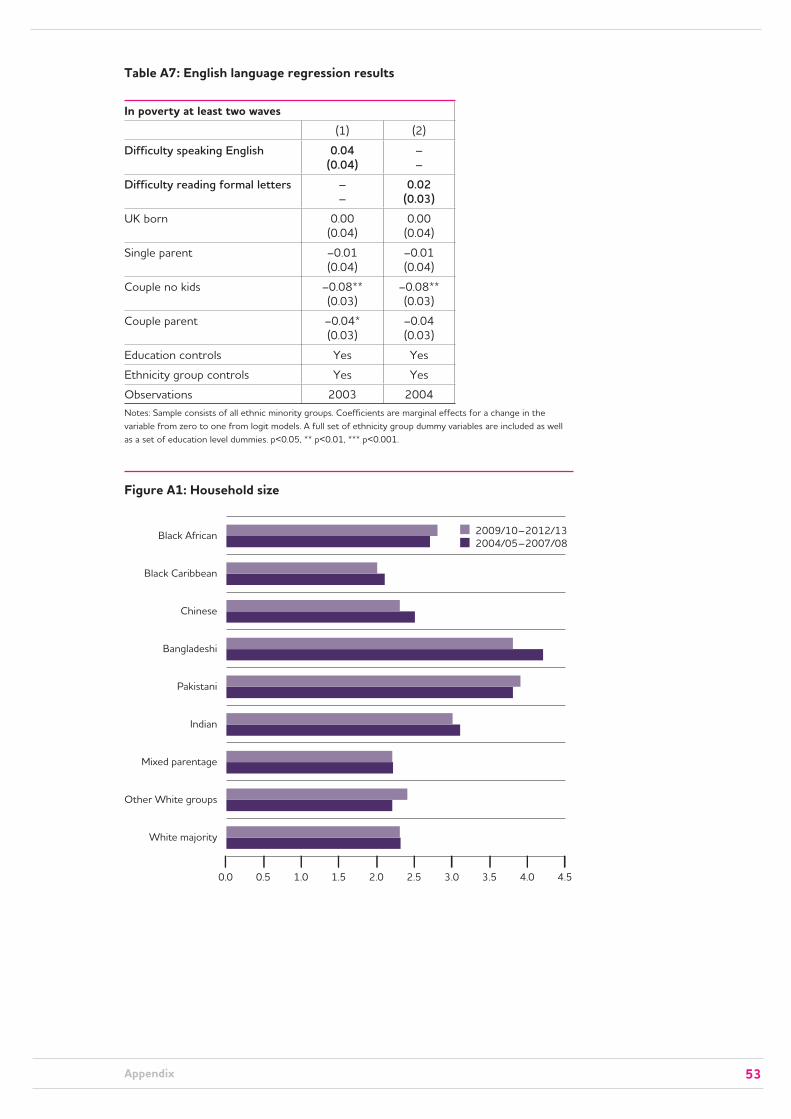
53Appendix
Table A7: English language regression results
In poverty at least two waves(1) (2)
Difficulty speaking English 0.04(0.04)
––
Difficulty reading formal letters ––
0.02(0.03)
UK born 0.00(0.04)
0.00(0.04)
Single parent −0.01(0.04)
−0.01(0.04)
Couple no kids −0.08**(0.03)
−0.08**(0.03)
Couple parent −0.04*(0.03)
−0.04(0.03)
Education controls Yes Yes
Ethnicity group controls Yes Yes
Observations 2003 2004Notes: Sample consists of all ethnic minority groups. Coefficients are marginal effects for a change in the variable from zero to one from logit models. A full set of ethnicity group dummy variables are included as well as a set of education level dummies. p<0.05, ** p<0.01, *** p<0.001.
Figure A1: Household size
White majority
Other White groups
Mixed parentage
Indian
Pakistani
Bangladeshi
Chinese
Black Caribbean
Black African 2009/10–2012/132004/05–2007/08
0.0 0.5 1.0 1.5 2.0 2.5 3.0 3.5 4.0 4.5

54Poverty across ethnic groups through recession and austerity
Figure A2: Number of dependent children in the household
White majority
Other White groups
Mixed parentage
Indian
Pakistani
Bangladeshi
Chinese
Black Caribbean
Black African 2009/10–2012/132004/05–2007/08
0.0 0.2 0.4 0.6 0.8 1.0 1.2 1.4 1.6 1.8 2.0
Figure A3: Age composition among men
White majority
Indian
Mixed parentage
Other White groups
Pakistani
Bangladeshi
Chinese
Black Caribbean
Black African
16–21 years22–30 years31–40 years41–50 years51–59 years60+ years
10.3 21.0 32.2 22.8 8.6 5.2
10.0 17.6 17.3 22.4 9.3 23.5
13.2 33.7 24,9 14.7 6.2 7.3
11.3 33.6 23.8 14.9 6.2 10.1
12.2 28.4 25.7 15.2 8.3 10.1
7.6 24.4 24.7 16.9 12.5 13.9
14.7 27.2 24.2 17.4 8.2 8.4
7.6 32.4 27.5 14.6 7.0 10.9
7.2 13.8 16.4 18.6 15.4 28.5
0.0 10.0 20.0 30.0 40.0 50.0 60.0 70.0 80.0 90.0 100.0

55Appendix
Figure A4: Age composition among women
White majority
Indian
Mixed parentage
Other White groups
Pakistani
Bangladeshi
Chinese
Black Caribbean
Black African
16–21 years22–30 years31–40 years41–50 years51–59 years60+ years
9.2 26.6 32.0 20.8 5.8 5.6
7.0 13.8 18.4 26.6 11.5 22.7
17.4 33.8 19.4 13.6 8.5 7.2
13.0 31.3 23.6 12.5 9.4 10.2
10.9 28.8 25.5 16.6 8.7 9.6
6.4 25.4 23.3 17.7 12.6 14.6
13.1 23.9 26.8 19.4 9.3 7.5
7.0 33.2 23.5 13.2 7.7 15.5
6.3 13.1 15.8 18.0 14.7 32.2
0.0 10.0 20.0 30.0 40.0 50.0 60.0 70.0 80.0 90.0 100.0
Figure A5: Types of families (2004/07–2007/08, 2009/10–2012/13)
White majority
Indian
Mixed parentage
Other White groups
Pakistani
Bangladeshi
Chinese
Black Caribbean
Black African
Pensioner familiesCouple with childrenCouple without childrenSingle motherSingle fatherSingle man without childrenSingle woman without children
0% 10% 20% 30% 40% 50% 60% 70% 80% 90% 100%
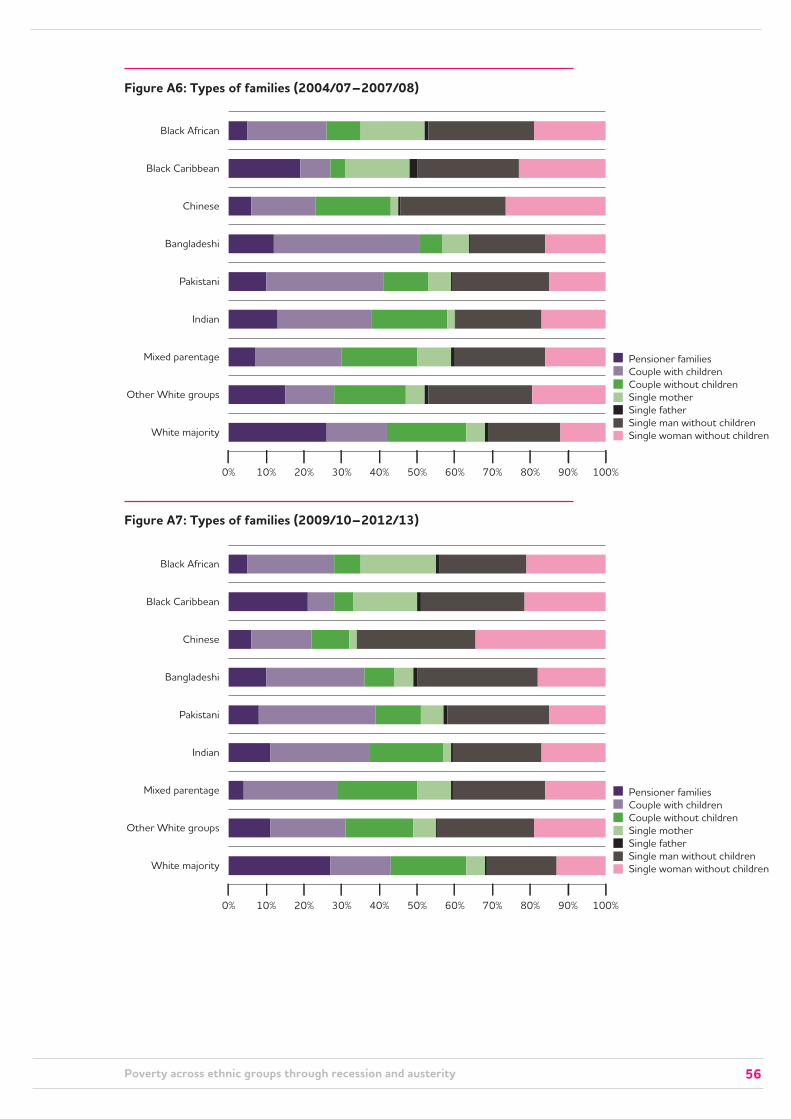
56Poverty across ethnic groups through recession and austerity
Figure A6: Types of families (2004/07–2007/08)
White majority
Indian
Mixed parentage
Other White groups
Pakistani
Bangladeshi
Chinese
Black Caribbean
Black African
Pensioner familiesCouple with childrenCouple without childrenSingle motherSingle fatherSingle man without childrenSingle woman without children
0% 10% 20% 30% 40% 50% 60% 70% 80% 90% 100%
Figure A7: Types of families (2009/10–2012/13)
White majority
Indian
Mixed parentage
Other White groups
Pakistani
Bangladeshi
Chinese
Black Caribbean
Black African
Pensioner familiesCouple with childrenCouple without childrenSingle motherSingle fatherSingle man without childrenSingle woman without children
0% 10% 20% 30% 40% 50% 60% 70% 80% 90% 100%

57Appendix
Figure A8: Housing tenure
40%
30%
20%
50%
60%
70%
80%
90%
100%
10%
0%White
majorityOtherWhitegroups
Mixedparentage
Indian Pakistani Bangladeshi Chinese BlackCaribbean
BlackAfrican
Social renterPrivate renterOwns outrightOwns, payingmortgage
Figure A9: Industry (16–59-year-old men in paid employment )
0% 20% 40% 60% 80% 100%0% 20% 40% 60% 80% 100%10% 30% 50% 70% 90%
Black African
Black Caribbean
Chinese
Bangladeshi
Pakistani
Indian
Mixed parentage
Other White groups
White majority
DuringBefore
DuringBefore
DuringBefore
DuringBefore
DuringBefore
DuringBefore
DuringBefore
DuringBefore
DuringBefore
Mining, manufacturingFood, accommodationReal estatePublic admin, defenceRest
ConstructionInformation, communicationsProfessional, science, technologyEducation
Trade, transport, supportFinanceAdmin, supportHealth, social work

58Poverty across ethnic groups through recession and austerity
Figure A10: Industry (16–59-year-old women in paid employment)
0% 20% 40% 60% 80% 100%0% 20% 40% 60% 80% 100%10% 30% 50% 70% 90%
Black African
Black Caribbean
Chinese
Bangladeshi
Pakistani
Indian
Mixed parentage
Other White groups
White majority
DuringBefore
DuringBefore
DuringBefore
DuringBefore
DuringBefore
DuringBefore
DuringBefore
DuringBefore
DuringBefore
Mining, manufacturingFood, accommodationReal estatePublic admin, defenceRest
ConstructionInformation, communicationsProfessional, science, technologyEducation
Trade, transport, supportFinanceAdmin, supportHealth, social work
Figure A11: Occupation (16–59-year-old men in paid employment)
0% 20% 40% 60% 80% 100%0% 20% 40% 60% 80% 100%10% 30% 50% 70% 90%
Black African
Black Caribbean
Chinese
Bangladeshi
Pakistani
Indian
Mixed parentage
Other White groups
White majority
DuringBefore
DuringBefore
DuringBefore
DuringBefore
DuringBefore
DuringBefore
DuringBefore
DuringBefore
DuringBefore
Managers and senior officialsAssociate professional and technical occupationsSkilled trades occupationsSales and customer service occupationsElementary occupations
Professional occupationsAdministrative and secretarial occupationsPersonal service occupationsProcess, plant and machine operatives

59Appendix
Figure A12: Occupation (16–59-year-old women in paid employment)
0% 20% 40% 60% 80% 100%0% 20% 40% 60% 80% 100%10% 30% 50% 70% 90%
Black African
Black Caribbean
Chinese
Bangladeshi
Pakistani
Indian
Mixed parentage
Other White groups
White majority
DuringBefore
DuringBefore
DuringBefore
DuringBefore
DuringBefore
DuringBefore
DuringBefore
DuringBefore
DuringBefore
Managers and senior officialsAssociate professional and technical occupationsSkilled trades occupationsSales and customer service occupationsElementary occupations
Professional occupationsAdministrative and secretarial occupationsPersonal service occupationsProcess, plant and machine operatives

60
ACKNOWLEDGEMENTSWe thank Mike Brewer for advising us throughout the project. We also thank our advisory group and Andrew Hood, Renee Luthra, Nida Broughton for their comments and suggestions. We would also like to thank Helen Barnard and Helen Robinson for their help and support during the project. This project has been funded by the Ethnicity and Poverty Programme of the Joseph Rowntree Foundation.

61
ABOUT THE AUTHORSPaul Fisher is a Senior Research Officer at the Institute for Social and Economic Research (ISER) and a recent PhD graduate from the economics department at the University of Essex. His research interests are in family economics, labour economics and policy evaluation. He has extensive experience of working with large longitudinal datasets (BHPS and Understanding Society). His research includes examining behavioural responses in families to the introduction of the Child Tax Credit in the UK and the behavioural effects of receiving information on one’s own health status. He is part of the Understanding Society team at ISER and assesses the quality of the income data in the survey.
Alita Nandi is a Research Fellow at the Institute for Social and Economic Research (ISER). She conducts empirical research primarily in areas of ethnicity and gender specifically looking at well-being (subjective as well as economic), labour market activities and partnership formation and dissolution. In her research she has used cross-section and panel data methods extensively and has worked primarily with different types of panel datasets: British Household Panel Survey, Understanding Society: the UK Household Longitudinal Study and National Longitudinal Survey of Youth 1979. She has recently co-authored a book with Simonetta Longhi which provides practical guidance for conducting panel data analysis using some of the popular panel datasets of the world. She (co)leads the Understanding Society Ethnicity Strand and capacity building activities and has contributed to questionnaire design, particularly to the measurement of ethnic identity and identity across other dimensions

Joseph Rowntree FoundationThe Homestead40 Water EndYork YO30 6WPwww.jrf.org.uk
The Joseph Rowntree Foundation has supported this project as part of its programme of research and innovative development projects, which it hopes will be of value to policy-makers, practitioners and service users. The facts presented and views expressed in this report are, however, those of the authors and not necessarily those of JRF.
A CIP catalogue record for this report is available from the British Library.
All rights reserved. Reproduction of this report by photocopying or electronic means for non-commercial purposes is permitted. Otherwise, no part of this report may be reproduced, adapted, stored in a retrieval system or transmitted by any means, electronic, mechanical, photocopying, or otherwise without the prior written permission of the Joseph Rowntree Foundation.
© University of Essex 2015First published 2015 by the JosephRowntree FoundationISBN: 978 1 90958 669 7 (pdf)Project managed and typeset byCambridge Publishing Management Limited