poverty and children in tasmania. transport about this presentation this presentation is based on...
TRANSCRIPT
Poverty and children in Tasmania
TransportAbout this presentation
This presentation is based on data collected from a range of sources including:
Australian Council of Social Services – Poverty in Australia 2014ABS 6523, Household Income and Wealth, Australia, 2013-14. ABS 6523, Household Income and Wealth, 2013-14.ABS 6523, Household Income and Wealth, 2013-14.ABS 6523, Household Income and Income Distribution, 2011-12.ACOSS 2014.State of Launceston’s Children 2012: Kids Come First.State of Launceston’s Children 2012: ABS Tasmanian Regional Profile.Tasmanian Population Health Survey, 2013.ABS 6530, Household Expenditure Survey, 2009-10.ABS, Socio-Economic Indices for Areas, 2011.Anglicare Rental Affordability Snapshot 2015.Report on Government Services 2015: Housing, Sector Overview, 2015, Table GA.5.Report on Government Services 2015: Health, Sector Overview, Table E.5PHIDU 2015, Monitoring Inequality in Australia: Tasmania.PHIDU 2012: 2011 Census.Department of Employment, Small Area Labour Markets, LGA data tables, March 2015.

Transport
What is Poverty?
Poverty can be defined as the pronounced deprivation of well-being – or the inability to satisfy your basic needs.
Poverty is one measure of financial hardship. Other measures are financial stress and deprivation.
Transport
Financial stress is people’s perception of their financial health. This is things like being unable to pay your gas, electricity or telephone bill.
Deprivation is people’s actual living standards – do they have access to the basic essential items such as a secure home?
These include things like:
• Warm clothes and bedding• Medical treatment and being able to buy medicine• A safe and secure home• Children can participate in school and in school activities• A separate bed for each child• Regular social contact with other people
Transport
How do we measure poverty?
One simple way to measure poverty is the number of people living below the poverty line. The work of ACOSS nationally uses the 50% of the median household income (i.e half the middle income for all households) to identify people in poverty.
This poverty line (which is also used by the OECD) equates to a disposable income of less than $400 per week for a single adult.

Transport
Poverty in Tasmania
In Tasmania, 15.1% of our population is considered to be living in poverty.
That is 75,500 people.
That is the equivalent of filling every seat at Blundstone Arena in Bellerive more than 3 and half times.
In the Hobart area, this figure drops to 13.8% and for the whole of Tasmania it increases to 16%
That is because if you live outside of a capital city, you are more at risk of poverty.
Tasmania has the highest rate of poverty in Australia.
Transport
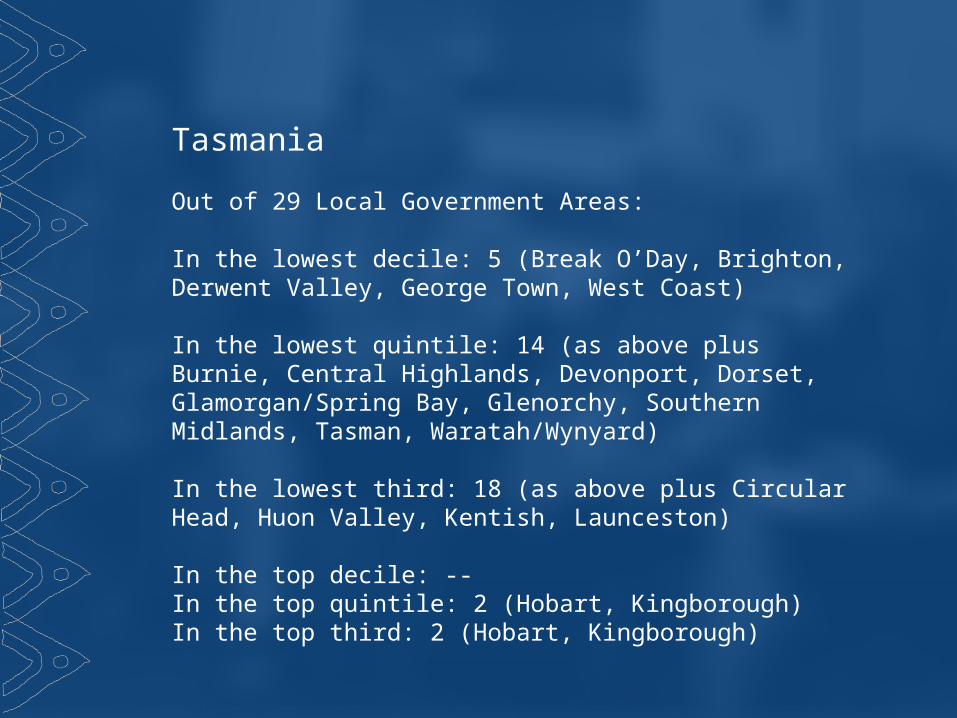
Tasmania
Out of 29 Local Government Areas:
In the lowest decile: 5 (Break O’Day, Brighton, Derwent Valley, George Town, West Coast)
In the lowest quintile: 14 (as above plus Burnie, Central Highlands, Devonport, Dorset, Glamorgan/Spring Bay, Glenorchy, Southern Midlands, Tasman, Waratah/Wynyard)
In the lowest third: 18 (as above plus Circular Head, Huon Valley, Kentish, Launceston)
In the top decile: --In the top quintile: 2 (Hobart, Kingborough)In the top third: 2 (Hobart, Kingborough)
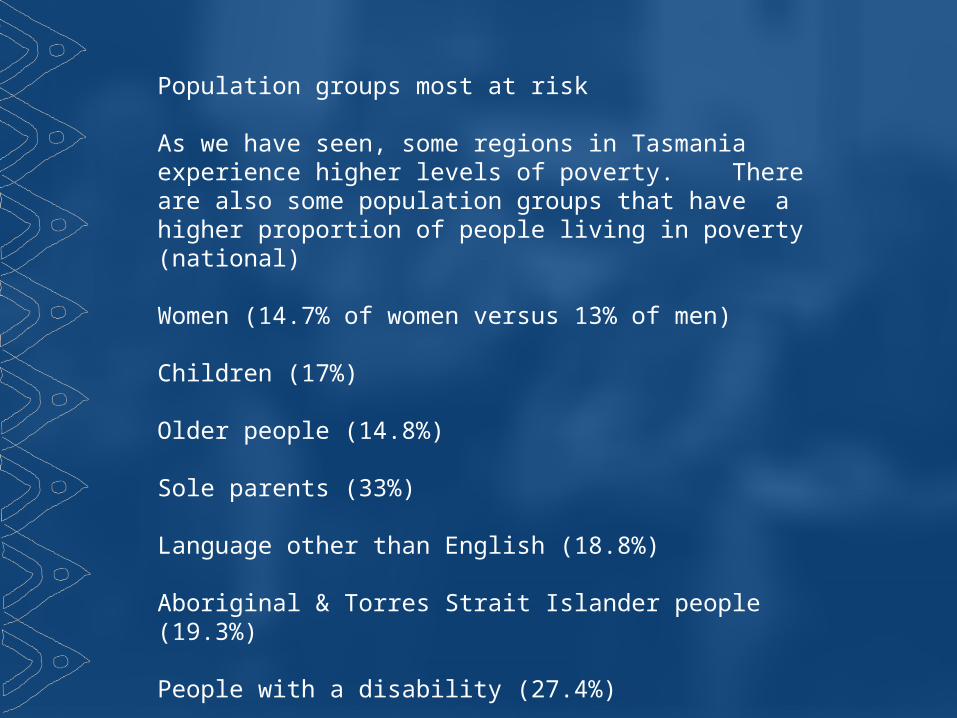
TransportPopulation groups most at risk
As we have seen, some regions in Tasmania experience higher levels of poverty. There are also some population groups that have a higher proportion of people living in poverty (national)
Women (14.7% of women versus 13% of men)
Children (17%)
Older people (14.8%)
Sole parents (33%)
Language other than English (18.8%)
Aboriginal & Torres Strait Islander people (19.3%)
People with a disability (27.4%)

Transport
Children and poverty in Tasmania
Proportion of children in Tasmania in low income families
All of state: 25%Launceston: 27%Northern Region: 26%
Proportion of children under 15 in jobless households
All of state: 23%Launceston: 21%

Transport
Children and poverty in Tasmania
Children growing up in sole parent families are at a significantly higher risk of poverty than children in other family types.
While 17.7% of children live in households of poverty in Australia, over a third (36.8%) of children in sole parent households were living in poverty.

Transport
Children and poverty in Tasmania
The high rate of poverty among children in sole parent households is the result of high rates of poverty of sole parent households overall – with 33% of lone parent households being below the poverty line.
This indicates the risk of a child being in poverty rises almost three fold – from 13.9% to 36.8% if their parents separate.
Transport
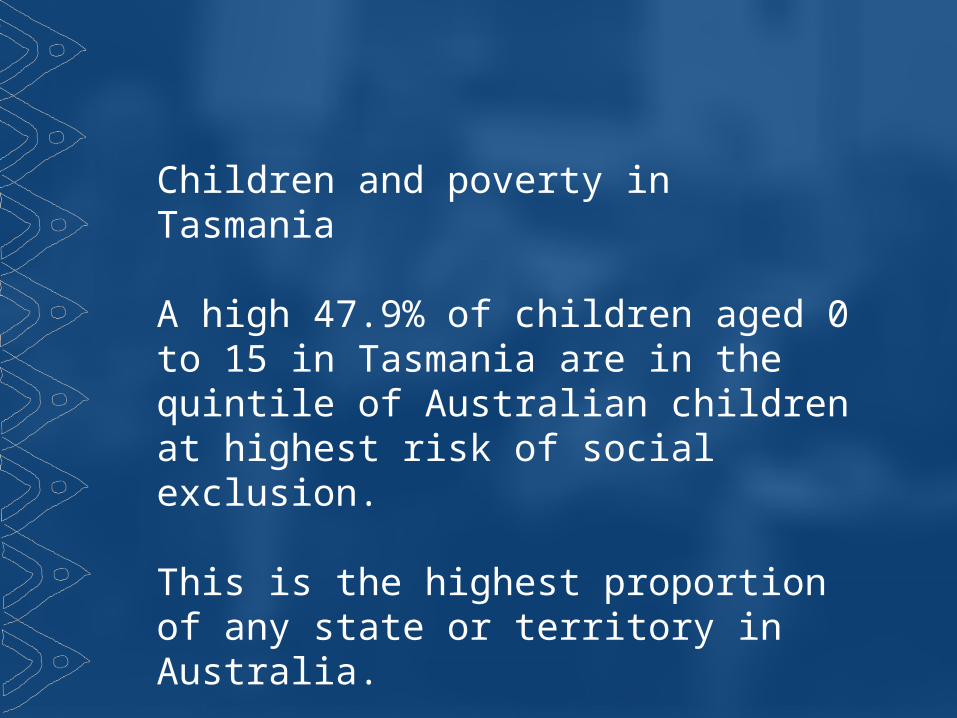
Children and poverty in Tasmania
A high 47.9% of children aged 0 to 15 in Tasmania are in the quintile of Australian children at highest risk of social exclusion.
This is the highest proportion of any state or territory in Australia.
UnitingCare Children, Young People and Families and NATSEM Report Poverty, Social Exclusion and Disadvantage in Australia October 2013

Transport
Children and poverty in Tasmania – the impact - School readiness
• Not physically ready for the school day• Do not have physical independence, or are lacking
gross and fine motor skills• Performing lower in social competence • Demonstrating lower (school based) language and
cognitive skills • Demonstrating lower communication skills and
general knowledge
Transport
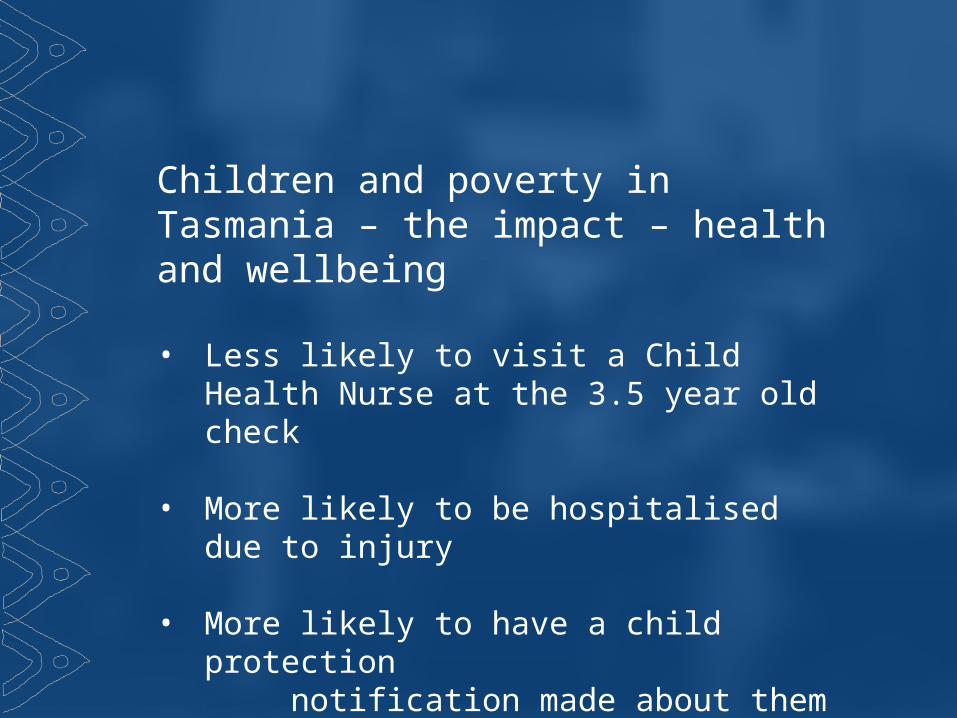
Children and poverty in Tasmania – the impact – health and wellbeing
• Less likely to visit a Child Health Nurse at the 3.5 year old check
• More likely to be hospitalised due to injury • More likely to have a child protection notification made about them
• Suffering higher rates of assault

Transport
Children and poverty in Tasmania
Inadequate family income can affect a child’s nutrition and access to medical care, the safety of their environment and the family’s ability to provide appropriate housing, heating and clothing.
Children in low-income families are also more prone to low school attendance, participation and attainment.
Why does this matter…….

Transport
Children and poverty in Tasmania – the impact on education and income
People who complete year 12 have lifetime earnings which are 42% higher than those who leave school at Year 10, and 64% higher than those who do not go on beyond year 9.
The lifetime earnings of those who go on to complete a bachelor degree are 45-50% higher than those whose highest educational qualification is Year 12
Andrew Leigh “Returns to Higher Education in Australia’, Economic Papers, Volume 27, No.3 (September 2008).

Transport
Children and poverty in Tasmania – the impact on education and income
Only 16.9% of Tasmanians aged 15-74 have a bachelor degree or higher, compared with 24.1% of all Australians in the same age range
34.1% of Tasmanians 15-74 have never progressed beyond Year 10, compared with 22.2% of all Australians in that age range.
ABS, Education and Work, Australia, May 2014, catalogue no. 6227.0

Transport
Children and poverty in Tasmania – the impact on education and income
And, in finishing this part of the discussion by the most sobering statistics of all:
The most recent ABS data shows that Tasmania’s apparent retention rate from Year 10 – Year 12 was 69.4% in 2014 – more than 13% lower than the national average of 82.5%. This is the widest gap we have seen since 1997.
ABS, Schools, Australia, 2014, catalogue no 4221.0

Transport
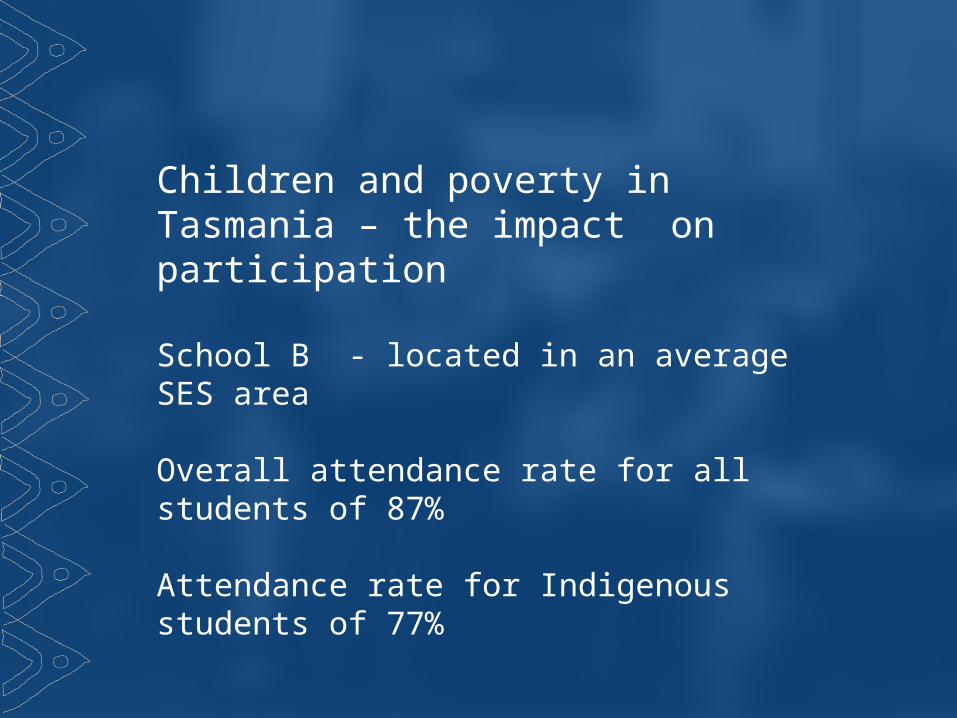
Children and poverty in Tasmania – the impact on participation
School A – a school in a high SES area
Overall attendance rate for all students of 91%
Attendance rate for Indigenous students of 84%
Transport
Children and poverty in Tasmania – the impact on participation
School B - located in an average SES area
Overall attendance rate for all students of 87%
Attendance rate for Indigenous students of 77%

Transport
Children and poverty in Tasmania – the impact on participation
School C – located in a low SES area
Overall attendance rate for all students of 82%
Attendance rate for Indigenous students of 68%

TransportChildren and poverty in Tasmania – the impact on participation
In closing, I think we need to understand the attendance issue in primary and high school being explicitly linked to the retention and the longer term qualifications and participation issue. This issue of attendance goes to the heart of poverty and equity issues.
It goes to the heart of the cost of living issues faced by families and it goes to the heart of the health, the mental health and the wellbeing issues of many in our community who are struggling to afford the basics and participate in the parts of day to day life that most of us take for granted.
That is the story of poverty in Tasmania.