poverty and inequality in boston - 2015
TRANSCRIPT

BOSTON CITYWIDE PLANTRENDS IN POVERTY AND INEQUALITY
BRA Research Division
October 2015

Produced by the BRA Research Division:
Alvaro Lima – DirectorJonathan Lee– Deputy Director
Christina Kim – Research ManagerMatthew Resseger – Senior Researcher/Economist
Phillip Granberry – Senior Researcher/DemographerKevin Kang – Research Associate
Kevin Wandrei – Research AssistantXiaoxiao Ma - Intern
The BRA Research Division strives to understand the current environment of the city to produce quality research and targeted information that will inform and benefit the residents and businesses of Boston. The Division conducts research on Boston’s economy, population, and
commercial markets for all departments of the BRA, the City of Boston, and related organizations.
The information provided in this report is the best available at the time of its publication.
All or partial use of this report must be cited. Our preferred citation is as follows:
Boston Redevelopment Authority/Research Division, October 2015
For more information about research produced by the Boston Redevelopment Authority, please contact the Research Division at [email protected]. Research requests can be made through the BRA Research Division’s Research Inquiries website.
Cover Photos from Boston Mayor’s Office (clockwise from upper left):
1. Youth Options Unlimited program - Aug. 10, 2015 (Jeremiah Robinson)
2. Commencement at Edward M. Kennedy School for Health Careers - June 4, 2015 (Isabel Leon)
3. Homeless Census – Feb. 25, 2015 (Isabel Leon)
4. Festival Betances - July 17, 2015 (Don Harney)
5. Roslindale Day Parade - Oct. 5, 2015 (Don Harney)
6. Topping off Science and Engineering Complex at Northeastern University - May 21, 2015 (Jeremiah Robinson)
2
THE PURPOSE OF THIS DOCUMENT IS TO PROVIDE A FACTUAL BASIS TO UNDERSTAND:
• Historical trends that have shaped poverty and inequality within the city of Boston.
• The extent of poverty and inequality within Boston today.
• Specific populations that are disproportionately affected by poverty and inequality.
3

What are the Trends?
Rising personal income for women
Stagnant household income
Persistent poverty
Continuing disparities by demographic groups
Measures of Inequality and Poverty:
Personal Income
Income distribution
Living wage
Work schedule and consistency
Household Income
Median income over time
Gini coefficient
Poverty
Thresholds
Rates of poverty
Poverty by neighborhood
4
Demographics of Inequality & Poverty:
Race and Ethnicity
Poverty
Income
Gender
Earnings disparities
Marital Status
Presence of Children
Age
Poverty by Age
Child Poverty
Nativity and Language
Poverty and Income
Linguistic Isolation
Education
Income by Education

5
WHAT ARE THE TRENDS? (1) PERSONAL INCOME
• Real personal income has only increased slightly for men over the past 40 years, but has increased dramatically for women.
• The median income of male full-time workers has risen from $47,445 in 1980 to $53,827 in 2013 (2013 dollars).
• The median income of female full-time workers has risen from $35,707 in 1980 to $49,718 in 2013 (2013 dollars).

6
WHAT ARE THE TRENDS? (2) GROWING HOUSEHOLD INCOME INEQUALITY
• In 2013 dollars, median household income in Boston grew rapidly between 1980 and 1990, but has remained stagnant since then at about $54,000 a year.
• Household income inequality has grown – the share of Boston households earning over $150,000 in 2013 dollars has grown between 1980 (3.1%) and 2013 (13.0%); meanwhile, the share of households earning a middle class income has fallen.
• Boston is the third most unequal city in the nation, based on the ratio of the 95th percentile and the 20th percentile of household income, up from the fourth more unequal city in 2012.

7
WHAT ARE THE TRENDS? (3) POVERTY
• Poverty is a continuing problem in Boston: about 20% of the population has been living in poverty for the past four decades.
• The Great Recession caused the poverty rate to rise in Boston to 23.3% in 2010.
• The poverty rate has since fallen slightly, to 21.6% in 2013.
8
WHAT ARE THE TRENDS? (4) DEMOGRAPHICS OF INEQUALITY AND POVERTY
• Different demographic groups continue to be disproportionately affected by inequality and poverty.
• The growth of the knowledge economy has brought increased the opportunities for well-educated workers, but residents with low levels of education are more likely to have low incomes.
• However, the benefits of education are not equal for all Bostonians. While people of color and women gain more income from higher education, they gain less income than white men do from the same levels of education.
• Boston’s children are much more likely to be living in poverty than any other age group.

MEASURES OF INEQUALITY AND POVERTY

PERSONAL INCOME
Source: U.S. Census Bureau, 2013 American Community Survey, BRA Research Division Analysis
18% 18%
27%
17%
8%
11%
0%
5%
10%
15%
20%
25%
30%
<$10,000 $10,000-$24,999 $25,000-$49,999 $50,000-$74,999 $75,000-$99,999 $100,000+
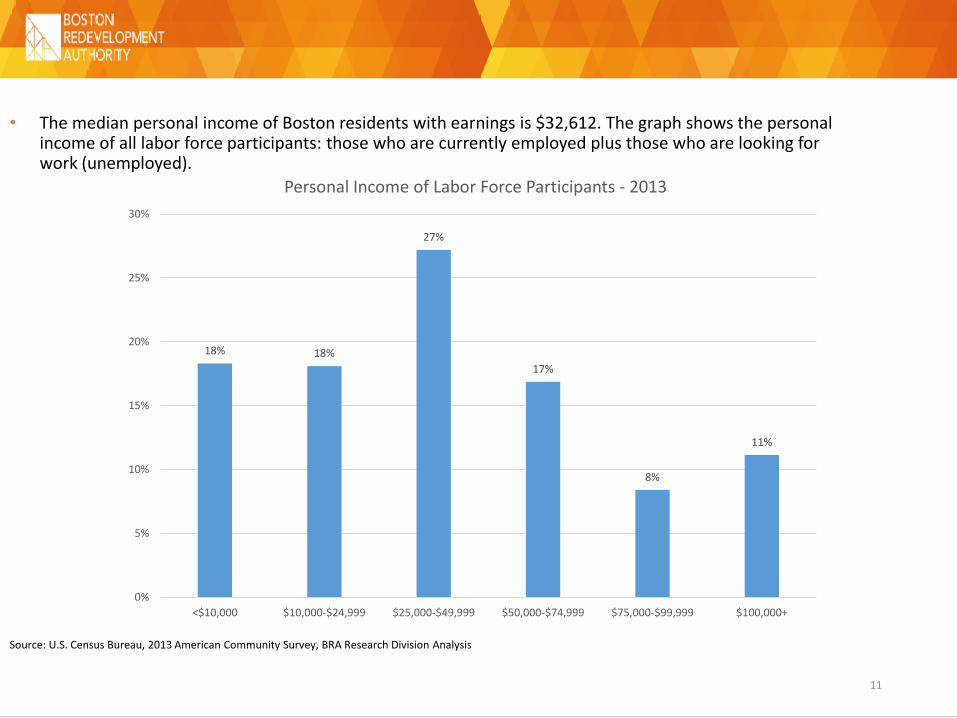
Personal Income of Labor Force Participants - 2013
11
• The median personal income of Boston residents with earnings is $32,612. The graph shows the personal income of all labor force participants: those who are currently employed plus those who are looking for work (unemployed).
Source: U.S. Census Bureau, 2013 American Community Survey, BRA Research Division AnalysisSample: non-institutionalized civilian Boston resident workers, ages 16 and above, who worked 35 hours or more a week for 50 or more weeks of the year. Income includes salary, wages, and income earned from self-employment.
12
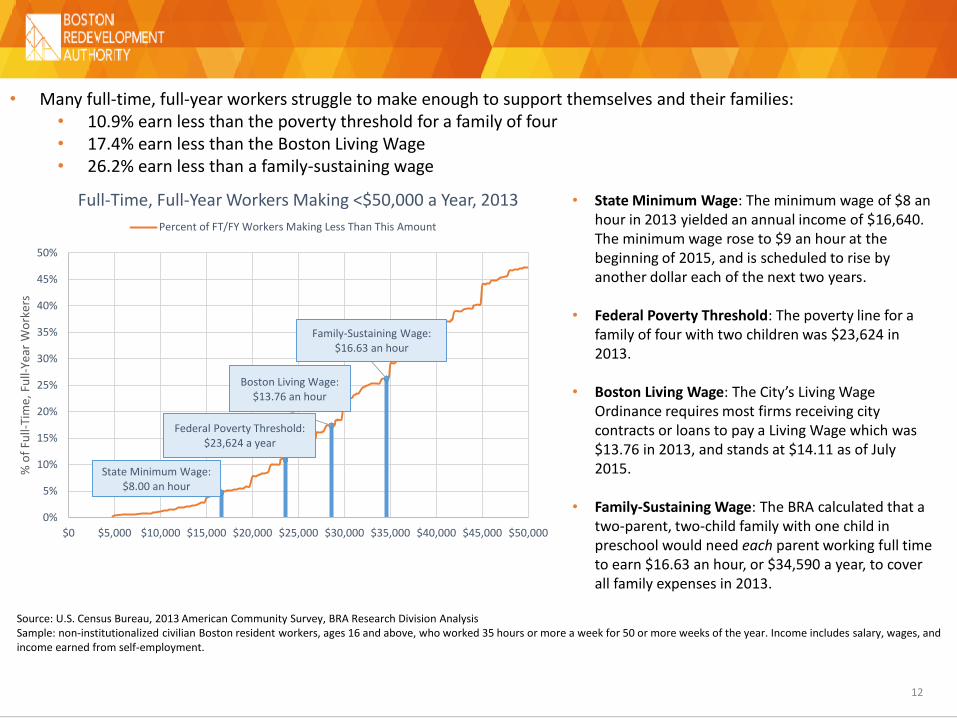
• State Minimum Wage: The minimum wage of $8 an hour in 2013 yielded an annual income of $16,640. The minimum wage rose to $9 an hour at the beginning of 2015, and is scheduled to rise by another dollar each of the next two years.
• Federal Poverty Threshold: The poverty line for a family of four with two children was $23,624 in 2013.
• Boston Living Wage: The City’s Living Wage Ordinance requires most firms receiving city contracts or loans to pay a Living Wage which was $13.76 in 2013, and stands at $14.11 as of July 2015.
• Family-Sustaining Wage: The BRA calculated that a two-parent, two-child family with one child in preschool would need each parent working full time to earn $16.63 an hour, or $34,590 a year, to cover all family expenses in 2013.
State Minimum Wage: $8.00 an hour
Federal Poverty Threshold: $23,624 a year
Boston Living Wage: $13.76 an hour
Family-Sustaining Wage: $16.63 an hour
0%
5%
10%
15%
20%
25%
30%
35%
40%
45%
50%
$0 $5,000 $10,000 $15,000 $20,000 $25,000 $30,000 $35,000 $40,000 $45,000 $50,000
% o
f Fu
ll-Ti
me,
Fu
ll-Ye
ar W
ork
ers
Full-Time, Full-Year Workers Making <$50,000 a Year, 2013
Percent of FT/FY Workers Making Less Than This Amount
• Many full-time, full-year workers struggle to make enough to support themselves and their families:• 10.9% earn less than the poverty threshold for a family of four• 17.4% earn less than the Boston Living Wage• 26.2% earn less than a family-sustaining wage

-
20,000
40,000
60,000
80,000
100,000
120,000
Less than $10,000 $10,000 to $24,999 $25,000 to $49,999 $50,000 to $74,999 $75,000 to $100,000 $100,000 or more
Nu
mb
er o
f W
ork
ers
Income by Work Schedule for Labor Force Participants
Full Time, Full Year Part Time or Part Year Unemployed
• Boston residents earning very low incomes are predominantly part-time workers or full-time workers who worked for less than the full year.
• 84.3% of part-time workers and 55.7% of full-time, part-year workers, earn less than $25,000.
• Among full-time, full-year workers, only 12.7% make less than $25,000.
13
Source: U.S. Census Bureau, 2009-2013 American Community Survey, BRA Research Division AnalysisSample includes Boston resident civilian (non-military) labor force participants, ages 16+Part-time work is defined as less than 35 hours per week.
HOUSEHOLD INCOME

15
$40,206
$54,820 $55,413 $54,148$53,601
$0
$10,000
$20,000
$30,000
$40,000
$50,000
$60,000
1980 1985 1990 1995 2000 2005 2010 2015
Median Household Income – 2013 Dollars
Source: U.S. Census Bureau, 1980, 1990, 2000 Decennial Census, 2006-2010 & 2009-2013 American Community Survey, BRA Research Division Analysis
• Boston’s real median household income jumped during the 1980’s, but has remained steady in real terms since 1990.
• 2013 median household income is slightly lower than 1990 in real terms.
16
31.6%
29.0%
65.2%
58.0%
3.1%
13.0%
0%
10%
20%
30%
40%
50%
60%
70%
1980 1985 1990 1995 2000 2005 2010 2015
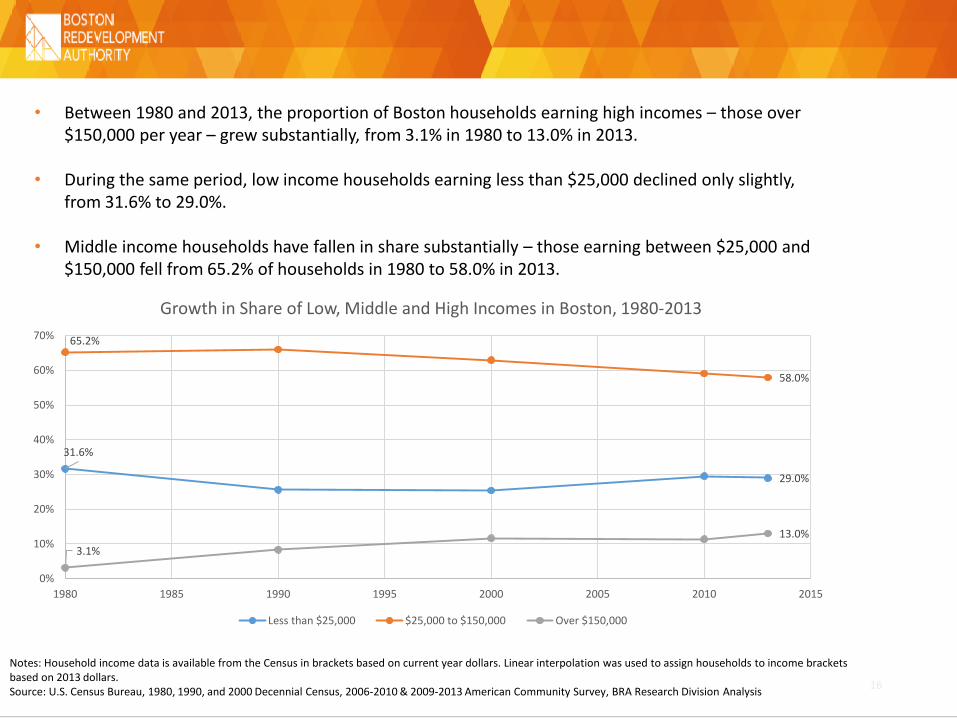
Growth in Share of Low, Middle and High Incomes in Boston, 1980-2013
Less than $25,000 $25,000 to $150,000 Over $150,000
Notes: Household income data is available from the Census in brackets based on current year dollars. Linear interpolation was used to assign households to income brackets based on 2013 dollars.Source: U.S. Census Bureau, 1980, 1990, and 2000 Decennial Census, 2006-2010 & 2009-2013 American Community Survey, BRA Research Division Analysis
• Between 1980 and 2013, the proportion of Boston households earning high incomes – those over $150,000 per year – grew substantially, from 3.1% in 1980 to 13.0% in 2013.
• During the same period, low income households earning less than $25,000 declined only slightly, from 31.6% to 29.0%.
• Middle income households have fallen in share substantially – those earning between $25,000 and $150,000 fell from 65.2% of households in 1980 to 58.0% in 2013.

17
Source: Alan Berube and Natalie Holmes, “Some cities are still more unequal than others – an update.” The Brookings Institution. March 17, 2015.
• According to a Brookings Institution report, Boston is the third most unequal city in the nation, based on the ratio of the 95th percentile and the 20th percentile of household income.
• Boston’s rank increased from 2012 to 2013, going from the fourth most unequal to the third.
• The 95th percentile of Boston households earns $239,837, while the 20th percentile earns $15,952. This means that the 95th percentile earns 15 times more income than the 20th percentile.

• The Gini Coefficient measures income inequality on a 0 to 1 scale. Boston’s Gini Coefficient is the second-highest in the region, at .533 in 2013.
• The Gini Coefficient is not related to poverty. As the chart below shows, places with high poverty can have high or low Gini Coefficients. A location where everyone lives in poverty, for example, could have as low a Gini Coefficient as a place where everyone is wealthy.
Note: A score of 0 corresponds to “perfect equality,” where each household’s income is identical; a score of 1 represents “perfect inequality,” where a single household earns all income.Source: U.S. Census Bureau, 2009-2013 American Community Survey, BRA Research Division Analysis
City/Town Gini Index Percent Below
Poverty
Brookline 0.554 11.5%
Boston 0.533 21.4%
Cambridge 0.529 14.7%
Newton 0.507 5.7%
Chelsea 0.462 23.7%
Dedham 0.444 4.3%
Malden 0.443 16.0%
Milton 0.439 4.9%
Revere 0.439 15.4%
Waltham 0.439 10.1%
Quincy 0.425 10.5%
Everett 0.423 13.2%
Medford 0.419 9.8%
Somerville 0.418 14.8%
Massachusetts 0.477 11.4%
United States 0.474 15.4%

19
HIGH AND LOW INCOME HOUSEHOLDS BY CENSUS TRACT

20Source: U.S. Census Bureau, 2009-2013 American Community Survey, BRA Research Division Analysis
Household Income by Neighborhood
• Neighborhoods such as Charlestown, Downtown, the South End, the West End, and South Boston have both a high proportion of households earning less than $25,000 and more than $150,000.
• Other neighborhoods are heavily populated by households earning less than $25,000. These include Roxbury, Fenway, Mission Hill, Allston, and Longwood.
• The South Boston Waterfront has the highest median household income, the lowest percentage of households earning less than $25,000 and the highest percentage of households earning $150,000 or more.
• Neighborhoods such as Downtown with a higher Gini Coefficient have wider disparities in household income.
Median Household
Income
% Less than $25,000
% $150,000+ Gini Coefficient
United States $53,046 23.4% 9.7% 0.47
Massachusetts $66,866 20.1% 15.7% 0.48
Boston $53,601 29.0% 13.0% 0.53
South Boston Waterfront $95,078 11.0% 30.8% 0.39
Back Bay $91,468 19.1% 29.8% 0.53
Charlestown $89,828 24.7% 26.8% 0.50
Beacon Hill $85,098 14.2% 23.1% 0.48
West End $82,022 20.2% 25.8% 0.50
West Roxbury $78,670 17.9% 21.1% 0.44
North End $75,604 16.4% 16.9% 0.50
Jamaica Plain $74,747 19.0% 17.9% 0.47
South Boston $69,122 23.1% 18.8% 0.48
Roslindale $68,690 20.2% 14.2% 0.41
South End $65,877 29.5% 25.2% 0.55
Hyde Park $61,493 18.4% 9.8% 0.40
Downtown $54,579 35.3% 25.8% 0.60
East Boston $48,541 27.2% 4.7% 0.43
Brighton $47,460 31.3% 7.6% 0.46
Dorchester $46,965 31.4% 6.6% 0.47
Mattapan $43,329 33.1% 4.1% 0.44
Allston $36,409 39.7% 5.7% 0.50
Mission Hill $33,481 42.0% 5.3% 0.51
Longwood Medical Area $30,000 35.4% 6.7% 0.53
Fenway $27,705 48.5% 6.8% 0.59
Roxbury $26,280 48.7% 2.8% 0.53

POVERTY
20.2%18.7%
19.5%
22.3%
19.8% 20.4%18.7%
16.9%
23.3% 23.2%21.6% 21.6%
0%
5%
10%
15%
20%
25%
1980 1990 2000 2005 2006 2007 2008 2009 2010 2011 2012 2013
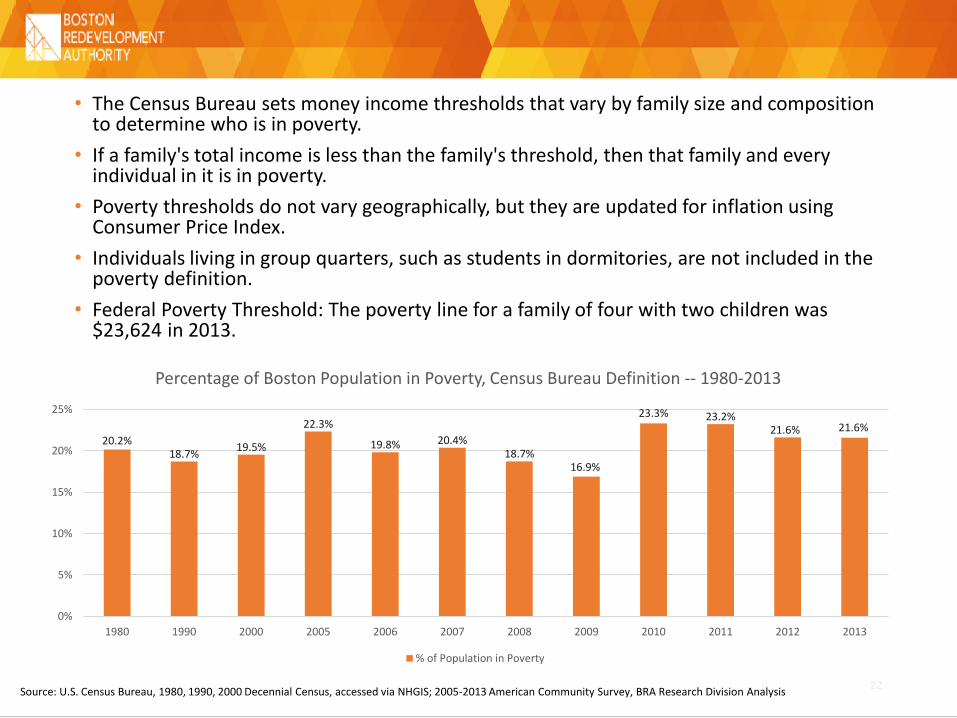
Percentage of Boston Population in Poverty, Census Bureau Definition -- 1980-2013
% of Population in Poverty
22Source: U.S. Census Bureau, 1980, 1990, 2000 Decennial Census, accessed via NHGIS; 2005-2013 American Community Survey, BRA Research Division Analysis
• The Census Bureau sets money income thresholds that vary by family size and composition to determine who is in poverty.
• If a family's total income is less than the family's threshold, then that family and every individual in it is in poverty.
• Poverty thresholds do not vary geographically, but they are updated for inflation using Consumer Price Index.
• Individuals living in group quarters, such as students in dormitories, are not included in the poverty definition.
• Federal Poverty Threshold: The poverty line for a family of four with two children was $23,624 in 2013.
23
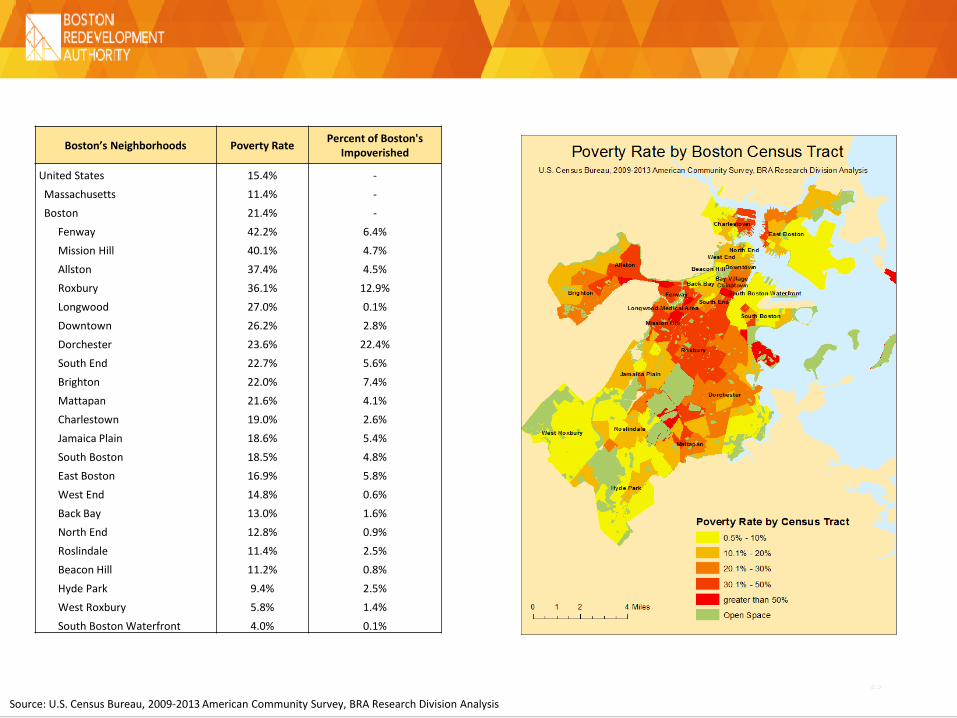
Boston’s Neighborhoods Poverty RatePercent of Boston's
Impoverished
United States 15.4% -
Massachusetts 11.4% -
Boston 21.4% -
Fenway 42.2% 6.4%
Mission Hill 40.1% 4.7%
Allston 37.4% 4.5%
Roxbury 36.1% 12.9%
Longwood 27.0% 0.1%
Downtown 26.2% 2.8%
Dorchester 23.6% 22.4%
South End 22.7% 5.6%
Brighton 22.0% 7.4%
Mattapan 21.6% 4.1%
Charlestown 19.0% 2.6%
Jamaica Plain 18.6% 5.4%
South Boston 18.5% 4.8%
East Boston 16.9% 5.8%
West End 14.8% 0.6%
Back Bay 13.0% 1.6%
North End 12.8% 0.9%
Roslindale 11.4% 2.5%
Beacon Hill 11.2% 0.8%
Hyde Park 9.4% 2.5%
West Roxbury 5.8% 1.4%
South Boston Waterfront 4.0% 0.1%
Source: U.S. Census Bureau, 2009-2013 American Community Survey, BRA Research Division Analysis

24Source: U.S. Census Bureau, 2009-2013 5-Year American Community Survey, Public Use Microdata Sample (PUMS), BRA Research Division Analysis.
• Personal Care and Service, Building and Grounds Cleaning and Maintenance, and Food Preparation and Serving have more than 20% of their workers in poverty.
• Business and Financial Operations, Management, and Computer and Mathematical occupations, on the other hand, have the fewest employees living in poverty.
Occupation Poverty Rate
Personal Care and Service 25.1%
Building and Grounds Cleaning and Maintenance 20.9%
Food Preparation and Serving 20.8%
Sales 17.1%
Farming, Fishing, and Forestry 17.0%
Transportation and Material Moving 14.8%
Construction and Extraction 14.4%
Production 14.0%
Arts, Design, Entertainment, Sports, and Media 13.5%
Office and Administrative Support 13.2%
Healthcare Support 13.0%
Protective Service 11.0%
Education, Training, and Library 10.7%
Community and Social Services 7.9%
Installation, Maintenance, and Repair 7.1%
Life, Physical, and Social Science 6.6%
Healthcare Practitioners 6.6%
Legal 6.3%
Architecture and Engineering 4.0%
Computer and Mathematical 3.8%
Management 3.4%
Business and Financial Operations 2.9%
25
$1,599
$399
$740
$342
$73
$599
$795$842
$1,031
$518
$159
$732$771
$0
$200
$400
$600
$800
$1,000
$1,200
$1,400
$1,600
$1,800
housing food childcare healthcare transportation personal and home goods taxes
Monthly Expenses - 2013
Single Mom, 1 preschooler Two Parents, 1 preschooler, 1 school-aged child
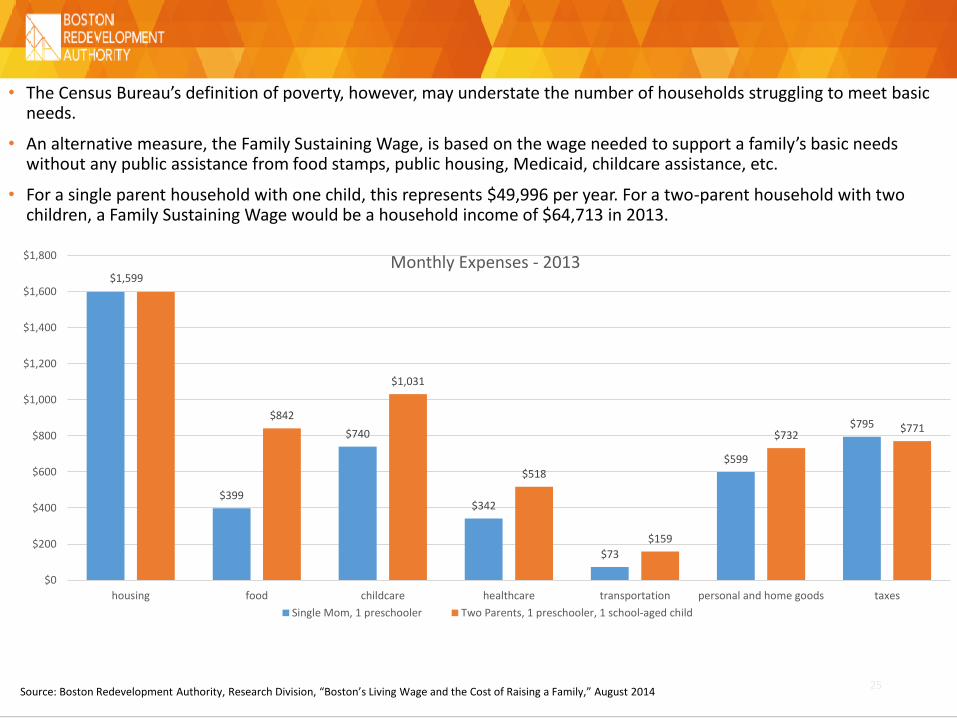
• The Census Bureau’s definition of poverty, however, may understate the number of households struggling to meet basic needs.
• An alternative measure, the Family Sustaining Wage, is based on the wage needed to support a family’s basic needs without any public assistance from food stamps, public housing, Medicaid, childcare assistance, etc.
• For a single parent household with one child, this represents $49,996 per year. For a two-parent household with two children, a Family Sustaining Wage would be a household income of $64,713 in 2013.
Source: Boston Redevelopment Authority, Research Division, “Boston’s Living Wage and the Cost of Raising a Family,” August 2014
26
Percent of Families with Children Below Income Thresholds, 2000-2012
Below the Poverty Threshold:
1 Parent 2 Parents Total
2000 Census 40.9% 12.1% 25.9%
2005-2009 ACS 42.7% 9.2% 26.4%
2010-2012 ACS 47.2% 8.7% 30.0%
Below the Family Sustaining Wage Threshold:
1 Parent 2 Parents Total
2000 Census 82.6% 36.9% 58.8%
2005-2009 ACS 83.3% 33.1% 58.9%
2010-2012 ACS 86.1% 30.3% 61.1%
Source: Boston Redevelopment Authority, Research Division, “Boston’s Living Wage and the Cost of Raising a Family,” August 2014
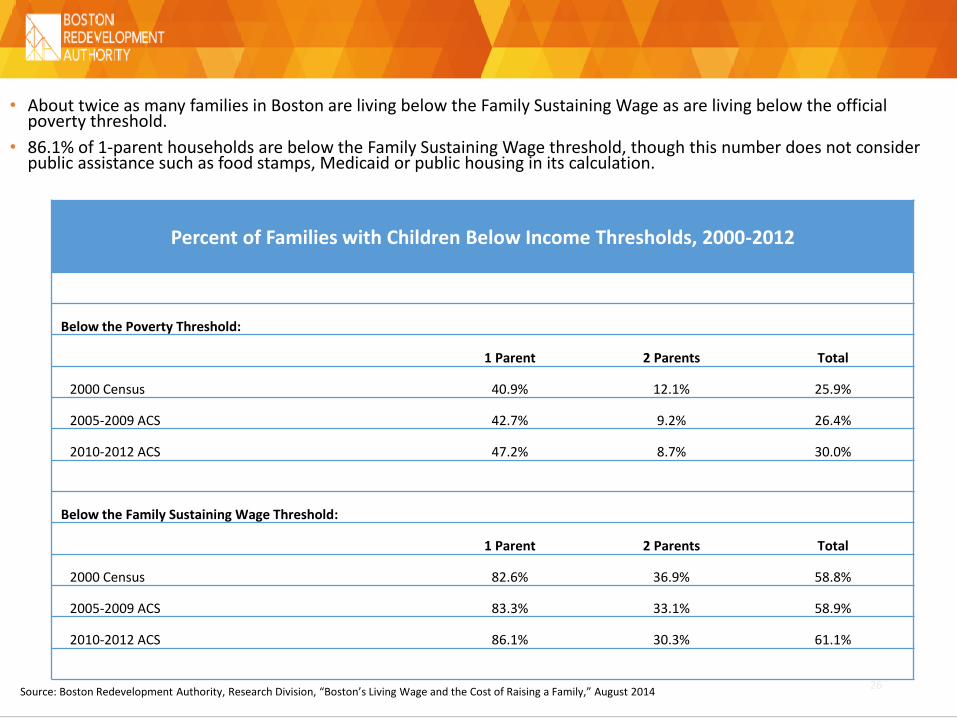
• About twice as many families in Boston are living below the Family Sustaining Wage as are living below the official poverty threshold.
• 86.1% of 1-parent households are below the Family Sustaining Wage threshold, though this number does not consider public assistance such as food stamps, Medicaid or public housing in its calculation.
DEMOGRAPHICS OF INEQUALITY AND POVERTY
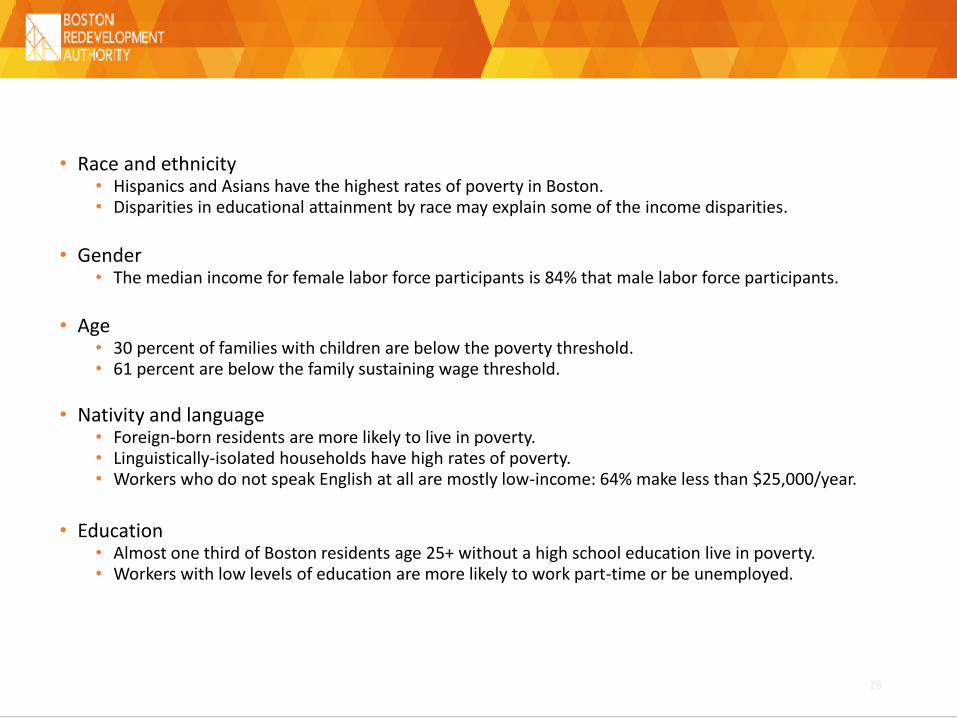
• Race and ethnicity• Hispanics and Asians have the highest rates of poverty in Boston.• Disparities in educational attainment by race may explain some of the income disparities.
• Gender• The median income for female labor force participants is 84% that male labor force participants.
• Age• 30 percent of families with children are below the poverty threshold.• 61 percent are below the family sustaining wage threshold.
• Nativity and language• Foreign-born residents are more likely to live in poverty.• Linguistically-isolated households have high rates of poverty.• Workers who do not speak English at all are mostly low-income: 64% make less than $25,000/year.
• Education• Almost one third of Boston residents age 25+ without a high school education live in poverty. • Workers with low levels of education are more likely to work part-time or be unemployed.
28

RACE AND ETHNICITY

• Hispanics and Asians have the highest rates of poverty in Boston.
30
Source: U.S. Census Bureau, 2013 1-year American Community Survey, BRA Research Division AnalysisNote: Hispanics can be of any race, but are reported separately in this analysis.
13.7%
21.5%
35.9%
31.3%
0%
5%
10%
15%
20%
25%
30%
35%
40%
White Alone Black/Africian American Alone Hispanic Asian/Pacific Islander Alone
Poverty Rates by Race, 2013
31Source: U.S. Census Bureau, 2013 1-year American Community Survey, Public Use Microdata Sample (PUMS), BRA Research Division Analysis
14.3%21.3% 23.6% 24.9%
12.6%
21.6%
31.6%
19.9%23.3%
33.6%
29.7%
23.7%19.8%
15.6%
9.8%
15.8%11.5%
5.2% 2.9%
7.8%18.4%
2.7% 2.4%7.9%
0%
10%
20%
30%
40%
50%
60%
70%
80%
90%
100%
White Black/African-American Hispanic Asian
Personal Income of Labor Force Participants by Race - 2013
$0-9,999 $10-24,999 $25,000-49,999 $50,000-74,999 $75,000-100,000 more than $100,000
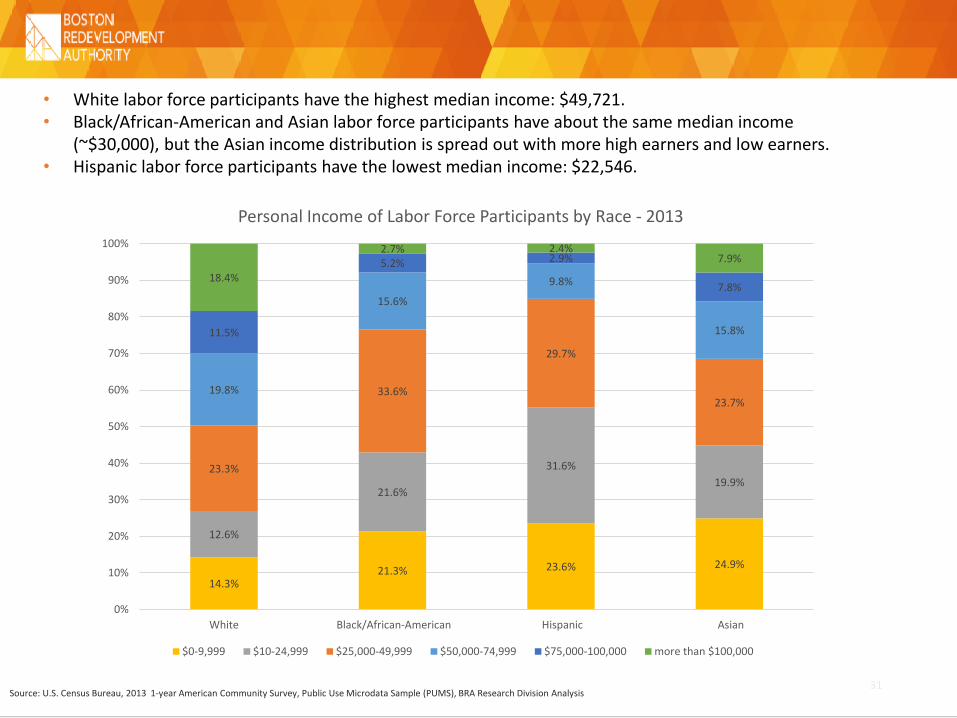
• White labor force participants have the highest median income: $49,721.• Black/African-American and Asian labor force participants have about the same median income
(~$30,000), but the Asian income distribution is spread out with more high earners and low earners.• Hispanic labor force participants have the lowest median income: $22,546.

32
Source: U.S. Census Bureau, 2009-2013 American Community Survey, Public Use Microdata Sample (PUMS), BRA Research Division Analysis
• Among the population aged 25+, there are large disparities in educational attainment by racethat may explain some of the income disparities.
• Hispanics are the least likely to hold a Bachelor’s or higher, and the most likely to have less than a high school diploma.
5.3%
19.8%
34.0%
24.2%16.5%
32.8%
29.3%
18.4%15.2%
28.5%
19.6%
8.9%
63.0%
18.9% 17.1%
48.4%
0%
10%
20%
30%
40%
50%
60%
70%
80%
90%
100%
White alone Black or African American alone Hispanic Asian alone
Educational Attainment by Race, 2013
Less than high school High school Some college or Associate's degree Bachelor's Degree or higher
33Source: U.S. Census Bureau, 2013 American Community Survey, Public Use Microdata Sample (PUMS), BRA Research Division Analysis
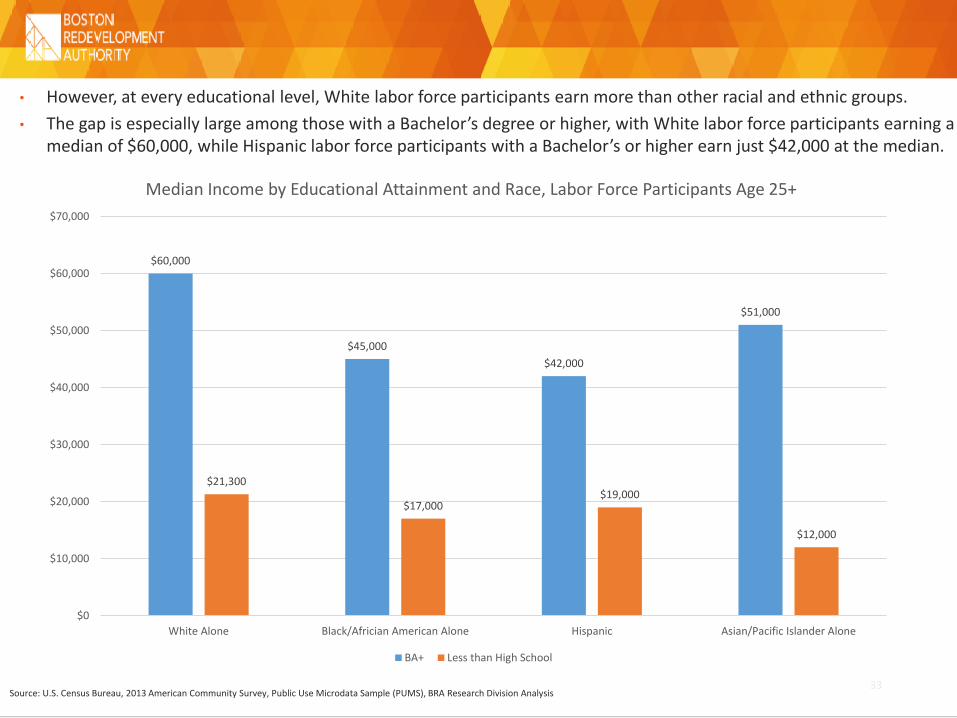
• However, at every educational level, White labor force participants earn more than other racial and ethnic groups.
• The gap is especially large among those with a Bachelor’s degree or higher, with White labor force participants earning a median of $60,000, while Hispanic labor force participants with a Bachelor’s or higher earn just $42,000 at the median.
$60,000
$45,000
$42,000
$51,000
$21,300
$17,000$19,000
$12,000
$0
$10,000
$20,000
$30,000
$40,000
$50,000
$60,000
$70,000
White Alone Black/Africian American Alone Hispanic Asian/Pacific Islander Alone
Median Income by Educational Attainment and Race, Labor Force Participants Age 25+
BA+ Less than High School

GENDER
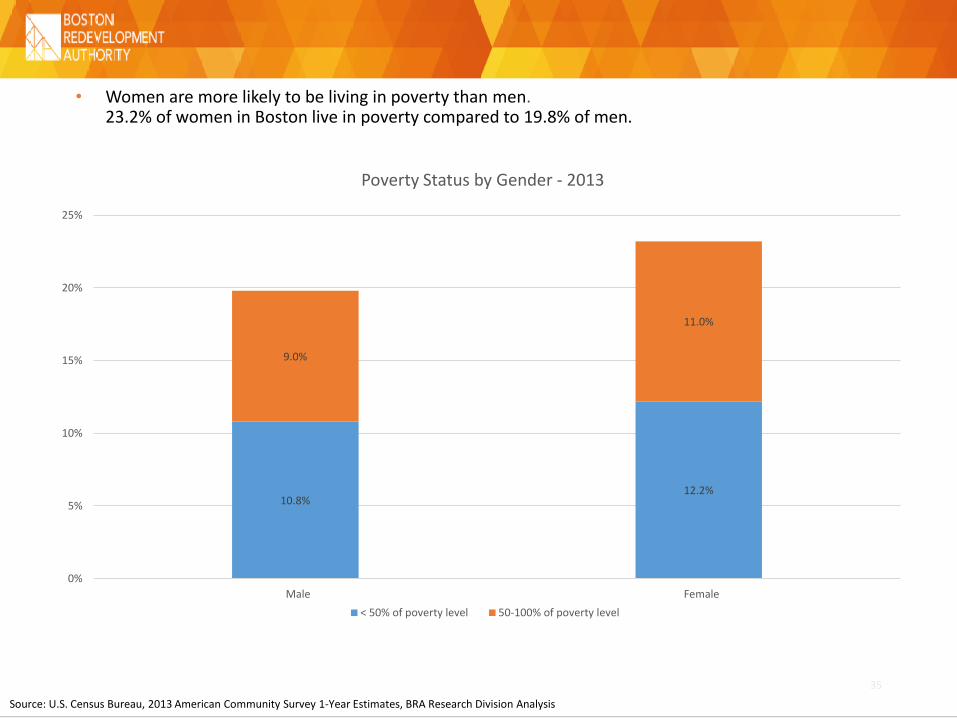
• Women are more likely to be living in poverty than men.23.2% of women in Boston live in poverty compared to 19.8% of men.
10.8%12.2%
9.0%
11.0%
0%
5%
10%
15%
20%
25%
Male Female
Poverty Status by Gender - 2013
< 50% of poverty level 50-100% of poverty level
35
Source: U.S. Census Bureau, 2013 American Community Survey 1-Year Estimates, BRA Research Division Analysis

• Female labor force participants earn less on average than male labor force participants (median of $34,415 vs. $40,771.
36
Source: U.S. Census Bureau, 2013 American Community Survey 1-Year Estimates, BRA Research Division Analysis
15.9%20.7%
17.6%
18.7%
26.2%
28.2%
17.1%
16.7%
8.2%
8.5%15.0%
7.2%
0%
10%
20%
30%
40%
50%
60%
70%
80%
90%
100%
Male Female
Income of Labor Force Participants by Gender - 2013
$0-9,999 $10,000-24,999 $25,000-49,999 $50,000-74,999 $75,000-99,999 $100,000 or more

Source: U.S. Census Bureau, 2013 1-year American Community Survey, 1980 Decennial Census, BRA Research Division Analysis
12.8% 12.8%
53.6%
63.1%
33.6%
24.1%
0%
10%
20%
30%
40%
50%
60%
70%
80%
90%
100%
Male Female
% o
f Fu
ll-Ti
me
Full-
Year
Wo
rker
s
Earnings of Full-Time Workers by Gender, 2013
<$25,000 $25,000 to $74,999 $75,000+
• Even among full-time, full-year workers with earnings, women make less on average then men.• Male full-time workers have median earnings of $53,927 while female full-time workers have median
earnings of $49,718.• However, this gap has narrowed: in 1980 male full-time workers had median earnings of $47,445 (2013
dollars) and female full-time workers only had median earnings of $35,707.
38
Women’s Median Income Compared to Men’sAmong Labor Force Participants Aged 16+
Women's median earnings as a percent of men's within the same
race/ethnicity
Women's median earnings as a percent of White men's earnings
White 87% 87%
Black or African American 104% 55%
Asian 70% 46%
Hispanic 73% 35%
Source: U.S. Census Bureau, 2009-2013 American Community Survey, Public Use Microdata Sample (PUMS), BRA Research Division AnalysisAmerican Association of University Women: http://www.aauw.org/2014/09/18/gender-pay-gap/
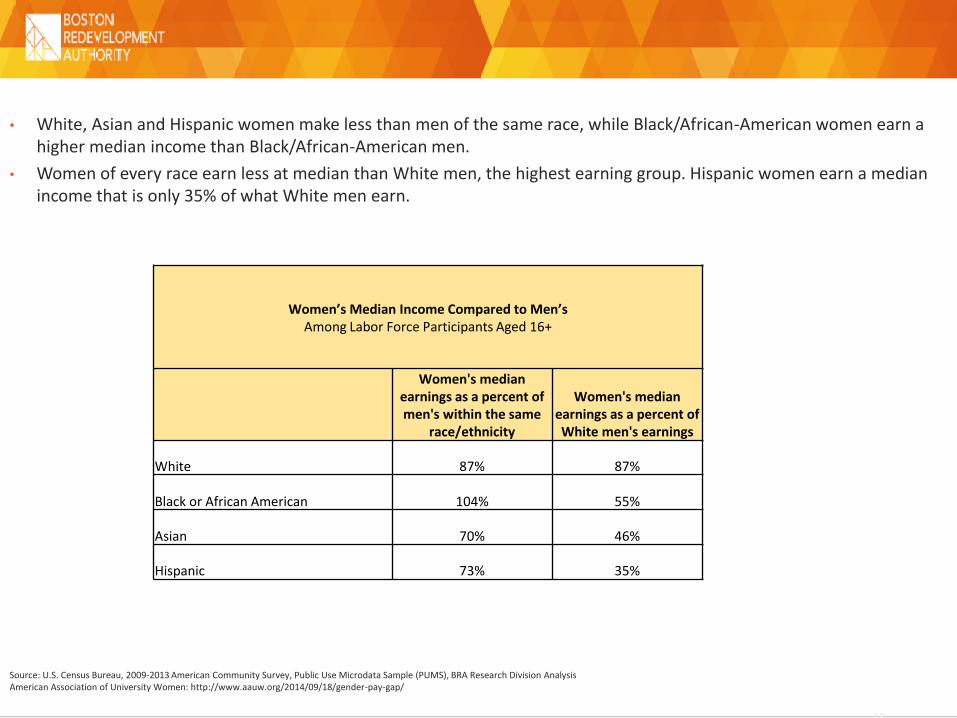
• White, Asian and Hispanic women make less than men of the same race, while Black/African-American women earn a higher median income than Black/African-American men.
• Women of every race earn less at median than White men, the highest earning group. Hispanic women earn a median income that is only 35% of what White men earn.

• Women in Boston earn less than men, even at the same education level, with the gap between men and women largest among those with the most education.
$20,000
$28,400
$34,300
$61,000
$15,000
$23,000
$30,000
$50,000
$0
$10,000
$20,000
$30,000
$40,000
$50,000
$60,000
$70,000
Less than high school High school Some college or Associate's degree Bachelor's degree or higher
Median Income by Education Level and Gender, Labor Force Participants, Age 25+, 2013
Male Female
Source: U.S. Census Bureau, 2009-2013 American Community Survey, Public Use Microdata Sample (PUMS), BRA Research Division Analysis

40
U.S. Census Bureau, 2013 American Community Survey, IPUMS, BRA Research Division Analysis
40.3%
20.2%
44.7%40.9%
13.0%
15.2%
12.3% 18.0%
20.1%
20.4%
18.7%22.4%
12.0%
15.6%
12.7%
10.4%5.8%
10.0%
6.1%4.8%8.7%
18.6%
5.5% 3.4%
0%
10%
20%
30%
40%
50%
60%
70%
80%
90%
100%
Male without Children Male with Children Female without Children Female with Children
Income by Gender and Presence of Own Children, 16 to 64
Less than $10,000 $10,000 to $24,999 $25,000 to $49,999 $50,000 to $74,999 $75,000 to $99,999 $100,000+
• Men without children at home have a slightly higher median income ($46,588) than women without children ($42,760).
• Men with children at home have a much higher median income ($58,904) than women with children ($41,255).
• Twice as many female than male Boston residents have children at home, due to a large number of single mothers.

Source: U.S. Census Bureau, 2013 American Community Survey, IPUMS, BRA Research Division Analysis
• 63.8% of men with children living at home have full-time, full-year employment and only 10.6% are not in the labor force.
• In contrast, only 43.9% of women with children living at home work full-time, full-year outside the home and 24.2% are not in the labor force.
45.4%
63.7%
41.6% 43.9%
27.7%
22.8%
28.7% 26.5%
3.4%
2.8%
2.5% 5.4%
23.5%
10.6%
27.2% 24.2%
0.0%
10.0%
20.0%
30.0%
40.0%
50.0%
60.0%
70.0%
80.0%
90.0%
100.0%
Male without Children Male with Children Female without Children Female with Children
Work Schedule by Gender and Presence of Own Children, Ages 16 to 64
Full Time, Full Year Part Time or Part Year Unemployed Not in Labor Force
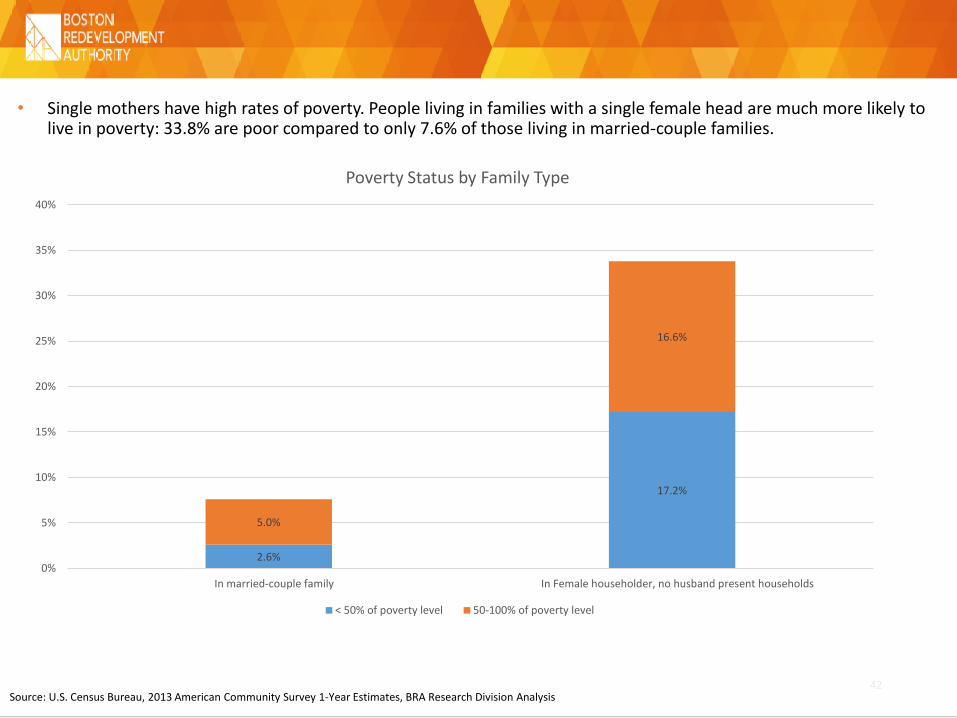
• Single mothers have high rates of poverty. People living in families with a single female head are much more likely to live in poverty: 33.8% are poor compared to only 7.6% of those living in married-couple families.
2.6%
17.2%
5.0%
16.6%
0%
5%
10%
15%
20%
25%
30%
35%
40%
In married-couple family In Female householder, no husband present households
Poverty Status by Family Type
< 50% of poverty level 50-100% of poverty level
42Source: U.S. Census Bureau, 2013 American Community Survey 1-Year Estimates, BRA Research Division Analysis

• Married people have the lowest rates of poverty – only 8.6% are poor.
8.6%
23.6% 23.1%
35.1%
25.1%
0%
5%
10%
15%
20%
25%
30%
35%
40%
Married Widowed Divorced Separated Never married
% o
f P
op
ula
tio
n a
ge 1
5+
that
is in
Po
vert
y
Poverty Status by Marital Status - Boston 2013
43Source: U.S. Census Bureau, 2013 American Community Survey 1-Year Estimates, BRA Research Division Analysis
AGE

45Source: U.S. Census Bureau, 2009-2013 American Community Survey, Public-use Microdata Sample, BRA Research Division Analysis
• Poverty rates are highest among children.
• Young adults age 18-24 living in poverty include large numbers of students.
26.4%
33.0%
29.0% 29.5%
40.6%
14.6%15.5% 15.9%
17.1%
19.5%
0%
5%
10%
15%
20%
25%
30%
35%
40%
45%
Under 6 6 to 10 11 and 12 13 to 17 18 to 24 25 to 34 35 to 44 45 to 54 55 to 64 65 and above
Poverty Rates by Age

46Source: U.S. Census Bureau, 2009-2013 American Community Survey, Public-use Microdata Sample, BRA Research Division Analysis
52.2%
10.2% 11.4% 11.0% 10.4%4.7%
26.2%
16.7% 18.2% 18.1% 17.7%17.9%
17.1%
32.9% 27.0% 27.8% 29.1%30.3%
3.9%
22.4%17.6% 17.2% 19.0%
16.6%
8.6%
10.2% 10.3% 9.5%
9.8%
9.1%15.5% 15.7% 14.2%
20.7%
0%
10%
20%
30%
40%
50%
60%
70%
80%
90%
100%
18-24 25-34 35-44 45-54 55-64 65+
Income by Age: Labor Force Participants
$0-9,999 $10,000-24,999 $25,000-49,999 $50,000-74,999 $75,000-99,999 $100,000+
• Labor force participants age 18-24 tend to have low income (median: $9,584), likely due to part-time work and entry-level jobs.
47Source: U.S. Census Bureau, 2009-2013 American Community Survey, Public-use Microdata Sample, BRA Research Division Analysis
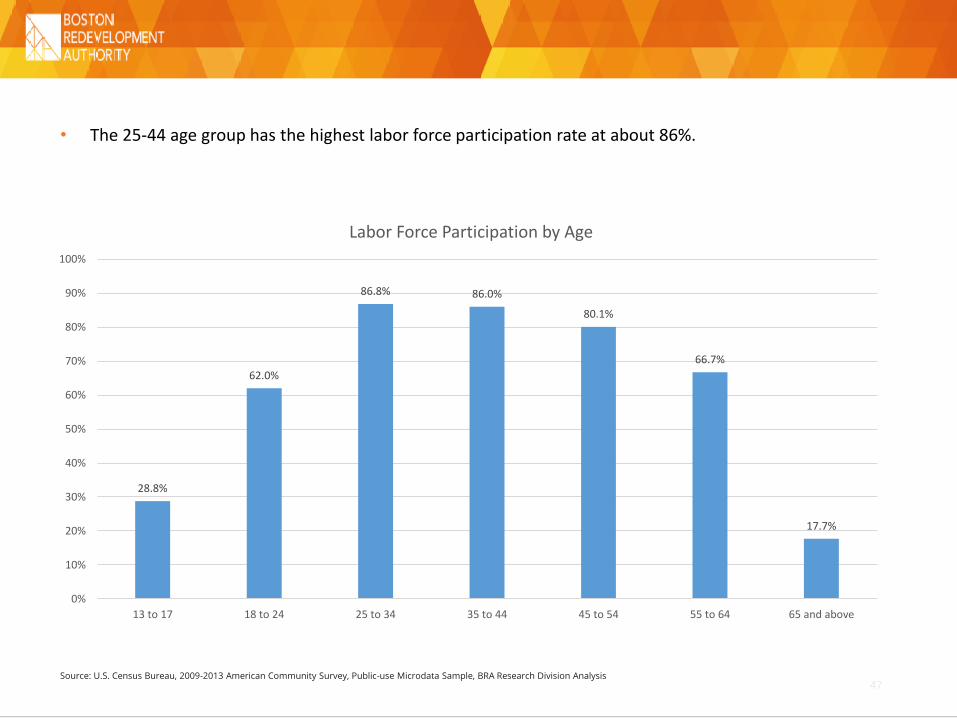
• The 25-44 age group has the highest labor force participation rate at about 86%.
28.8%
62.0%
86.8% 86.0%
80.1%
66.7%
17.7%
0%
10%
20%
30%
40%
50%
60%
70%
80%
90%
100%
13 to 17 18 to 24 25 to 34 35 to 44 45 to 54 55 to 64 65 and above
Labor Force Participation by Age

48
Dorchester31%
Roxbury20%
East Boston7%
South Boston7%
Jamaica Plain6%
Mattapan6%
Charlestown5%
South End4%
Roslindale3%
Hyde Park3%
Other Neighborhoods
8%
Boston's Children in Poverty by Neighborhood
Source: U.S. Census Bureau, 2009-2013 American Community Survey, BRA Research Division Analysis
Neighborhood % of Children in Poverty # of Children in Poverty
Roxbury 50% 5882
South Boston 44% 2120
Mission Hill 43% 808
Charlestown 42% 1291
Fenway 41% 207
Dorchester 32% 9311
Jamaica Plain 31% 1866
Mattapan 31% 1672
South End 29% 1258
BOSTON 29% 29820
Allston 27% 200
East Boston 25% 2150
Brighton 19% 762
Roslindale 17% 956
Hyde Park 11% 906
South Boston Waterfront 10% 9
Downtown 5% 50
West Roxbury 5% 330
Back Bay 4% 42
Beacon Hill ** **
Longwood ** **
North End ** **
West End ** **
49Source: U.S. Census Bureau, 2013 American Community Survey 1-Year Estimates, BRA Research Division Analysis
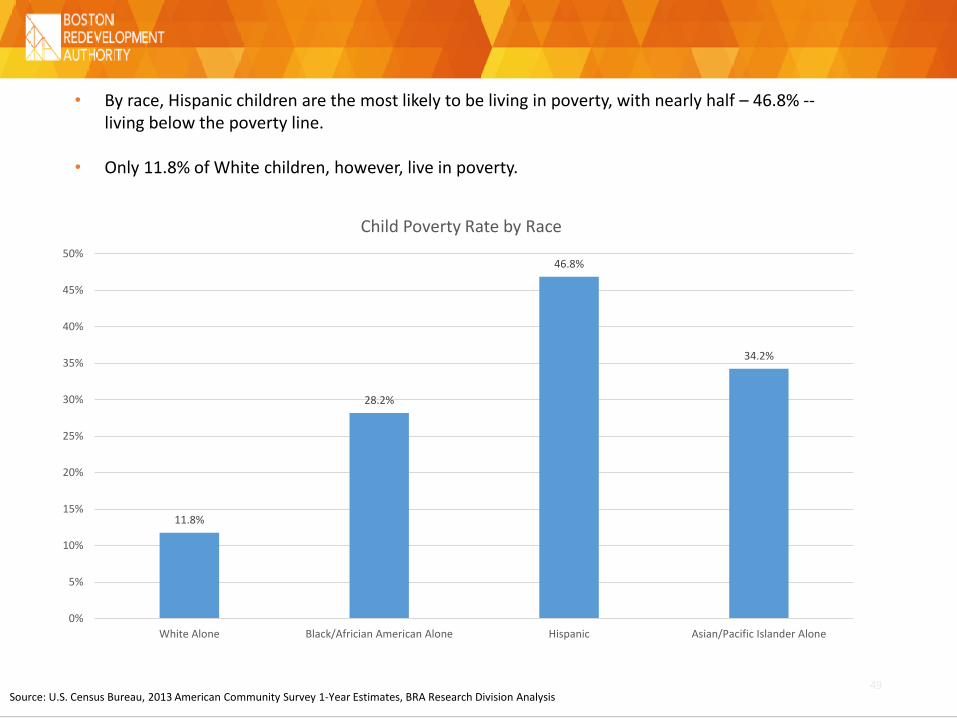
• By race, Hispanic children are the most likely to be living in poverty, with nearly half – 46.8% --living below the poverty line.
• Only 11.8% of White children, however, live in poverty.
11.8%
28.2%
46.8%
34.2%
0%
5%
10%
15%
20%
25%
30%
35%
40%
45%
50%
White Alone Black/Africian American Alone Hispanic Asian/Pacific Islander Alone
Child Poverty Rate by Race
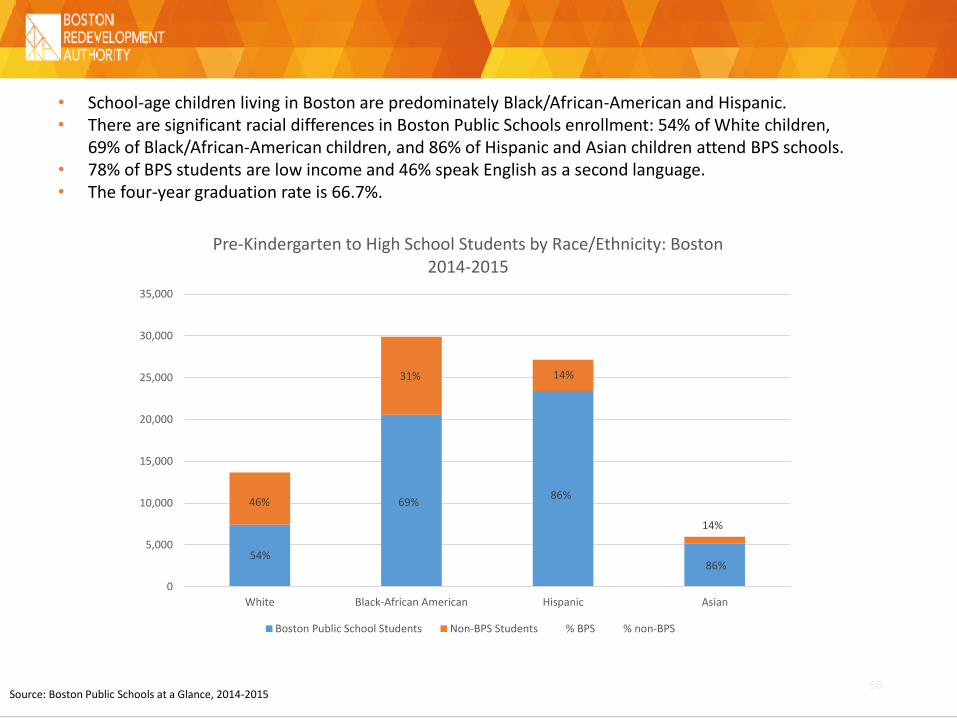
50Source: Boston Public Schools at a Glance, 2014-2015
• School-age children living in Boston are predominately Black/African-American and Hispanic. • There are significant racial differences in Boston Public Schools enrollment: 54% of White children,
69% of Black/African-American children, and 86% of Hispanic and Asian children attend BPS schools.• 78% of BPS students are low income and 46% speak English as a second language.• The four-year graduation rate is 66.7%.
54%
69%86%
86%
46%
31% 14%
14%
0
5,000
10,000
15,000
20,000
25,000
30,000
35,000
White Black-African American Hispanic Asian
Pre-Kindergarten to High School Students by Race/Ethnicity: Boston 2014-2015
Boston Public School Students Non-BPS Students % BPS % non-BPS

NATIVITY AND LANGUAGE

52Source: U.S. Census Bureau, 2013 American Community Survey 1-Year Estimates, BRA Research Division Analysis
• Foreign-born residents are more likely to live in poverty.
• Among children, however, the nativity of parents does not have a big impact on the poverty status of Boston children: • 29% of children with only native-born parent(s) are poor• 30.3% of children with at least one foreign-born parent are poor
20.2%
25.1%
0%
5%
10%
15%
20%
25%
30%
Native Foreign born
Poverty Status by Nativity - 2013
In Poverty

• Median personal income for native born labor force participants is $41,961, while for the foreign-born it is only $21,179.
53
18% 19%
15%
26%
25%
32%
19%
12%10%
5%13%
6%
0%
10%
20%
30%
40%
50%
60%
70%
80%
90%
100%
Native Foreign-born
% o
f La
bo
r Fo
rce
Par
tici
pan
ts
Personal Income Distribution by Nativity - Boston 2013
Less than $10,000 $10,000-$24,999 $25,000-$49,999 $50,000-$74,999 $75,000-$99,999 $100,000 and more
Source: U.S. Census Bureau, 2009-2013 American Community Survey, Public-use Microdata Sample (PUMS), BRA Research Division Analysis

54
15%24% 21%
27%
49%36%
22%20%
35%
28%
42%
25%
9%8%
15%
3%5%
6%
2%8%
0%
10%
20%
30%
40%
50%
60%
70%
80%
90%
100%
Not at all Not well Well Very well
% a
t ea
ch le
vel o
f p
erso
nal
inco
me
English Proficiency of Labor Force Participants who speak a language other than English at home
Income by English Proficiency of Labor Force Participants - 2013
Less than $10,000 $10,000-$24,999 $25,000-$49,999 $50,000-$74,999 $75,000-$99,999 $100,000 and more
Source: U.S. Census Bureau, 2009-2013 American Community Survey, Public-use Microdata Sample (PUMS), BRA Research Division Analysis
• Among labor force participants who speak a language other than English at home, English proficiency impacts personal income.
• Workers who do not speak English at all are mostly low-income: 64% make less than $25,000/year.• Some workers who speak English very well also have low incomes, perhaps due to part-time employment while
attending school.• However, access to high-paying jobs is limited to those who speak English well or very well.

55
Source: U.S. Census Bureau, 2009-2013 American Community Survey, Public Use Microdata Sample (PUMS), BRA Research Division AnalysisNote: Linguistically-isolated households have no one over age 14 who can speak English well.
• Linguistically-isolated households in which no one over age 14 can speak English well have high rates of poverty: 45.2%.
18.6%
45.2%
0%
5%
10%
15%
20%
25%
30%
35%
40%
45%
50%
Not linguistically isolated Linguistically isolated
Poverty Status of Linguistically Isolated Households - 2013
In Poverty

EDUCATION
57
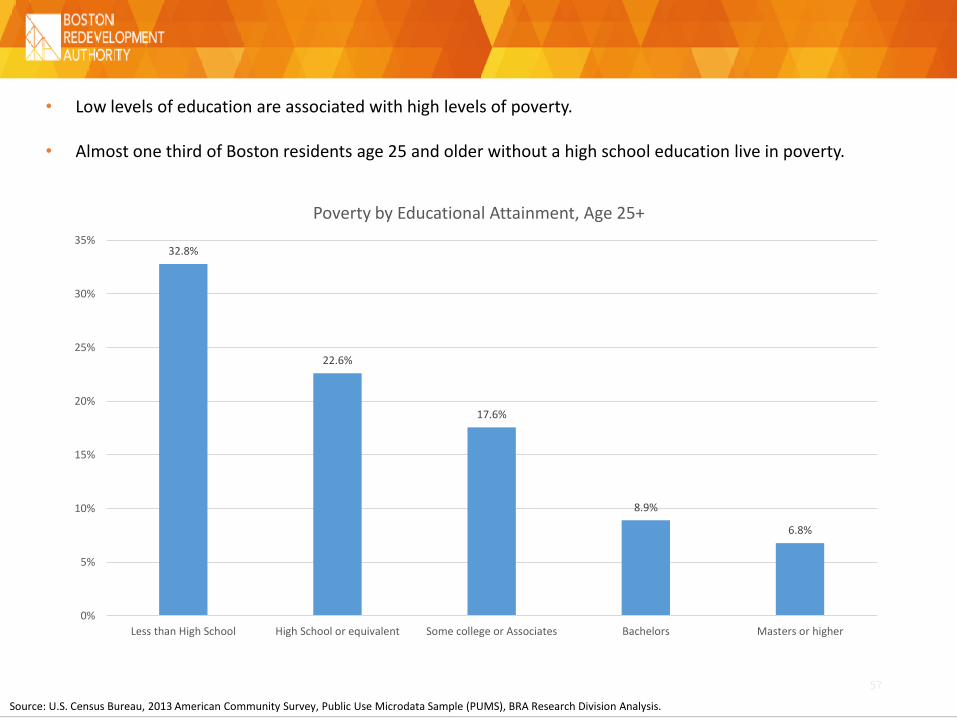
Source: U.S. Census Bureau, 2013 American Community Survey, Public Use Microdata Sample (PUMS), BRA Research Division Analysis.
32.8%
22.6%
17.6%
8.9%
6.8%
0%
5%
10%
15%
20%
25%
30%
35%
Less than High School High School or equivalent Some college or Associates Bachelors Masters or higher
Poverty by Educational Attainment, Age 25+
• Low levels of education are associated with high levels of poverty.
• Almost one third of Boston residents age 25 and older without a high school education live in poverty.

20.3% 17.1%11.4%
4.5% 4.2%
37.4%
24.3%
22.0%
9.1% 8.0%
33.4%
35.1%
39.9%
26.7%
21.2%
6.0%
15.0% 18.4%
26.5%
21.5%
0.4%6.2% 5.4%
14.8%
15.4%
2.6% 2.3% 2.8%
18.4%
29.7%
0%
10%
20%
30%
40%
50%
60%
70%
80%
90%
100%
Less than High School High School or equivalent Some college or Associates Bachelors Masters or higher
Income by Educational Attainment, Labor Force Participants, age 25+
<$9,999 $10,000-$24,999 $25,000-$49,999 $50,000-$74,999 $75,000-$99,999 >$100,000
Source: U.S. Census Bureau, 2013 American Community Survey, Public Use Microdata Sample (PUMS), BRA Research Division Analysis.
• Higher education is associated with higher incomes.
• 58% of the Boston resident labor force over age 25 without a high school education makes less than $25,000 a year.
• In contrast, 30% of the Boston resident labor force with a Master’s degree or higher makes more than $100,000 a year.

Top 5 Industries of Employment
Industry Count Percent
Accommodation and Food Services 6,480 21.1%
Health Care and Social Assistance 4,155 13.5%
Administrative Support and Waste Management 3,655 11.9%
Retail Trade 2,685 8.7%
Construction 2,283 7.4%
Source: U.S. Census Bureau, 2009-2013 American Community Survey, BRA Research Division AnalysisSample includes Boston resident civilian (non-military) labor force participants, ages 16+Part-time work is defined as less than 35 hours per week.
LESS THAN HIGH SCHOOL – 8% of the Boston Resident Labor Force
59
• Workers with low levels of education are more likely to work part-time or be unemployed. 55.1% of workers with less than a high school degree either worked part time, worked part year, or were unemployed.
• They are also more likely to work in low-paying industries such as accommodation and food services.
-
2,000
4,000
6,000
8,000
10,000
12,000
Less than $10,000 $10,000 to$24,999
$25,000 to$49,999
$50,000 to$74,999
$75,000 to$100,000
$100,000 or more
Nu
mb
er o
f W
ork
ers
Income by Usual Work Schedule
Full Time, Full Year Part Time or Part Year Unemployed
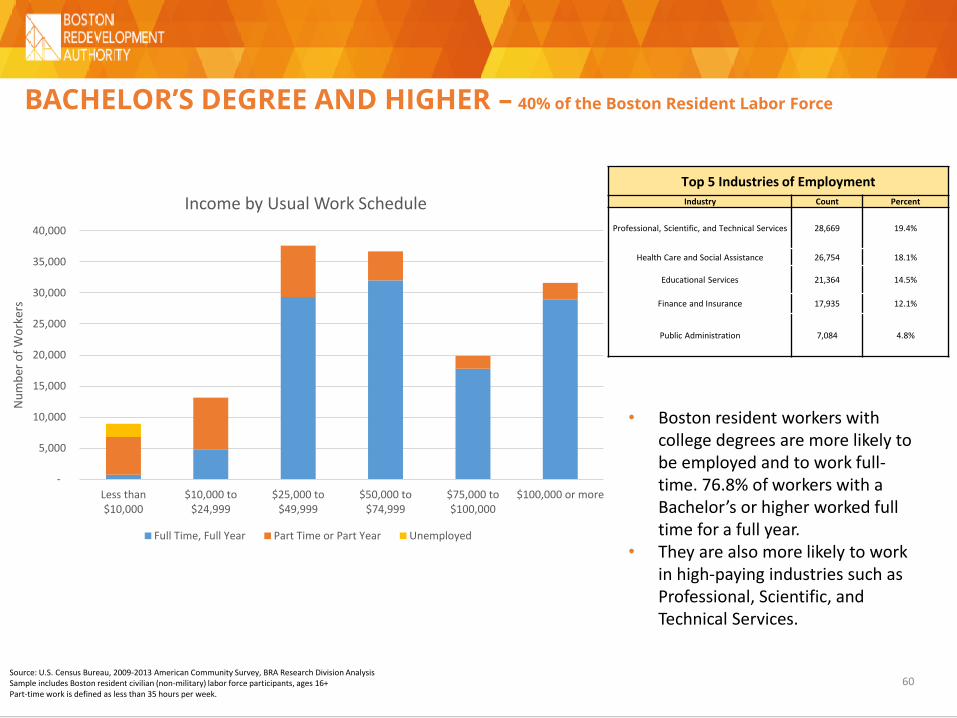
Top 5 Industries of EmploymentIndustry Count Percent
Professional, Scientific, and Technical Services 28,669 19.4%
Health Care and Social Assistance 26,754 18.1%
Educational Services 21,364 14.5%
Finance and Insurance 17,935 12.1%
Public Administration 7,084 4.8%
BACHELOR’S DEGREE AND HIGHER – 40% of the Boston Resident Labor Force
60Source: U.S. Census Bureau, 2009-2013 American Community Survey, BRA Research Division AnalysisSample includes Boston resident civilian (non-military) labor force participants, ages 16+Part-time work is defined as less than 35 hours per week.
• Boston resident workers with college degrees are more likely to be employed and to work full-time. 76.8% of workers with a Bachelor’s or higher worked full time for a full year.
• They are also more likely to work in high-paying industries such as Professional, Scientific, and Technical Services.
-
5,000
10,000
15,000
20,000
25,000
30,000
35,000
40,000
Less than$10,000
$10,000 to$24,999
$25,000 to$49,999
$50,000 to$74,999
$75,000 to$100,000
$100,000 or more
Nu
mb
er o
f W
ork
ers
Income by Usual Work Schedule
Full Time, Full Year Part Time or Part Year Unemployed